Sumo Logic ahead of the pack
Read article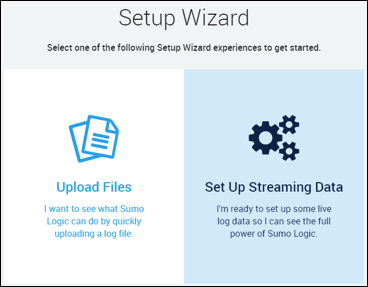

Complete visibility for DevSecOps
Reduce downtime and move from reactive to proactive monitoring.
Our approach resulted in a doubling of our log ingestion at an ingest cost increase of only 10%, saving us around $1 million.”
Iwan Eising
Team Lead of Service Reliability Architecture
BY OBSERVABILITY USE CASE
BY SECURITY USE CASE
BY INITIATIVE
BY COMPETITION
October 11, 2017
The Apache HTTP Server has been a dominant web server since it burst onto the scene in the mid-1990s. If you’re reading this article, you probably already use Apache, and are familiar with its features and functionality. Users of Apache and any technology should also be aware of the importance of monitoring application logs to ensure that they are running optimally, and of using them to identify problems before they cause problems for the consumers of a site. This is where what I call Apache log “analysis analytics” (no, that’s not a typo) come in.
As I explain in this article, log analysis analytics provide the visibility into your Apache server instances that allow you to maintain uptime and optimize performance. Specifically, I briefly discuss the importance of log collection and aggregation, then examine Sumo Logic as a service to collect and analyze Apache error logs. We’ll also explore some of the customization and options available. If you’d like a deep dive into Apache Log formats including access logs and error log analysis, check out our Apache Log wiki.
Log analysis analytics sounds a lot like a tongue twister you’d ask someone to say three times fast. When we talk about it, we’re talking about applying analytics tools to aid in the analysis of aggregated log data.
As Apache processes requests and sends responses back to its clients, it logs details about the transactions to a local file on the server. If you have access to the machine hosting the Apache instance, you could log in, open up the logs and search through for specific IDs, errors or other indications of activity that require attention. That can be a daunting task on a single server, and if you’re responsible for multiple web servers, the problem grows exponentially.
A log collection service like Sumo Logic simplifies the process by extracting the logs from each machine, aggregating them, and providing tools to view, analyze and report on them. If you’re a professional supporting your organization’s web presence, such a service becomes an absolute necessity.
The Sumo Logic Collector is the lightweight software utility installed on each of your servers. This service collects the log data from the local machine and handles the process of exporting the data to Sumo Logic for analysis. There are a couple of different ways you can accomplish this same process. You can learn about other options in the Sumo Logic documentation for Apache Log Collection.
To demonstrate this process, I launched a new AWS Linux instance into my preferred AWS region. After accessing the instance, I installed the LAMP stack and installed the latest version of WordPress. I then logged into my Sumo Logic account, clicked on the Manage Data option on the left-hand navigation panel, and then selected Collection.
The quickest way to get the collector installed and configured is to use the Setup Wizard. A link to begin this process should be visible on the top right-hand side of the screen if you followed my same steps after logging in.
If you want to explore what Sumo Logic has to offer, on the first page of the Setup Wizard, you have the option to Upload Files directly into Sumo Logic. For our example, we’re going to set up a streaming data source, so that as logs are appended on our web server machine, they’ll automatically be sent to Sumo Logic. If you’d like to follow along, log into your Sumo Logic account. Don’t have an account? Not a problem. Signup for the Free Trial takes only a moment, no credit card required.
Place your mouse over the Set Up Streaming Data option and click on Getting Started.
Fig. 1 Selecting the Type of Data Collection You Want to Perform
The next step is to select the Data Type for the Collector. Locate and click on the Apache option.
Fig 2. The Apache Collector
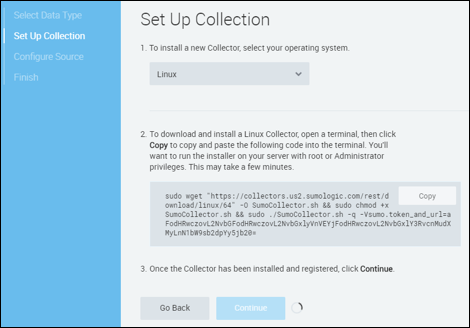
On the subsequent screen, you’ll need to select the operating system you’re using. I chose Linux, and you’ll then be presented a fully configured command which will download, install and configure the Collector on your target machine in a single process.
Fig 3. Generate the Command to Download, Install and Configure the Collector
Once the command has been executed and the collector installed, the spinning icon at the bottom of the wizard will vanish, and you’ll be able to click on the Continue button.
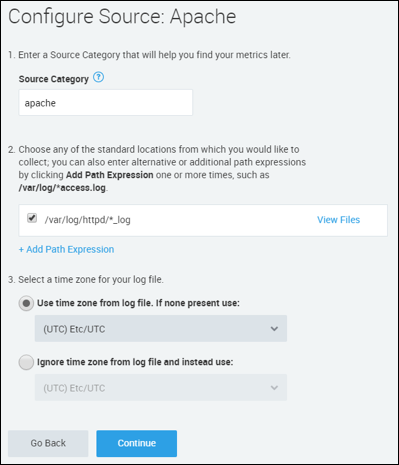
The final step involves validating the location of the log files and a few other configuration options. Most of this will be populated for you, although it may take a minute or two to do so.
Fig 4. Final Configuration of the Collector
Once you click on Continue, the service will import the existing logs, index them, and before you know it, you’ll be ready to start searching and analyzing your logs.
Click on Start Searching My Logs. You’ll be taken to an overview page with some initial data widgets showing data such as Visitor Locations, Traffic Distribution, and detail of traffic received.
You can click on any of the widgets to further deep dive into the data displayed. There are countless options for additional analysis, and for building custom dashboards and data widgets, plus the option to set up alerts and automate processes so that Sumo Logic can do the heavy lifting of log analysis, and you can spend your time developing and improving your website.
For more information on working with Apache logs in Sumo Logic, visit the highly informative Sumo Logic DocHub.
Reduce downtime and move from reactive to proactive monitoring.
Build, run, and secure modern applications and cloud infrastructures.
Start free trial
Mike Mackrory is a Global citizen who has settled down in the Pacific Northwest — for now. By day he works as a Lead Engineer on a DevOps team, and by night, he writes and tinkers with other technology projects. When he's not tapping on the keys, he can be found hiking, fishing and exploring both the urban and rural landscape with his kids. Always happy to help out another developer, he has a definite preference for helping those who bring gifts of gourmet donuts, craft beer and/or single-malt Scotch.
More posts by Mike Mackrory.

No credit card required. Up and running in minutes.
More than 2,100 enterprises around the world rely on Sumo Logic to build, run, and secure their modern applications and cloud infrastructures.