We are excited about one of our newest features, Interactive Dashboards. Interactive Dashboards is the second major release of a longer term project for changing the way Sumo Logic dashboards work. Based on the feedback from you, our users, we are working to make our dashboarding technology more flexible and easier to use. In this blog article we’ll discuss how the new dashboards work, and how they can help you get more out of your data.
What are Interactive Dashboards?
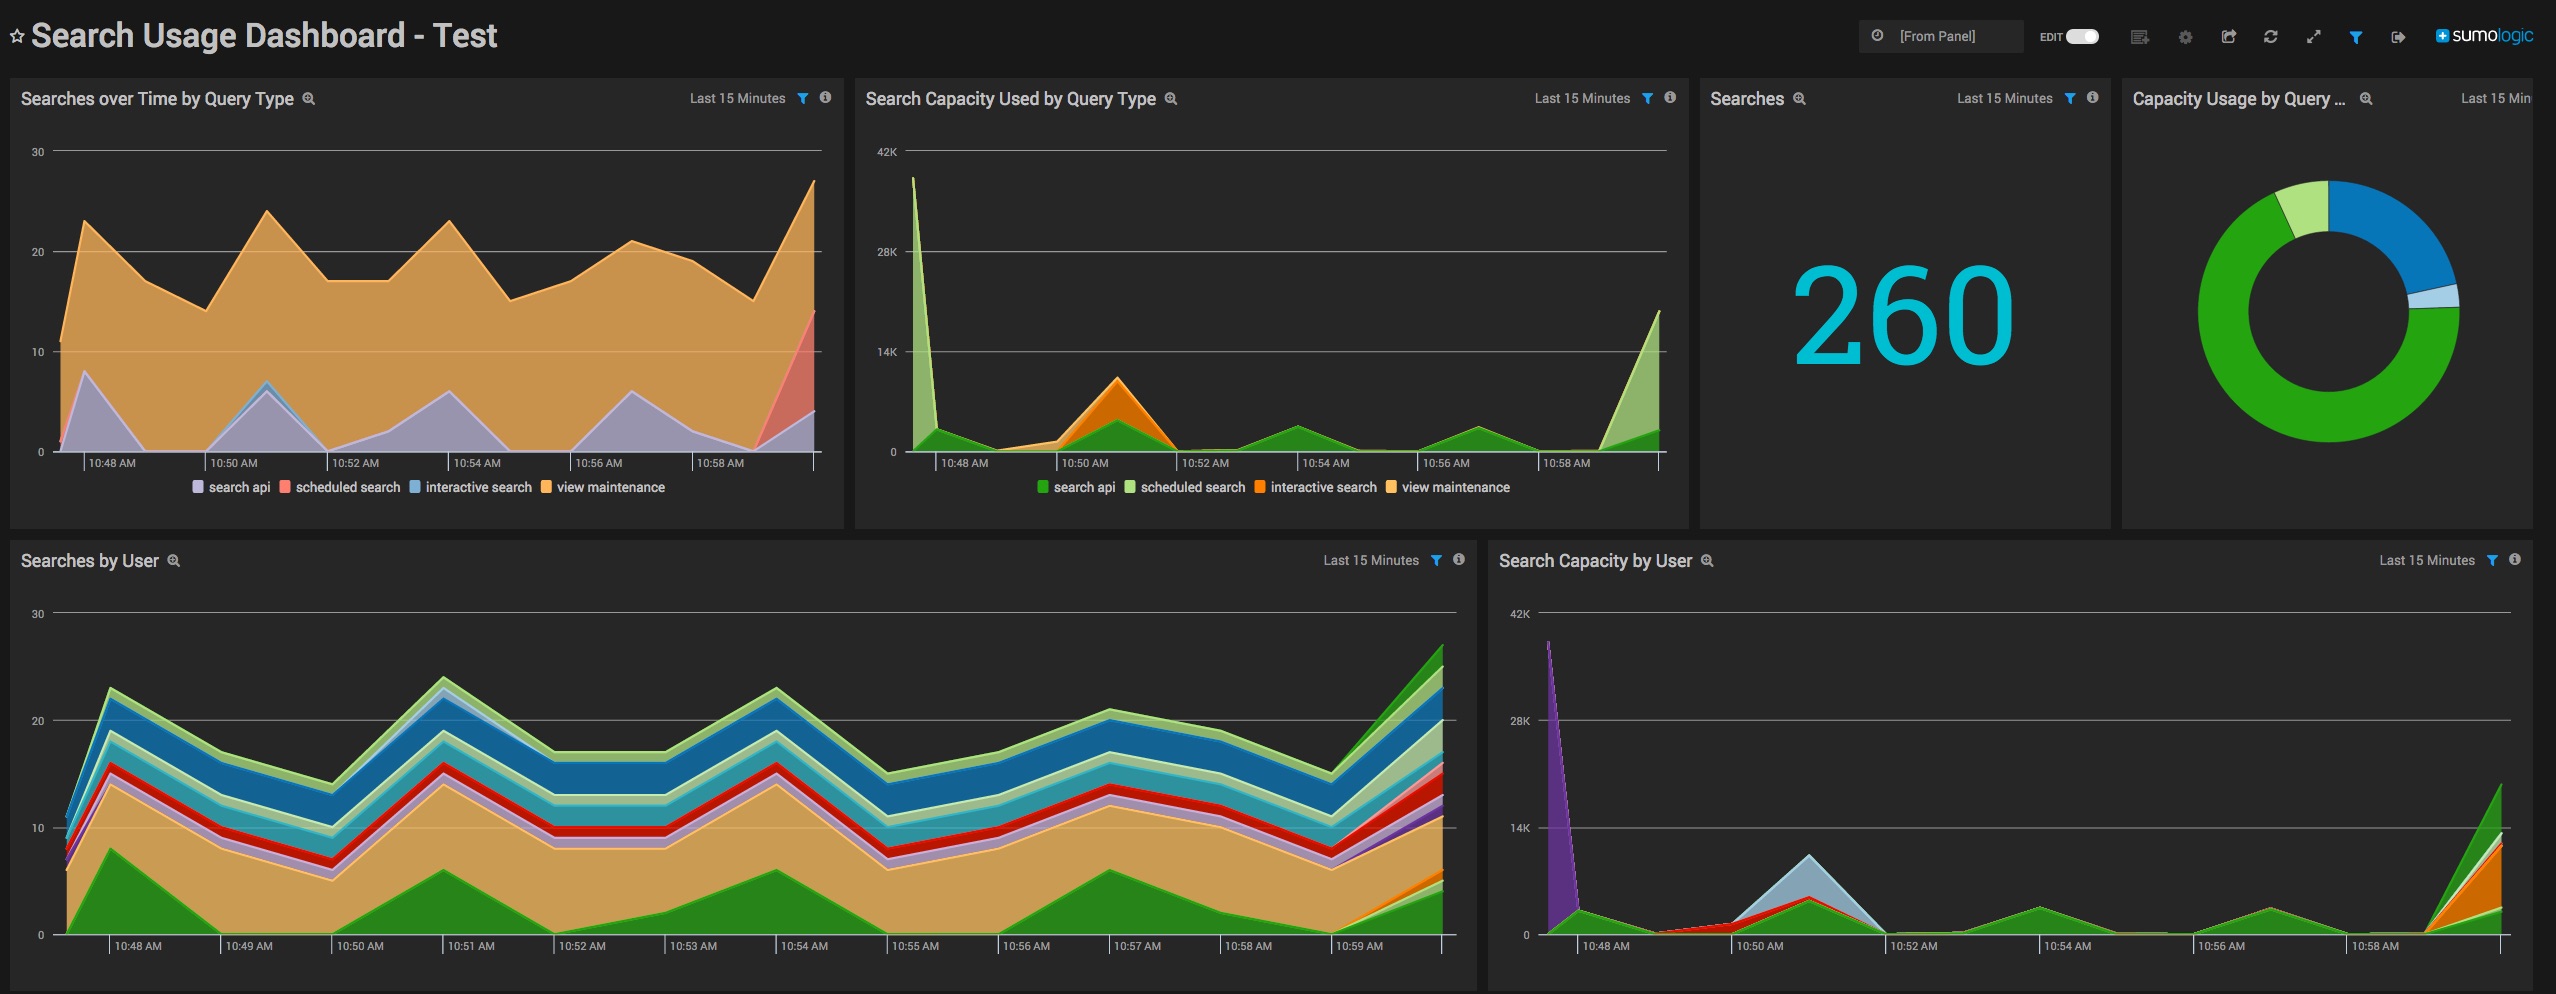
Interactive Dashboards are built on the power of our search engine. That means powerful analytics with lots of flexibility. It also means that you can look at historical data immediately, explore the data more easily, and make changes to your dashboards without worrying about delays. So, let’s talk details.
Interactive Dashboards help you Explore your data
There are really three major challenges that we have tried to solve with this technology – making it easier to look at the data, opening up historical exploration of data, and navigating data with simple to use filters.
Free Users from the Query Language
Many of Sumo Logic users cringe when they see the search window, and that’s ok. Their use of Sumo Logic shouldn’t require knowing the intricacies of parsing or any familiarity with regex. Interactive Dashboards helps those users. Now subject matter experts can use their experience to build great dashboards, and point novice users at those dashboards. No need to know the queries. No need to understand the underlying logs.
Consider your history
One major request from our customers has been to use dashboards to look at things that happened last night, last week, or a month ago. Now users can apply any date range to an Interactive dashboard (within your data retention period, of course), and see the data. For example, let’s say you want to compare last weeks user visits to this weeks. No problem. Look at a web server issue last Tuesday. No problem. Any user viewing an Interactive Dashboard can set the time range on individual panels or reset the whole dashboard.
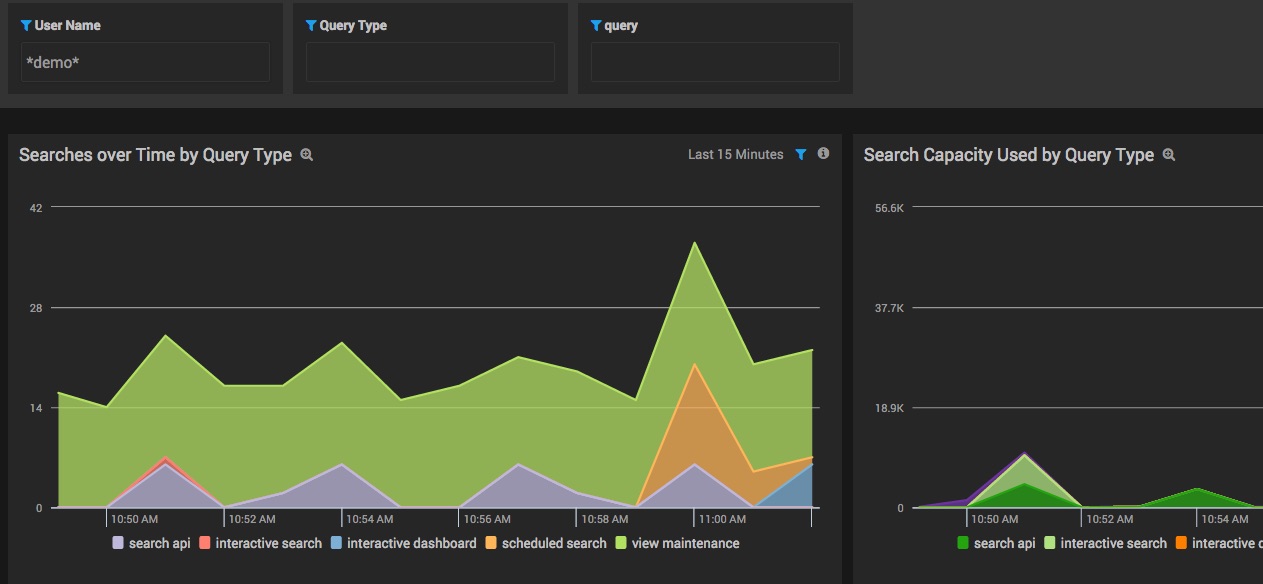
Reduce the Noise
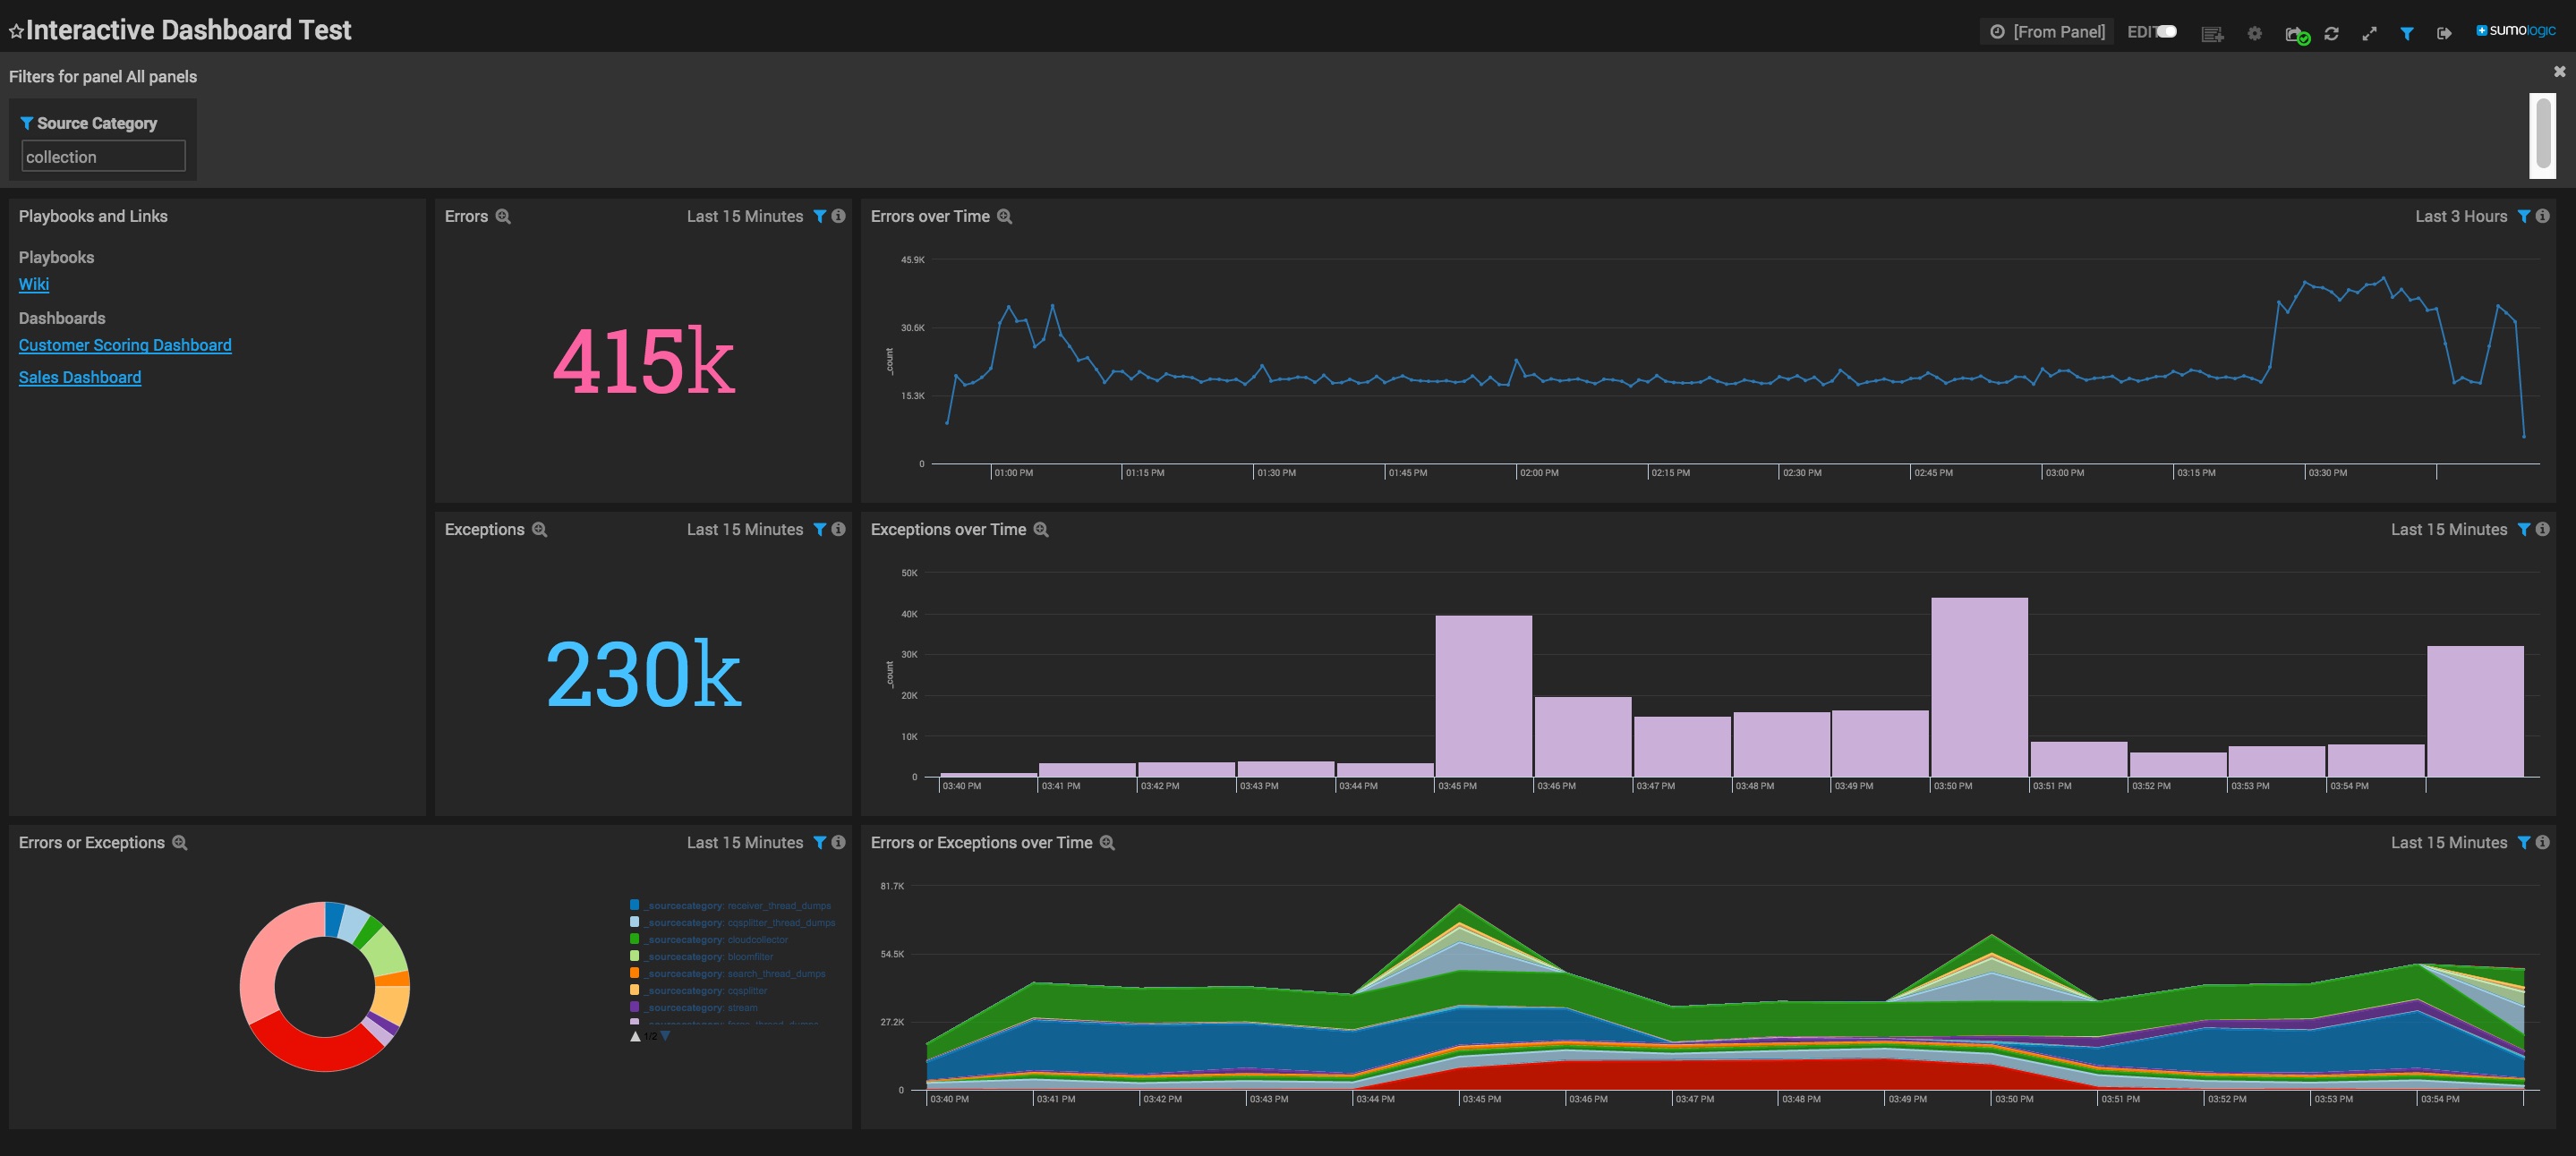
One of the most requested features for dashboards has been filters. Now you can filter on any field in your data, whether you pulled that field out in the query itself, or it was pulled out on ingest. So, why does it matter? Now you can create dashboards and give your colleagues a way to easily navigate the data. For example, maybe let’s say you are creating a dashboard to look at web statistics. The problem is that you have 10 web sites with at a few apps on each of them. With Interactive Dashboards you can create a more generic dashboard with a filter for web site and another for app. Now you get a global view, plus any user can dig into the data without understanding anything about the structure of the data or complexity of your queries!
Worried about Unauthorized Access to Data – Worry no more
One of the problems with streaming dashboards is that by their nature there is one stream – and that stream has to be based on some user’s view. So, with our traditional dashboards, if you shared a dashboard, you shared the data. Now, with Interactive Dashboards, that is no longer the case. The new dashboards take any access controls you have setup into account. For example, if you have shared a security dashboard that has sensitive data, users in Roles that cannot see that sensitive data will not see it in the dashboards either.
In conclusion, as I mentioned above, Interactive Dashboards is only one of many steps we will be taking to making our dashboards more powerful and useful for you. As you try out Interactive Dashboards, we look forward to your comments and feedback.

