Sumo Logic ahead of the pack
Read articleComplete visibility for DevSecOps
Reduce downtime and move from reactive to proactive monitoring.
Our approach resulted in a doubling of our log ingestion at an ingest cost increase of only 10%, saving us around $1 million.”
Iwan Eising
Team Lead of Service Reliability Architecture
BY OBSERVABILITY USE CASE
BY SECURITY USE CASE
BY INITIATIVE
BY COMPETITION
December 1, 2016
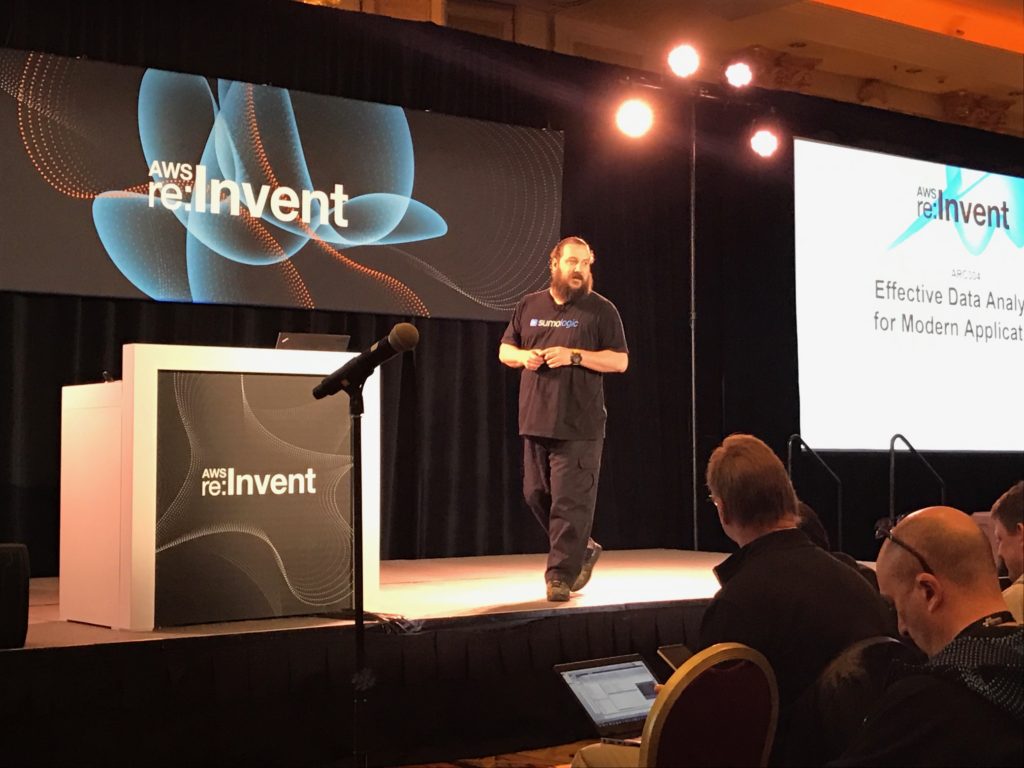
Yesterday at AWS re:Invent 2016, Sumo Logic Co-Founder and CTO Christian Beedgen presented his vision for machine data analytics in a world where modern apps are disrupting virtually every vertical market in business. Every business is a software business, Marc Andreessen wrote more than five years ago. Today, driven by customer demand, the need to differentiate and the push for agility, digital transformation initiatives are disrupting every industry.
“We are still at very the beginning of this wave of Digital Transformation,” Christian said. “By 2020 half of all businesses will have figured out digitally enhanced products and services.”
The result is that modern apps are being architected differently than they were just 3 years ago. Cloud applications are being built on microservices by DevOps teams that automate to deliver new functionality faster. “It used to be that you could take the architecture and put it on a piece of paper with a couple of boxes and a couple of arrows. Our application architecture was really clean.”
But with this speed and agility comes complexity, and the need for visibility has become paramount. “Today our applications look like spaghetti. Building microservices, wiring them up, integrating them so they can work with something else, foundational services, SQL databases, NoSQL databases…”
You need to be able to see what’s going on, because you can’t fix what you cannot see. Modern apps require Continuous Intelligence to provide insights, continuously and in real-time, across the entire application lifecycle.
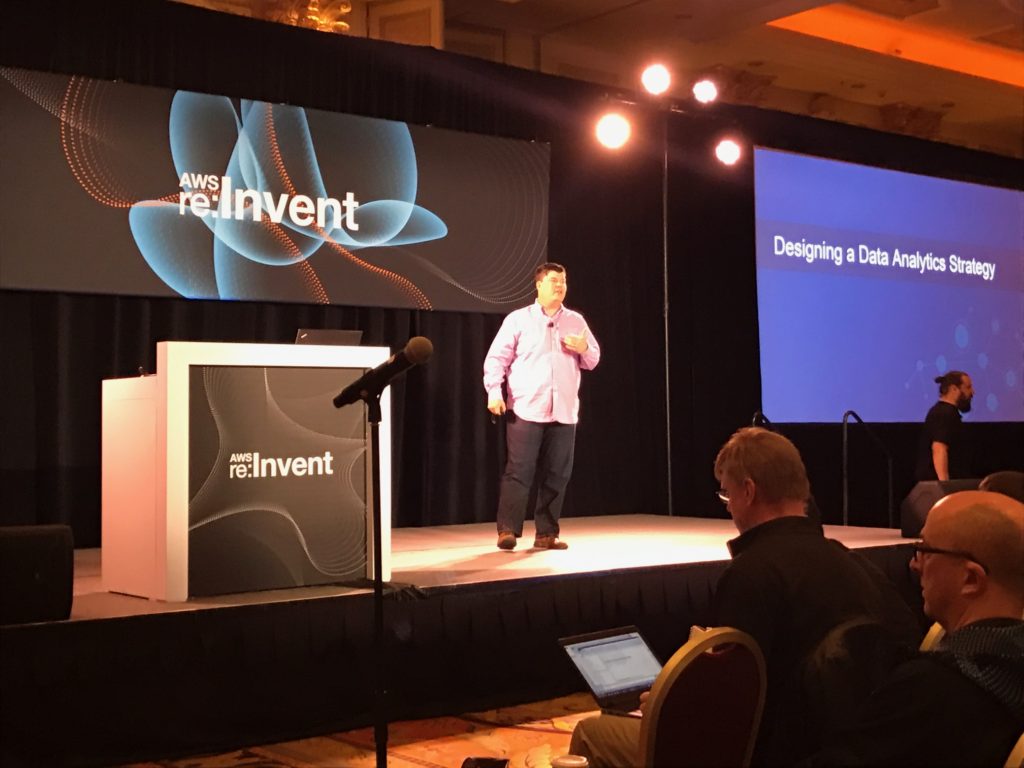
Ben Newton, Sumo Logic’s Principal Product Manager of the Metrics team, took the stage to look at the various types of data and what you can do with them. Designing a data analytics strategy begins by understanding the data types that are produced by machine data, then focusing on the activities that data supports. The primary activities are Monitoring where you detect and notify (or alert), and Troubleshooting where you identify, diagnose, restore and resolve.
“What we often find is that users can use that same data to do what we call App Intelligence – the same logs and metrics that allows you to figure out something is broken, also tells you what your users are doing. If you know what users are doing, you can make life better for them because that’s what really matters.”
So who really cares about this data? When it comes to monitoring where the focus is on user-visible functionality, it’s your DevOps and traditional IT Ops teams. Engineering and development also are responsible for monitoring their code. In troubleshooting apps where the focus is on end-to-end visibility, customer success and technical support teams also become stakeholders. For app intelligence, the focus is on user activity and visibility everyone is a stakeholder including sales, marketing, and product management.
“Once you have all of this data, all of these people are going to come knocking on your door,” said Ben. Once you understand the data types you have, where it is within your stack and the use cases, you can begin to use data to solve real problems. In defining what to monitor and measure, Ben highlighted:
“Once you get to troubleshooting side, it gets back to you can’t fix what you can’t measure.” Ben also said:
So what types of data will you be looking at? Ben broke it down to the following categories:
Infrastructure
Platform
Custom
“Everything you have produces data. It’s important to ensure you have all of the components covered.”
Once you have all of your data, it’s important to think about the metadata. Systems are complex and the way you make sense out of it is through your metadata. You use metadata to describe or tag your data. “For the customer, this is the code you wrote yourself. You are the only people that can figure out how to monitor that. So one of the things you have to think about is the metadata. ”
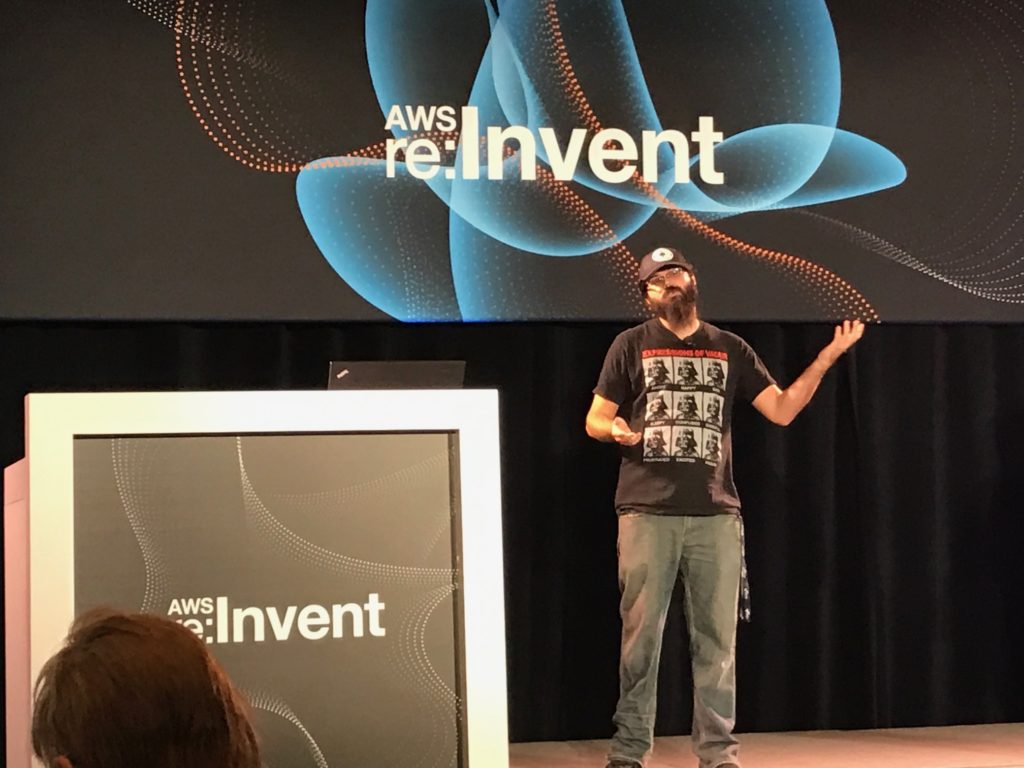
Cloud Cruiser’s Lead DevOps Engineer, Ben Abrams, took the stage to show how the company collects data and provide some tips on tagging it with metadata. Cloud Cruiser is a SaaS app that enables you to easily collect, meter, and understand your cloud spend in AWS, Azure, and GCP. Cloud Cruiser’s customers are large enterprises and mid-market players globally distributed across all verticals, and they manage hundreds of millions of cloud spend.
Cloud Cruiser had been using an Elastic (Elasticsearch, Logstash, and Kibana) stack for their log management solution. They discovered that managing their own logging solution was costly and burdensome. Ben cited the following:
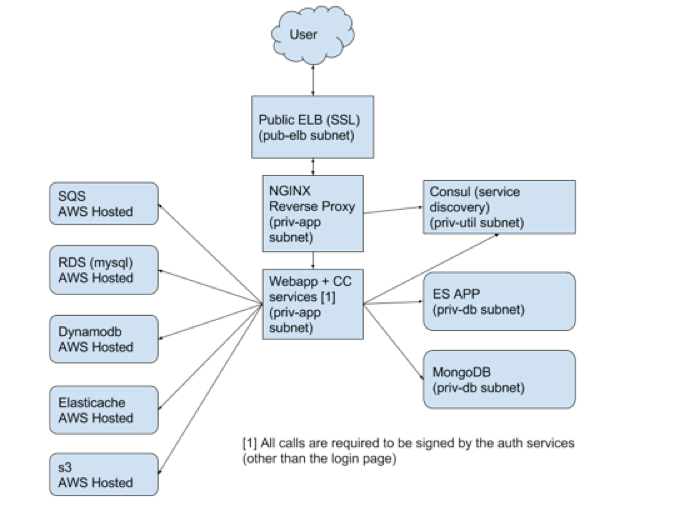
Cloud Cruiser runs on AWS (300-500 instances) and utilizes microservices written in Java using the dropwizard framework. Their front-end web app runs on Tomcat and uses Angularjs. Figure 1 shows the breadth of the technology stack:
In evaluating a replacement solution, Ben said “We were spending too much time on our ELK stack.” Sumo Logic’s Unified Logs and Metrics (ULM) was also a distinguishing factor. The inclusion of metrics meant that they didn’t have to employ yet another tool that would likewise have to be managed. “Logs are what you look at when something goes wrong. But Metrics are really cool.” Ben summarized the value and benefits they achieved this way:
Logs
Metrics
Ben then moved into a hands on session, showing how they automate the configuration and installation of Sumo Logic collectors, and how they tag their data using source categories. Cloud Cruiser currently collects data from the following sources:
“When I search for something I want to know what environment is it, what type of log is it, and which server role did it come from.” One of their decisions was to differentiate log data from metrics data as shown below.
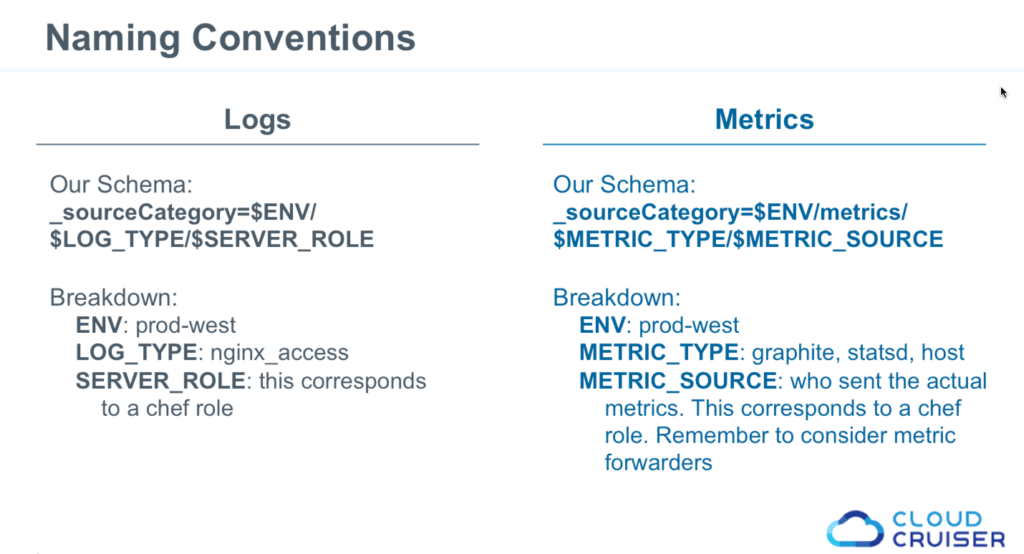
Using this schema allows them to search logs and metrics by environment, type of log data and corresponding Chef role. Ben walked through the Chef Cookbook they used for deploying with Chef and shared how they automate the configuration and installation of Sumo Logic collectors. For those interested, I’ll follow on this up in the DevOps Blog.
A key point from Ben, though, was “Don’t log secrets.” The access ID and key should be defined elsewhere, out of scope and stored in an encrypted data bag. Ben also walked through the searches they used to construct the following dashboard.
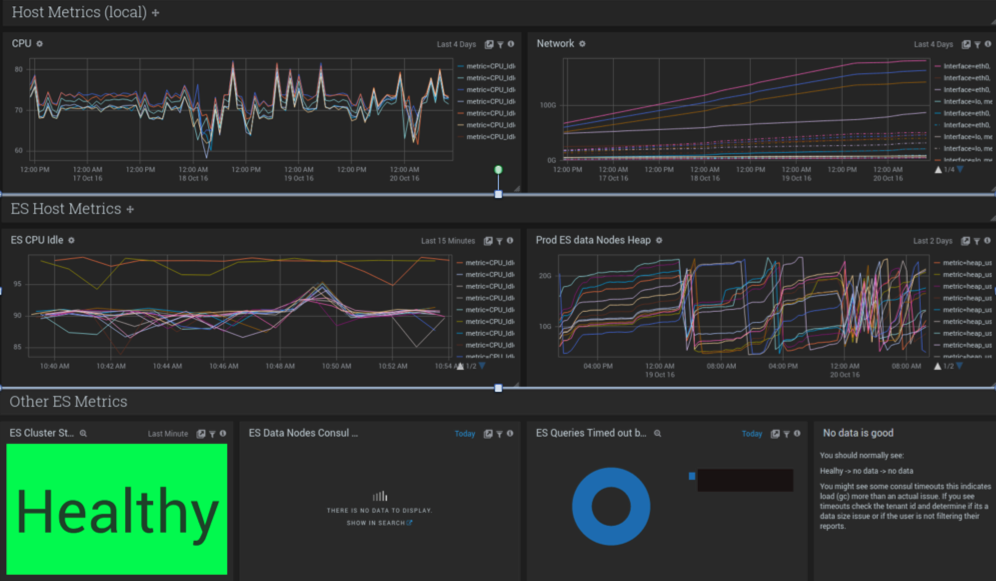
Through this one dashboard, Cloud Cruiser can utilize both metrics and log data to get an overview of the health of their production deployment.
Designing your data analytics strategy is highly dependent on your architecture. Ultimately it’s about the experience you provide to your users. It’s no longer just about troubleshooting issues in production environments. It’s also about understanding the experience you provide to your users. The variety of data that streams in real time comes from the application, operating environment and network layers produces an ever increasing volume of data every day.
Log analytics provides the forensic data you need, and time-series based metrics give you insights into the real-time changes taking place under the hood. To understand both the health of your deployment and the behavior/experience of your customers, you need to gather machine data from all of its sources, then apply both logs and metrics to give teams from engineering to marketing the insights they need.
Download the slides and view the entire presentation below:
Reduce downtime and move from reactive to proactive monitoring.
Build, run, and secure modern applications and cloud infrastructures.
Start free trial
No credit card required. Up and running in minutes.
More than 2,100 enterprises around the world rely on Sumo Logic to build, run, and secure their modern applications and cloud infrastructures.