Sumo Logic ahead of the pack
Read article
Complete visibility for DevSecOps
Reduce downtime and move from reactive to proactive monitoring.
Our approach resulted in a doubling of our log ingestion at an ingest cost increase of only 10%, saving us around $1 million.”
Iwan Eising
Team Lead of Service Reliability Architecture
BY OBSERVABILITY USE CASE
BY SECURITY USE CASE
BY INITIATIVE
BY COMPETITION
February 16, 2018
When using and troubleshooting IIS web server performance, logs are an essential resource. Let’s look at the top metrics on IIS logs and how to get the most out of logging when working with IIS servers.
IIS supports four types of log formats:
Of these formats, W3C is the most commonly used, as it provides more information than the other two. But if you need only basic info, the other two work just as well.
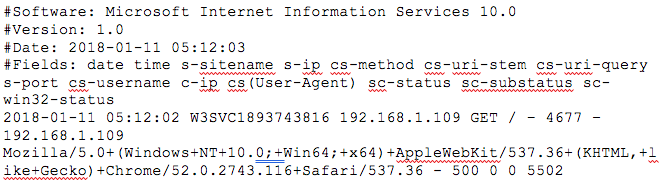
Here is a sample log file for IIS:
As you can tell, the log condenses lots of information about each request in just a few lines. It includes the version of IIS, the date and time of the request, the IP addresses, clients used, error codes, and more. Let’s look at the most important data we can get from IIS log files and how to get the most out of them.
Rather than look at single metrics, it’s more effective to read groups of related metrics to get the information we need when using IIS. Here are five types of metrics to look for in your IIS logs:
1. Vital stats
The header is the first four lines beginning with a #. It contains the vital information about the log file such as the version of IIS in use, date and time, and most importantly, the fields included in the log file. Though it doesn’t contain metrics itself, it is like a key to reading the rest of the metrics in the log file.
2. IP addresses
The next important part of an IIS log file is the IP addresses from where the request was made and answered. Using this information, you can identify the client that made the request, and which server it was answered by. You can track the location of requests, and identify any suspicious patterns. If there are numerous requests from unusual IPs, it’s likely fraudulent and needs to be looked into.
3. Client details
The log file includes details about the client, like the operating system, browser, and cookie info, which is vital information to have when troubleshooting and testing. Pages render differently on different browsers and devices, and using this information, you can assess the performance of a page on various devices and browsers. By visualizing a large sample set of this data, like latency across different browsers, you can get a clear picture of performance in the real world. If you notice that a particular version of a browser or a particular OS is underperforming, you know where to look to fix the issue.
4. Performance
The very last piece of data in the log file is the time taken to complete a request. This shows the latency, which is an important metric to gauge performance. Again, if you look at the cumulative latency for all requests for a particular URL, you know how its performance measures up. Having an average latency for all pages, and average latency over time, will help you spot spikes in latency at any time, or for any particular page. Latency helps keep your SLAs, whether internal or external.
You may need to dig deeper to identify the root cause for the latency. It could be that there’s a seasonal spike during a promotional offer, which is normal, and you may need to scale resources to support this spike, or it may be a bottleneck in the network, which needs to be looked into further—or even worse, it may be something suspicious caused by an external source. Your response will depend on the details you find beyond the latency metric.
5. Error codes
The IIS log file also reports on error statuses like 404s. This can be useful in catching pages that were moved accidentally, or URLs that need a redirect, or to see if users are typing in a wrong URL.
IIS is still a popular server, and using it on a daily basis involves reading log files to enforce security, and improve performance. Looking at log files and their cumulative metrics, alongside other related metrics, can yield richer insight. A log analysis tool with powerful search, filtering, and visualization features can help you get the most out of your IIS logs. Once you know what you need to look for, a great log analysis tool can help you find it in your IIS logs.
Reduce downtime and move from reactive to proactive monitoring.
Build, run, and secure modern applications and cloud infrastructures.
Start free trial
Twain Taylor is a member of the Sumo Logic Community. Twain began his career at Google, where, among other things, he was involved in technical support for the AdWords team. His work involved reviewing stack traces, and resolving issues affecting both customers and the Support team, and handling escalations. Later, he built branded social media applications, and automation scripts to help startups better manage their marketing operations. Today, as a technology journalist he helps IT magazines, and startups change the way teams build and ship applications.
More posts by Twain Taylor.

No credit card required. Up and running in minutes.
More than 2,100 enterprises around the world rely on Sumo Logic to build, run, and secure their modern applications and cloud infrastructures.