Sumo Logic ahead of the pack
Read article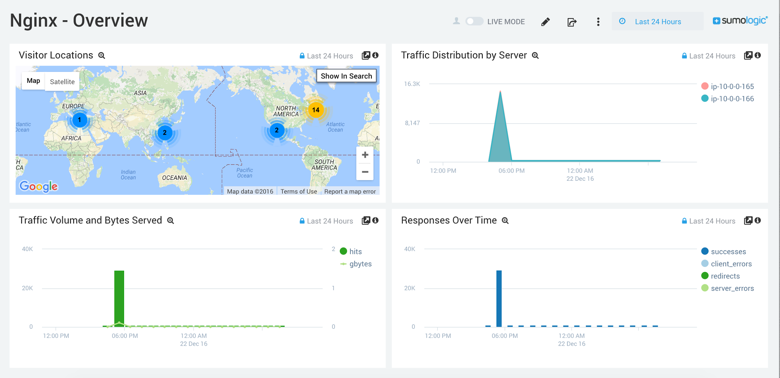
Complete visibility for DevSecOps
Reduce downtime and move from reactive to proactive monitoring.
Our approach resulted in a doubling of our log ingestion at an ingest cost increase of only 10%, saving us around $1 million.”
Iwan Eising
Team Lead of Service Reliability Architecture
BY OBSERVABILITY USE CASE
BY SECURITY USE CASE
BY INITIATIVE
BY COMPETITION
January 23, 2017
So you have one or more NGINX instances happily logging to files. Now what? Consolidating all your logs from all your instances using Sumo Logic makes it quick and easy to find trends and errors.
In this blog post, I’ll explain how to aggregate NGINX logs with Sumo Logic.
I am going to assume that you either have or will have an NGINX instance running somewhere. By default, NGINX has two log files, error.log and access.log. Depending on how you install the product, they can be in various locations. For example, if NGINX was installed using Yum on a Red Hat-based Linux distribution, the log files would be in /var/log/nginx.
If you want more information on customizing what is logged, including changing the name and number of log files, you can find it in the NGINX documentation.
At this point, there are one or more NGINX instances running, generating logs, and now we need to get them into Sumo Logic. There are two options to do this. Both are built into the setup wizard, which is launched the first time you log into Sumo Logic, or when you go to the Manage menu and select Setup Wizard from the Sumo Logic console.
Option 1 is uploading files. This is simple and straightforward, and great for one-time analysis, but it’s not the most effective way to really leverage the platform.
Option 2 is streaming data. Streaming Data is agent-based, and takes care of keeping the log files flowing into Sumo Logic’s platform without constant manual intervention. Following the setup wizard, simply select NGINX as the type of data, the OS you are on, and then the wizard will give the specific commands to run.
As long as your host has access to connect to Sumo Logic, then the agent will be discovering logs and uploading them within minutes. I’ve used this wizard multiple times and it works every time. (*Note: if you have installed NGINX using a non-standard location inside the OS, it will ask where the log files are. The rest of the streaming will work great—It just needs some help finding the files the first time.)
The power of Sumo Logic’s centralized logging with search and dashboards is now available to you, and will streamline your ability to analyze NGINX logs.
The following things are now true:
Sumo Logic has a pre-built set of dashboards for NGINX that will cover all your basic needs. You also have the ability to make new dashboards or customize what metrics are shown on existing dashboards.
Every metric on every dashboard can be drilled down into, and can be switched to the search view to show the raw data that is being used to generate the graphs and other visuals.
For example, this is the NGINX Overview dashboard that is preconfigured:
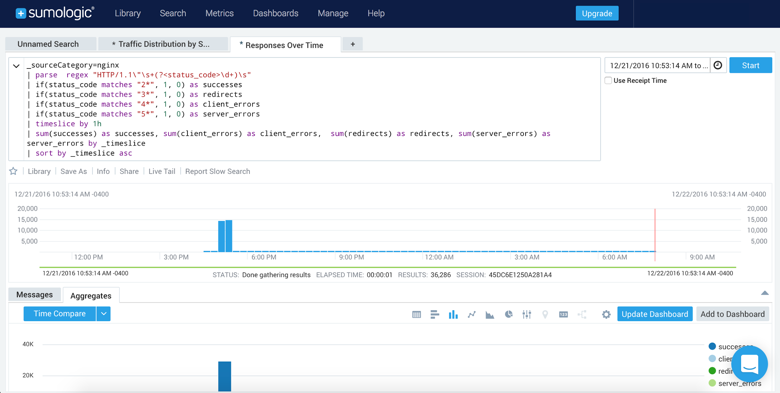
This is the search screen that was one click away from the Traffic Distribution by Server metric:
Of course, the search features of Sumo Logic are extremely valuable when it comes to root-cause analysis and determining trends, and you will use these features day in and day out.
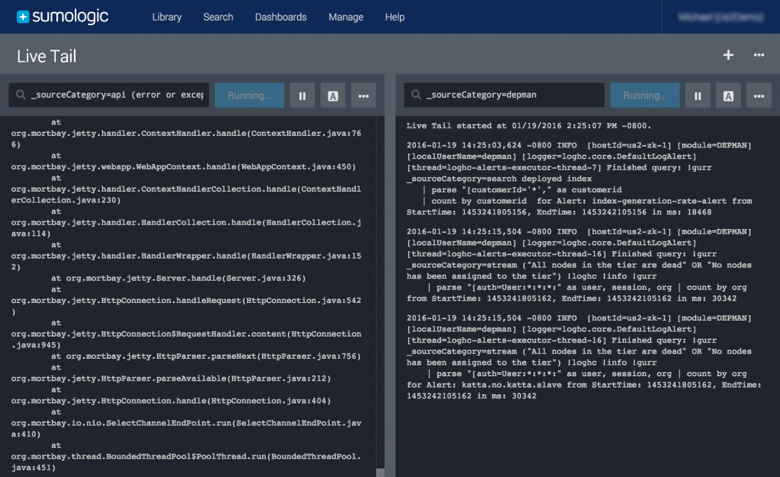
When it comes to operators and developers working on production problems, the Live Tail (datasheet) feature alone will make life easier, and makes it worth trying the platform. I can’t count the number of times I’ve gone straight to `tail -f /var/log/nginx/error.log` or countless other error files to watch for where the error is happening in real time across multiple terminal sessions, with people peering over my shoulder because they don’t have the access or knowledge to do the same thing.
With Sumo Logic’s Live Tail feature, you can just go to the web application and filter the live incoming logs by a variety of criteria and get single or multiple views of the data they need with the context that works for them, live. There’s no need for system-level access or CLI commands.
Reduce downtime and move from reactive to proactive monitoring.
Build, run, and secure modern applications and cloud infrastructures.
Start free trial
Vince Power is a Solution Architect who has a focus on cloud adoption and technology implementations using open source-based technologies. He has extensive experience with core computing and networking (IaaS), identity and access management (IAM), application platforms (PaaS), and continuous delivery.
More posts by Vince Power.

No credit card required. Up and running in minutes.
More than 2,100 enterprises around the world rely on Sumo Logic to build, run, and secure their modern applications and cloud infrastructures.