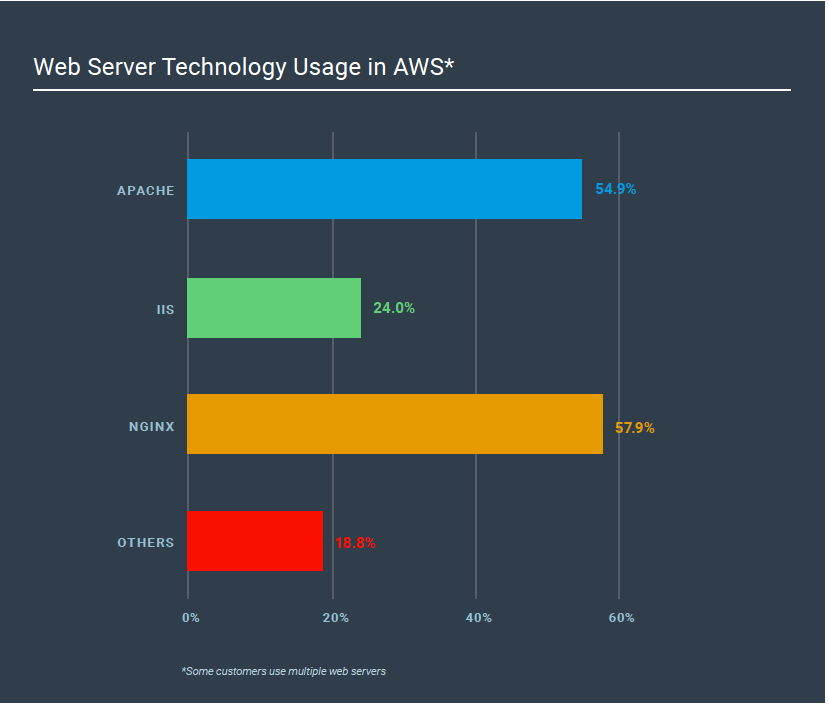
Access logs are essential for understanding how to optimize your Web server. Indeed, when it comes to defect diagnoses in web development, logging is the single-most important action you can take before problems happen. That’s why knowing how to work with the access logs of your Web server — the topic of this article, which covers both Apache Logs and NGINX logs — is so important. Both web servers are used extensively in AWS according to the Sumo Logic Modern Application Report 2017. Hence it is useful to compare and contrast logging formats between Apache Logs and NGINX Logs.
While it is generally ideal to catch a bug as it happens, that usually isn’t the case. Whether they come from users or monitoring platforms, bug reports only provide narrow insight into an issue; secondary data like logs help widen that insight by providing additional technical information. Think of it like a security camera: if someone breaks into your house, the break in is the bug, while the security camera is the log. Without the camera, you would know someone broke in, but you wouldn’t know who or how.
So, in the context of a web server, how do we set up and review logs?
Access Logs
While these days, spinning up a web server is almost entirely dependent on the web development language you are using, in the world of traditional web servers, there are two main competitors we’ll focus on: Apache and NGINX. By default, Apache and NGINX access logs are actually both stored in the combined log format. To pluck the definition from the official Apache documentation, this format looks like this:
%h %l %u %t \"%r\" %>s %b \"%{Referer}i\" \"%{User-agent}i\"
Obviously, without any context, the format above is basically gibberish, so let’s break it down a bit:
- %h denotes the IP address of the client that made the request.
- %l is the remote logname from identd (I should note from the documentation that this information is highly unreliable, and rarely provided outside of tightly controlled internal networks).
- %u references the user of the person making the request—This information is generally only provided if the request is protected by HTTP authentication.
- %t is the time the server finished processing the request.
- %r is the first line of the request itself.
- %s is the HTTP status code that was returned to the client.
- %b indicates the number of bytes sent, excluding the HTTP headers.
- %{Referer}i is, obviously, the contents of the Referer header in the request sent to the server.
- %{User-agent}i is, as above, the contents of the User-agent header in the request sent to the server.
With all of that information in mind, we can see that the default logs provided by both Apache and NGINX are pretty much identical. The only real differentiation is in the number of bytes sent by the servers themselves. If these default options don’t suit your needs very well, I recommend checking out the Apache log configuration documentation, or the NGINX log configuration documentation. While the variable naming conventions differ, the information available is relatively the same. Apache does have some additional variables that can be injected out of the box, but they aren’t commonly used, so I won’t dig into them here.
67.164.164.165 - - [24/Jul/2017:00:16:46 +0000] “GET /info.php HTTP/1.1” 200 24564 “-” “Mozilla/5.0 (Macintosh; Intel Mac OS X 10_12_4) AppleWebKit/537.36 (KHTML, like Gecko) Chrome/59.0.3071.115 Safari/537.36”67.164.164.165 - - [24/Jul/2017:00:16:48 +0000] “GET /favicon.ico HTTP/1.1” 404 209 “http://104.236.9.232/info.php” “Mozilla/5.0 (Macintosh; Intel Mac OS X 10_12_4) AppleWebKit/537.36 (KHTML, like Gecko) Chrome/59.0.3071.115 Safari/537.36”67.164.164.165 - - [24/Jul/2017:00:17:16 +0000] “GET /info.php HTTP/1.1” 200 24579 “-” “Mozilla/5.0 (Macintosh; Intel Mac OS X 10_12_4) AppleWebKit/537.36 (KHTML, like Gecko) Chrome/59.0.3071.115 Safari/537.36”67.164.164.165 - - [24/Jul/2017:00:16:18 +0000] “GET /info.php HTTP/1.1” 200 24589 “-” “Mozilla/5.0 (Macintosh; Intel Mac OS X 10_12_4) AppleWebKit/537.36 (KHTML, like Gecko) Chrome/59.0.3071.115 Safari/537.36”Apache Logs > /var/log/apache2/access.log
67.164.164.165 - - [24/Jul/2017:00:34:11 +0000] “GET /info.php HTTP/1.1” 200 1543 “-” “Mozilla/5.0 (Macintosh; Intel Mac OS X 10_12_4) AppleWebKit/537.36 (KHTML, like Gecko) Chrome/59.0.3071.115 Safari/537.36”67.164.164.165 - - [24/Jul/2017:00:34:13 +0000] “GET /favicon.ico HTTP/1.1” 404 15 “http://104.236.9.232/info.php” “Mozilla/5.0 (Macintosh; Intel Mac OS X 10_12_4) AppleWebKit/537.36 (KHTML, like Gecko) Chrome/59.0.3071.115 Safari/537.36”67.164.164.165 - - [24/Jul/2017:00:34:14 +0000] “GET /info.php HTTP/1.1” 200 1543 “-” “Mozilla/5.0 (Macintosh; Intel Mac OS X 10_12_4) AppleWebKit/537.36 (KHTML, like Gecko) Chrome/59.0.3071.115 Safari/537.36”67.164.164.165 - - [24/Jul/2017:00:34:15 +0000] “GET /info.php HTTP/1.1” 200 1543 “-” “Mozilla/5.0 (Macintosh; Intel Mac OS X 10_12_4) AppleWebKit/537.36 (KHTML, like Gecko) Chrome/59.0.3071.115 Safari/537.36”NGINX Logs > /var/log/nginx/access.log
Error Logs
Unlike access logs, the Apache and NGINX error logs differ in format a little bit. Because of the nature of error logs, they are generally pretty freeform, but both web servers have their own pre-defined prefixes that accompany every line in the log file. To better understand how these two formats differ, let’s take a look at a few screenshots:
[Mon Jul 24 00:15:48.045649 2017] [mcm_prefork:notice] [pid 1515] AH00163: Apache/2.4.18 (Ubuntu) configured -- resuming normal operations[Mon Jul 24 00:15:48.045786 2017] [core:notice] [pid 1515] AH00094: Command line: ‘/usr/sbin/apache2’[Mon Jul 24 13:29:42.215648 2017] [mcm_prefork:notice] [pid 1515] AH00169: caught SIGTERM, shutting down[Mon Jul 24 13:30:12.192837 2017] [mcm_prefork:notice] [pid 19036] AH00163: Apache/2.4.18 (Ubuntu) configured -- resuming normal operations[Mon Jul 24 13:30:48.847563 2017] [core:notice] [pid 19036] AH00094: Command line: ‘/usr/sbin/apache2’[Mon Jul 25 06:12:14.758473 2017] [mcm_prefork:notice] [pid 19036] AH00171: Graceful restart requested, doing restartAH00558: apache2: Could not reliably determine the server’s fully qualified domain name, using 127.0.1.1. Set the ‘ServerName’ directive globally to suppress this messageApache Error Logs > /var/log/apache/error.log
As you can see from Apache’s error log above, it has a relatively logical structure, but let’s take a minute to analyze what each part of the log is:
- [Mon Jul 24 00:15:48.045649 2017] is, obviously, the timestamp of the log entry.
- [mpm_prefork:notice] is the module (mpm_prefork) and the log level (notice) respectively.
- [pid 1515] is the process ID.
- AH00163 is the specific error code (a complete list of error codes can be found here).
At this point, everything else that follows the error code above is the raw error message.
While this is the default log format, Apache does allow you to change it via the ErrorLogFormat directive.
Next, let’s take a look at example NGINX logs. One thing to note is that NGINX logs have significantly less data by default, so out of the gate, the error logs will look much more anemic compared to the Apache error logs. (Case in point, my NGINX test server has accumulated one error log line over the course of a few days):
2017/07/24 11:29:45 [notice] 22118#22118: using inherited sockets from “6;7;”NGINX Error Logs > /var/log/nginx/error.log
So what does it all mean? Let’s break it down like we did with the Apache logs.
- 2017/07/24 11:29:45 references the timestamp, similar to Apache’s.
- [notice] indicates the log level.
- 22118#22118 is the process ID, and the thread ID.
- And finally, as with Apache, everything after the process identifier and thread identifier is the raw log line itself.
It is important to note here that, while the Apache error log format can be changed, the NGINX error log format cannot, so the data we see here is the data we get. That said, I’ve personally found that the log level, timestamp, and actual log data are generally the most valuable information that can be gleaned from the error logs.
| Features | NGINX | Apache |
| Access log location | /var/log/nginx/access.log | /var/log/apache/access.log |
| Error log location | /var/log/nginx/error.log | /var/log/apache/error.log |
| Can access log format be modified? | Yes | Yes |
| Can error log format be modified? | No | Yes |
Conclusion
While NGINX and Apache are wildly different web servers, both of their logging approaches are relatively the same. The advantage to this is that there is no real inherent logging benefit to using one server over the other, which gives you the ability to change servers with minimal changes to your application monitoring infrastructure. Regardless of the similarities in logging approach, however, what’s important in the end is the value of the information provided, not the format it is presented in.
