When Sumo Logic and New Relic announced a partnership at AWS re:Invent 2016, we immediately started hearing the excitement from our joint customers. The ability to combine the strengths of two leading SaaS services that offer fast time-to-value for monitoring and troubleshooting modern applications would offer a powerful and complete view of digital businesses, from the client down to the infrastructure. Today, we’re pleased to announce another advancement in our partnership: integrated machine data analytics with application and infrastructure performance data in New Relic Insights via a custom New Relic webhook built directly into Sumo Logic.
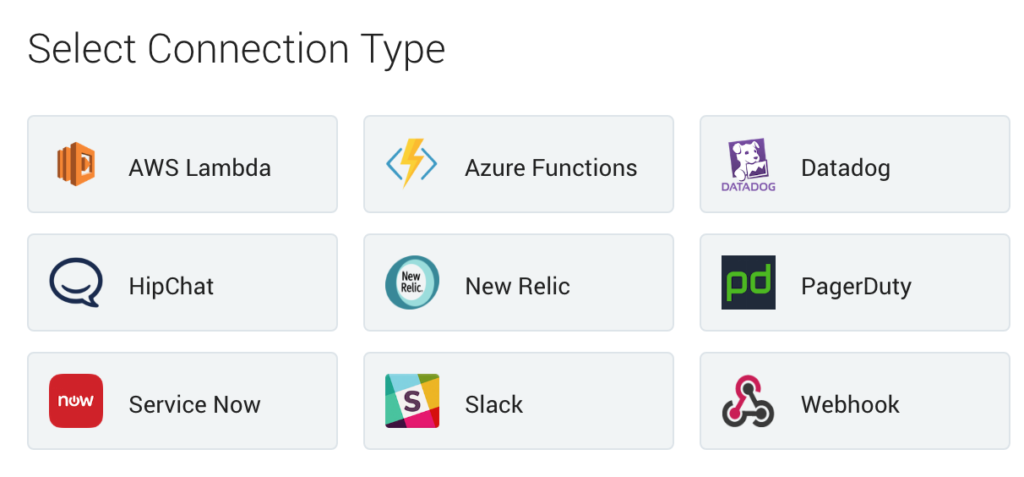
Custom New Relic webhook in Sumo Logic
Unlocking Insights from Sumo Logic
Scheduled searches in Sumo Logic allow you to monitor and alert on key events occurring in your application and infrastructure. The flexibility of the query language allows you to pull just the information you need while fine tuning the thresholds to trigger only when necessary. Combined with your New Relic APM and New Relic Infrastructure data in New Relic Insights, you’ll now be able to visualize information such as:
- Events: Service upgrades, exceptions, server restarts, for example
- Alerts: More than 10 errors seen in 5 minutes, for example, or failed login attempts exceeding 5 in 15 minutes
- KPIs: Count of errors by host, for example, or top 10 IPs by number of requests
Integrating these insights into New Relic provides an integrated context for faster root cause analysis and reduced Mean Time to Resolution (MTTR), all within a single pane of glass. In just three simple steps, you’ll be able to leverage Sumo Logic webhooks to send data to New Relic.
Step 1: Configure the New Relic webhook connection
In New Relic Insights, you will first need to register an API key that will be used by the Sumo Logic webhook. These keys allow you to securely send custom events into New Relic from different data sources. Type in a short description to keep a record of how this API key will be used, then copy the Endpoint and Key for setup in Sumo Logic.
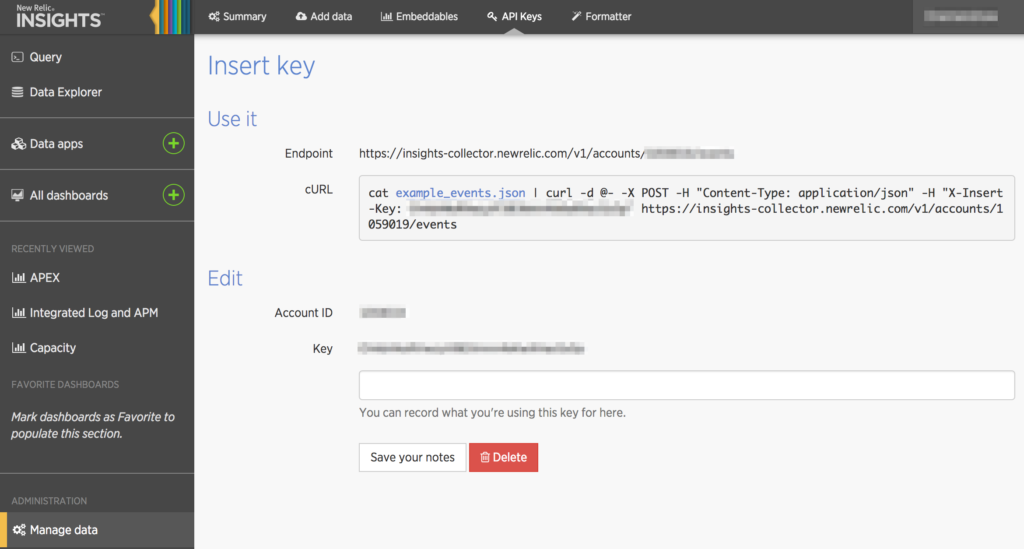
Generate an API Key from New Relic Insights to be used in Sumo Logic
In Sumo Logic, create a New Relic webhook connection and insert the Endpoint and Key into the URL and Insert Key fields. The payload field gives you the flexibility to customize the event for viewing in New Relic. In addition to the actual results, you can optionally specify metadata to provide additional context. For example, the name of the Sumo Logic search, a URL to that particular search, a description, and more. This payload can also be customized later when you schedule the search.
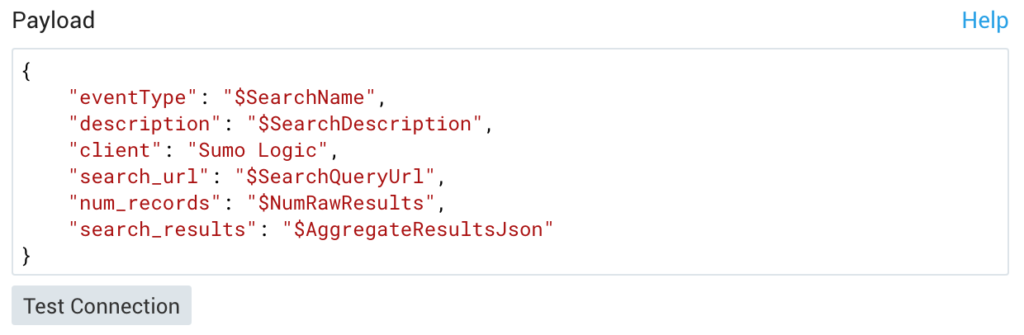
Variables from your Sumo Logic search can be included in your payload for additional context in New Relic.
Step 2: Schedule a search to send custom events
After saving your New Relic webhook, you have the option to specify this as the destination for any scheduled search in Sumo Logic. The example below shows a query to look for “Invalid user” in our Linux logs every 15 minutes. To store and visualize this information in New Relic, we simply schedule a search, select the New Relic webhook that we configured in Step 1, and customize the payload with any additional information we want to include. This payload will send each result row from Sumo Logic as an individual event in New Relic.
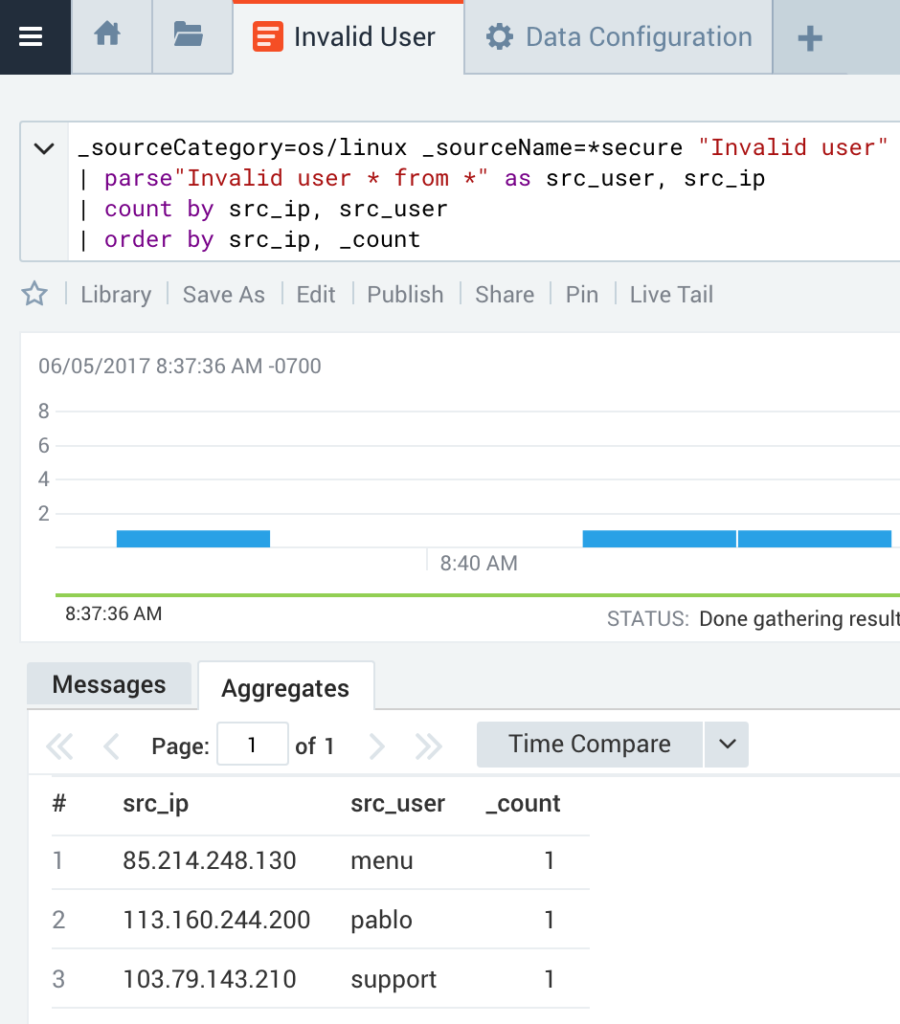
The Sumo Logic query language allows you to transfer meaningful insights from your logs to New Relic
Step 3: Visualize events in New Relic Insights
Once the scheduled search has been saved and triggered, we can see the data populating in New Relic Insights and use the New Relic Query Language (NRQL) to create the visualizations we need. NRQL’s flexibility lets you tailor the data to your use case, and the visualization options make it seamless to place alongside your own New Relic data. In fact, you might not even notice the difference between the data sources—can you tell which data below is coming from New Relic, and which is coming from Sumo Logic?
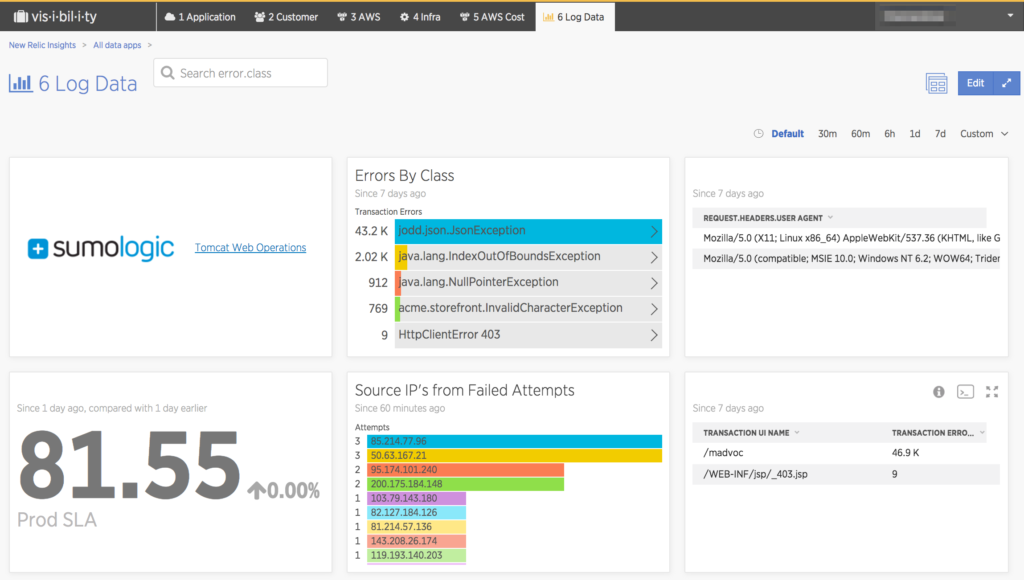
A unified view: “Source IP’s from Failed Attempts” streams in from Sumo Logic, while “Errors by Class” comes from New Relic
The ability to visualize application and infrastructure performance issues alongside insights from your logs reduces the need to pivot between tools, which can speed root cause analysis. If you’ve spotted an issue that requires a deeper analysis of your logs, you can jump right into a linked Sumo Logic dashboard or search to leverage machine learning and advanced analytics capabilities.
Learn more
Head over to Sumo Logic DocHub for more details on how to configure the New Relic webhook, then schedule some searches to send custom events to New Relic Insights. We’re excited to continue advancing this partnership, and we look forward to sharing more with you in the future. Stay tuned!
