 Meet the new
About Dashboard Panels
Time Series panel
Time series panels provide information on a series of data points ordered in time. Typically, a time series is a sequence taken at successive equally spaced points in time. Examples of time series are CPU and memory usage over time.
In a time series, time is often the independent variable and the goal is usually to make a forecast for the future. Time series are frequently plotted with area or line charts.
Time series panels are best for looking at statistics collected over time, such as CPU, memory, and disk usage.
Time series panels accept aggregate fields with epoch values (milliseconds since 1970).
Log queries can use the timeslice operator to provide a time series.
Available chart types:
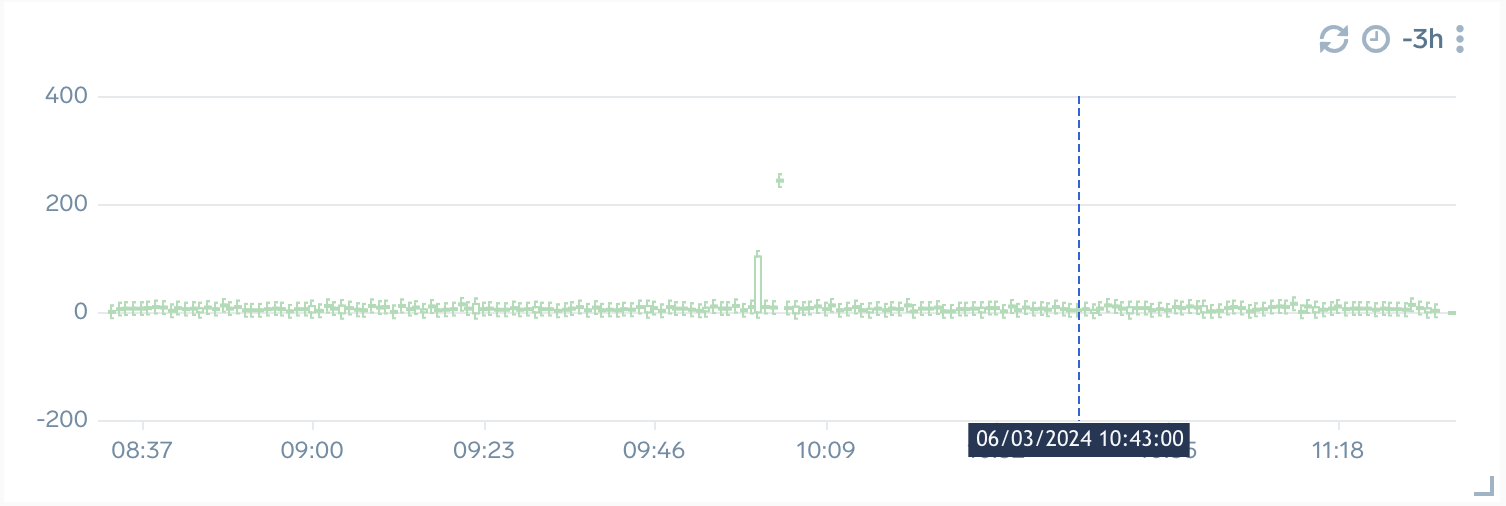
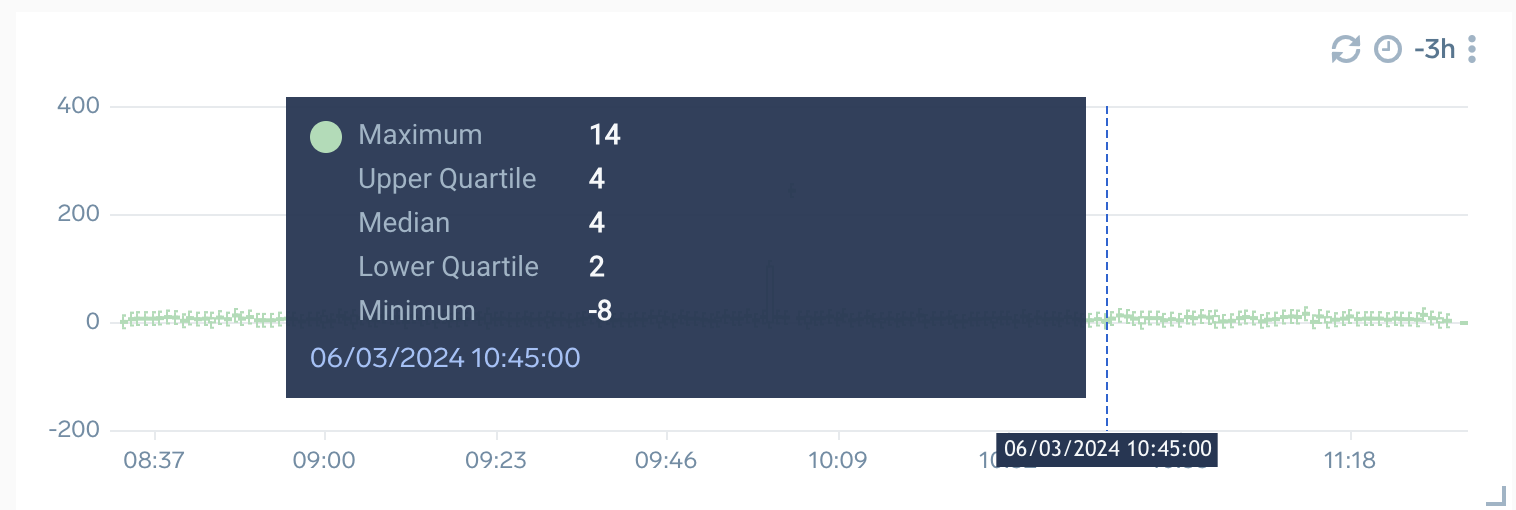
When you move the cursor over the Line, Column, Bar, Area, and Box Plot time series panels, you can see a crosshair line across the panel which displays the time-series data. If other time series panels are configured with an overlapping time range, the crosshair timestamp also appears on those panels when you hover over one of them. A tooltip displays the time series data along with the crosshair. For combo charts, the tooltip also shows information about the combined chart types.
Crosshair timestamps are not available for Heatmap, Table, Categorical, and Honeycomb charts.
As a dashboard user, you can modify the time range for the selected panel or for all panels in the dashboard. For more information, see Set Custom Time Ranges.
What is the difference between a categorical and time series panel?
The categorical panel type contains charts that graph data across categories. This includes:
- Line Charts
- Area Charts
- Bar Charts over categories
- Column Charts over categories
- Pie Charts
- Funnel Charts
- Tables over categories
- Bubble Charts
- Scatter Charts
- Sankey Diagram
- Box Plot Charts
The time series panel type is designed to graph data over time. Time series panels accept aggregate fields with epoch values (milliseconds since 1970). You can use the timeslice operator to provide a time series.
The time series panel includes the following chart types:
- Area
- Bar
- Column
- Line
- Table
- Box Plot
- Heat Map
Categorical panel
Categorical panels show how often (the frequency) distinct values occur. Categorical frequencies are typically shown in pie, table, and column charts.
Categorical panels are best for understanding the distribution of data by category. For example, you can see the number of CPUs used by machine type or the number of requests handled by a pod.
Available chart types:
The following image shows an example of Scatter and Bubble charts.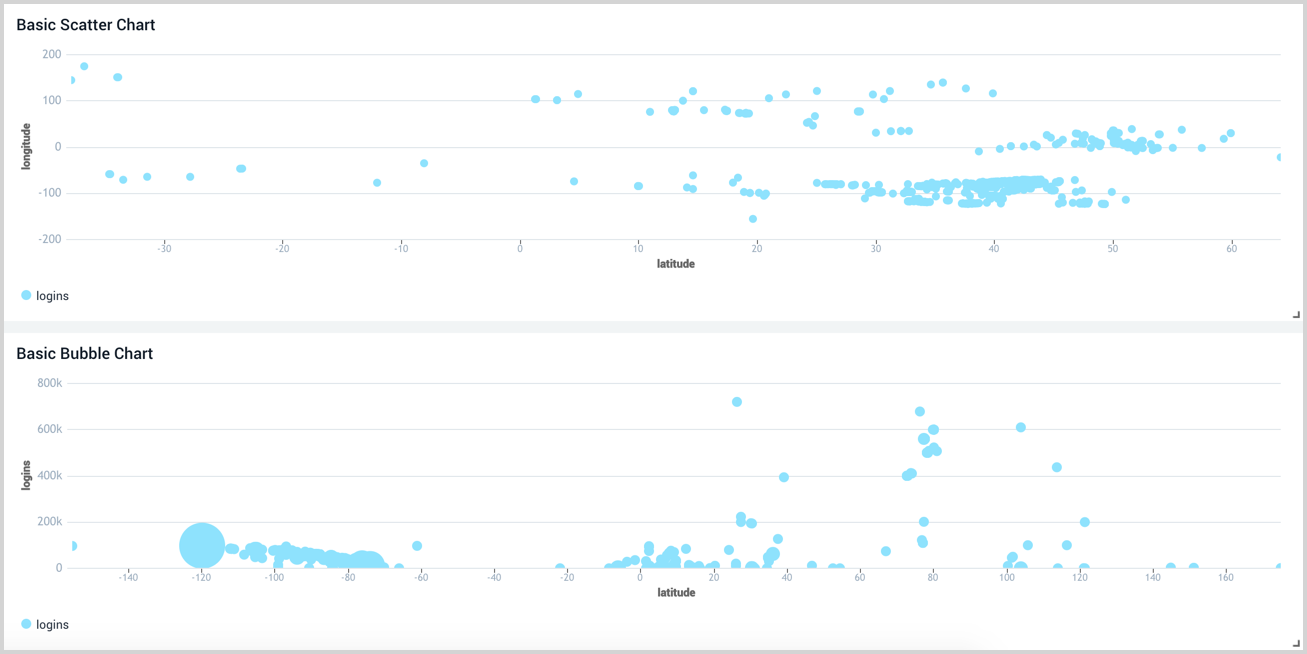
Single Value panel
Single value panels provide high-level overviews. They work well on executive dashboards and give you at-a-glance information to help you decide where to investigate and troubleshoot further.
Only single value charts are supported.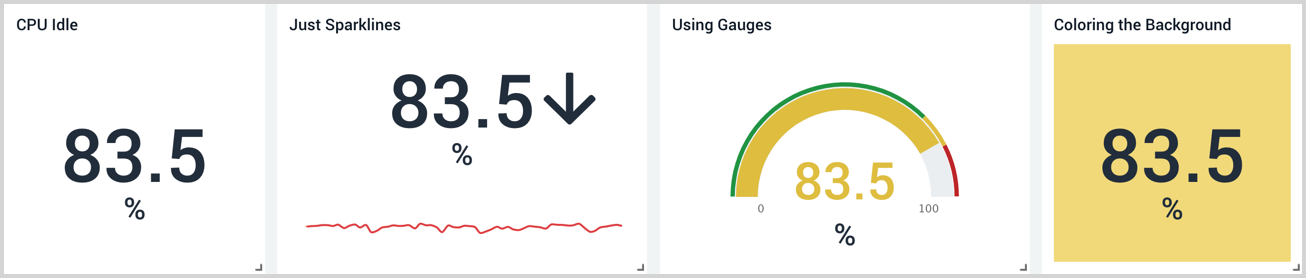
Map panel
Maps identify where requests come from. Map panels are ideal for geolocation data.
Map panels may not render if hardware acceleration is disabled in your browser.
Only map charts are supported.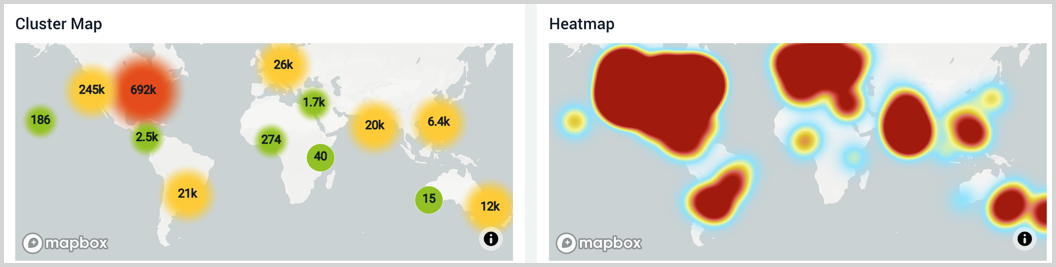
Text panel
Text can clarify what you are showing on dashboards or act as a note to your viewer. Text panels let you display descriptive text above or alongside other panels.
Titles use the same size and font. You style text with Markdown syntax, which lets you control the size and weight of the text. Not all Markdown syntax options are supported; see Markdown Syntax.
There is no limit to the number of text panels you can add to a dashboard. Text panels do not count against the panel quota in Sumo Logic Free accounts.
To add a text panel:
- With the dashboard open, click the Add Panel button.

- Choose Text as the Panel Type.
- The Text Editor and Visual Settings appear.
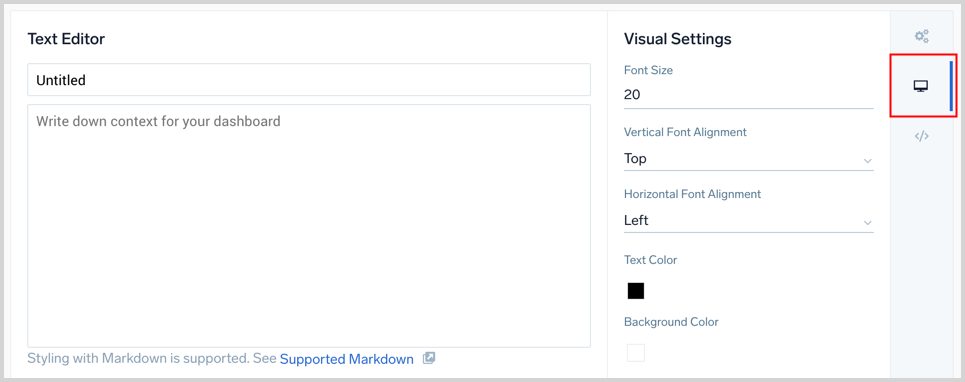
- Enter your text or Markdown syntax in the Text Editor pane. See Markdown Syntax for details on what is supported.
- The Visual Settings options allow you to adjust the font, colors, and alignment of your text.
- A title is optional. You can show or hide it in the Panel Details pane described in the next step.
- To set a title, click the General menu icon to open the Panel Details pane.
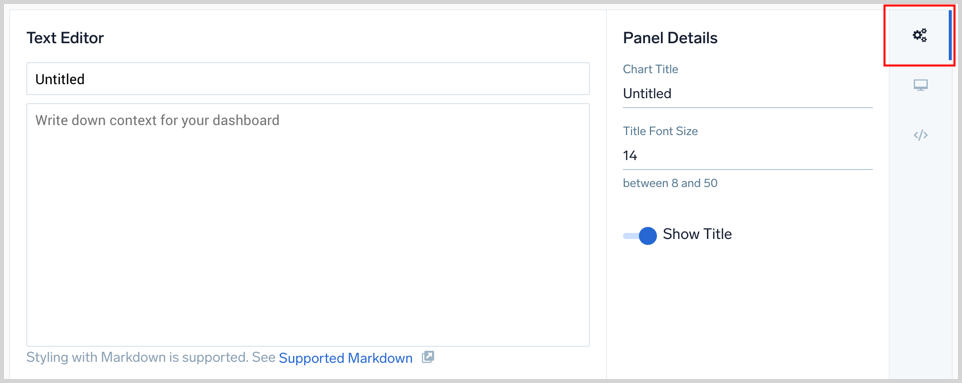 A title is optional. Use the toggle switch labeled Show Title to show or hide the title. If desired, enter a title and set the font size.
- The Panel Preview section displays your text panel based on your settings.
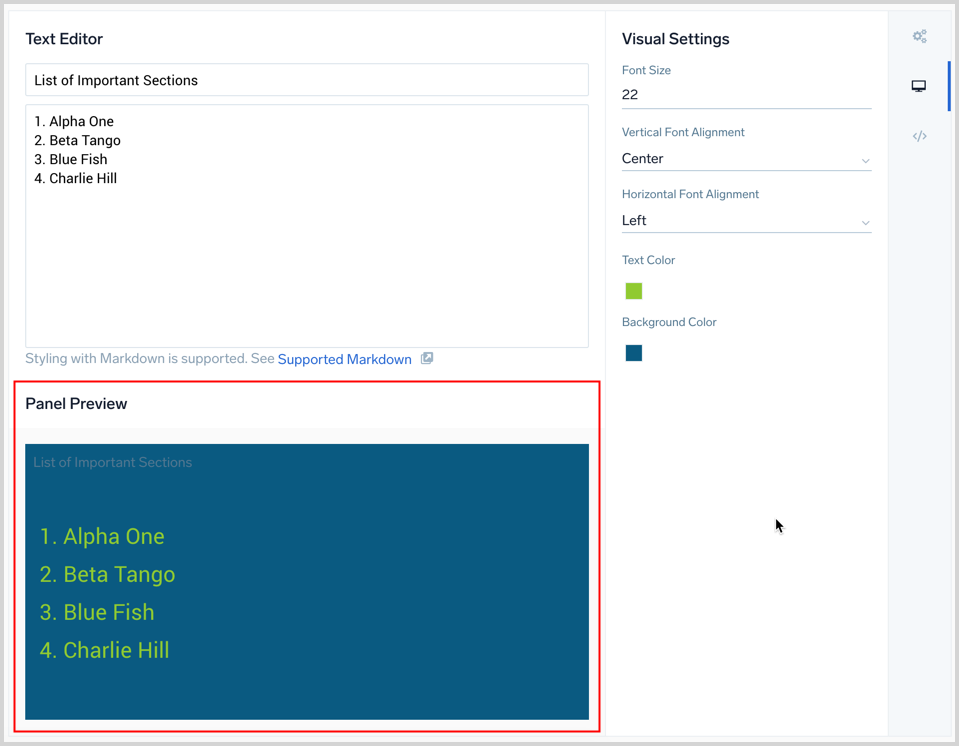
- When you are done, click Add to Dashboard at the top of the window.

Add links to text panels
You can add links to URLs or other dashboards in text panels using Markdown syntax. To create a link to a URL, surround the link text with square brackets [], then add the URL in parentheses (), as shown.
To add a link to a panel to drill down to another dashboard, see Add Dashboard Link.
Syntax
[link text](url)
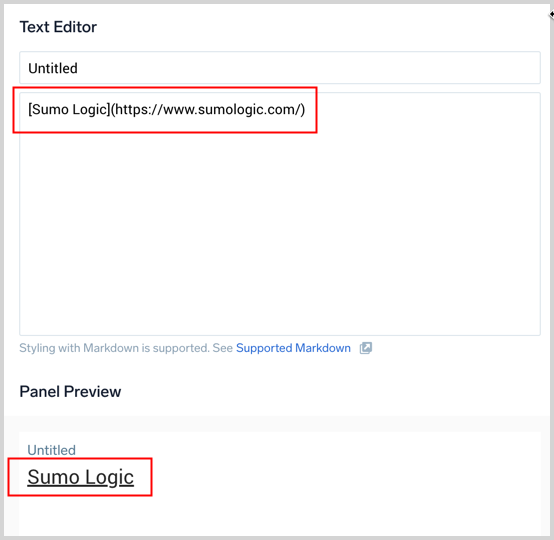
The link is displayed in the panel.
Services panel
The Services List and Map views show a high-level picture of your application environment, giving you greater insight into your application architecture and dependencies between monitored microservices.
The panel gives you a fully functioning map that you can zoom in and out of and move through to explore services. The size and color of application entities show status and activity. Click a service to open the Entity Inspector to drill down to traces, metrics, and the service dashboard.
You can filter the map according to application and service. See the Dashboards guide for more information about creating panels, configuring filters, using template variables from dashboard headers, and more.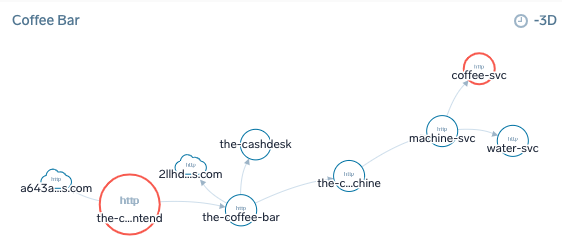
To add a Services panel:
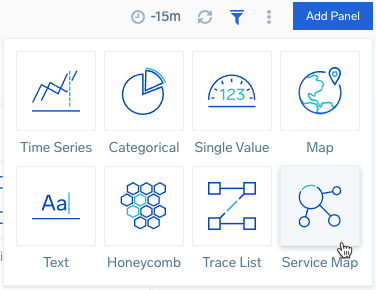
- With the dashboard open, click the Add Panel button and select Services.
- A panel configuration page opens.
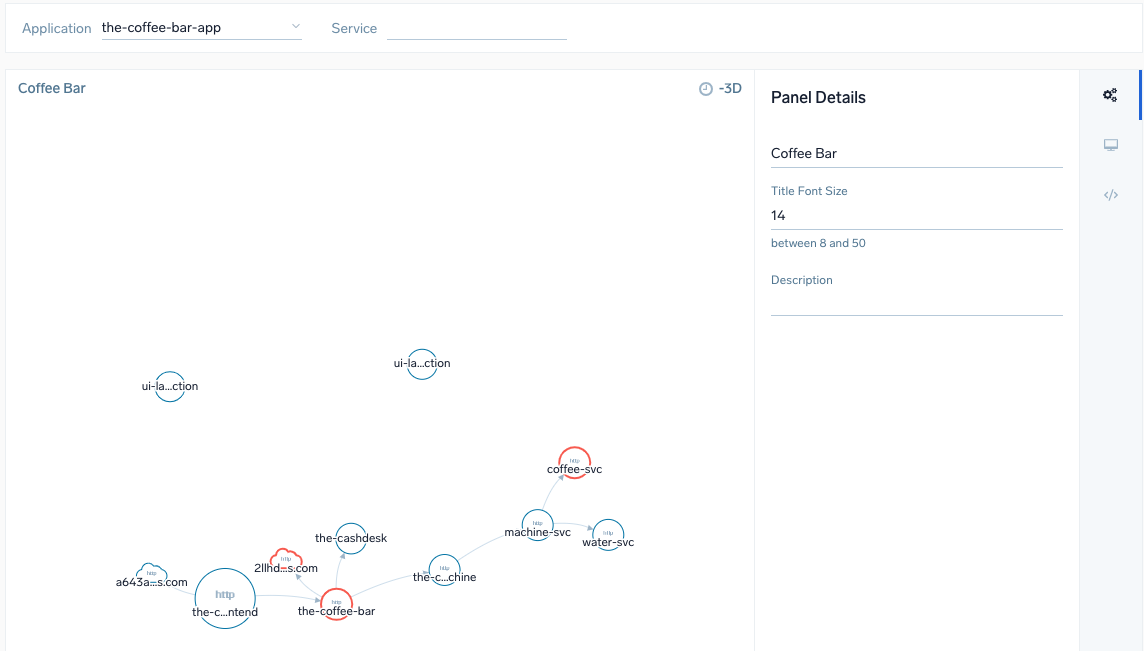
- Select from the dropdown menus to filter the Service Map by the following:

- Application if your tracing data has the
application=[app-name], tag Service. - To pass the variables from dashboard filters, set
application={{application}}and/orservice={{service}}.
- Application if your tracing data has the
- Do not set the time. The Service Map always shows the last 72 hours of data.
- Leave Chart Type set to Graph.
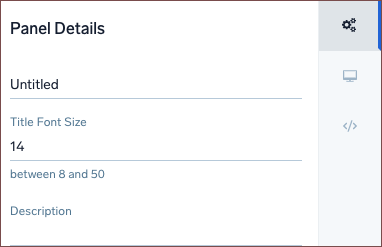
- Click the General tab to edit the Panel Details. Enter a name for the panel, set a Title Font Size, and add a short Description.
- Click Add to Dashboard.
Traces panel
Transaction tracing captures and tracks distributed business workflows by enriching and analyzing traces, logs, and metrics in real time with automatically generated application topology. Each trace provides details on the root service, when the trace occurred, how long it lasted, the number of spans, and a breakdown of services. The panel displays the table from the Traces page so you can track traces at a glance from your dashboard. To view transaction and service details (Trace View), click a trace from the panel.
See the Dashboards guide for more information about creating panels, configuring filters, using template variables from dashboard headers, and more.
You are limited to three Traces panels in a dashboard.
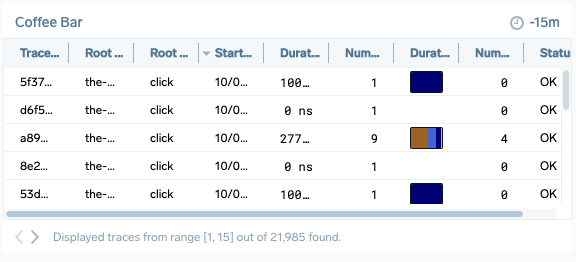
To add a Traces panel:
- With the dashboard open, click the Add Panel button.
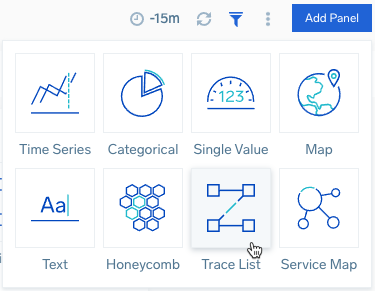
- A panel configuration page opens.
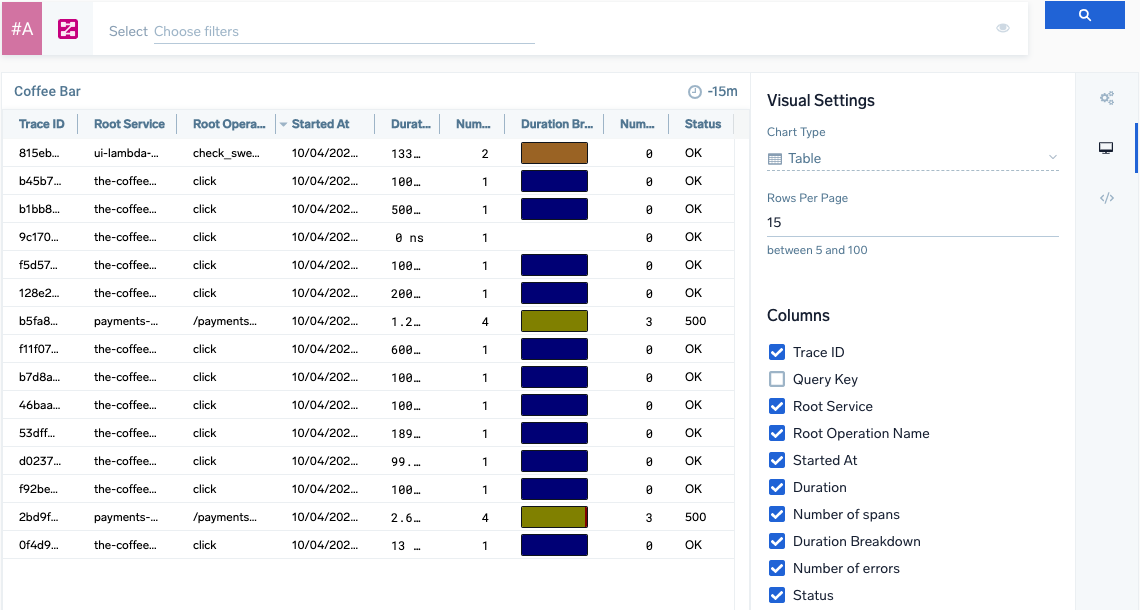
- Configure a Trace query to search for the set of traces you want.
- Select a time range or create a custom range for the panel. You can set this when you create the panel or at any time while viewing the dashboard.
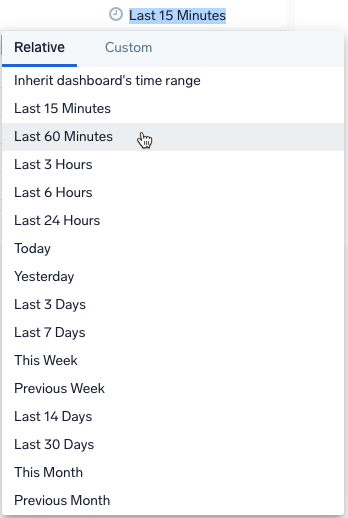
- Select a Chart Type:
- Table. Shows a table of traces.
- Breakdown chart. Shows the aggregated Trace Duration Breakdown chart. If you choose Table, complete the following steps:
- Enter the Rows Per Page for the panel, from 5 to 100. The default is 15. The panel automatically paginates traces so you can browse all of them.
- Select the table columns of trace data to show in the panel:
Column Name Example Value Description Trace ID ffaf2f69ee8ad0c1 The unique identifier of the trace. Root Service api The service that started the trace. Started At 07/27/2020 09:01:04.533 When the trace started. Duration 12.582 ms The total amount of time the trace takes. Number of spans 35 A trace consists of spans. This number tells you how many spans are in the trace. Duration Breakdown 
Each color indicates a service. The colors assigned to services are always the same in your account. You can change the color in the span summary tab after clicking the individual span in trace view.
Hover over the chart to view the percentage of the trace duration that each span covers.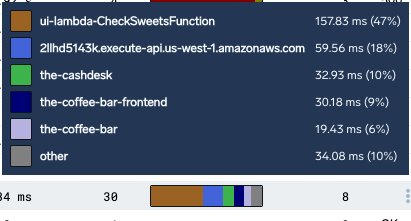
Number of errors 0 The number of errors in the trace. Status 200 The HTTP status code of the trace. - Click the General tab to edit the Panel Details. Enter a name for the panel, set a Title Font Size, and add a short Description.
- Click Add to Dashboard.
Delete a panel
You can delete a panel that you no longer need.
- Go to the dashboard that has the panel you want to delete.
- Hover the cursor over the Details icon to display the pop-up menu.
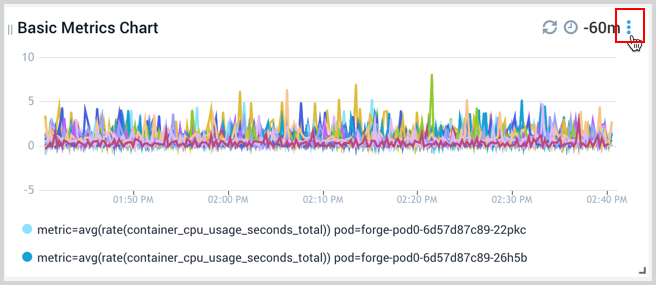
- Select Delete.
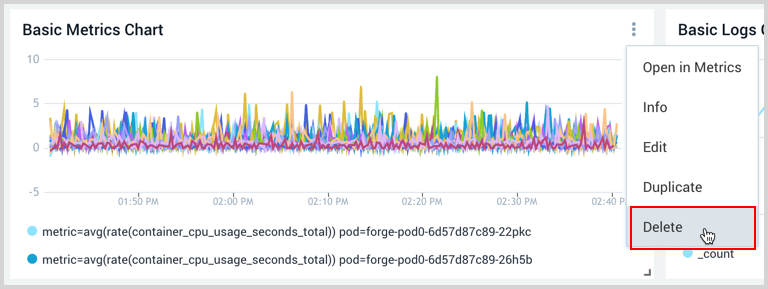
- In the confirmation dialog, click Delete Panel to remove the panel, or Cancel to keep it.
If the panel is part of a shared dashboard, the confirmation dialog warns you that deleting it may impact other users who use the dashboard.