 Meet the new
 Set Dashboard and Panel Time Ranges
This page has information about changing the time range for a dashboard and its panels.
A dashboard has a preset default time range. Often, the dashboard time range applies to all of the panels in the dashboards. Sometimes, individual panels may have a different time range than the dashboard time range. You can change the time range for a dashboard and for individual panels—the options for doing so are described in Set time range, below.
After changing the time range for a dashboard or panel, you can set the new range as the default time range. If you do, the default time range you’ve set will persist, even after you close and reopen the dashboard. For more information, see Set default time range.
Set time range
You can change the time range for a dashboard or panel by selecting a predefined interval from a drop-down list, choosing a recently used time range, or specifying custom dates and times.
Dashboard panels are limited to a 32-day maximum time range. This limitation does not apply to queries backed by an aggregate scheduled source, such as an aggregate scheduled view, an aggregate scheduled search, or a combination of both. Aggregate scheduled sources are pre-aggregated (or precomputed), which lets queries span longer time windows without exceeding query limits. See Scheduled Views and Create a Scheduled Search for details.
Set a predefined time range
To select a predefined time range:
- Click the time range shown near the upper right corner of a dashboard or dashboard panel.

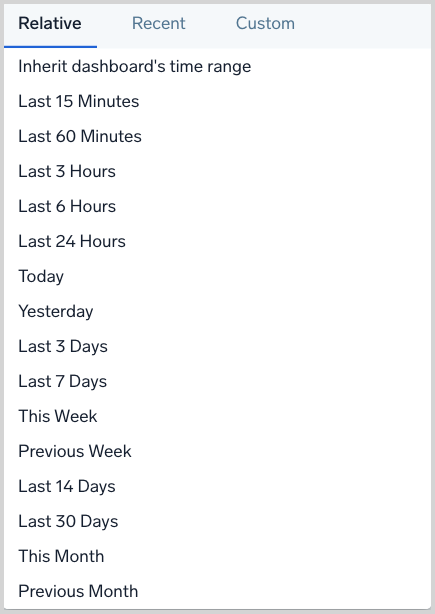
- Select one of the time range options on the Relative tab.
Choose a recently used time range
To select a recently used time range:
- Click the time range shown near the upper right corner of a dashboard or dashboard panel.
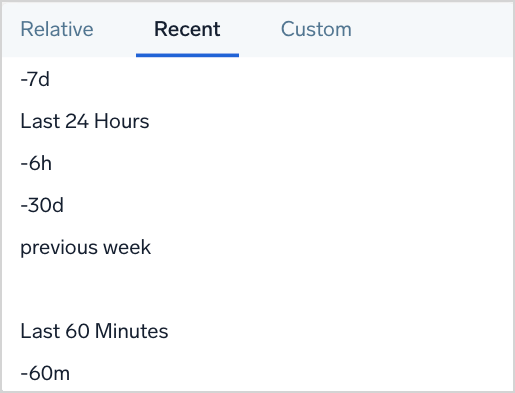
- Click the Recent tab, and select a time range.
Set a custom time range
To set a custom time range:
- Click the time range shown near the upper right corner of a dashboard or dashboard panel.
- Click the Custom tab.
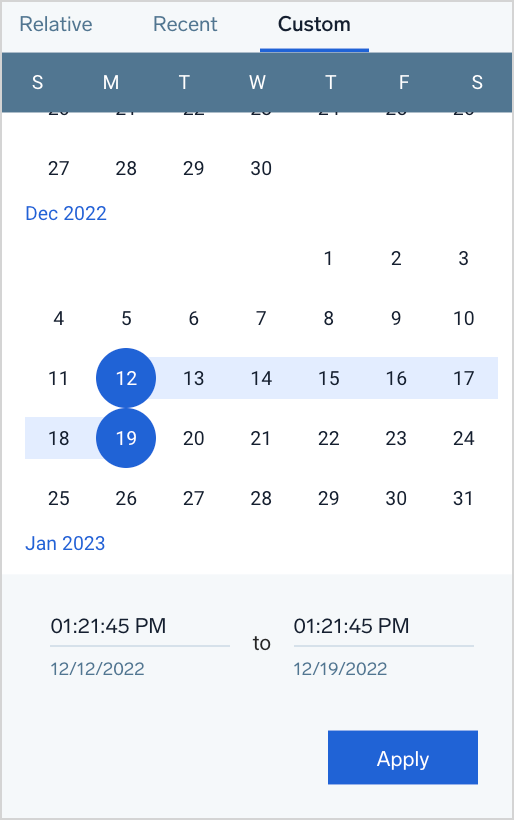
- Select start and stop dates on the calendar, and then enter start and stop times.
- Click Apply.
Drill down on a log panel by zooming
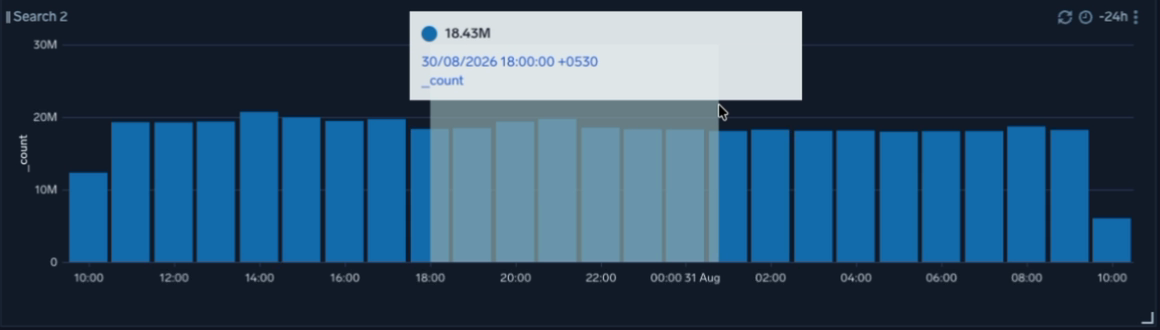
When you click and drag to select a time range on a log panel, Sumo Logic automatically recalculates the query's timeslice granularity and re-fetches the panel's data at that finer resolution, so you can drill into spikes, anomalies, and granular trends without editing the underlying query. This zoom is local to the panel you're interacting with. It doesn't change the dashboard's overall time range or affect other panels. To zoom the whole dashboard's time range instead, see Modify time ranges.
To drill down into a log panel:
- Click and drag across the time window you want to zoom into on a log panel.
 note
noteSumo Logic recalculates the timeslice for the selected range, rounding up to the nearest of these intervals: 1 second, 1 minute, 5 minutes, 10 minutes, 15 minutes, 30 minutes, 1 hour, 6 hours, 1 day, or 1 week. Sumo Logic targets a maximum of 1,500 data points per view, so a shorter selected range results in a finer timeslice.
- The panel re-fetches and displays data at the new granularity. A row of icons appears above the panel for panning and resetting the zoomed view.
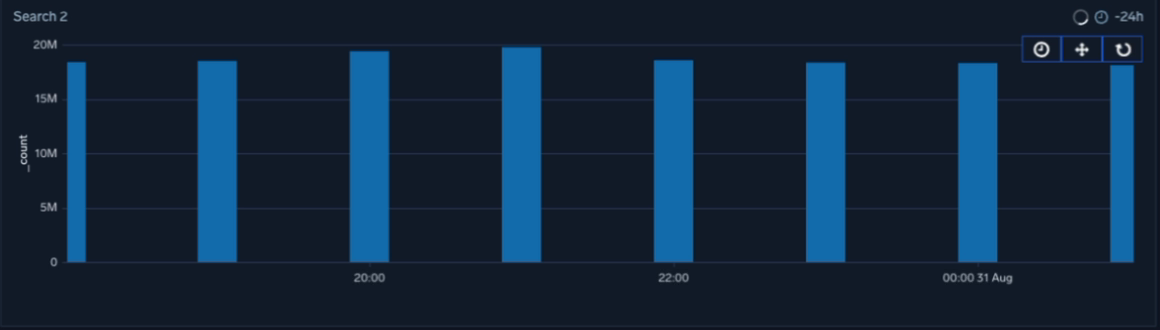
- To drill down further, click and drag again on the zoomed-in view.
- To pan across the zoomed-in time range, use the pan icon above the panel. Sumo Logic pre-fetches adjacent time windows in the background, so panning feels seamless. If you pan past the edge of the original time range, a message lets you know you've reached the edge.
- To return to the panel's original view and granularity, click the reset icon
 above the panel.
If your query already includes an explicit timeslice operator, Sumo Logic rewrites its interval value in place rather than adding a new timeslice operator to the query.
Set default time ranges
A dashboard has a default time range defined by its creator. The default time range is shown in the upper right of a dashboard. The default time range is displayed in gray font.
Modify time ranges
You can modify the time range in panel to zoom in for granular details, especially for charts with larger compliance periods. To do so, select and drag across date/time and click Update dashboard time range button to zoom in further. Now, this time range is considered as a temporary time range and all the time series panels in the dashboard will be zoomed in for the selected time range. This is different from drilling down on a log panel by zooming, which is local to a single panel and doesn't affect other panels. 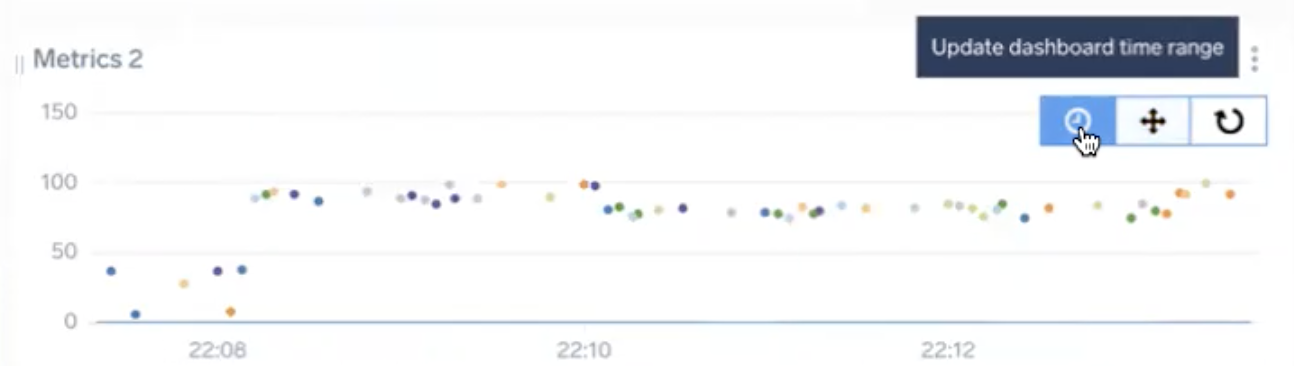
After you do, the new time range is shown in blue, and a more options menu is available that allows you to revert back to the default, or make it the default time range. 
Set default time ranges
As noted above, you can set a new default time range for a dashboard and individual panels. To do so, you open the options menu next to a modified time range (shown in blue), and click Set as Default.
When you make a modified time range the default, the time range appears in grey, and the more options menu is no longer available.
When you change the default time range for the dashboard, the new time range will automatically be applied to all panels on the dashboard, unless you have set a new default time range default for one or more of the dashboard panels. In that case, you’ll be offered the option to Override custom panel time ranges with the dashboard default. If you don’t select that, the existing default time ranges for individual panels will be preserved.
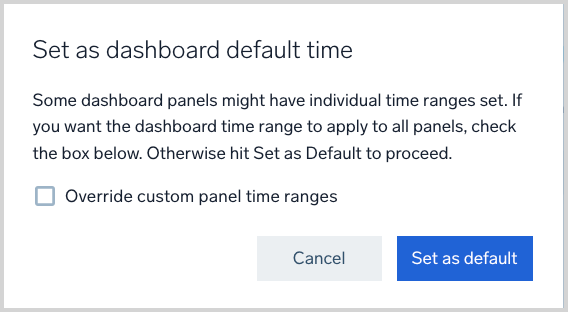
When a default time range is set for a panel, the panel won’t inherit the dashboard’s time range setting. You can change the panel back to inheriting the dashboard's time range by selecting Inherit dashboard's time range for the panel, or using the Override custom panel time ranges option, which causes every dashboard panel to inherit the dashboard's time range selection.