 Meet the new
AI Observability App

This app is in Limited Availability, providing early access to observability capabilities designed to monitor and understand AI workloads. This release offers an opportunity to explore the capabilities and share feedback as we continue to enhance the experience ahead of its planned transition to an in-product experience.
The Sumo Logic app for AI Observability provides preconfigured dashboards and monitors to track the health, performance, cost, and behavior of your AI and LLM applications. Use the app to monitor request volume, error rate, latency, and token consumption; estimate LLM spend; troubleshoot authentication errors, rate limits, and truncated responses; understand agent workflows and tool usage; analyze multi-turn conversations; and review prompts and responses.
The app analyzes OpenTelemetry trace spans that carry GenAI Semantic Convention (gen_ai.*) attributes. It works across LLM providers such as OpenAI, Google Gemini, and Groq, across AI gateways such as Helicone, OpenRouter, and Braintrust, and across frameworks such as LangChain, LangGraph, LlamaIndex, and Haystack.
Any vendor, SDK, or framework that emits spans using the GenAI Semantic Conventions (gen_ai.* attributes) is supported.
Use this app to:
- Track request volume, error rate, latency, and token consumption across models and providers.
- Estimate LLM spend and identify the top cost consumers.
- Troubleshoot authentication errors, rate limits, truncated responses, and slow requests.
- Understand agent workflows, tool usage, and tool failures.
- Analyze multi-turn conversations: turns, tokens, cost, duration, and failures per conversation.
- Review prompts and responses for debugging and auditing.
- Check instrumentation health by SDK, language, and semantic convention version.
Sample logs
The AI Observability app uses OpenTelemetry trace spans exported to Sumo Logic over OTLP/HTTP. The dashboards and monitors query these spans from the _index=_trace_spans index.
The following is a sample LangGraph agent task span (branch:to:agent), as stored in Sumo Logic when exported with OpenLLMetry.
{
  "traceloop.association.properties.langgraph_triggers": "[branch:to:agent]",
  "application": "default",
  "_sourcecategory": "Http Input",
  "traceloop.association.properties.langgraph_step": "3",
  "_source": "AI-LLM-Testing",
  "traceloop.span.kind": "task",
  "gen_ai.task.id": "01a0d821-5b67-76b2-81f4-9b21d3ce34e5",
  "traceloop.entity.path": "agent",
  "gen_ai.task.output": "{\"outputs\": \"end\", \"kwargs\": {\"tags\": [\"seq:step:3\"]}}",
  "gen_ai.task.parent.id": "01a0d821-584c-7391-8dea-0a14a84de51e",
  "traceloop.entity.output": "{\"outputs\": \"end\", \"kwargs\": {\"tags\": [\"seq:step:3\"]}}",
  "_sourcehost": "<source-host-ip>",
  "traceloop.association.properties.langgraph_path": "[__pregel_pull,agent]",
  "gen_ai.task.input": "{\"inputs\": {\"messages\": [{\"lc\": 1, \"type\": \"constructor\", \"id\": [\"langchain\", \"schema\", \"messages\", \"HumanMessage\"], \"kwargs\": {\"content\": \"What is today's date, and what is 47 * 89?\", \"type\": \"human\", \"id\": \"ba58f76a-c837-47a8-86c1-b259fc9c8198\"}}, {\"lc\": 1, \"type\": \"constructor\", \"id\": [\"langchain\", \"schema\", \"messages\", \"AIMessage\"], \"kwargs\": {\"content\": \"\", \"additional_kwargs\": {\"refusal\": null}, \"response_metadata\": {\"token_usage\": {\"completion_tokens\": 31, \"prompt_tokens\": 203, \"total_tokens\": 234, \"completion_tokens_details\": {\"accepted_prediction_tokens\": null, \"audio_tokens\": null, \"reasoning_tokens\": 11, \"rejected_prediction_tokens\": null}, \"prompt_tokens_details\": null, \"queue_time\": 0.345919444, \"prompt_time\": 0.009992713, \"completion_time\": 0.034119296, \"total_time\": 0.044112009}, \"model_provider\": \"openai\", \"model_name\": \"openai/gpt-oss-20b\", \"system_fingerprint\": \"fp_3023a70d60\", \"id\": \"chatcmpl-41437840-17a8-4209-b5a1-5e5e0a504bd4\", \"service_tier\": \"on_demand\", \"finish_reason\": \"tool_calls\", \"logprobs\": null}, \"type\": \"ai\", \"id\": \"lc_run--01a0d821-4b88-7512-9b82-95dc03066141-0\", \"tool_calls\": [{\"name\": \"get_current_date\", \"args\": {}, \"id\": \"fc_790af7ac-66c4-4d1b-bd26-c83d39a75247\", \"type\": \"tool_call\"}], \"usage_metadata\": {\"input_tokens\": 203, \"output_tokens\": 31, \"total_tokens\": 234, \"input_token_details\": {}, \"output_token_details\": {\"reasoning\": 11}}, \"invalid_tool_calls\": []}}, {\"lc\": 1, \"type\": \"constructor\", \"id\": [\"langchain\", \"schema\", \"messages\", \"ToolMessage\"], \"kwargs\": {\"content\": \"2026-09-25\", \"type\": \"tool\", \"id\": \"c37c0562-6387-4238-a495-f4b72dbb7300\", \"tool_call_id\": \"fc_790af7ac-66c4-4d1b-bd26-c83d39a75247\", \"status\": \"success\"}}, {\"lc\": 1, \"type\": \"constructor\", \"id\": [\"langchain\", \"schema\", \"messages\", \"AIMessage\"], \"kwargs\": {\"content\": \"- **Today's date:** 2026‐09‐25  \\n- **47 × 89:** 4,183\", \"additional_kwargs\": {\"refusal\": null}, \"response_metadata\": {\"token_usage\": {\"completion_tokens\": 82, \"prompt_tokens\": 231, \"total_tokens\": 313, \"completion_tokens_details\": {\"accepted_prediction_tokens\": null, \"audio_tokens\": null, \"reasoning_tokens\": 48, \"rejected_prediction_tokens\": null}, \"prompt_tokens_details\": null, \"queue_time\": 0.333773111, \"prompt_time\": 0.011137784, \"completion_time\": 0.083844025, \"total_time\": 0.094981809}, \"model_provider\": \"openai\", \"model_name\": \"openai/gpt-oss-20b\", \"system_fingerprint\": \"fp_1074f9ce08\", \"id\": \"chatcmpl-0d0e77ff-2b67-4b34-bd5b-4e5189b04615\", \"service_tier\": \"on_demand\", \"finish_reason\": \"stop\", \"logprobs\": null}, \"type\": \"ai\", \"id\": \"lc_run--01a0d821-584e-7541-ab6a-81dba289efdf-0\", \"usage_metadata\": {\"input_tokens\": 231, \"output_tokens\": 82, \"total_tokens\": 313, \"input_token_details\": {}, \"output_token_details\": {\"reasoning\": 48}}, \"tool_calls\": [], \"invalid_tool_calls\": []}}]}, \"tags\": [\"seq:step:3\"], \"metadata\": {\"ls_integration\": \"langgraph\", \"langgraph_step\": 3, \"langgraph_node\": \"agent\", \"langgraph_triggers\": [\"branch:to:agent\"], \"langgraph_path\": [\"__pregel_pull\", \"agent\"], \"langgraph_checkpoint_ns\": \"agent:2ea97ae2-01cb-052e-b1b1-e6b4f0d46eee\"}, \"kwargs\": {\"name\": \"should_continue\"}}",
  "telemetry.sdk.version": "1.44.0",
  "_sourcename": "Http Input",
  "_sourceid": "<source-id>",
  "gen_ai.task.name": "should_continue",
  "traceloop.association.properties.ls_integration": "langgraph",
  "gen_ai.operation.name": "execute_task",
  "traceloop.entity.input": "{\"inputs\": {\"messages\": [{\"lc\": 1, \"type\": \"constructor\", \"id\": [\"langchain\", \"schema\", \"messages\", \"HumanMessage\"], \"kwargs\": {\"content\": \"What is today's date, and what is 47 * 89?\", \"type\": \"human\", \"id\": \"ba58f76a-c837-47a8-86c1-b259fc9c8198\"}}, {\"lc\": 1, \"type\": \"constructor\", \"id\": [\"langchain\", \"schema\", \"messages\", \"AIMessage\"], \"kwargs\": {\"content\": \"\", \"additional_kwargs\": {\"refusal\": null}, \"response_metadata\": {\"token_usage\": {\"completion_tokens\": 31, \"prompt_tokens\": 203, \"total_tokens\": 234, \"completion_tokens_details\": {\"accepted_prediction_tokens\": null, \"audio_tokens\": null, \"reasoning_tokens\": 11, \"rejected_prediction_tokens\": null}, \"prompt_tokens_details\": null, \"queue_time\": 0.345919444, \"prompt_time\": 0.009992713, \"completion_time\": 0.034119296, \"total_time\": 0.044112009}, \"model_provider\": \"openai\", \"model_name\": \"openai/gpt-oss-20b\", \"system_fingerprint\": \"fp_3023a70d60\", \"id\": \"chatcmpl-41437840-17a8-4209-b5a1-5e5e0a504bd4\", \"service_tier\": \"on_demand\", \"finish_reason\": \"tool_calls\", \"logprobs\": null}, \"type\": \"ai\", \"id\": \"lc_run--01a0d821-4b88-7512-9b82-95dc03066141-0\", \"tool_calls\": [{\"name\": \"get_current_date\", \"args\": {}, \"id\": \"fc_790af7ac-66c4-4d1b-bd26-c83d39a75247\", \"type\": \"tool_call\"}], \"usage_metadata\": {\"input_tokens\": 203, \"output_tokens\": 31, \"total_tokens\": 234, \"input_token_details\": {}, \"output_token_details\": {\"reasoning\": 11}}, \"invalid_tool_calls\": []}}, {\"lc\": 1, \"type\": \"constructor\", \"id\": [\"langchain\", \"schema\", \"messages\", \"ToolMessage\"], \"kwargs\": {\"content\": \"2026-09-25\", \"type\": \"tool\", \"id\": \"c37c0562-6387-4238-a495-f4b72dbb7300\", \"tool_call_id\": \"fc_790af7ac-66c4-4d1b-bd26-c83d39a75247\", \"status\": \"success\"}}, {\"lc\": 1, \"type\": \"constructor\", \"id\": [\"langchain\", \"schema\", \"messages\", \"AIMessage\"], \"kwargs\": {\"content\": \"- **Today's date:** 2026‐09‐25  \\n- **47 × 89:** 4,183\", \"additional_kwargs\": {\"refusal\": null}, \"response_metadata\": {\"token_usage\": {\"completion_tokens\": 82, \"prompt_tokens\": 231, \"total_tokens\": 313, \"completion_tokens_details\": {\"accepted_prediction_tokens\": null, \"audio_tokens\": null, \"reasoning_tokens\": 48, \"rejected_prediction_tokens\": null}, \"prompt_tokens_details\": null, \"queue_time\": 0.333773111, \"prompt_time\": 0.011137784, \"completion_time\": 0.083844025, \"total_time\": 0.094981809}, \"model_provider\": \"openai\", \"model_name\": \"openai/gpt-oss-20b\", \"system_fingerprint\": \"fp_1074f9ce08\", \"id\": \"chatcmpl-0d0e77ff-2b67-4b34-bd5b-4e5189b04615\", \"service_tier\": \"on_demand\", \"finish_reason\": \"stop\", \"logprobs\": null}, \"type\": \"ai\", \"id\": \"lc_run--01a0d821-584e-7541-ab6a-81dba289efdf-0\", \"usage_metadata\": {\"input_tokens\": 231, \"output_tokens\": 82, \"total_tokens\": 313, \"input_token_details\": {}, \"output_token_details\": {\"reasoning\": 48}}, \"tool_calls\": [], \"invalid_tool_calls\": []}}]}, \"tags\": [\"seq:step:3\"], \"metadata\": {\"ls_integration\": \"langgraph\", \"langgraph_step\": 3, \"langgraph_node\": \"agent\", \"langgraph_triggers\": [\"branch:to:agent\"], \"langgraph_path\": [\"__pregel_pull\", \"agent\"], \"langgraph_checkpoint_ns\": \"agent:2ea97ae2-01cb-052e-b1b1-e6b4f0d46eee\"}, \"kwargs\": {\"name\": \"should_continue\"}}",
  "deployment.environment": "default",
  "service.instance.id": "155062c0-3f15-4951-ba44-e924bf5a704a",
  "traceloop.association.properties.langgraph_node": "agent",
  "traceloop.association.properties.langgraph_checkpoint_ns": "agent:2ea97ae2-01cb-052e-b1b1-e6b4f0d46eee",
  "telemetry.sdk.language": "python",
  "traceloop.workflow.name": "LangGraph",
  "telemetry.sdk.name": "opentelemetry",
  "traceloop.entity.name": "should_continue",
  "service.name": "langgraph-openllmetry",
  "_collector": "<collector-name>",
  "gen_ai.provider.name": "langgraph",
  "gen_ai.task.status": "success"
}
How it works
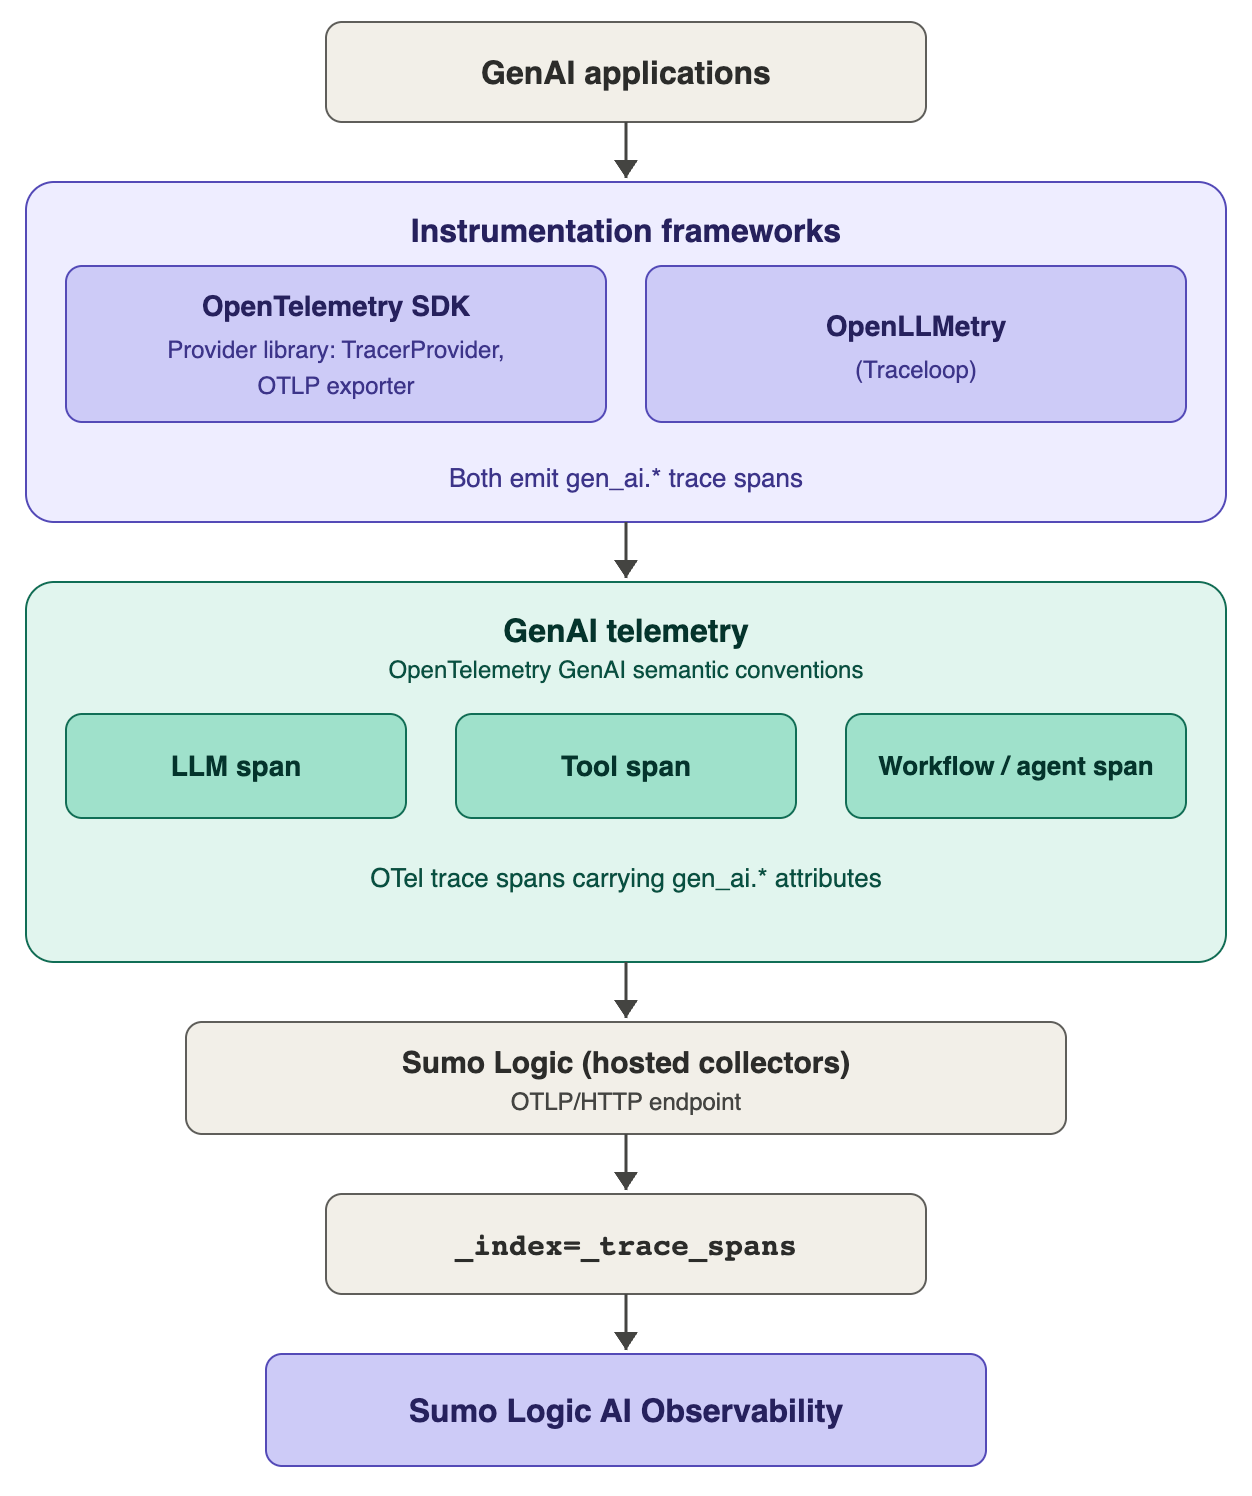
Your application emits OTel trace spans with gen_ai.* attributes, the spans are exported via OTLP/HTTP to Sumo Logic, and the app dashboards and monitors query those spans from _index=_trace_spans.
Key terms
| Term | Description |
|---|---|
| Span | A single unit of work in your LLM application, such as one chat completion call, one tool execution, or one agent workflow. Each span carries gen_ai.* attributes describing the request, response, model, tokens, and latency. |
| Trace | A collection of related spans that form a complete request. For a simple LLM call this is one span. For an agent workflow it can include workflow, LLM, and tool spans in a parent-child tree. |
| LLM span | A span representing a direct call to a language model. Key attributes: gen_ai.request.model, gen_ai.usage.input_tokens, gen_ai.usage.output_tokens, gen_ai.response.finish_reasons. |
| Tool span | A span representing a tool or function execution triggered by the LLM. Key attributes: gen_ai.tool.name, gen_ai.tool.call.arguments, gen_ai.tool.call.result, gen_ai.task.status. |
| Workflow span | A span representing an agent or chain orchestration that groups multiple LLM and tool spans. |
| Conversation | A multi-turn session made up of several LLM calls, possibly across multiple traces, linked by a shared gen_ai.conversation.id. Your application must set this attribute; it is not populated by default. |
| Turn | One LLM call (span with gen_ai.request.model) within a conversation. In agent flows, a single user message can produce several turns. |
| Provider | The LLM backend serving the request, such as OpenAI, Gemini, or Groq. Captured in gen_ai.provider.name. |
| Model | The specific model used, such as gpt-4o-mini, openai/gpt-oss-20b, or gemini-2.5-flash. Captured in gen_ai.request.model. |
| Finish reason | Why the LLM stopped generating: stop (natural end), length (hit max tokens), or tool_call (wants to call a tool). Captured in gen_ai.response.finish_reasons. |
Core attributes
| Attribute | Description |
|---|---|
gen_ai.request.model | Model requested. |
gen_ai.response.model | Model actually used in the response. |
gen_ai.provider.name | LLM provider (for example, openai, gemini, groq). |
gen_ai.usage.input_tokens | Input (prompt) token count. |
gen_ai.usage.output_tokens | Output (completion) token count. |
gen_ai.usage.reasoning_tokens | Reasoning token count. |
gen_ai.usage.cache_read.input_tokens | Cached input token count. |
gen_ai.request.max_tokens | Maximum tokens requested. |
gen_ai.request.temperature | Temperature setting. |
gen_ai.response.finish_reasons | Why generation stopped (for example, stop, length, tool_call). |
gen_ai.response.id | Response identifier. |
gen_ai.is_streaming | Whether the request was streaming. |
gen_ai.operation.name | Operation type (for example, chat, generate_content, execute_tool). |
gen_ai.conversation.id | Conversation or session identifier that links related LLM calls. Required for the Conversation Analytics dashboard and the conversation_id filter. |
gen_ai.input.messages | Prompt content (captured by OpenLLMetry). |
gen_ai.output.messages | Response content (captured by OpenLLMetry). |
gen_ai.system_instructions | System prompt text. |
gen_ai.tool.name | Tool or function name. |
gen_ai.tool.definitions | Tool schema definitions. |
gen_ai.tool.call.arguments | Arguments passed to the tool. |
gen_ai.tool.call.result | Tool execution result. |
gen_ai.task.status | Task execution status. |
server.address | API endpoint hostname. |
deployment.environment | Deployment environment (for example, production, staging). |
_sourcecategory | Source category of the OTLP/HTTP source that received the span. Used by the _sourceCategory filter and comparison panels. |
Collection setup
Step 1: Create an OTLP/HTTP Source
- New UI. In the Sumo Logic main menu select Data Management, and then under Data Collection select Collection. You can also click the Go To... menu at the top of the screen and select Collection.
Classic UI. In the main Sumo Logic menu, select Manage Data > Collection > Collection. - Select an existing hosted collector, or click Add Collector and then Hosted Collector to create one.
- Click Add Source next to the hosted collector.
- Select OTLP/HTTP.
- Enter a Name for the source. Description is optional.
- (Optional) For Source Category, enter a value that identifies the LLM vendor and instrumentation method sending the spans (for example,
ai/openai/opentelemetry). - Click Save.
- Copy the generated Source URL.
Create one OTLP/HTTP source for each LLM vendor or instrumentation method, and give each source its own source category. For example:
| Workload | Instrumentation method | Source category |
|---|---|---|
| OpenAI SDK | OpenTelemetry | ai/openai/opentelemetry |
| Google Gemini | OpenTelemetry | ai/gemini/opentelemetry |
| Groq (native SDK) | OpenLLMetry | ai/groq/openllmetry |
| LangGraph agent | OpenLLMetry | ai/langgraph/openllmetry |
| OpenRouter gateway | OpenTelemetry | ai/openrouter/opentelemetry |
You can then use the _sourceCategory filter on any AI Observability dashboard to view one vendor or method, or use a wildcard such as ai/*/openllmetry to view every OpenLLMetry workload. The _sourceCategory comparison panels show requests, errors, latency, tokens, and cost for each category side by side.
This is useful when gen_ai.provider.name alone cannot tell workloads apart. For example, Groq and other AI gateways called through the OpenAI SDK report the provider as openai. Spans from a source without a category appear as unknown in the comparison panels.
For more information, see OTLP/HTTP Source.
Step 2: Set the endpoint in your application
Set the source URL in your application's environment. The variable depends on the instrumentation method:
# OpenTelemetry
export OTEL_EXPORTER_OTLP_ENDPOINT="<your source URL>"
# OpenLLMetry
export TRACELOOP_BASE_URL="<your source URL>"
Step 3: Instrument your application
Instrument your application using either plain OpenTelemetry or OpenLLMetry. Both produce gen_ai.* attributes.
To populate the Conversation Analytics dashboard, set gen_ai.conversation.id on each LLM span with an identifier shared by all calls in the same conversation or session. Do not put personal data or secrets in this ID.
For example, to tag every call in a chat session with the same ID:
# OpenTelemetry: wrap each turn in a workflow; nested LLM spans inherit the ID
from opentelemetry.util.genai.handler import TelemetryHandler

handler = TelemetryHandler(tracer_provider=provider)
with handler.workflow("chat_session", conversation_id="session-123"):
    response = client.chat.completions.create(...)

# OpenLLMetry: set the ID once before your LLM calls
from traceloop.sdk.tracing import set_conversation_id

set_conversation_id("session-123")
response = client.chat.completions.create(...)
LangChain and LangGraph take the ID from the run config instead. See Track conversations for OpenTelemetry and OpenLLMetry.
Instrumentation methods
| Method | How | Best for |
|---|---|---|
| OpenTelemetry (plain OTel) | Install a per-provider instrumentor and configure the TracerProvider and OTLP exporter. | Minimal dependencies and a pure-spec setup. |
| OpenLLMetry (Traceloop SDK) | Run pip install traceloop-sdk and call Traceloop.init(). | Broad provider and framework coverage. Captures prompts and responses by default. |
Supported providers and frameworks
| Provider / framework | Plain OTel | OpenLLMetry |
|---|---|---|
| OpenAI | Yes | Yes |
| Google Gemini | Yes | Yes |
| Groq | Yes (via OpenAI SDK) | Yes (native SDK) |
| AI gateways (Helicone, OpenRouter, Braintrust) | Yes (via OpenAI SDK) | Yes (via OpenAI SDK) |
| LangChain | Yes | Yes |
| LangGraph | Yes | Yes |
| LlamaIndex | Yes | Yes |
| Haystack | No | Yes |
AI gateways report the provider as openai. Use the Gateway / API Base Distribution panel (server.address) to split traffic by gateway.
Step 4: Verify data collection
Run your application, and then run the following log search to verify that spans are arriving:
_index=_trace_spans service="<your-service-name>"
The service name comes from the service.name resource attribute (or the OTEL_SERVICE_NAME environment variable). OpenTelemetry does not restrict its format, and names with spaces are supported. We recommend a stable, lowercase name without spaces (for example, support-chatbot) and keeping the environment in deployment.environment instead of the service name.
Illustrative collection architecture
Installing the AI Observability app
To install the app, do the following:
Next-Gen App: To install or update the app, you must be an account administrator or a user with Manage Apps, Manage Monitors, Manage Fields, Manage Metric Rules, and Manage Collectors capabilities depending upon the different content types part of the app.
- Select App Catalog.
- In the 🔎 Search Apps field, run a search for your desired app, then select it.
- Click Install App.
note
Sometimes this button says Add Integration.
- Click Next in the Setup Data section.
- In the Configure section of your respective app, complete the following fields.
- Field Name. If you already have collectors and sources set up, select the configured metadata field name (eg _sourcecategory) or specify other custom metadata (eg: _collector) along with its metadata Field Value.
- Click Next. You will be redirected to the Preview & Done section.
Post-installation
Once your app is installed, it will appear in your Installed Apps folder, and dashboard panels will start to fill automatically.
Each panel slowly fills with data matching the time range query received since the panel was created. Results will not immediately be available but will be updated with full graphs and charts over time.
Viewing AI Observability dashboards
All dashboards have a set of filters that you can apply to the entire dashboard. Use these filters to drill down and examine the data to a granular level.
- You can change the time range for a dashboard or panel by selecting a predefined interval from a drop-down list, choosing a recently used time range, or specifying custom dates and times. Learn more.
- You can use template variables to drill down and examine the data on a granular level. For more information, see Filtering Dashboards with Template Variables.
- Most Next-Gen apps allow you to provide the scope at the installation time and are comprised of a key (
_sourceCategoryby default) and a default value for this key. Based on your input, the app dashboards will be parameterized with a dashboard variable, allowing you to change the dataset queried by all panels. This eliminates the need to create multiple copies of the same dashboard with different queries.
All dashboards include the following filters:
| Filter | Description |
|---|---|
service | Service name (service.name). Service names that contain spaces are supported. |
_sourceCategory | Source category of the OTLP/HTTP source receiving the spans. Use it to scope or compare LLM workloads by team, application, or project. Spans without a source category are shown as unknown in the per-_sourceCategory panels. |
environment | Deployment environment (deployment.environment). |
model | Requested model (gen_ai.request.model). |
provider | LLM provider (gen_ai.provider.name). |
trace_id | Scope a dashboard to a single trace. Lists the 100 traces with the most spans; you can also type a trace ID. |
span_id | Scope a dashboard to a single span. Lists the 100 most frequent span IDs; you can also type a span ID. |
statuscode | Span status (for example, OK, ERROR, UNSET). |
The Overview, Agent and Workflow Intelligence, Cost Analytics, Errors and Reliability, Performance and Latency, Prompt and Response Analytics, Token Usage, and Conversation Analytics dashboards also include a conversation_id filter, so you can scope a dashboard to a single conversation. The Agent and Workflow Intelligence dashboard additionally includes tool_name and workflow_name filters. The Performance and Latency dashboard includes a percentile filter (50, 75, 90, 95, 99, 99.9; default 95) that controls the percentile used by the Slowest Workflows (Selected Percentile) panel.
Each dashboard also includes _sourceCategory comparison panels, so you can compare requests, traces, latency, errors, cost, tokens, conversations, tool failures, and model usage across source categories without leaving the dashboard.
Overview
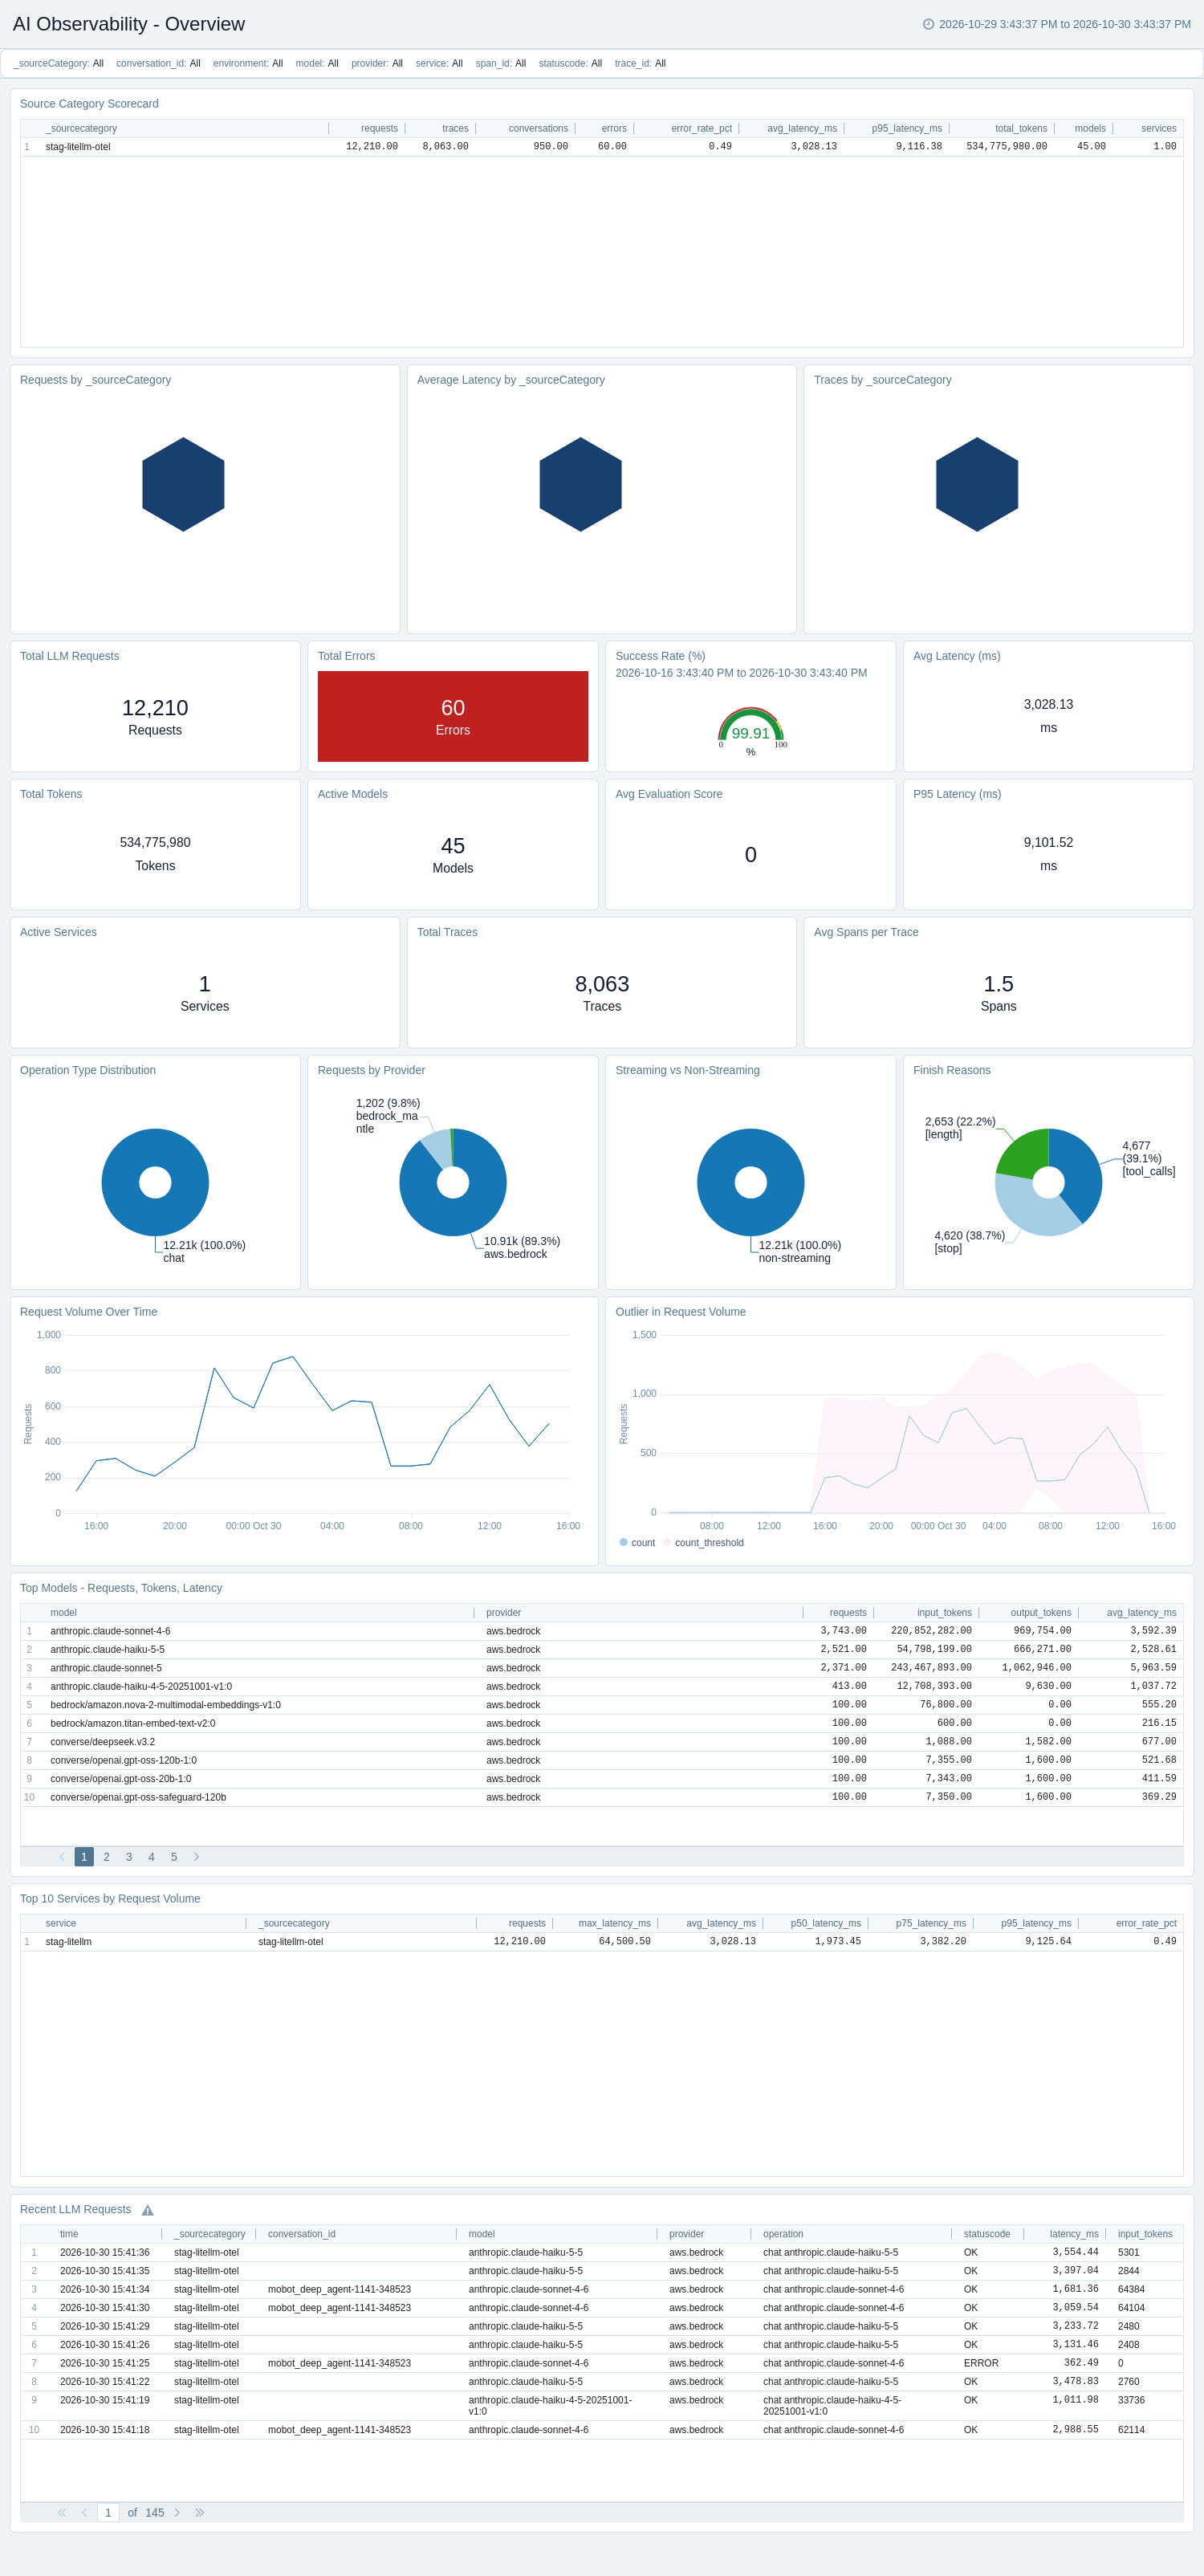
The AI Observability - Overview dashboard provides a single-pane view of AI workload health across all LLM providers. Use the source category scorecard to compare every _sourceCategory side by side by requests, unique traces and conversations, errors and error rate, average and P95 latency, tokens, models, and services, along with requests, traces, and average latency by _sourceCategory. Use this dashboard to monitor total LLM requests, total traces, errors, success rate, average and P95 latency, total tokens, and average evaluation score. Identify active models and services, top services by request volume, top models by requests, tokens, and latency, requests by provider, operation type distribution, and finish reasons to understand usage patterns. Analyze request volume over time, request volume outliers, streaming versus non-streaming split, average spans per trace, and recent LLM requests for troubleshooting.
Agent and Workflow Intelligence
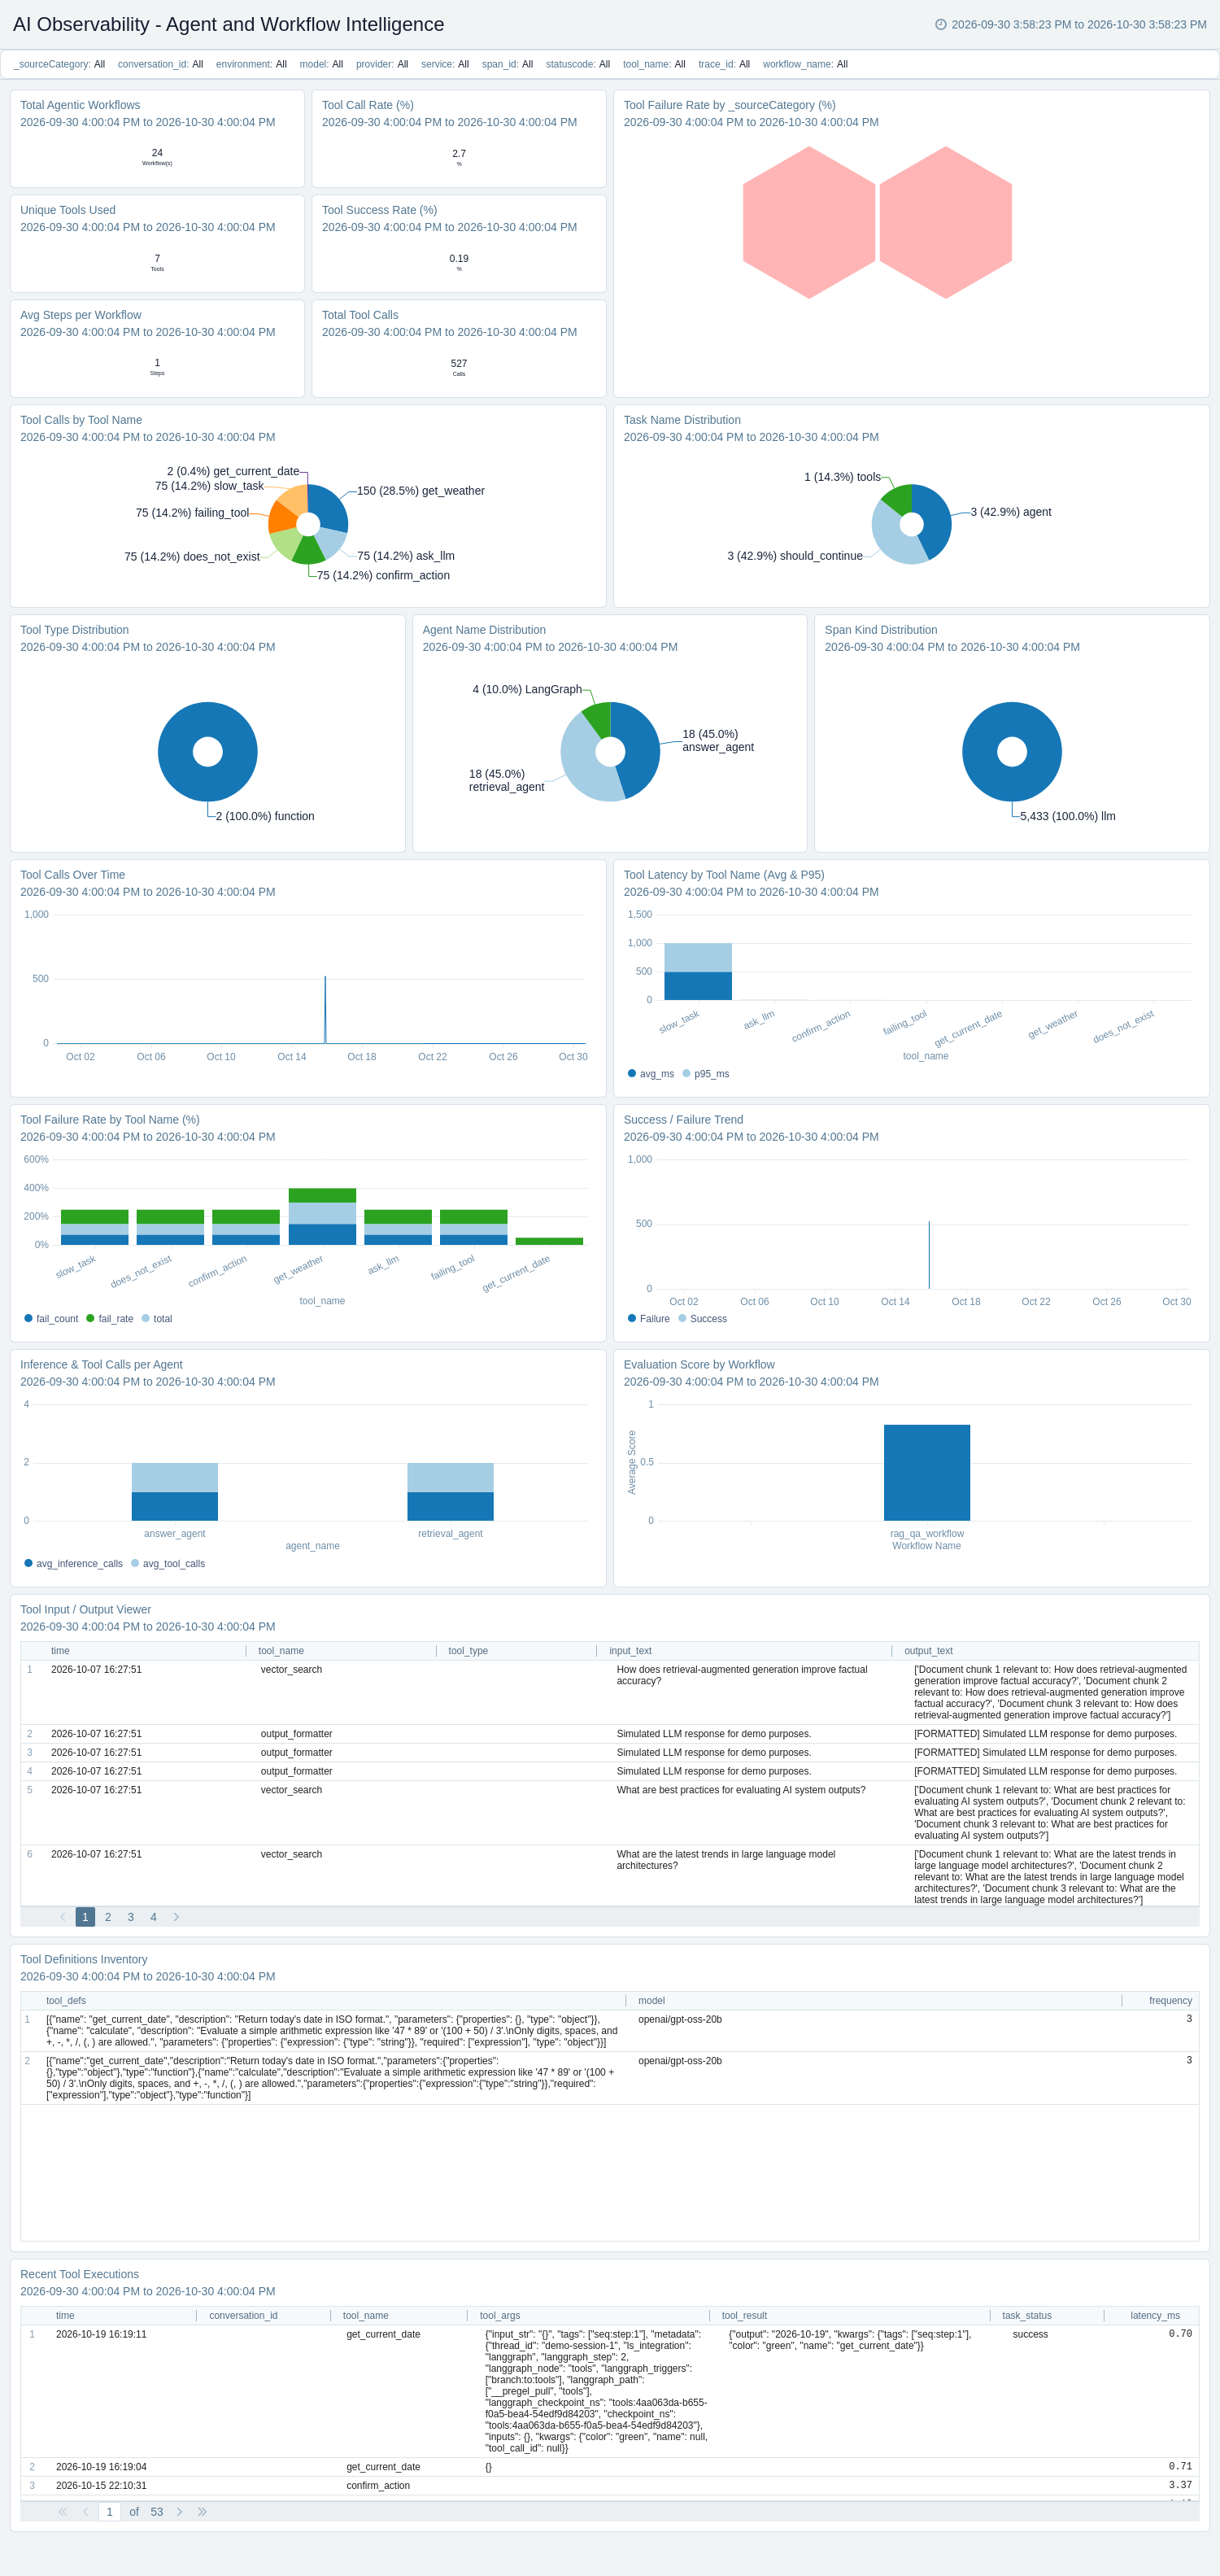
The AI Observability - Agent and Workflow Intelligence dashboard provides visibility into tool and function calling and agent workflows. Use this dashboard to monitor total agentic workflows, total tool calls, tool call rate, tool success rate, unique tools used, and average steps per workflow. Identify tool latency and failure rate by tool name and tool failure rate by _sourceCategory, success and failure trends, and inference and tool calls per agent to troubleshoot unreliable tool integrations. Analyze span kind, agent name, task name, and tool type distribution, evaluation score by workflow, the tool definitions inventory, recent tool executions, and the tool input and output viewer for workflow auditing and optimization.
Cost Analytics
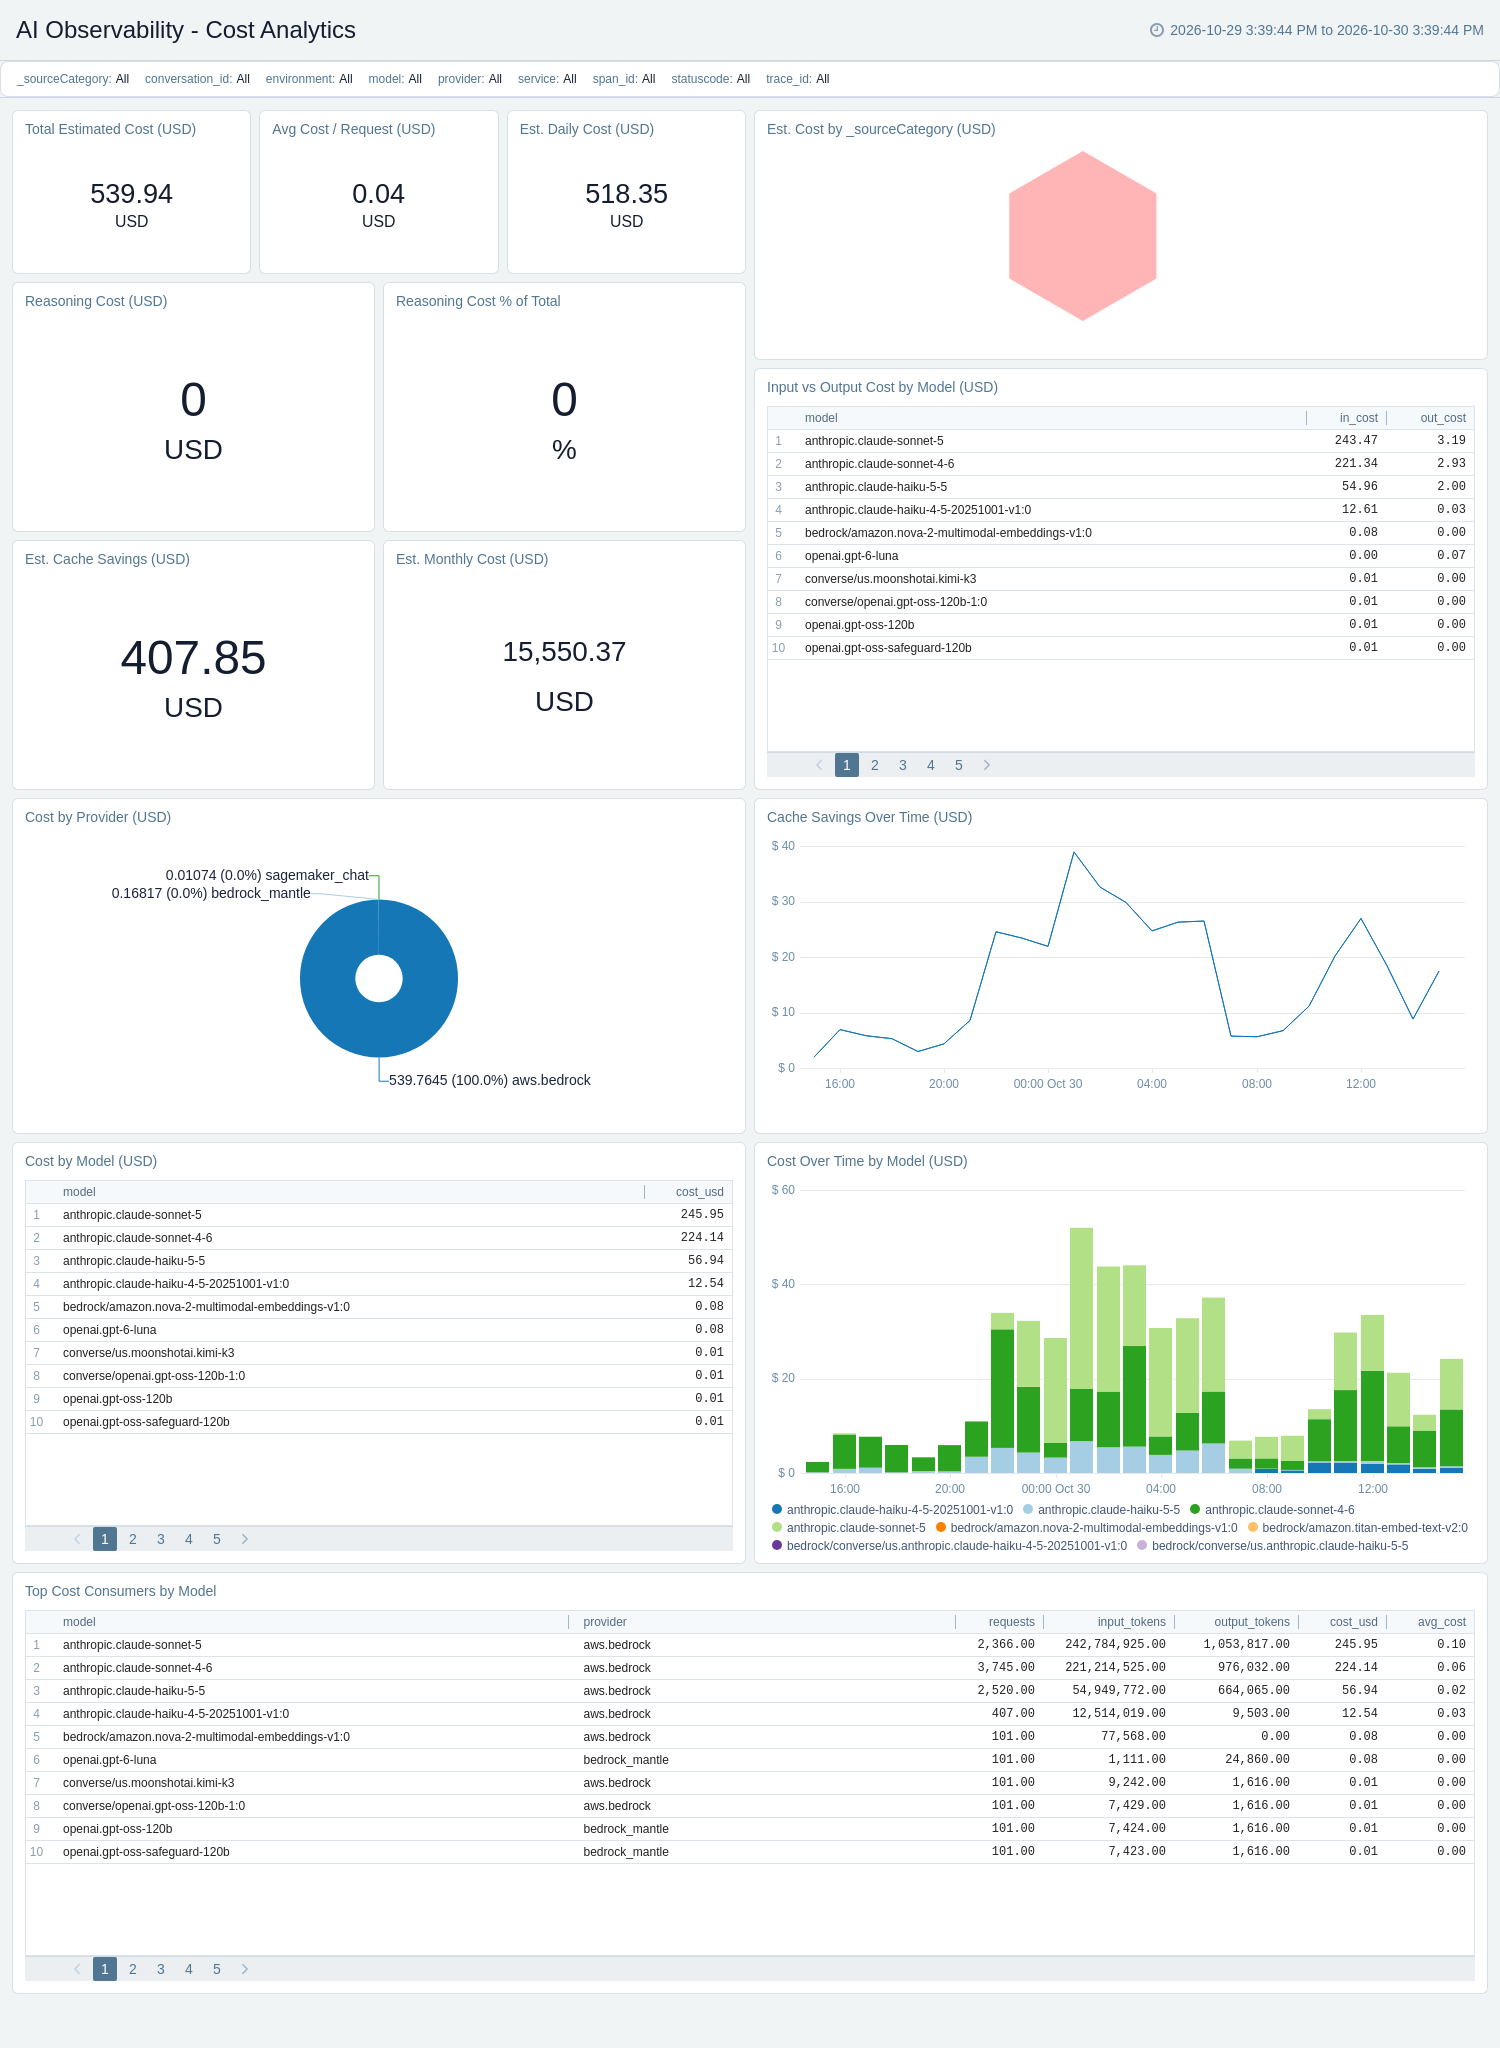
The AI Observability - Cost Analytics dashboard provides estimated LLM spend by model, provider, and time using a per-model list-price mapping. Use this dashboard to monitor total estimated cost, average cost per request, and daily and monthly cost projections. Identify top cost consumers, cost by model, provider, and _sourceCategory, and the input versus output cost split across models. Analyze estimated cache savings and cache savings over time, reasoning cost, and reasoning cost as a percentage of total for budgeting and cost optimization.
Developer and Service Observability
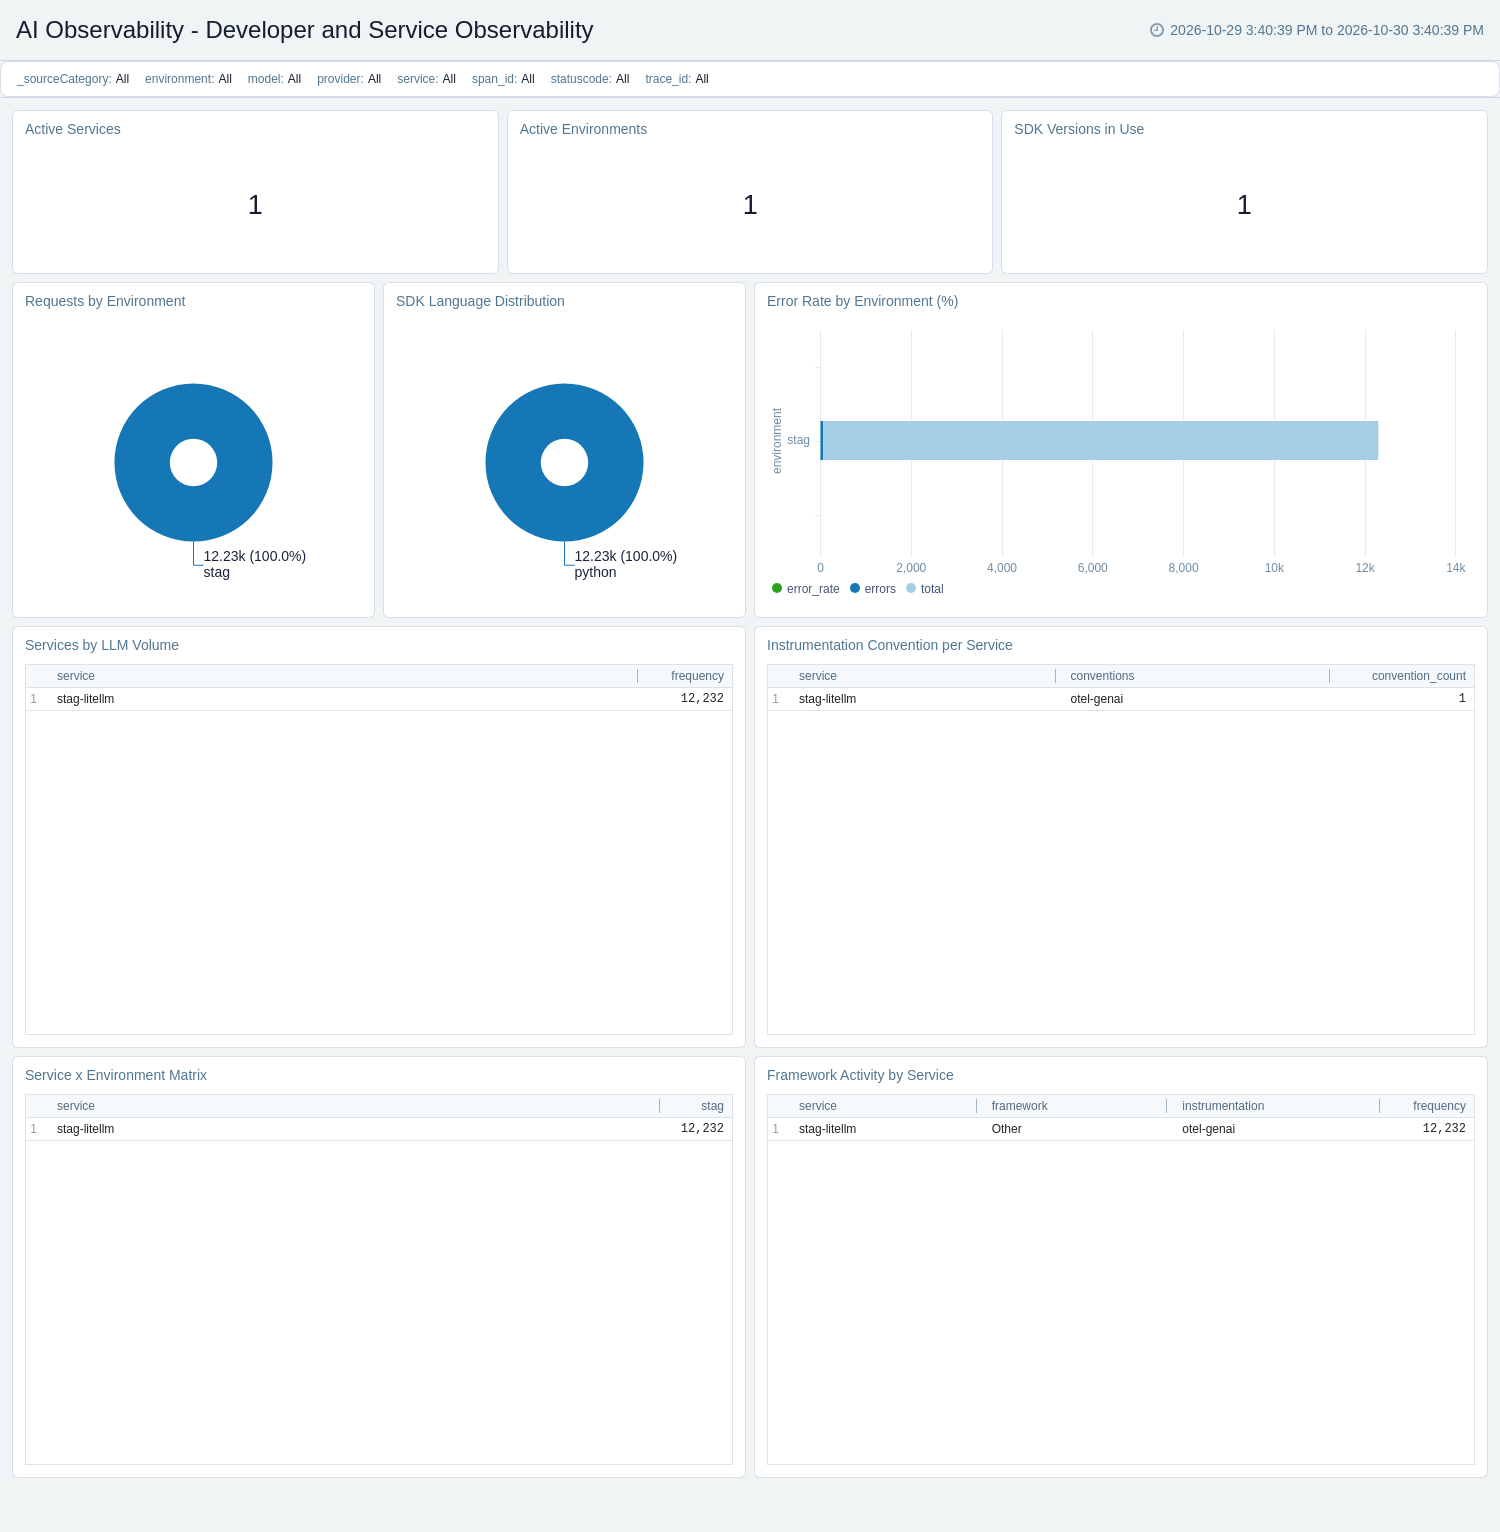
The AI Observability - Developer and Service Observability dashboard provides visibility into instrumentation health and service topology across LLM applications. Use this dashboard to monitor active services and environments, SDK versions in use, and SDK language distribution to ensure consistent instrumentation. Identify services by LLM volume, instrumentation convention per service, and framework activity by service. Analyze requests and error rate by environment and the service by environment matrix for coverage validation and telemetry quality assessment.
Errors and Reliability
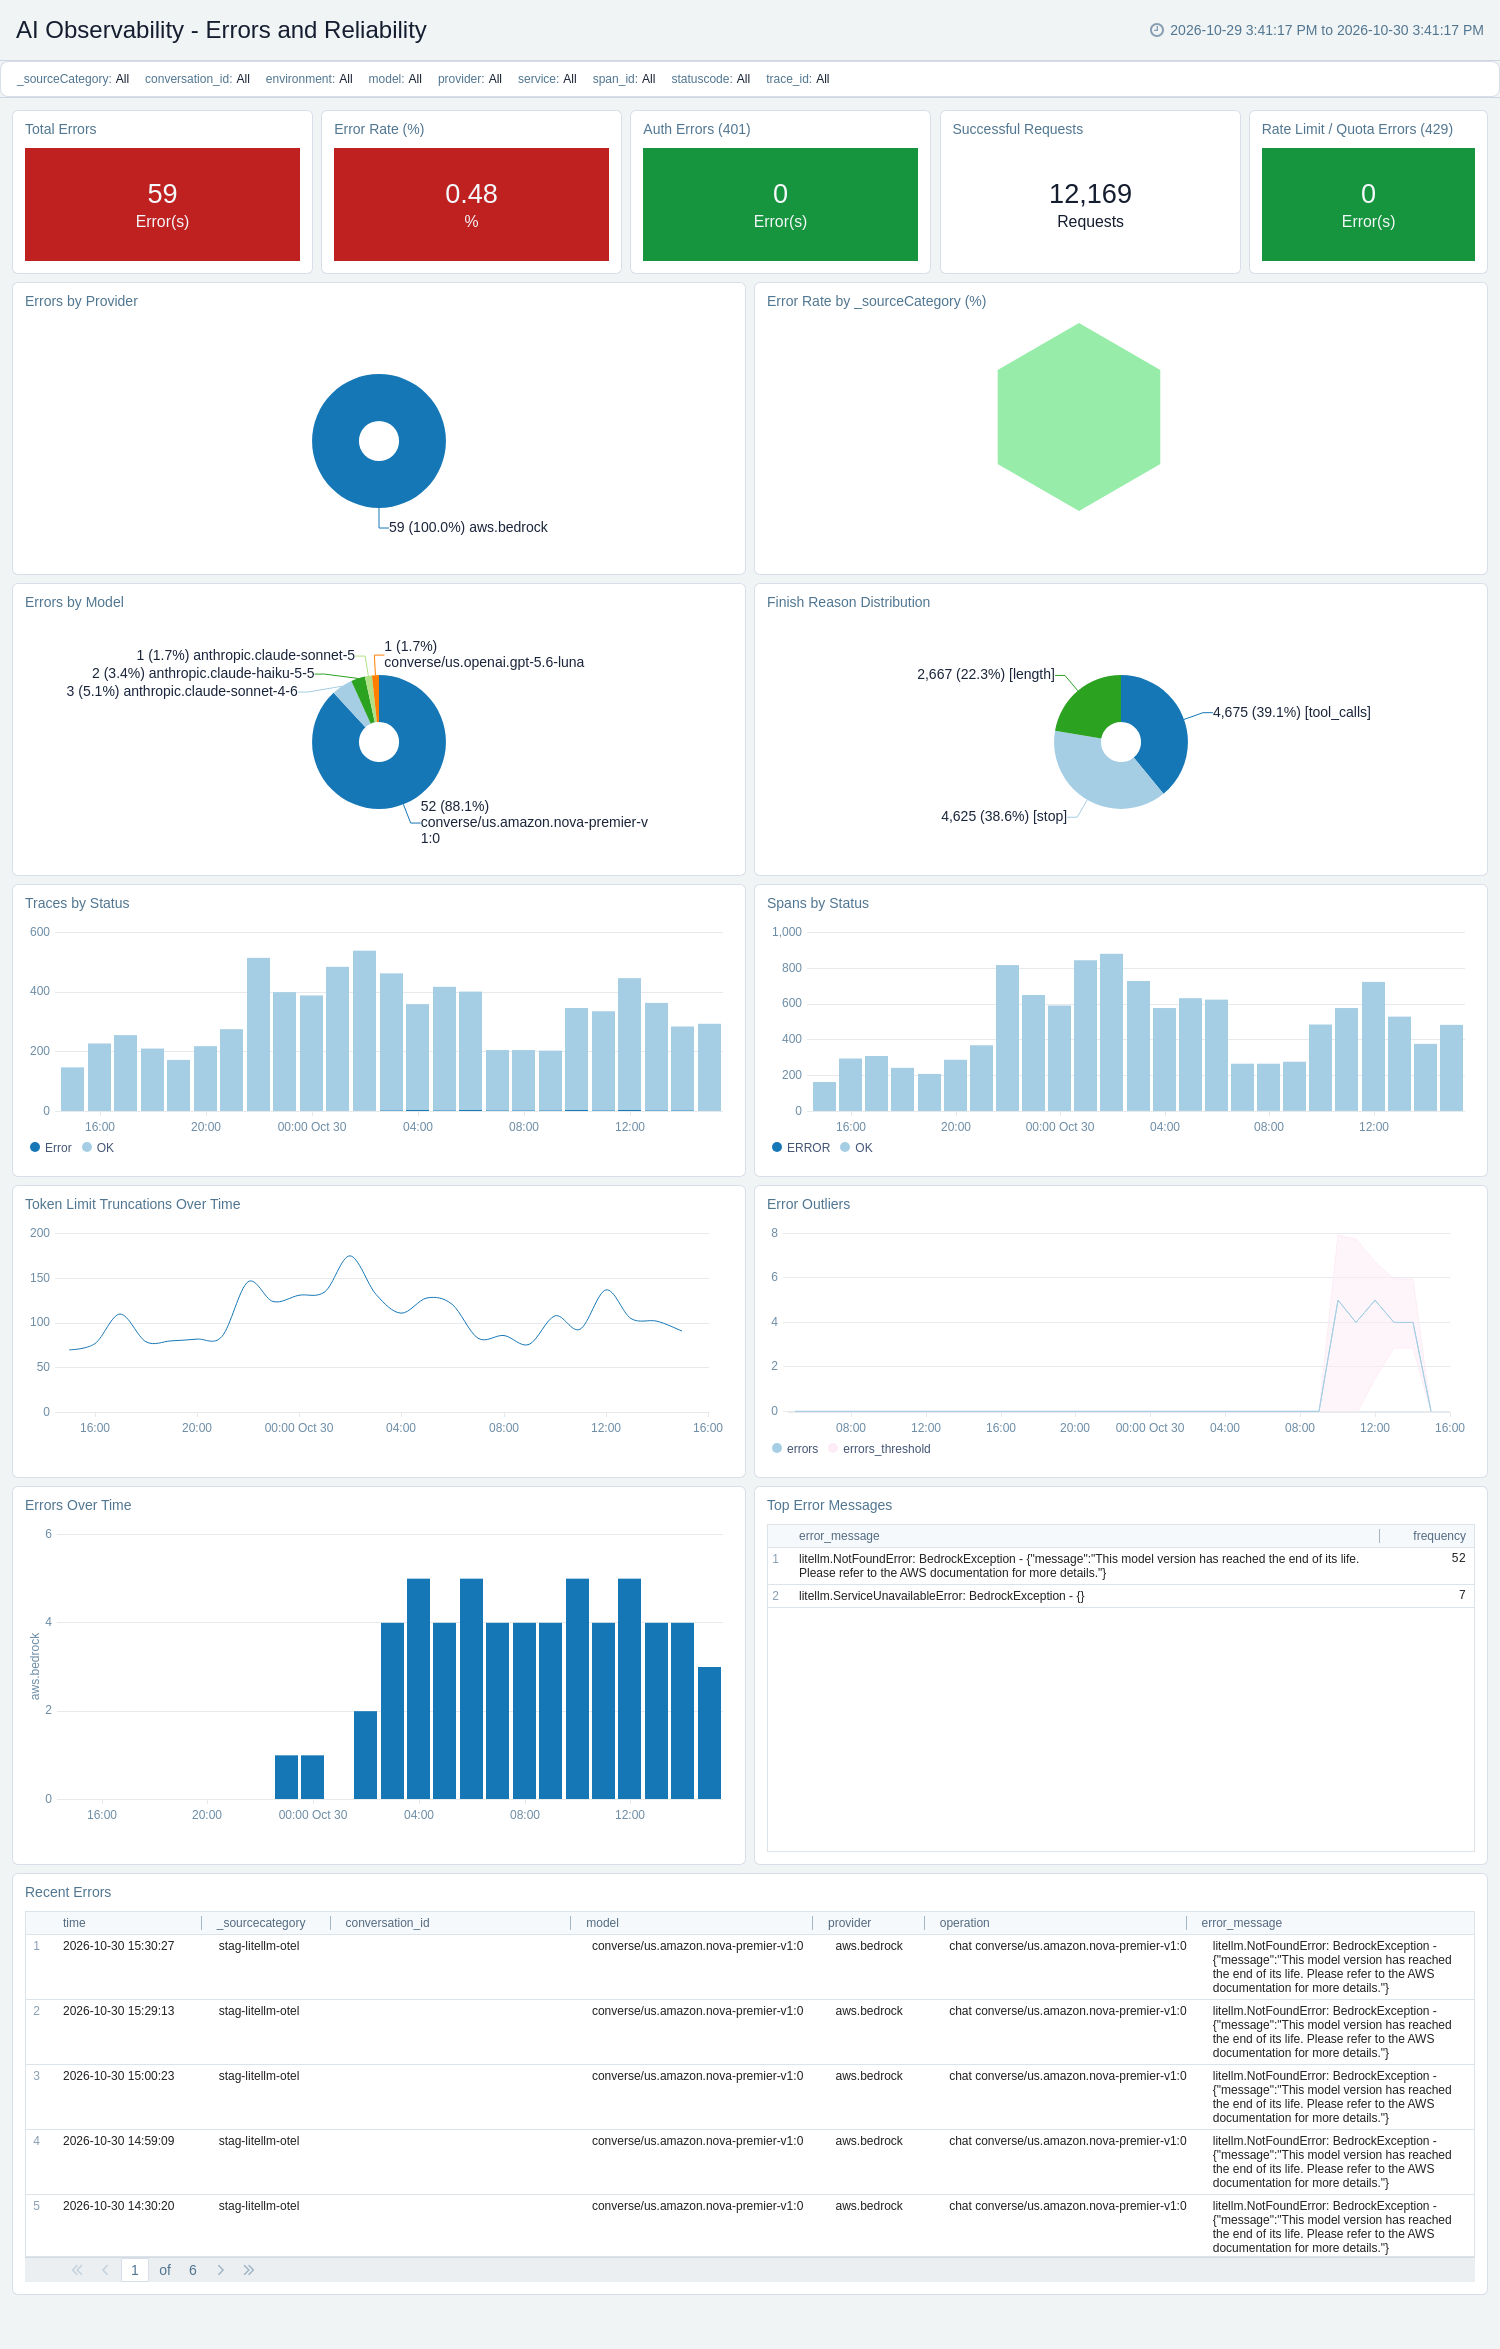
The AI Observability - Errors and Reliability dashboard provides visibility into LLM error patterns and reliability across models and providers. Use this dashboard to monitor total errors, error rate, error rate by _sourceCategory, and successful requests. Identify authentication (401) and rate-limit or quota (429) errors, and analyze errors by model and provider, errors over time, and traces and spans by status to troubleshoot failures. Track finish reason distribution, token limit truncations over time, error outliers, top error messages, and recent errors for incident response.
Model and Provider Intelligence
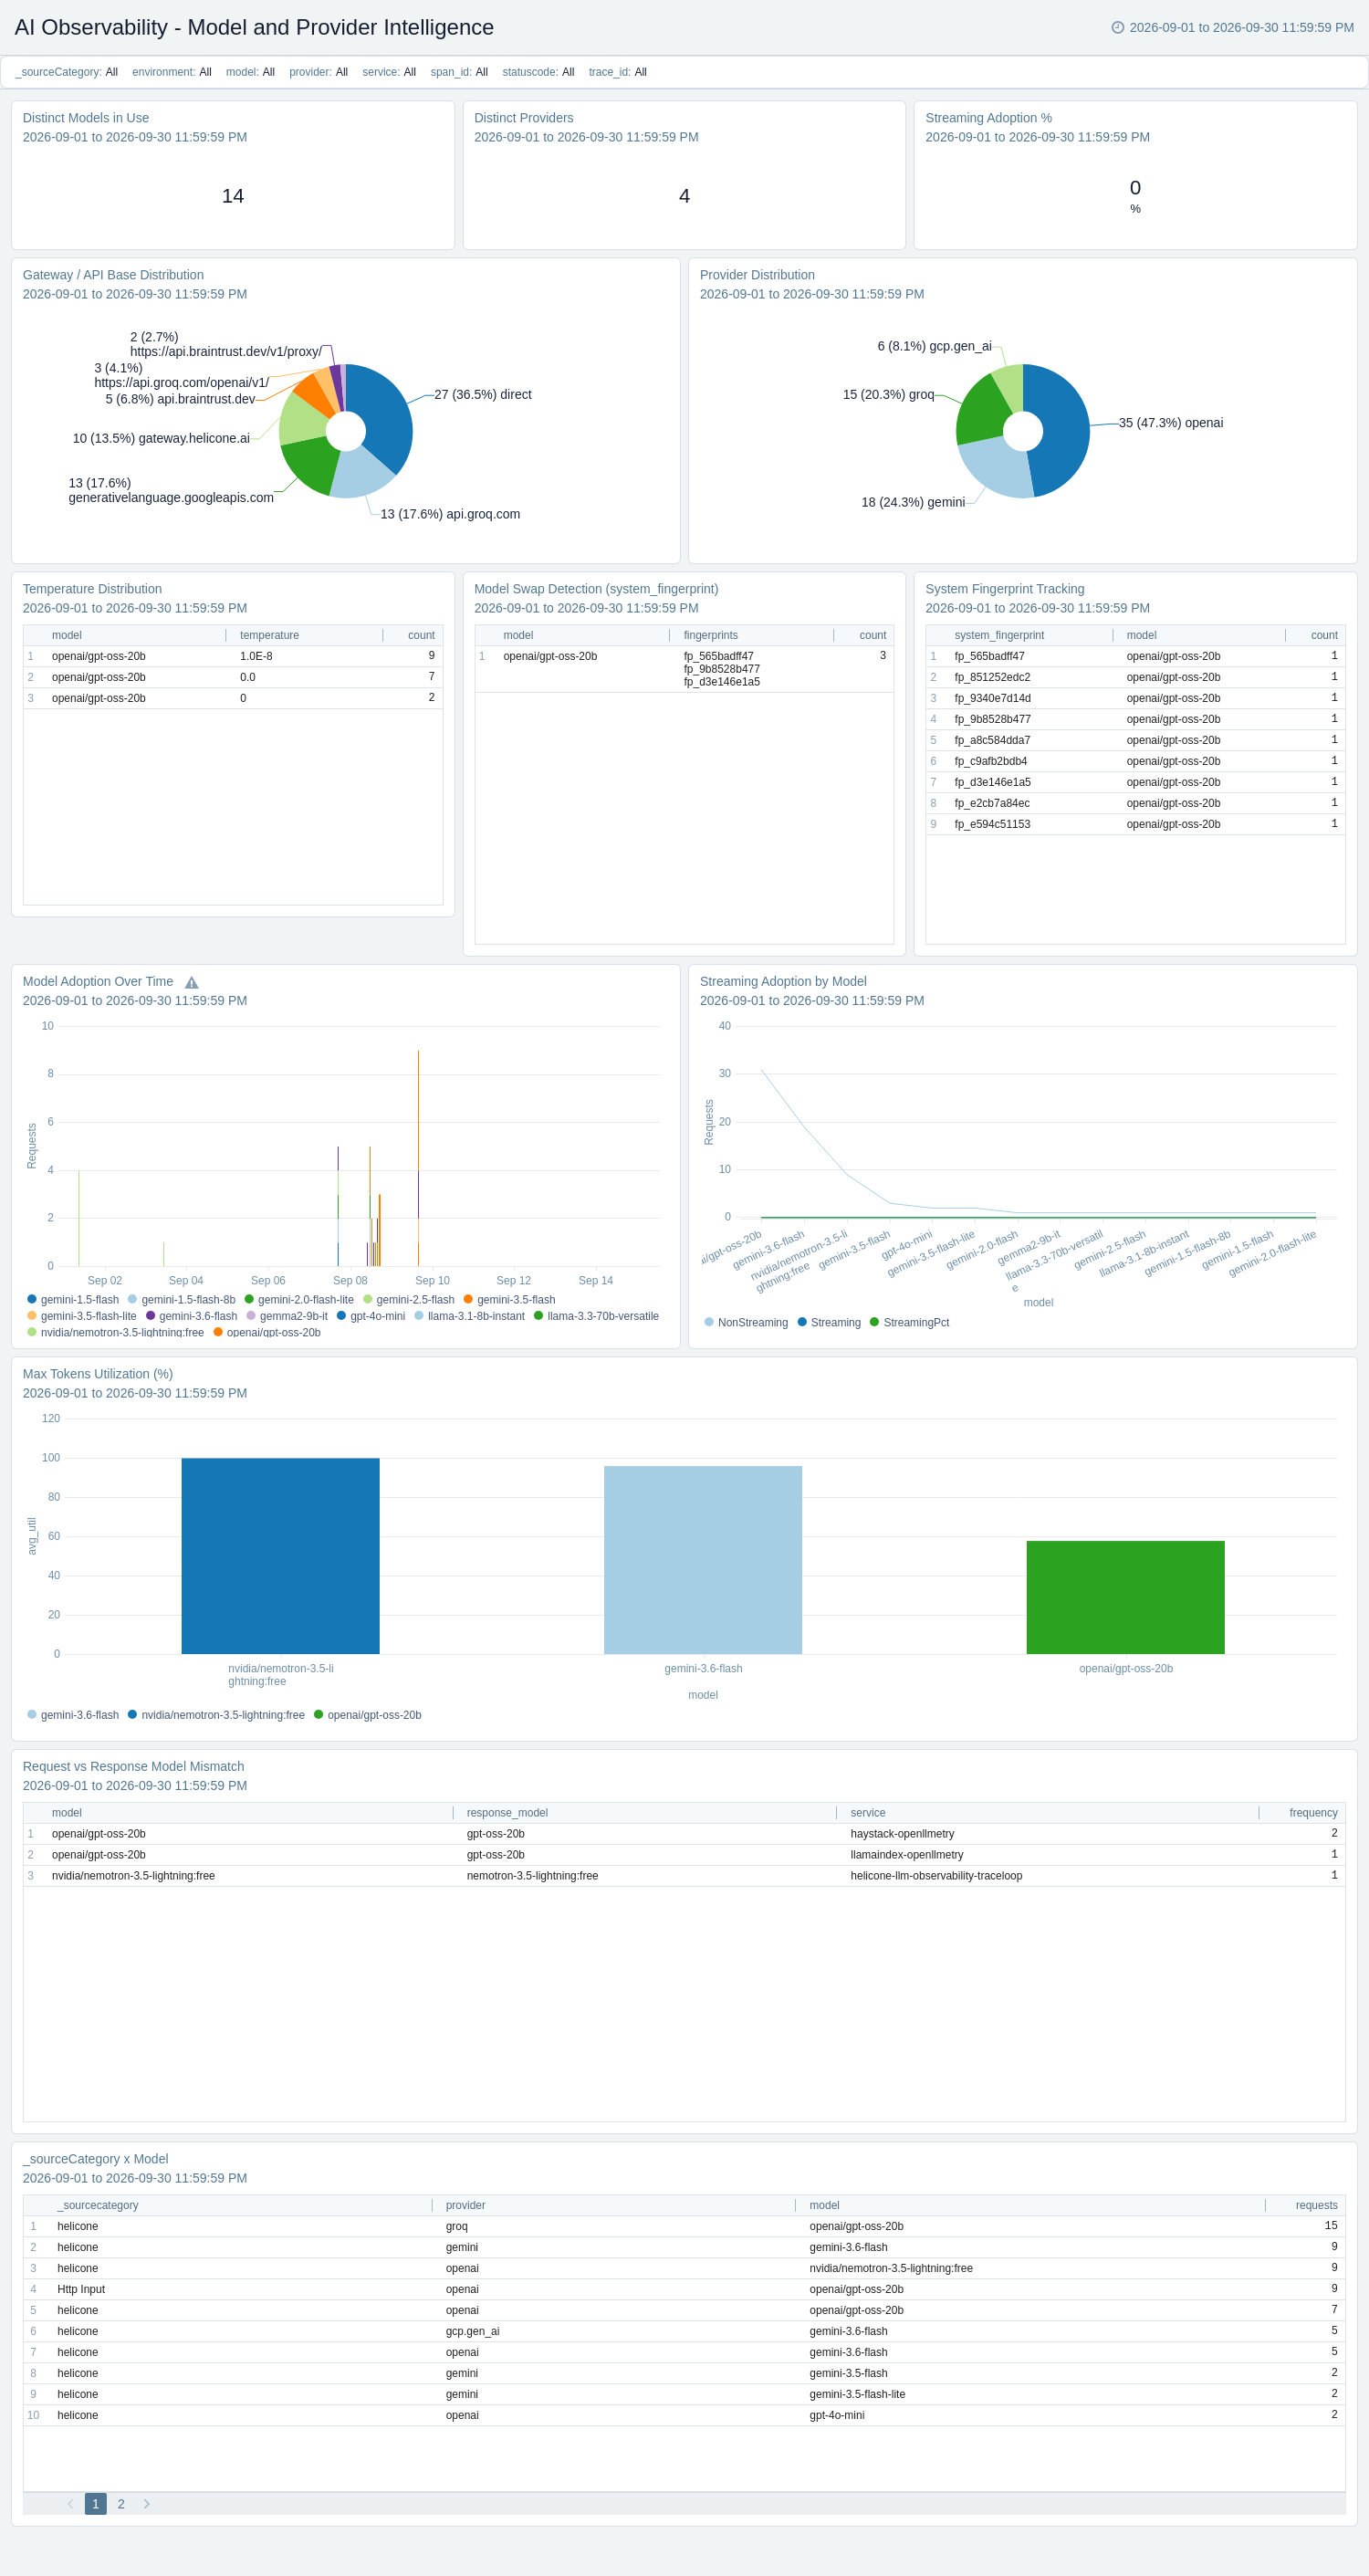
The AI Observability - Model and Provider Intelligence dashboard provides a governance view of model adoption and provider distribution across LLM workloads. Use this dashboard to monitor distinct models and providers in use, provider distribution, and model adoption over time. Track streaming adoption overall and by model, and detect request versus response model mismatches. Analyze temperature distribution, max tokens utilization, gateway and API base distribution, system fingerprint tracking, model swap detection, and the models and providers used by each _sourceCategory for governance and optimization.
Performance and Latency
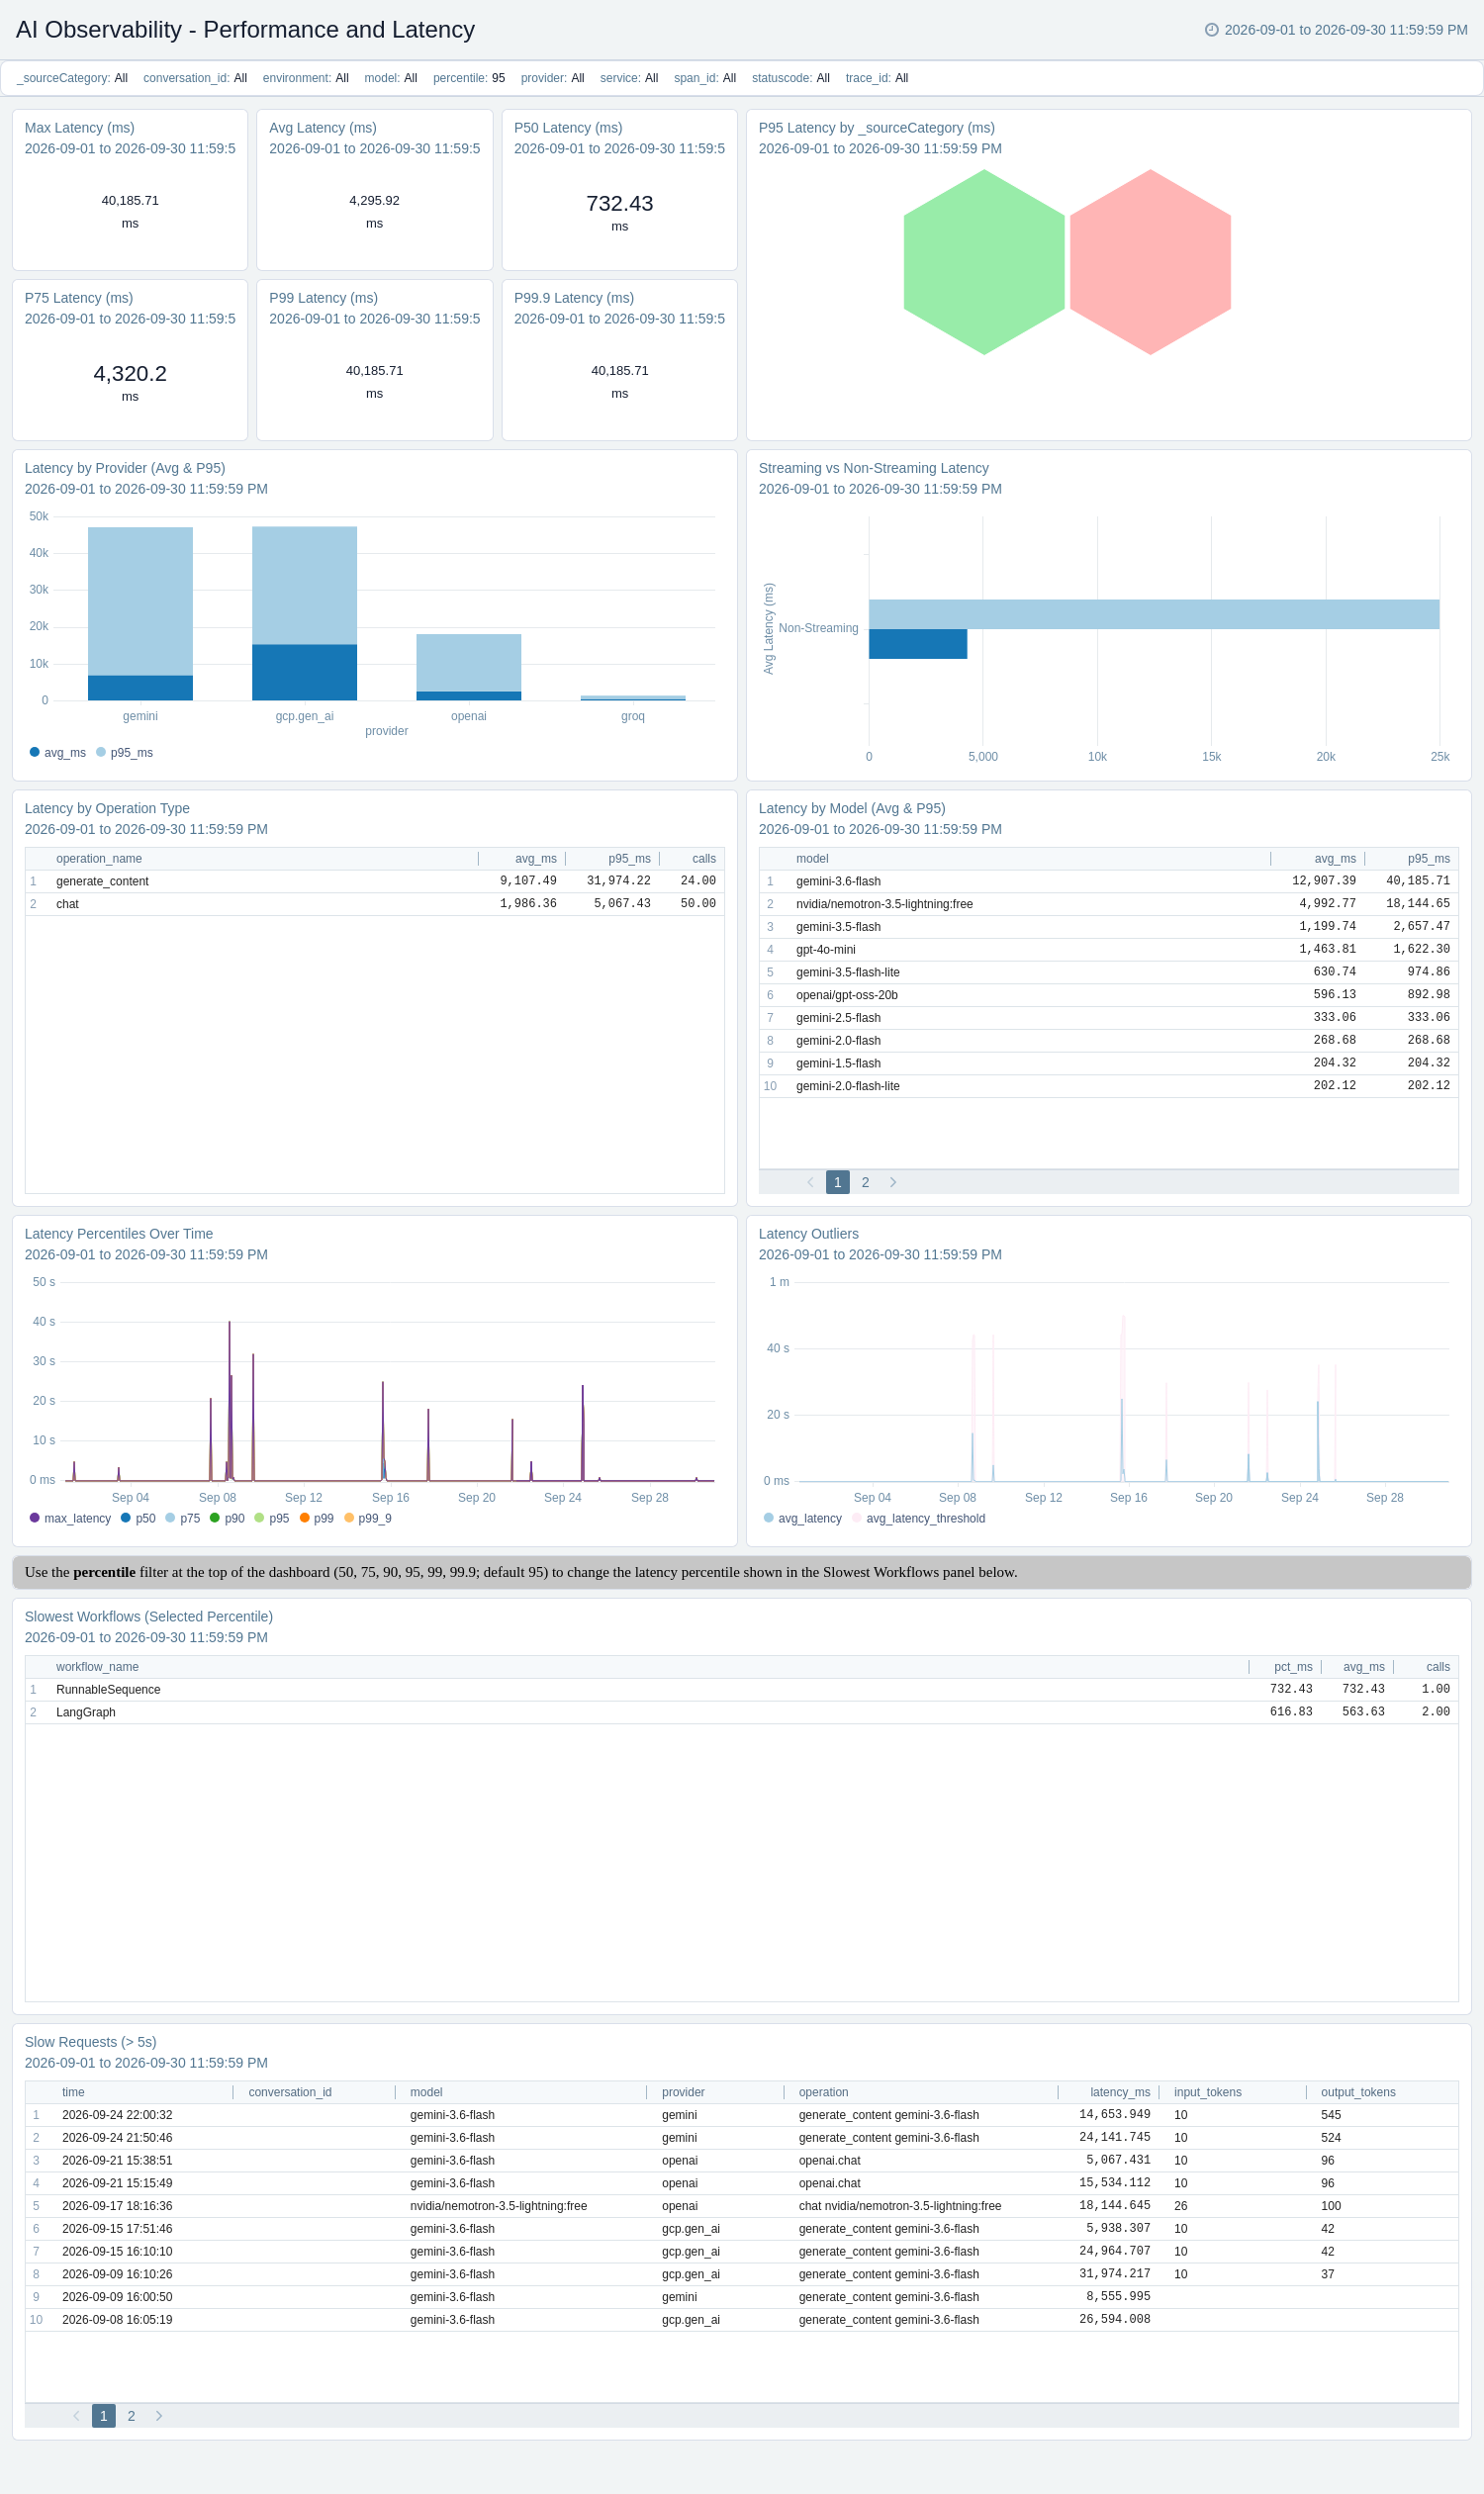
The AI Observability - Performance and Latency dashboard provides response time analysis for LLM inference across models and providers. Use this dashboard to monitor maximum, average, P50, P75, P95, P99, and P99.9 latency and latency percentiles over time. Identify latency outliers, P95 latency by _sourceCategory, and slow requests exceeding 5 seconds to troubleshoot bottlenecks. Analyze latency by model, provider, and operation type, streaming versus non-streaming latency, and the slowest workflows ranked by the percentile selected in the percentile filter for performance tuning.
Prompt and Response Analytics
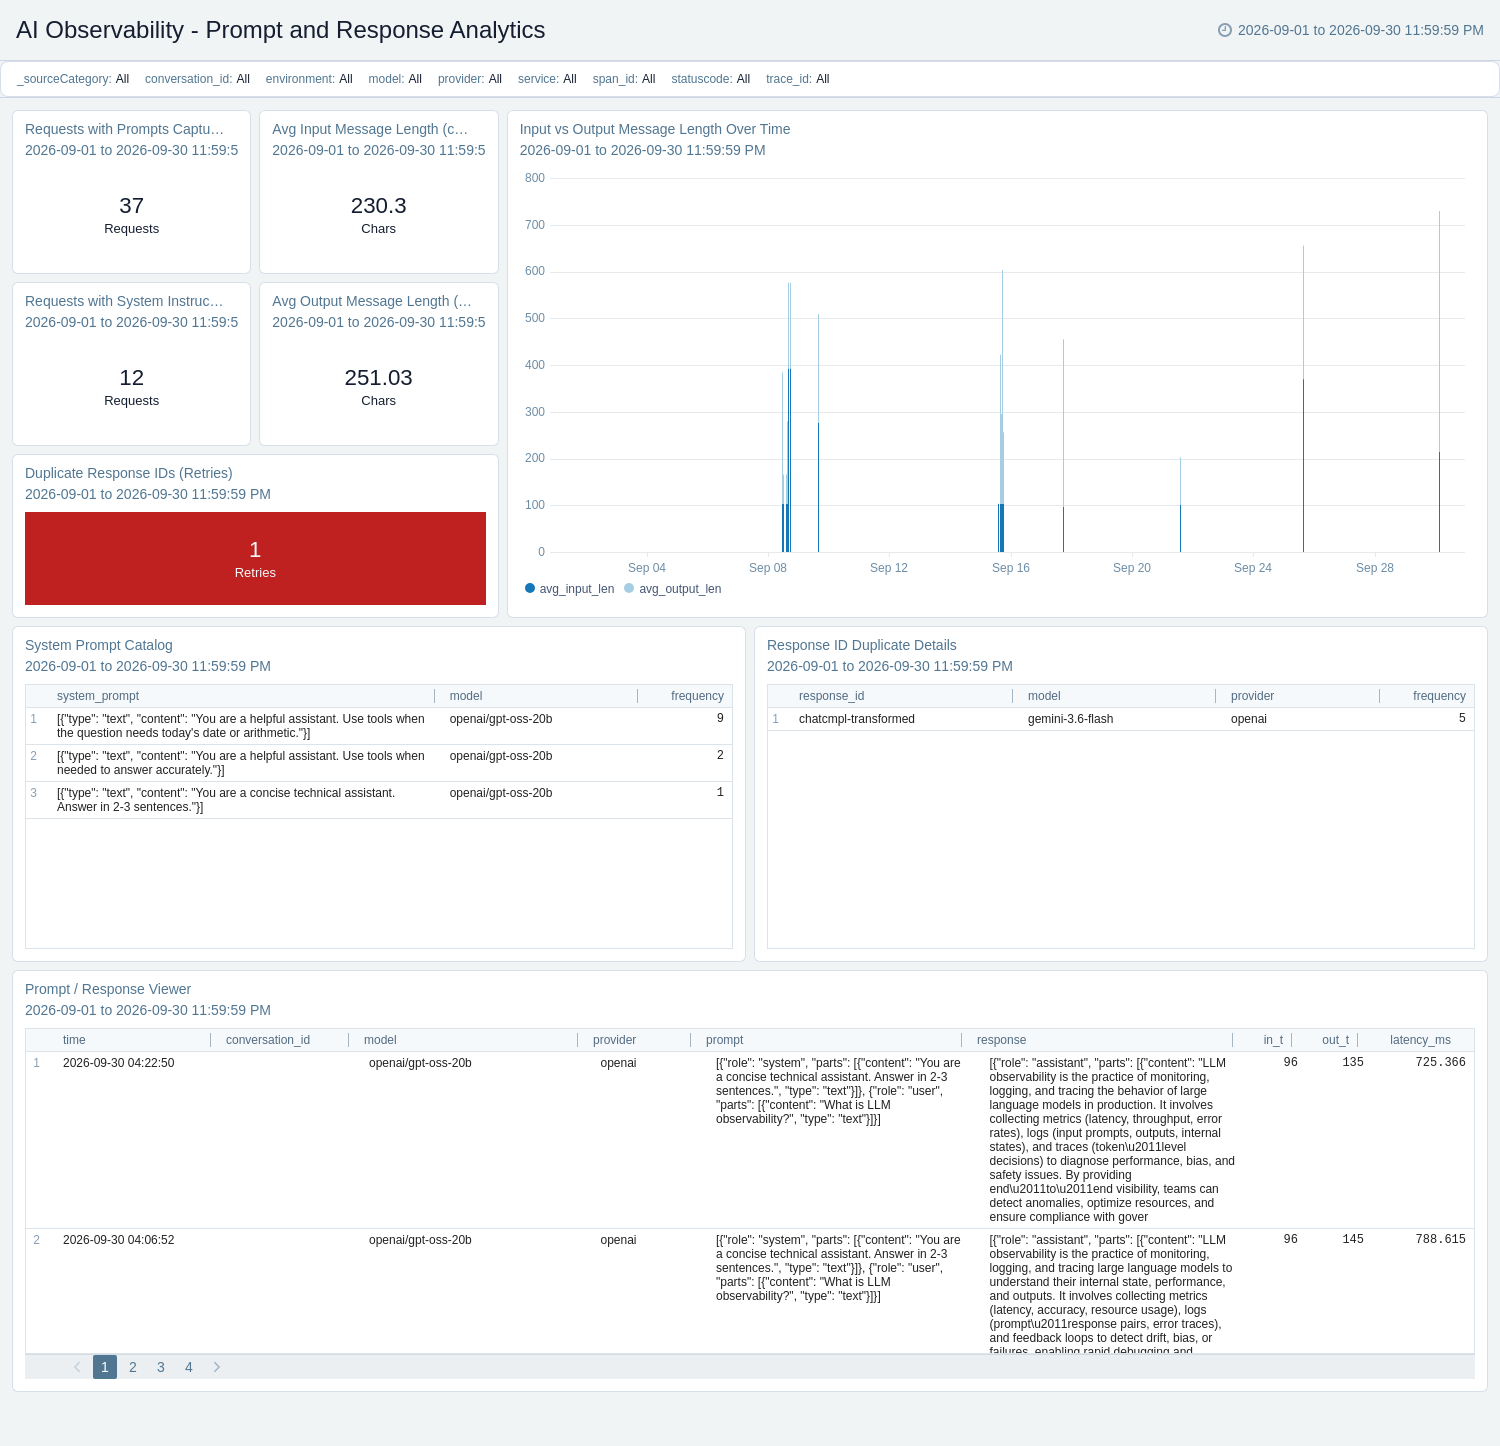
The AI Observability - Prompt and Response Analytics dashboard provides visibility into prompt and response content for debugging, auditing, and quality review. Use this dashboard to monitor requests with prompts captured, requests with system instructions, and average input and output message lengths over time. Browse prompts and responses in the viewer and review the system prompt catalog to understand application behavior. Identify duplicate response IDs and their details to detect retries.
Token Usage
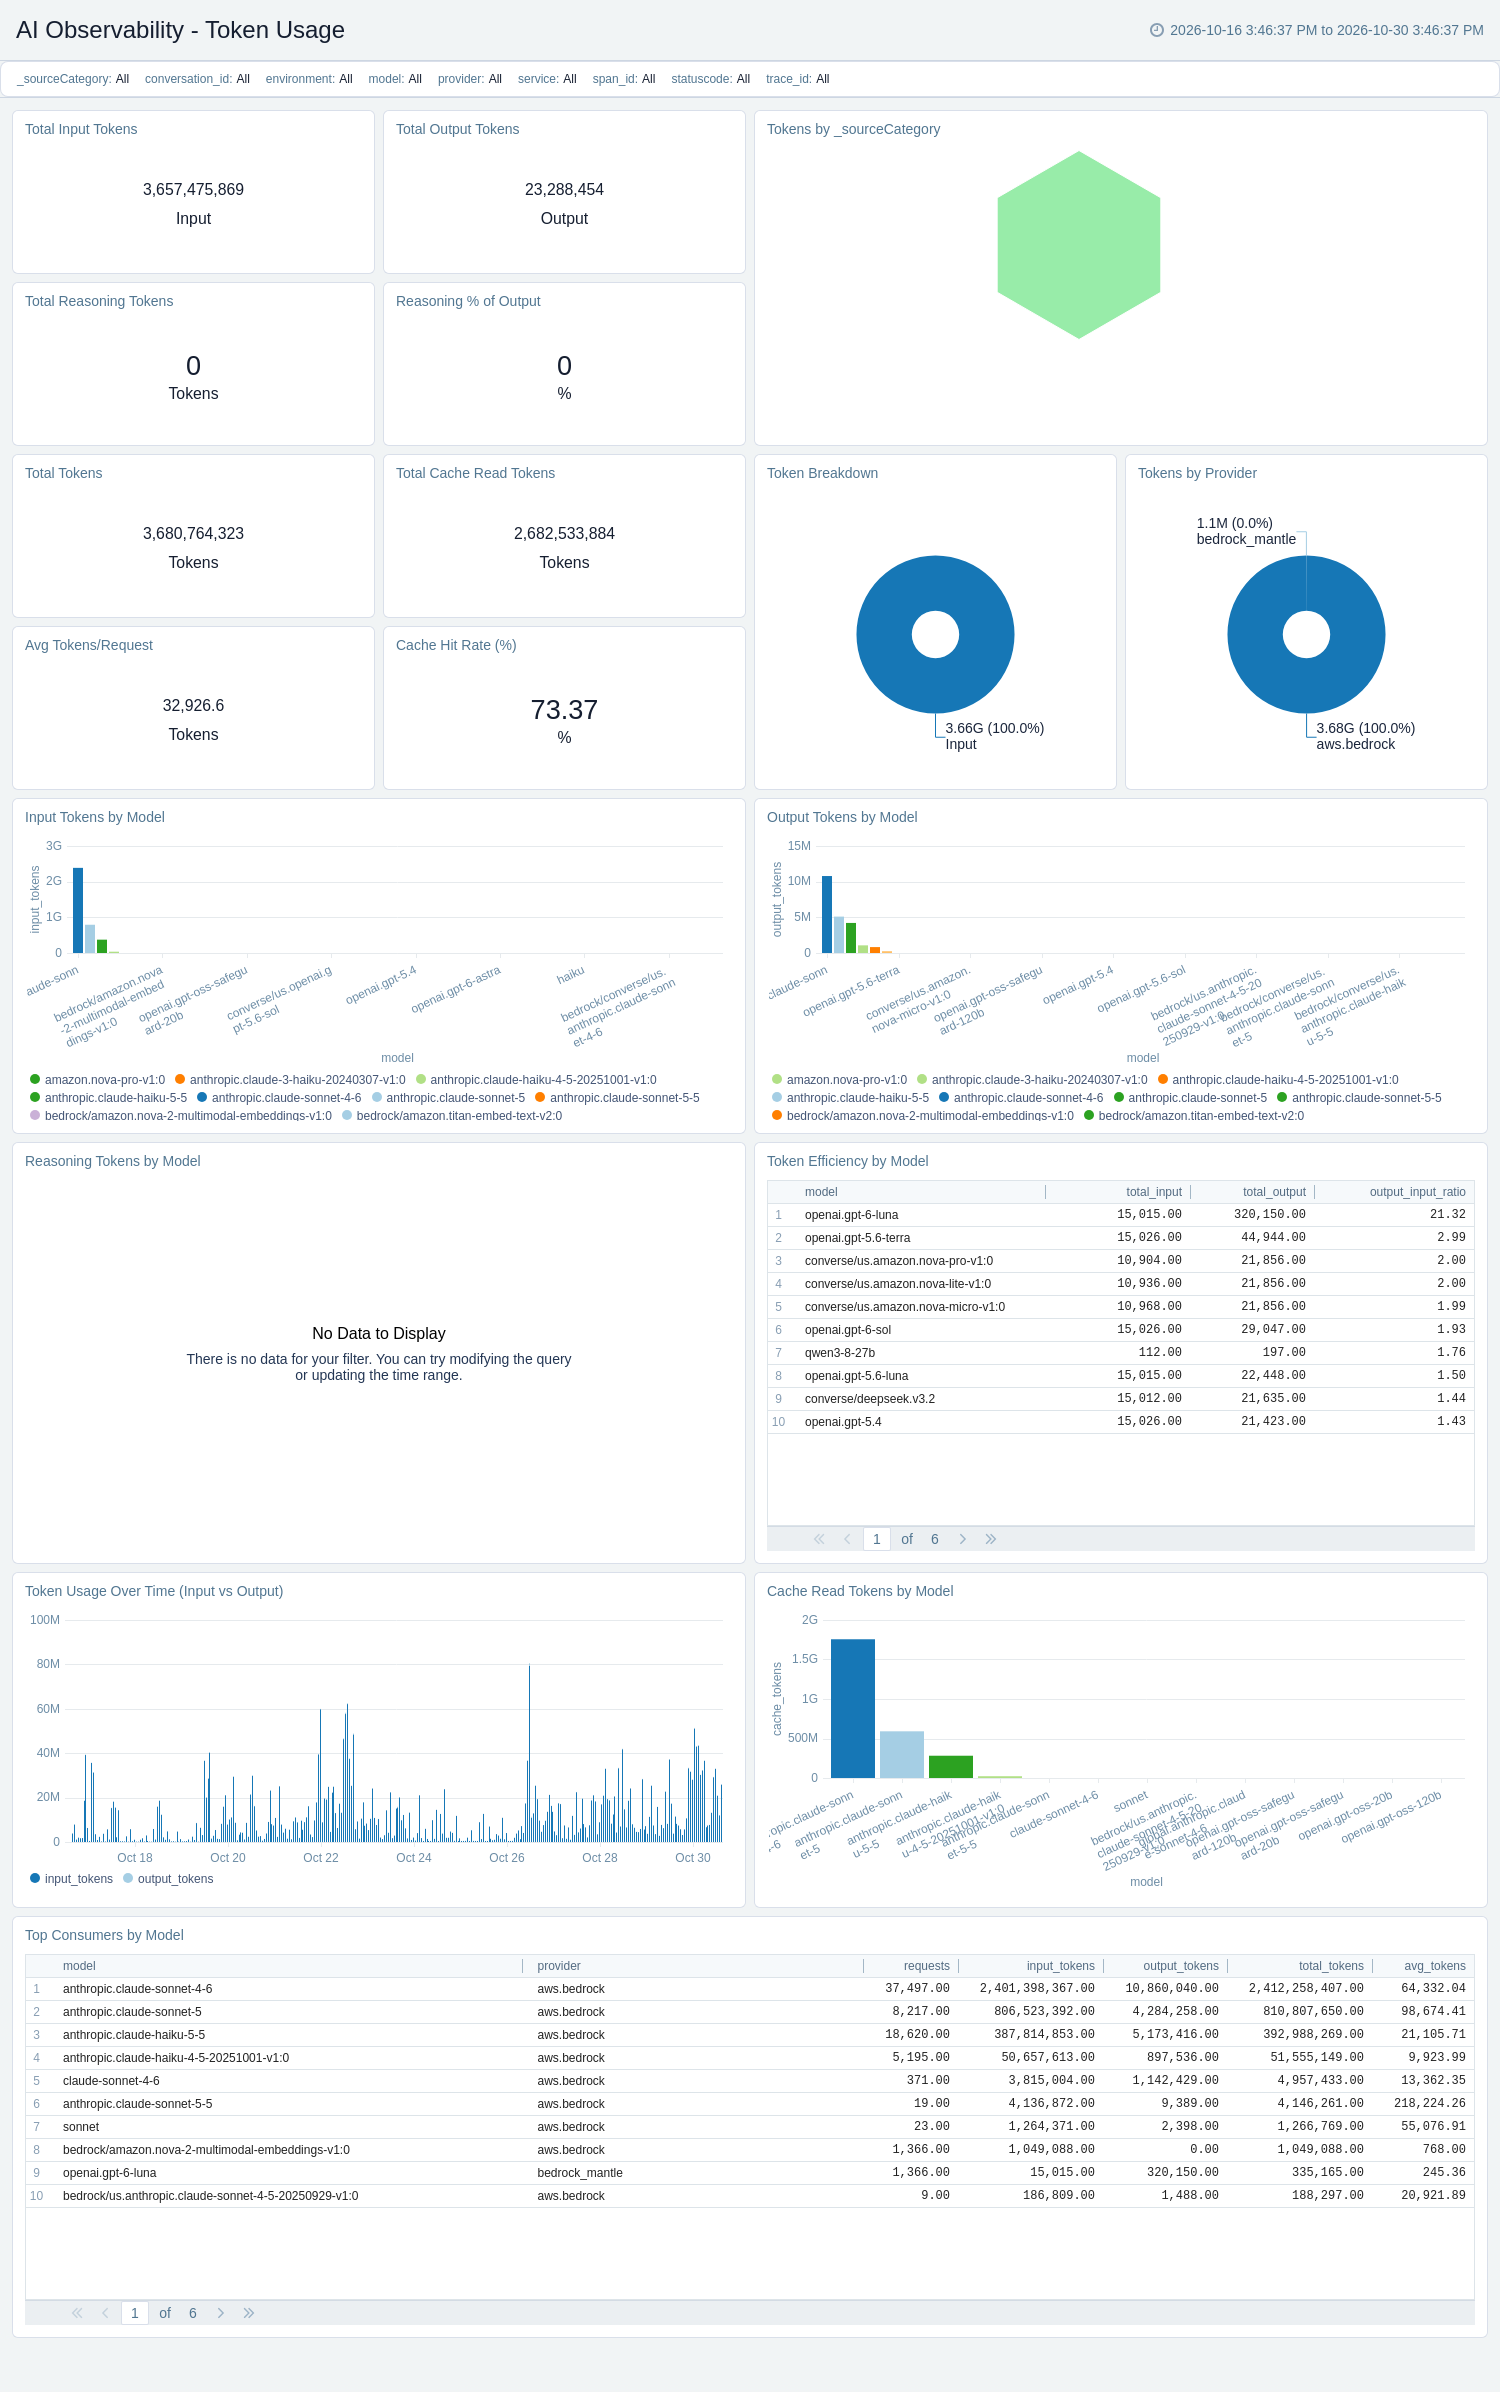
The AI Observability - Token Usage dashboard provides deep token consumption analysis by model, provider, and time. Use this dashboard to monitor total input, output, and combined tokens, average tokens per request, tokens by _sourceCategory, and the token breakdown. Identify top consumers, input and output tokens by model, tokens by provider, and token efficiency by model for capacity planning. Track reasoning tokens and reasoning percentage of output, cache read tokens, and cache hit rate for cost and efficiency optimization.
Conversation Analytics
The AI Observability - Conversation Analytics dashboard provides session-level visibility into multi-turn conversations using gen_ai.conversation.id. Use this dashboard to monitor total conversations, conversation ID instrumentation coverage, and average turns, tokens, cost, and duration per conversation. Identify conversations over time and by _sourceCategory, the turns per conversation distribution, and the top conversations by cost and tokens. Analyze failed conversations with their error messages and conversations that switch between models, and drill down from a conversation to the Prompt and Response Analytics dashboard to review its messages.
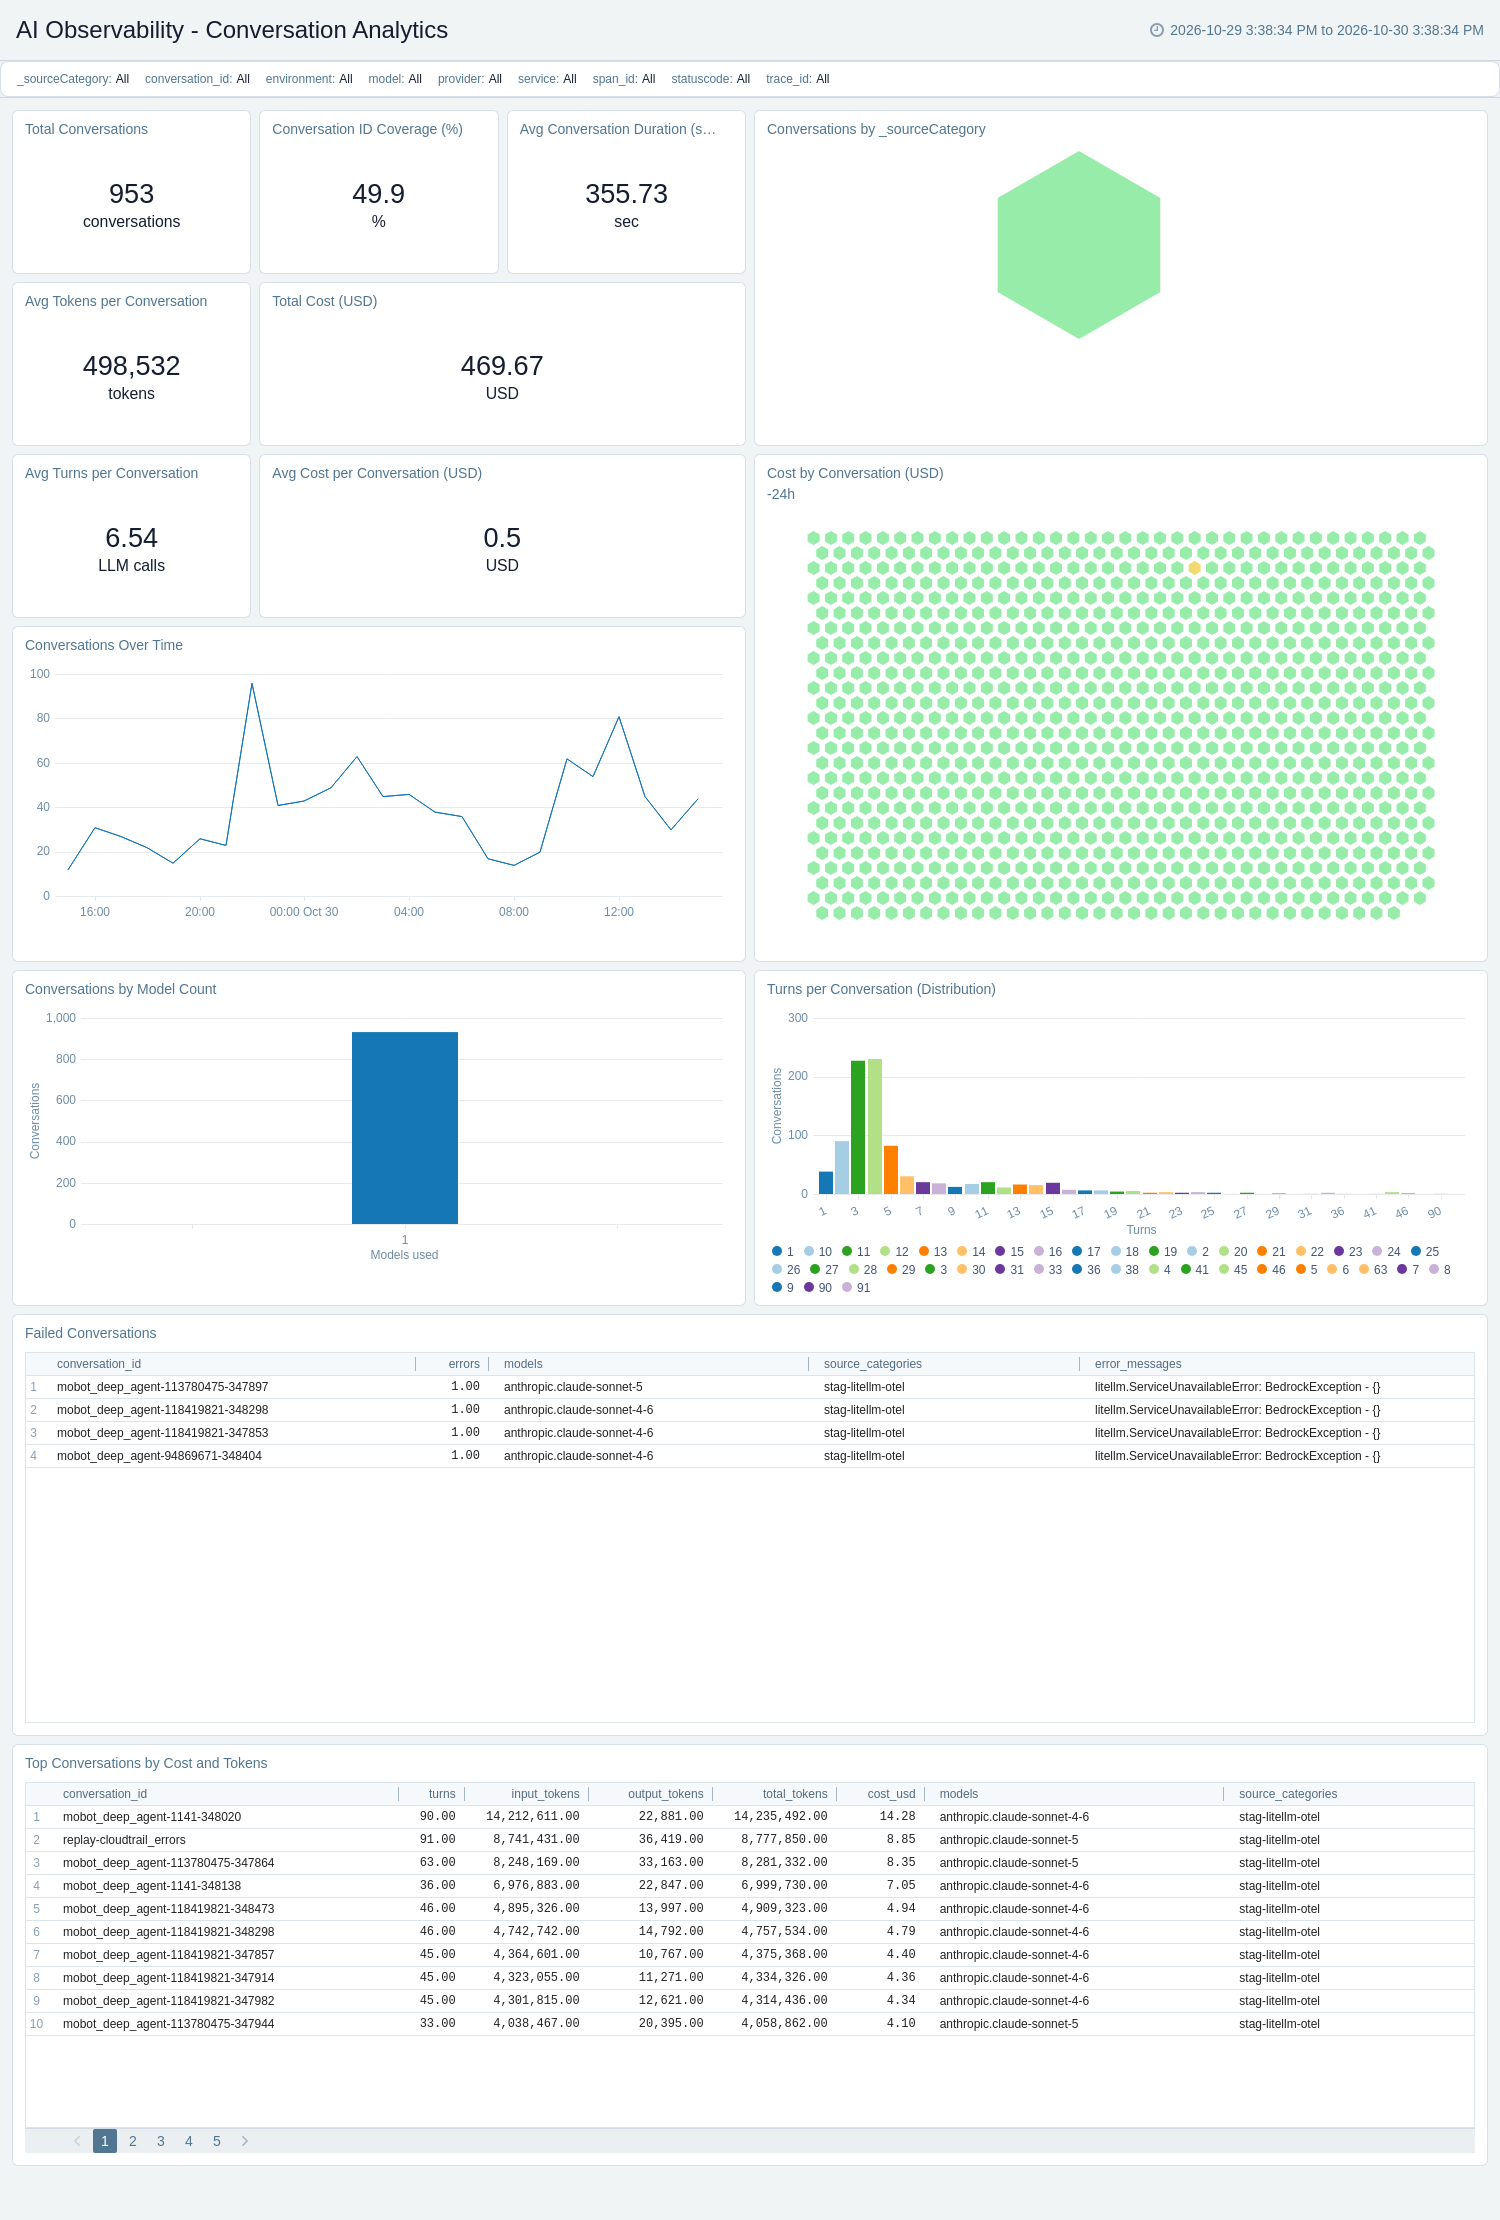
Only spans that carry gen_ai.conversation.id appear in this dashboard. Use the Conversation ID Coverage (%) panel to check what share of your LLM requests are instrumented with a conversation ID. A turn counts each LLM call, so agent and tool-calling flows can show more turns than user messages.
Create monitors for AI Observability app
From your App Catalog:
- From the Sumo Logic navigation, select App Catalog.
- In the Search Apps field, search for and then select your app.
- Make sure the app is installed.
- Navigate to What's Included tab and scroll down to the Monitors section.
- Click Create next to the pre-configured monitors. In the create monitors window, adjust the trigger conditions and notifications settings based on your requirements.
- Scroll down to Monitor Details.
- Under Location click on New Folder.
note
By default, monitor will be saved in the root folder. So to make the maintenance easier, create a new folder in the location of your choice.
- Enter Folder Name. Folder Description is optional.
tip
Using app version in the folder name will be helpful to determine the versioning for future updates.
- Click Create. Once the folder is created, click on Save.
AI Observability alerts
| Name | Description | Alert Condition | Recover Condition |
|---|---|---|---|
AI Observability - Auth Errors (401) Spike | This alert is triggered when LLM provider authentication errors (HTTP 401) exceed 5 within a 15-minute window. Spikes typically indicate expired or rotated API keys. | Count > 5 | Count < = 5 |
AI Observability - High Latency Detected | This alert is triggered when more than 5 LLM requests exceed 10 seconds end to end within a 15-minute window. Sustained high latency can indicate overloaded providers or inefficient prompt patterns. | Count > 5 | Count < = 5 |
AI Observability - LLM Error Rate Spike | This alert is triggered when the LLM API error count exceeds 10 within a 15-minute window. A sudden spike can indicate provider outages, invalid credentials, or malformed requests. | Count > 10 | Count < = 10 |
AI Observability - Runaway Agent Detected | This alert is triggered when any single trace accumulates more than 50 agent spans, indicating a runaway agentic loop that can exhaust token budgets. | Count > 50 | Count < = 50 |
AI Observability - Token Limit Breached | This alert is triggered when more than 5 LLM responses are truncated because of token limits (finish reason max_tokens or length) within a 15-minute window. | Count > 5 | Count < = 5 |
Upgrading the AI Observability app
To update the app, do the following:
Next-Gen App: To install or update the app, you must be an account administrator or a user with Manage Apps, Manage Monitors, Manage Fields, Manage Metric Rules, and Manage Collectors capabilities depending upon the different content types part of the app.
- Select App Catalog.
- In the Search Apps field, search for and then select your app.
Optionally, you can identify apps that can be upgraded in the Upgrade available section. - To upgrade the app, select Upgrade from the Manage dropdown.
- If the upgrade does not have any configuration or property changes, you will be redirected to the Preview & Done section.
- If the upgrade has any configuration or property changes, you will be redirected to the Setup Data page.
- In the Configure section of your respective app, complete the following fields.
- Field Name. If you already have collectors and sources set up, select the configured metadata field name (eg _sourcecategory) or specify other custom metadata (eg: _collector) along with its metadata Field Value.
- Click Next. You will be redirected to the Preview & Done section.
Post-update
Your upgraded app will be installed in the Installed Apps folder and dashboard panels will start to fill automatically.
See our Release Notes changelog for new updates in the app.
To revert the app to a previous version, do the following:
- Select App Catalog.
- In the Search Apps field, search for and then select your app.
- To version down the app, select Revert to < previous version of your app > from the Manage dropdown.
Uninstalling the AI Observability app
To uninstall the app, do the following:
- Select App Catalog.
- In the 🔎 Search Apps field, run a search for your desired app, then select it.
- Click Uninstall.