Amazon Bedrock AgentCore
Amazon Bedrock AgentCore is a fully managed service that enables you to build and deploy AI agents with advanced capabilities. AgentCore provides runtime observability, memory management, gateway functionality, built-in tools, and identity services to help you monitor and optimize your AI agent deployments. It offers comprehensive metrics, logs, and traces for agent execution activity, resource utilization, error tracking, and performance monitoring.
The Sumo Logic Amazon Bedrock AgentCore app dashboards offer insights into CloudWatch Logs and performance metrics for your Amazon Bedrock AgentCore service. These preconfigured dashboards enable you to monitor logs and the runtime performance metrics of your AgentCore agent runtimes, memory, gateways, built-in tools, and identity services.
Log and metrics types
The Amazon Bedrock AgentCore app uses the following logs and metrics:
- AgentCore Runtime Observability Data - Runtime metrics, resource usage logs and application logs.
- AgentCore Memory Observability Data - Memory metrics and application logs.
- AgentCore Gateway Observability Data - Gateway metrics and application logs.
- AgentCore Built-in Tools Observability Data - Code interpreter and browser tool metrics, Code interpreter application and usage logs, and Browser usage logs.
- AgentCore Identity Observability Data - Identity service metrics.
- Monitor Amazon Bedrock AgentCore API calls using CloudTrail.
Sample CloudTrail log message
Click to expand
{
  "eventVersion": "1.09",
  "userIdentity": {
    "type": "IAMUser",
    "principalId": "AIDAIHL7V6WZEXAMPLEVU",
    "arn": "arn:aws:iam::123456789012:user/developer",
    "accountId": "123456789012",
    "accessKeyId": "AKIA12345EXAMPLE67890",
    "userName": "developer"
  },
  "eventTime": "2024-10-01T11:52:37Z",
  "eventSource": "bedrock-agentcore.amazonaws.com",
  "eventName": "CreateAgentRuntime",
  "awsRegion": "us-west-2",
  "sourceIPAddress": "203.0.113.42",
  "userAgent": "aws-cli/2.13.0 Python/3.11.4 Darwin/23.0.0 source/x86_64",
  "requestParameters": {
    "agentRuntimeId": "CustomerSupportAgent"
  },
  "responseElements": null,
  "requestID": "0873fdcf-2c18-413a-9288-7e9bbbb8f29d",
  "eventID": "a8d388e2-3111-44bf-b78f-b0e263dc3d25",
  "readOnly": false,
  "eventType": "AwsApiCall",
  "managementEvent": true,
  "recipientAccountId": "123456789012",
  "eventCategory": "Management",
  "tlsDetails": {
    "tlsVersion": "TLSv1.3",
    "cipherSuite": "TLS_AES_128_GCM_SHA256",
    "clientProvidedHostHeader": "bedrock-agentcore.us-west-2.amazonaws.com"
  }
}
Sample CloudWatch logs
Runtime Application Logs
{
  "timestamp": "2024-10-01T11:50:35.123Z",
  "resource_arn": "arn:aws:bedrock-agentcore:us-west-2:123456789012:agent/AGENT123",
  "event_timestamp": "2024-10-01T11:50:35.000Z",
  "account_id": "123456789012",
  "request_id": "a3517f6a-7f98-4dfe-94dd-ad7340c8dce5",
  "session_id": "session-12345",
  "trace_id": "160fc209c3befef4857ab1007d041db0",
  "span_id": "81346de89c725310",
  "service_name": "AgentCore.Runtime",
  "operation": "InvokeAgentRuntime",
  "request_payload": {
    "agentId": "AGENT123",
    "sessionId": "session-12345",
    "inputText": "What is the weather in Seattle?"
  }
}
Memory Application Logs
{
  "resource_arn": "arn:aws:bedrock-agentcore:us-west-2:123456789012:memory/MEMORY123",
  "event_timestamp": 1759370851622,
  "memory_strategy_id": "strategy-001",
  "namespace": "user-preferences",
  "actor_id": "user-456",
  "session_id": "session-789",
  "event_id": "event-012",
  "body": {"requestId": "req-abc123",
    "isError": false,
    "log": "Extraction processing completed successfully"
    }
}
Gateway Application Logs
{
  "resource_arn": "arn:aws:bedrock-agentcore:us-west-2:123456789012:gateway/GATEWAY123",
  "event_timestamp": 1759370851622,
  "body": {
    "isError": false,
    "log": "Started processing request with requestId: 1",
    "requestBody": "{id=1, jsonrpc=2.0, method=tools/call, params={name=LocationTool, arguments={location=seattle}}}",
    "id": "1"
  },
  "account_id": "123456789012",
  "request_id": "12345678-1234-1234-1234-123456789012",
  "trace_id": "160fc209c3befef4857ab1007d041db0",
  "span_id": "81346de89c725310"
}
Built-in Tools Code Interpreter Application Logs
{
  "timestamp": "2024-10-01T12:30:15.456Z",
  "resource_arn": "arn:aws:bedrock-agentcore:us-west-2:123456789012:code-interpreter/aws.codeinterpreter.v1",
  "event_timestamp": "2024-10-01T12:30:15.000Z",
  "account_id": "123456789012",
  "request_id": "b4628g7b-8g09-5hfh-05ee-be8451d9dgf6",
  "session_id": "toolsession-67890",
  "trace_id": "271gd320d4cfgfg5968bc2118e152ec1",
  "span_id": "92457ef0ad836421",
  "service_name": "AgentCore.CodeInterpreter",
  "operation": "InvokeCodeInterpreter",
  "request_payload": {
    "name": "executeCode",
    "arguments": {"code": "print('Hello, World!')", "language": "python", "clearContext": false}
  },
  "response_payload": {
    "content": [
      {
        "type": "text",
        "text": "Hello, World!\n",
        "data": null,
        "mimeType": null,
        "uri": null,
        "name": null,
        "description": null,
        "size": null,
        "resource": null
      }
    ],
    "structuredContent": {
      "taskId": null,
      "taskStatus": null,
      "stdout": "Hello, World!\n",
      "stderr": "",
      "exitCode": 0,
      "executionTime": 0.054308414459228516
    },
    "isError": false
  }
}
Usage Logs
{
  "resource_arn": "arn:aws:bedrock-agentcore:us-west-2:123456789012:runtime/AGENT123",
  "event_timestamp": 1762768235743,
  "resource": {
    "cloud.provider": "aws",
    "service.name": "AgentCore.Runtime",
    "cloud.region": "us-east-1"
  },
  "attributes": {
    "account.id": "956882708938",
    "time_elapsed_seconds": 0.28,
    "agent.name": "CustomerSupportAgent",
    "region": "us-east-1",
    "session.id": "session-12345",
    "resource.id": "arn:aws:bedrock-agentcore:us-west-2:123456789012:runtime/AGENT123/runtime-endpoint/DEFAULT"
  },
  "metrics": {
    "agent.runtime.memory.gb_hours.used": 0.000275552058724,
    "agent.runtime.vcpu.hours.used": 0.000001925
  }
}
Sample queries
account=* region=* namespace=aws/bedrock/agentcore "\"eventSource\":\"bedrock-agentcore.amazonaws.com\"" !errorCode
| json "eventSource", "eventName", "eventType", "sourceIPAddress", "errorCode", "errorMessage" nodrop
| json "userIdentity.type", "userIdentity.userName", "userIdentity.arn", "recipientAccountId", "awsRegion" as user_type, user_name, arn, accountid, region nodrop
| where eventSource matches "bedrock-agentcore.amazonaws.com"
| count as eventCount by sourceIPAddress
| lookup latitude, longitude from geo://location on ip=sourceIPAddress
account=* region=* namespace=aws/bedrock/agentcore "\"eventSource\":\"bedrock-agentcore.amazonaws.com\"" errorCode
| json "eventSource", "eventName", "eventType", "sourceIPAddress", "errorCode", "errorMessage" nodrop
| json "userIdentity.type", "userIdentity.userName", "recipientAccountId", "awsRegion" as user_type, user_name, accountid, region nodrop
| where eventSource matches "bedrock-agentcore.amazonaws.com"
| count as eventCount by errorMessage
| sort by eventCount, errorMessage asc
| limit 10
account=* region=* namespace=aws/bedrock/agentcore "\"eventSource\":\"bedrock-agentcore.amazonaws.com\""
| json "eventSource", "eventName", "eventType", "readOnly", "recipientAccountId", "awsRegion" as event_source, event_name, event_type, read_only, accountid, region nodrop
| where eventSource matches "bedrock-agentcore.amazonaws.com"
| where !(eventName matches "Get*") and !(eventName matches "List*")
| count as eventCount by eventName
| sort by eventCount, eventName asc
| limit 20
account=* region=* namespace=aws/bedrock/agentcore _sourcehost=/aws/vendedlogs/bedrock-agentcore/browser* "browser.vcpu.hours.used"
| json "metrics['browser.vcpu.hours.used']", "agentcore_resource_id" as vcpu_hours, resource_id nodrop
| where !isBlank(vcpu_hours)
| sum(vcpu_hours) as total_vcpu_hours by resource_id
| sort by total_vcpu_hours desc
account=* region=* namespace=aws/bedrock/agentcore _sourcehost=/aws/vendedlogs/bedrock-agentcore/code-interpreter* "codeInterpreter.memory.gb_hours.used"
| json "metrics['codeInterpreter.memory.gb_hours.used']", "agentcore_resource_id" as memory_gb_hours, resource_id nodrop
| where !isBlank(memory_gb_hours)
| sum(memory_gb_hours) as total_memory_gb_hours by resource_id
| sort by total_memory_gb_hours desc
account=* region=* namespace=aws/bedrock/agentcore _sourcehost=/aws/vendedlogs/bedrock-agentcore/gateway/APPLICATION_LOGS* body isError
| json "body.isError" as is_error nodrop
| if(is_error matches "true", "Error", "Success") as status
| count by status
account=* region=* namespace=aws/bedrock/agentcore _sourcehost=/aws/vendedlogs/bedrock-agentcore/memory/* "Extracted memories"
| json "body.isError", "body.log", "namespace" as is_error, log_message, memory_namespace nodrop
| where log_message matches "Extracted*memories"
| if (is_error = "true", "Error", "Success") as status
| count by status
account=* region=* namespace=aws/bedrock/agentcore _sourcehost=/aws/vendedlogs/bedrock-agentcore/runtime/USAGE_LOGS* "agent.runtime.vcpu.hours.used"
| json "metrics['agent.runtime.vcpu.hours.used']", "attributes['agent.name']", "attributes['session.id']" as vcpu_hours, agent_name, session_id nodrop
| where !isBlank(session_id) and !isBlank(vcpu_hours)
| sum(vcpu_hours) as total_vcpu_hours by session_id, agent_name
| sort by total_vcpu_hours desc
| limit 25
account=* region=* namespace=aws/bedrock/agentcore metric=invocations operation=InvokeAgentRuntime statistic=sum | quantize using sum | sum
account=* region=* namespace=aws/bedrock/agentcore metric=latency operation=InvokeGateway statistic=average | quantize using avg | avg
Collecting logs and metrics for the Amazon Bedrock AgentCore app
Collecting CloudWatch metrics
Sumo Logic supports collecting metrics using two source types:
- Configure an AWS Kinesis Firehose for Metrics Source (recommended) or
- Configure an Amazon CloudWatch Source for Metrics
When you configure the source:
- Namespace for Amazon Bedrock AgentCore Service is AWS/Bedrock-AgentCore.
- Metadata. Add an account field to the source and assign it a value that is a friendly name/alias to your AWS account from which you are collecting metrics. Metrics can be queried via the "account field".
Collecting Amazon Bedrock AgentCore CloudTrail logs
- Add an AWS CloudTrail Source to your Hosted Collector.
- Name. Enter a name to display the new Source.
- Description. Enter an optional description.
- S3 Region. Select the Amazon Region for your Amazon Bedrock AgentCore S3 bucket.
- Bucket Name. Enter the exact name of your Amazon Bedrock AgentCore S3 bucket.
- Path Expression. Enter the string that matches the S3 objects you'd like to collect. You can use a wildcard (*) in this string. (DO NOT use a leading forward slash. See Amazon Path Expressions). The S3 bucket name is not part of the path. Don't include the bucket name when you are setting the Path Expression.
- Source Category. Enter
aws/observability/cloudtrail/logs. - Fields. Add an account field and assign it a value that is a friendly name/alias to your AWS account from which you are collecting logs. Logs can be queried via the "account field".
- Access Key ID and Secret Access Key. Enter your Amazon Access Key ID and Secret Access Key. Learn how to use Role-based access to AWS here.
- Log File Discovery > Scan Interval. Use the default of 5 minutes. Alternatively, enter the frequency. Sumo Logic will scan your S3 bucket for new data. Learn how to configure Log File Discovery here.
- Enable Timestamp Parsing. Select the Extract timestamp information from log file entries check box.
- Time Zone. Select Ignore time zone from the log file and instead use, and select UTC from the dropdown.
- Timestamp Format. Select Automatically detect the format.
- Enable Multiline Processing. Select the Detect messages spanning multiple lines check box, and select Infer Boundaries.
- Click Save.
Collecting Amazon Bedrock AgentCore CloudWatch logs
To enable Amazon Bedrock AgentCore CloudWatch Logs, follow the steps mentioned in AWS documentation.
Ensure that when configuring CloudWatch Logs, the log group names follow these patterns:
- Runtime Application logs:
/aws/vendedlogs/bedrock-agentcore/runtime/APPLICATION_LOGS/* - Runtime Usage logs:
/aws/vendedlogs/bedrock-agentcore/runtime/USAGE_LOGS/* - Memory Application logs:
/aws/vendedlogs/bedrock-agentcore/memory/APPLICATION_LOGS/* - Gateway Application logs:
/aws/vendedlogs/bedrock-agentcore/gateway/APPLICATION_LOGS/* - Built-in Tools Code Interpreter Application logs:
/aws/vendedlogs/bedrock-agentcore/code-interpreter* - Built-in Tools Code Interpreter Usage logs:
/aws/vendedlogs/bedrock-agentcore/code-interpreter* - Built-in Tools Browser Usage logs:
/aws/vendedlogs/bedrock-agentcore/browser*
Sumo Logic supports several methods for collecting logs from Amazon CloudWatch. You can choose either of them to collect logs:
- AWS Kinesis Firehose for Logs. Configure an AWS Kinesis Firehose for Logs (recommended) or
- Lambda Log Forwarder. Configure a collection of Amazon CloudWatch Logs using our AWS Lambda function using a Sumo Logic provided CloudFormation template, as described in Amazon CloudWatch Logs, or to configure collection without using CloudFormation see Collect Amazon CloudWatch Logs using a Lambda Function.
While configuring the CloudWatch log source, the following fields can be added to the source:
- Add an account field and assign it a value which is a friendly name/alias to your AWS account from which you are collecting logs. Logs can be queried via the account field.
- Add a region field and assign it the value of the respective AWS region where the Bedrock AgentCore exists.
- Add an accountId field and assign it the value of the respective AWS account ID that is being used.
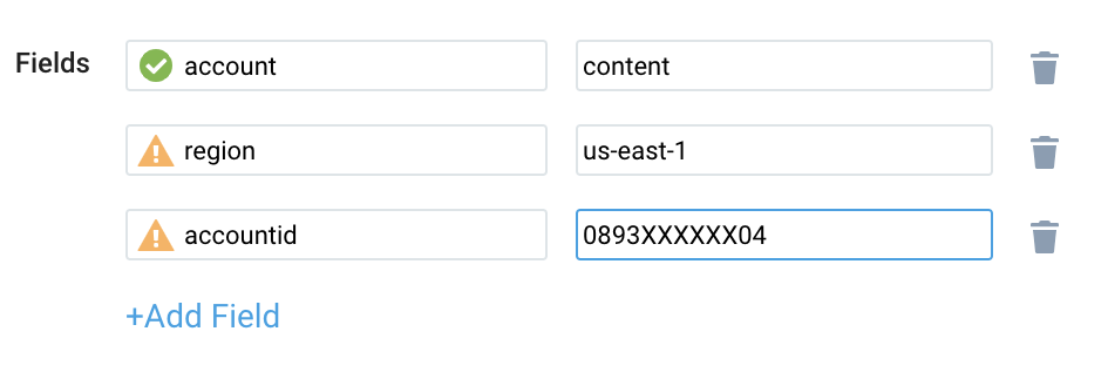
Configure fields in field schema
-
New UI. In the main Sumo Logic menu, select Data Management, and then under Logs select Fields. You can also click the Go To... menu at the top of the screen and select Fields.
Classic UI. In the main Sumo Logic menu, select Manage Data > Logs > Fields. -
Search for the following fields:
regionaccountidnamespaceagentcore_resource_idagentcore_resource_type
-
If not present, create them. Learn how to create and manage fields here.
Configure Field Extraction Rule(s)
Create Field Extraction Rules for Amazon Bedrock AgentCore logs. Learn how to create a Field Extraction Rule here.
CloudTrail Logs FER
Rule Name: AwsObservabilityBedrockAgentcoreCloudTrailLogsFER
Applied at: Ingest Time
Scope (Specific Data): account=* eventSource "bedrock-agentcore.amazonaws.com"
| json "eventSource", "awsRegion", "recipientAccountId", "requestParameters.resourceArn", "resources[0].ARN", "requestParameters.agentRuntimeId", "requestParameters.memoryId", "requestParameters.browserId", "requestParameters.codeInterpreterId", "requestParameters.gatewayIdentifier", "requestParameters.resourceArnBeingAuthorized", "responseElements.agentRuntime.agentRuntimeId", "responseElements.memory.memoryId", "responseElements.browser.browserId", "responseElements.codeInterpreter.codeInterpreterId", "responseElements.gateway.gatewayId", "requestParameters.resourceCredentialProviderName" as event_source, region, accountid, resourceArn_req, resourceArn_main, agentRuntimeId, memoryId, browserId, codeInterpreterId, gatewayIdentifier, resourcearnbeingauthorized_req, agentRuntimeId_res, memoryId_res, browserId_res, codeInterpreterId_res, gatewayId_res, identityId_req nodrop
| where event_source matches "bedrock-agentcore.amazonaws.com"
| "aws/bedrock-agentcore" as namespace
| if(!isEmpty(resourceArn_main), resourceArn_main, if(!isEmpty(resourceArn_req), resourceArn_req, resourcearnbeingauthorized_req)) as resource_arn
| parse field=resource_arn "arn:*:bedrock-agentcore:*:*:*/*" as agentcore_arn_part, agentcore_region, agentcore_accountid, type_from_arn, id_from_arn nodrop
| parse field=resource_arn "arn%3A*%3Abedrock-agentcore%3A*%3A*%3A*%2F*" as agentcore_arn_part, agentcore_region, agentcore_accountid, type_from_arn, id_from_arn nodrop
| if(!isEmpty(id_from_arn), id_from_arn,
  if(!isEmpty(agentRuntimeId), agentRuntimeId,
  if(!isEmpty(memoryId), memoryId,
  if(!isEmpty(browserId), browserId,
  if(!isEmpty(codeInterpreterId), codeInterpreterId,
  if(!isEmpty(gatewayIdentifier), gatewayIdentifier,  if(!isEmpty(agentRuntimeId_res), agentRuntimeId_res,
  if(!isEmpty(memoryId_res), memoryId_res,
  if(!isEmpty(browserId_res), browserId_res,
  if(!isEmpty(codeInterpreterId_res), codeInterpreterId_res,
  if(!isEmpty(gatewayId_res), gatewayId_res,
  if(!isEmpty(identityId_req), identityId_req, "")))))))))))) as agentcore_resource_id
| if(!isEmpty(type_from_arn), type_from_arn,
  if(!isEmpty(agentRuntimeId) or !isEmpty(agentRuntimeId_res), "runtime",
  if(!isEmpty(memoryId) or !isEmpty(memoryId_res), "memory",
  if(!isEmpty(browserId) or !isEmpty(browserId_res), "browser",
  if(!isEmpty(codeInterpreterId) or !isEmpty(codeInterpreterId_res), "code-interpreter",
  if(!isEmpty(gatewayIdentifier) or !isEmpty(gatewayId_res), "gateway",
if(!isEmpty(identityId_req), "identity", ""))))))) as agentcore_resource_type
| fields accountid, region, namespace, agentcore_resource_type, agentcore_resource_id
CloudWatch Logs FER
Rule Name: AwsObservabilityBedrockAgentCoreCloudWatchLogsFER
Applied at: Ingest Time
Scope (Specific Data): account=* region=* _sourcehost=/aws/vendedlogs/bedrock-agentcore/* resource_arn
| json "resource_arn" as resource_arn
| "aws/bedrock-agentcore" as namespace
| parse field=resource_arn "arn:*:bedrock-agentcore:*:*:*/*" as agentcore_arn_part, agentcore_region, agentcore_accountid, agentcore_resource_type, agentcore_resource_id
| fields namespace, agentcore_resource_type, agentcore_resource_id
Centralized AWS CloudTrail logs collection
In case you have a centralized collection of CloudTrail logs and are ingesting them from all accounts into a single Sumo Logic CloudTrail log source, create the following Field Extraction Rule to map a proper AWS account friendly name/alias. Create it if not already present / update it as required.
Rule Name: AWS Accounts
Applied at: Ingest Time
Scope (Specific Data): _sourceCategory=aws/observability/cloudtrail/logs
Parse expression
Enter a parse expression to create an "account" field that maps to the alias you set for each sub-account. For example, if you used the "dev" alias for an AWS account with ID "123456789012" and the "prod" alias for an AWS account with ID "567680881046", your parse expression would look like:
| json "recipientAccountId"
// Manually map your AWS account id with the AWS account alias you set up earlier for the individual child account
| "" as account
| if (recipientAccountId = "123456789012", "dev", account) as account
| if (recipientAccountId = "567680881046", "prod", account) as account
| fields account
Centralized CloudWatch logs collection
In case you have a centralized collection of CloudWatch logs and are ingesting them from all accounts into a single Sumo Logic CloudWatch log source, create the following Field Extraction Rule to map a proper AWS account friendly name/alias. Create it if not already present, or update it as required.
Rule Name: AWS Accounts
Applied at: Ingest Time
Scope (Specific Data): _sourceCategory=aws/observability/cloudwatch/logs
Parse expression
Enter a parse expression to create an "account" field that maps to the alias you set for each sub-account. For example, if you used the "dev" alias for an AWS account with ID "123456789012" and the "prod" alias for an AWS account with ID "567680881046", your parse expression would look like:
| json "account_id", "account.id" as accountid1, accountid2 nodrop
| if (!isEmpty(accountid1), accountid1, accountid2) as accountId
// Manually map your AWS account id with the AWS account alias you set up earlier for the individual child account
| "" as account
| if (accountId = "123456789012", "dev", account) as account
| if (accountId = "567680881046", "prod", account) as account
| fields account
Installing the Bedrock AgentCore app
Now that you have set up a collection for Amazon Bedrock AgentCore, install the Sumo Logic app to use the pre-configured dashboards that provide visibility into your environment for real-time analysis of overall usage.
To install the app, do the following:
Next-Gen App: To install or update the app, you must be an account administrator or a user with Manage Apps, Manage Monitors, Manage Fields, Manage Metric Rules, and Manage Collectors capabilities depending upon the different content types part of the app.
- Select App Catalog.
- In the 🔎 Search Apps field, run a search for your desired app, then select it.
- Click Install App.
note
Sometimes this button says Add Integration.
- Click Next in the Setup Data section.
- In the Configure section of your respective app, complete the following fields.
- Field Name. If you already have collectors and sources set up, select the configured metadata field name (eg _sourcecategory) or specify other custom metadata (eg: _collector) along with its metadata Field Value.
- Click Next. You will be redirected to the Preview & Done section.
Post-installation
Once your app is installed, it will appear in your Installed Apps folder, and dashboard panels will start to fill automatically.
Each panel slowly fills with data matching the time range query received since the panel was created. Results will not immediately be available but will be updated with full graphs and charts over time.
As part of the app installation process, the following fields will be created by default:
account: The friendly name or alias assigned to the AWS account.region: The geographical region where the AWS resource is located (for example, us-east-1 or eu-west-2).accountid: The unique 12-digit identifier for the AWS account where the resource is present.namespace: The AWS service namespace that the resource or metric belongs to (for example, AWS/Bedrock-AgentCore).agentcore_resource_type: A specific type of resource within AWS Bedrock AgentCore (for example, runtime, memory, gateway, browser, code-interpreter, or identity).agentcore_resource_id: A specific identifier for resource within AWS Bedrock AgentCore.
Viewing the Bedrock AgentCore dashboards
We highly recommend you view these dashboards in the AWS Observability view of the AWS Observability solution.
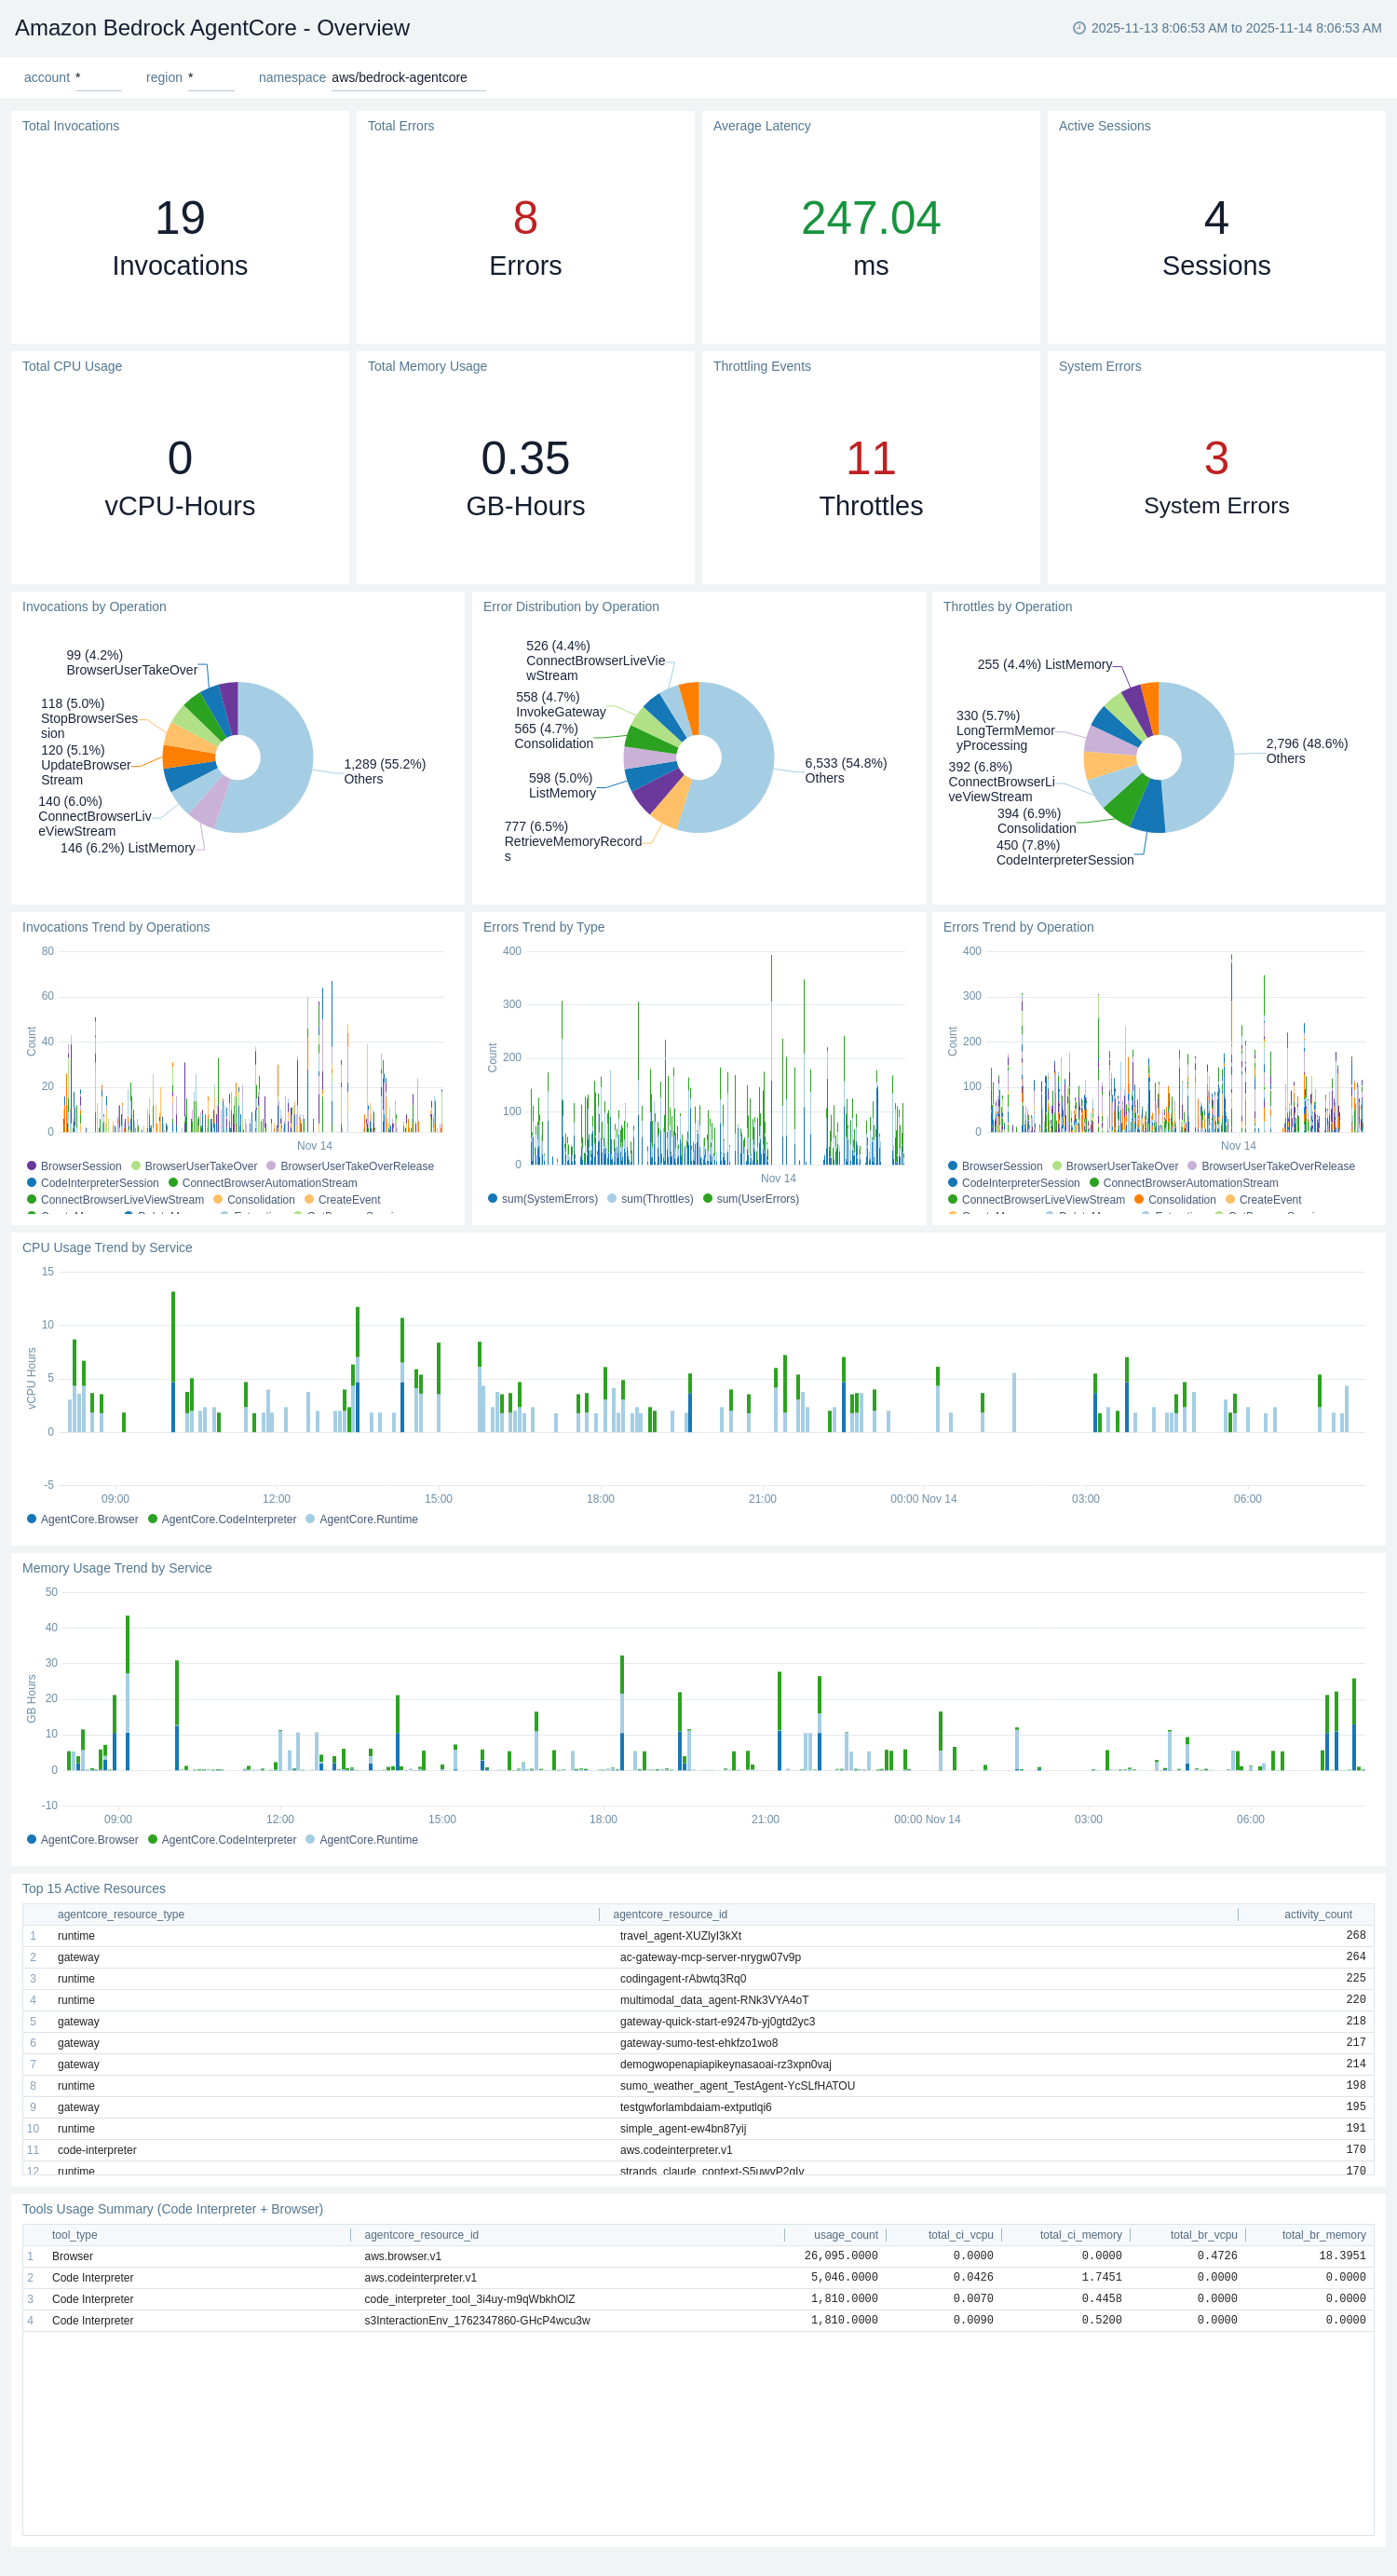
Overview
The Amazon Bedrock AgentCore - Overview dashboard provides a high-level overview of the entire Amazon Bedrock AgentCore environment, combining metrics and logs to provide comprehensive visibility across Runtime, Gateway, Memory, Code Interpreter, and Browser services. This dashboard serves as a central monitoring hub for all AgentCore operations.
Use this dashboard to:
- Monitor total invocations, errors, average latency, and active sessions across all AgentCore services.
- Track resource usage including total CPU (vCPU-Hours) and memory (GB-Hours) consumption.
- Analyze throttling events and system errors indicating service health issues.
- View invocation trends by operation and identify usage patterns over time.
- Examine error distribution by type (System Errors, User Errors, Throttles) and operation.
- Monitor CPU and memory usage trends segmented by service (Runtime, Gateway, Memory, Tools).
- Identify top 15 active resources by type and ID based on activity count.
- Track Code Interpreter and Browser tool usage including resource consumption metrics.
- Visualize invocations, errors, and throttles distribution by operation using pie charts.
- Compare errors trend across different operations over time.
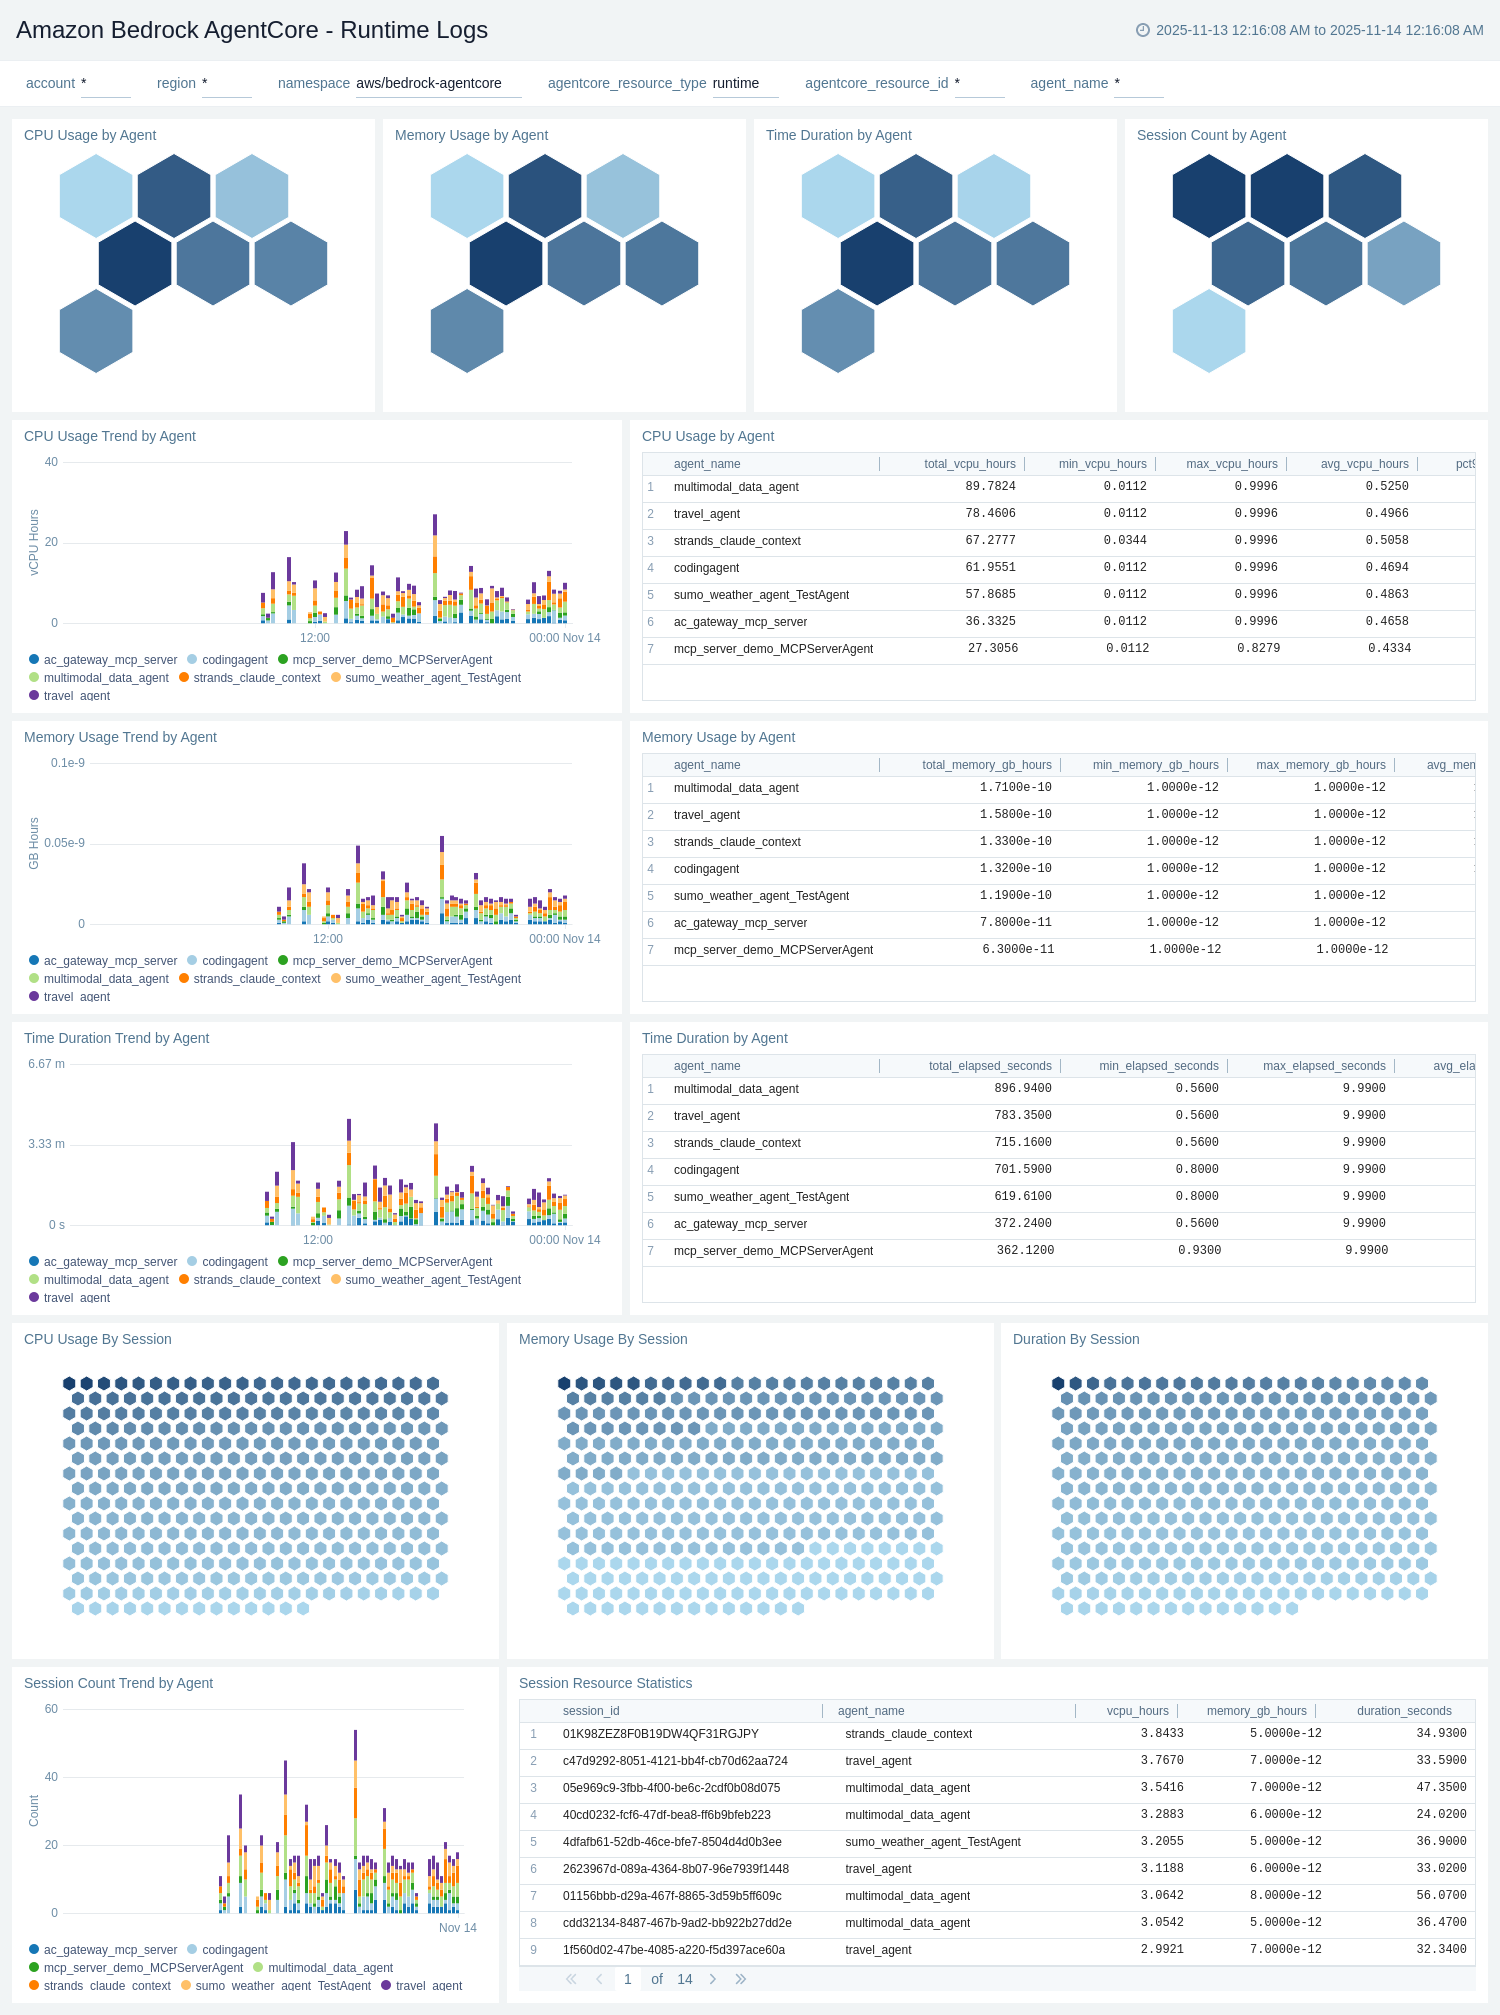
Runtime Logs
The Amazon Bedrock AgentCore - Runtime Logs dashboard provides detailed insights into agent runtime execution by analyzing CloudWatch APPLICATION_LOGS and USAGE_LOGS. It tracks agent invocations, session activities, error patterns, and performance metrics at the runtime level.
Use this dashboard to:
- Monitor agent runtime invocations by session ID, agent ID, and operation type.
- Track InvokeAgentRuntime operation counts and identify high-volume agents.
- Analyze error patterns including system errors, user errors, and error messages.
- Monitor session-level metrics including session count, duration, and activity trends.
- Track agent endpoint invocations and identify top agents by usage.
- Analyze error distribution by agent ID and session to troubleshoot runtime issues.
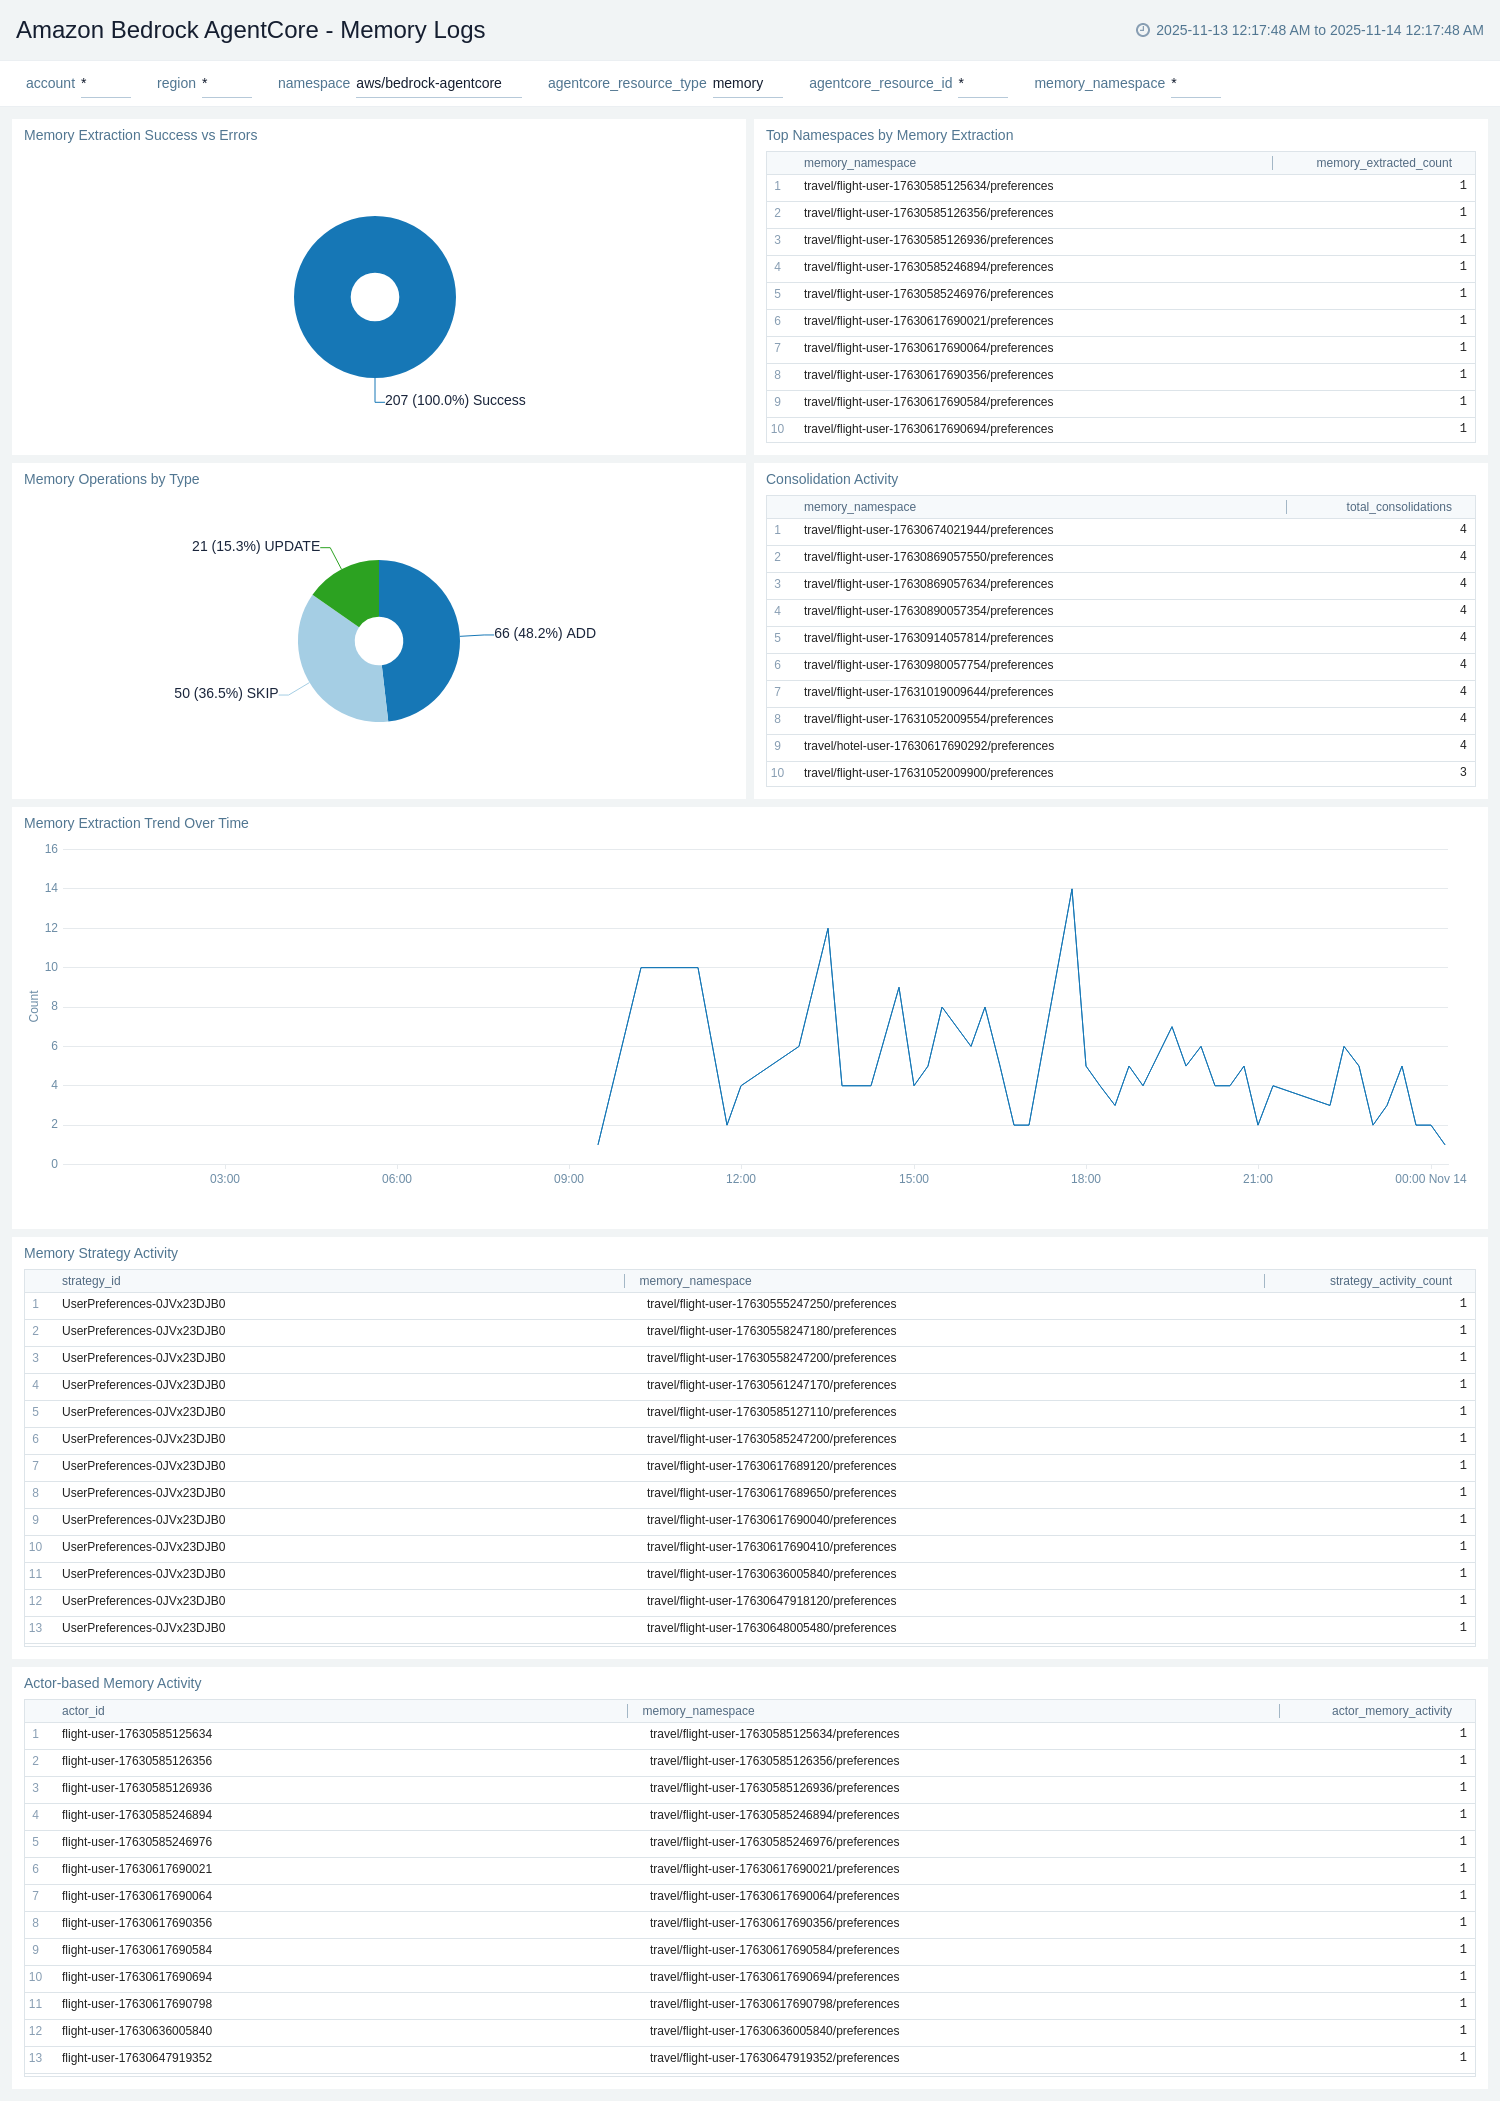
Memory Logs
The Amazon Bedrock AgentCore - Memory Logs dashboard provides detailed insights into memory operations by analyzing CloudWatch APPLICATION_LOGS. It tracks memory event creation, retrieval, consolidation, and extraction processes at the session and namespace level.
Use this dashboard to:
- Monitor memory operations including CreateEvent, GetEvent, DeleteEvent, and RetrieveMemoryRecords.
- Track memory extraction and consolidation activities by session ID and namespace.
- Analyze memory-related errors and troubleshoot memory operation failures.
- Monitor memory event trends over time and identify usage patterns.
- Track namespace-specific memory operations and session-level memory activities.
- Identify high-volume memory operations and potential optimization opportunities.
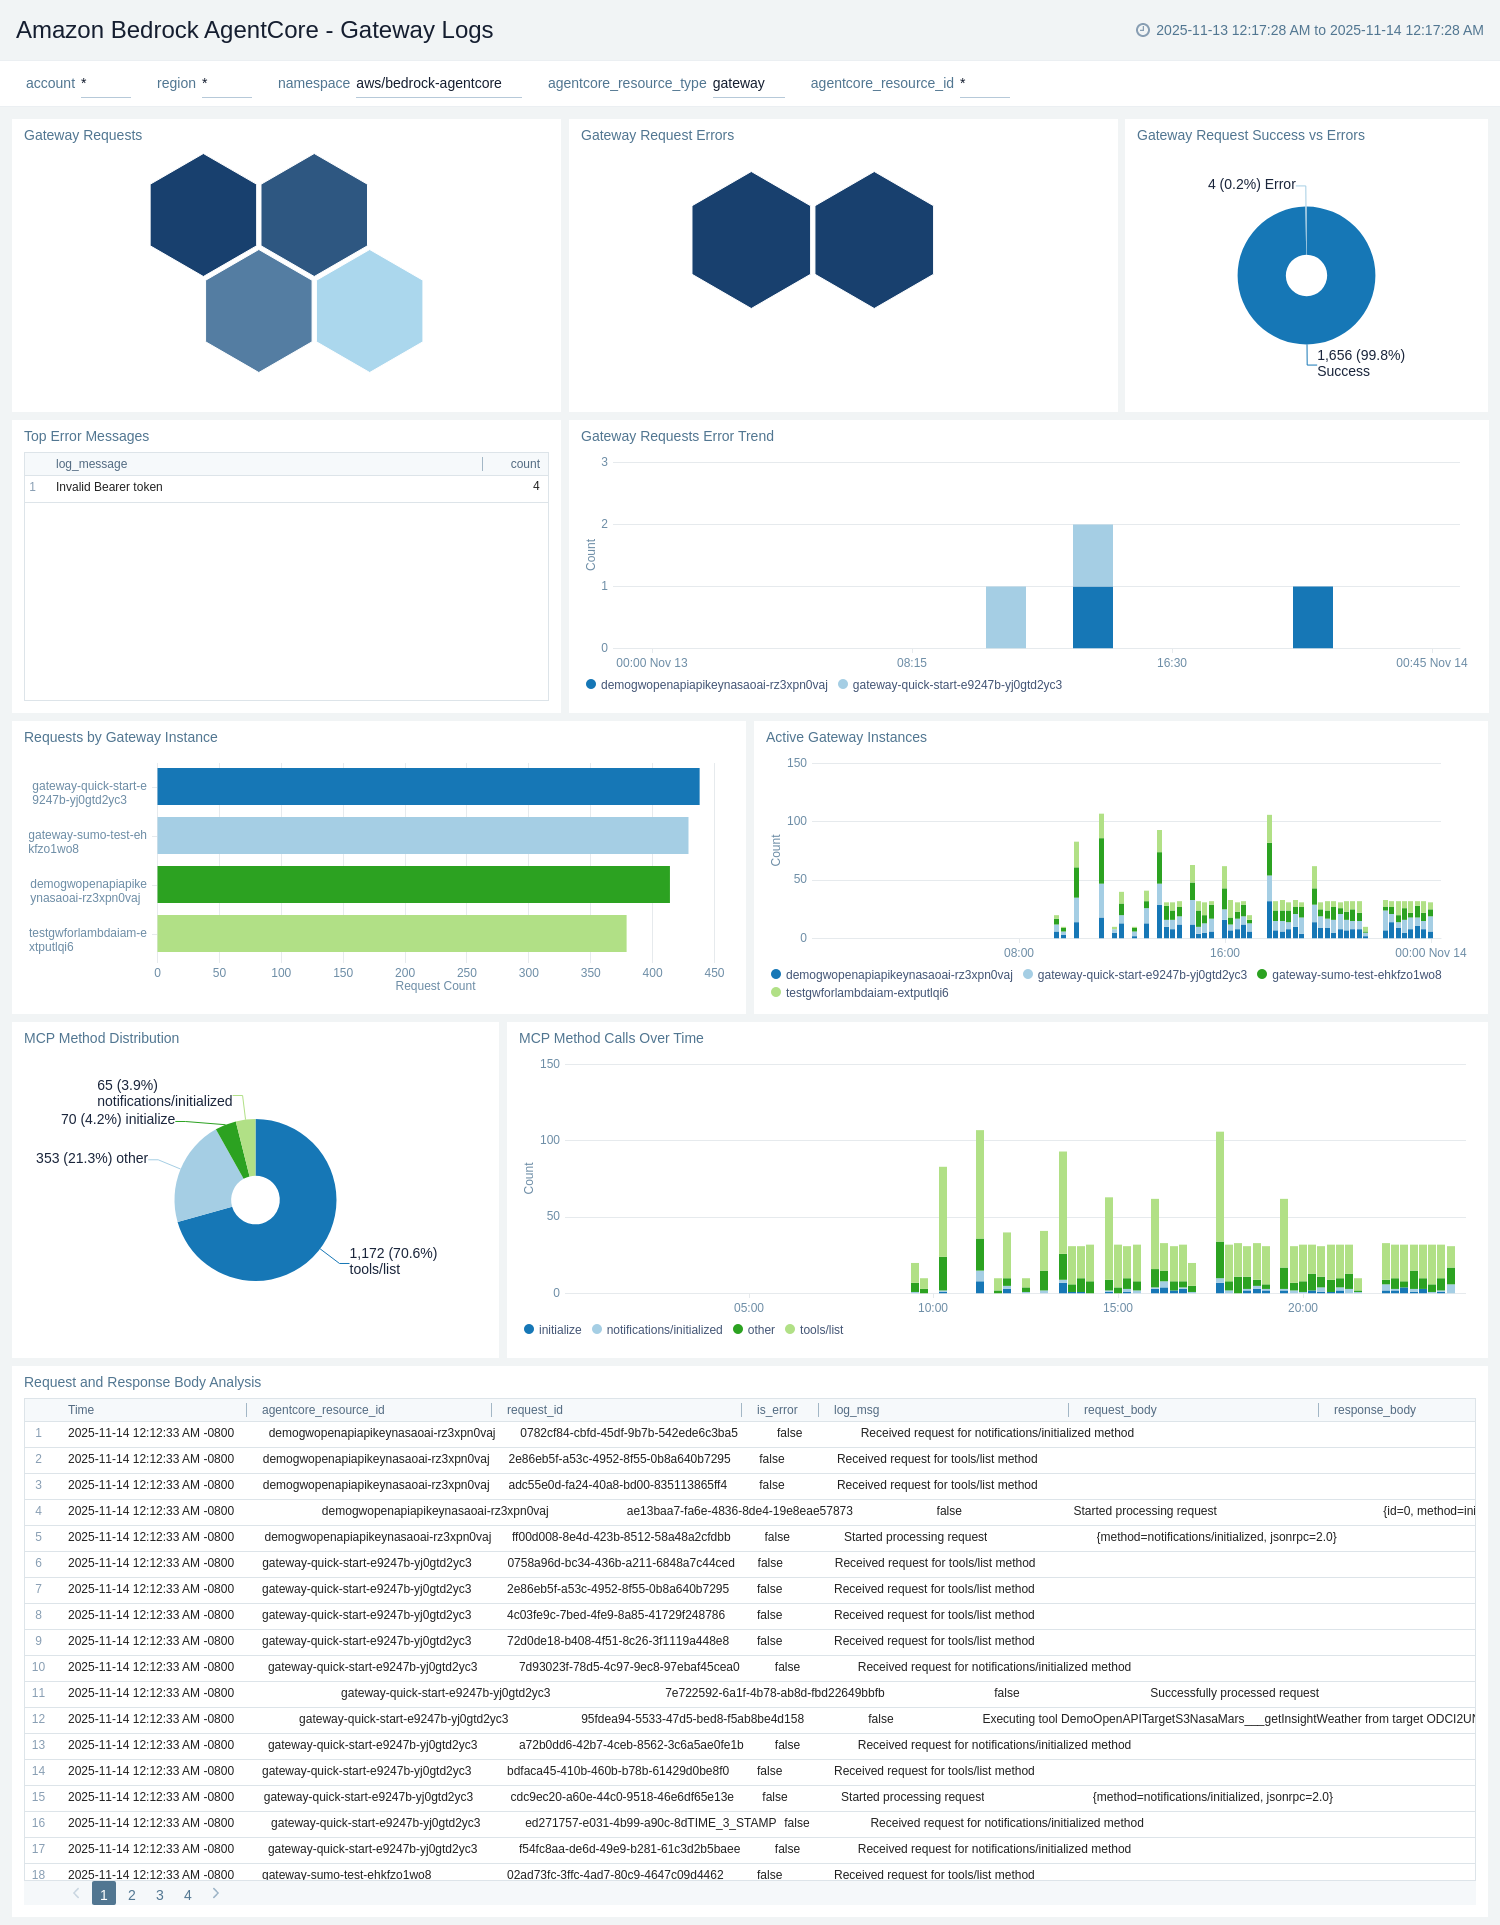
Gateway Logs
The Amazon Bedrock AgentCore - Gateway Logs dashboard provides detailed insights into gateway operations by analyzing CloudWatch APPLICATION_LOGS. It tracks MCP (Model Context Protocol) operations, tool invocations, gateway errors, and search activities.
Use this dashboard to:
- Monitor gateway invocations by target type (MCP, Lambda, OpenAPI) and protocol.
- Track tool invocations and analyze tool usage patterns across sessions.
- Analyze gateway errors including connection failures, timeout errors, and MCP-specific issues.
- Monitor MCP operations such as ListTools, CallTool, ListResources, and ReadResource.
- Track search operations and gateway target execution patterns.
- Identify problematic gateways, tools, or sessions with high error rates.
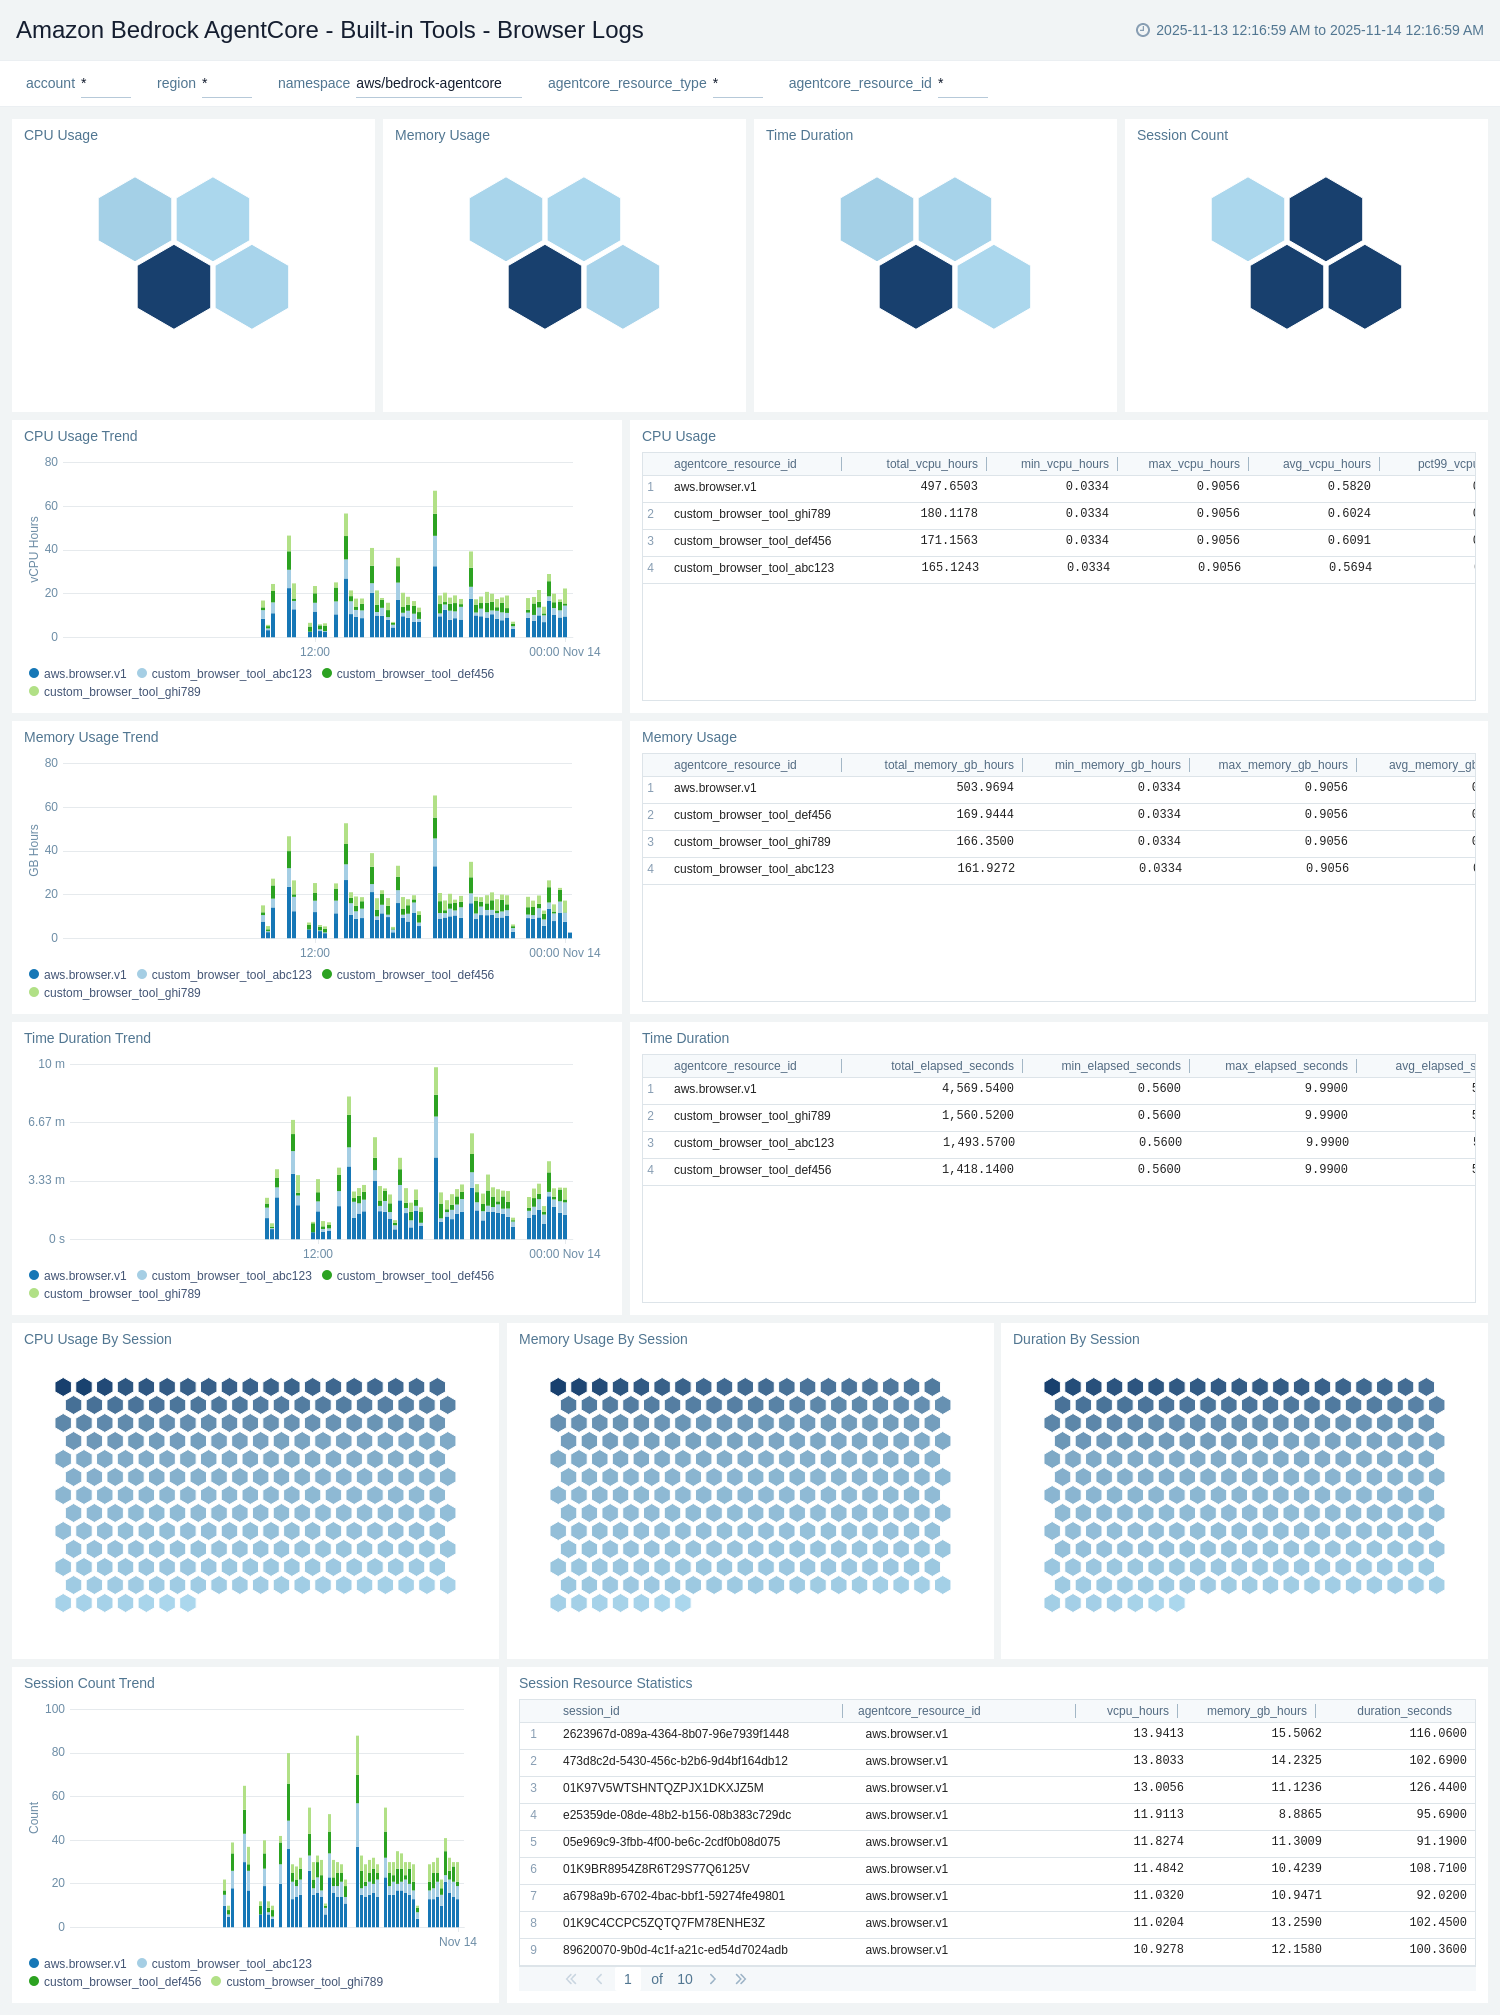
Built-in Tools - Browser Logs
The Amazon Bedrock AgentCore - Built-in Tools - Browser Logs dashboard provides detailed insights into browser tool operations by analyzing CloudWatch USAGE_LOGS. It tracks browser session creation, user takeover events, session duration, and browser-specific errors.
Use this dashboard to:
- Monitor browser tool invocations and session creation patterns.
- Track browser user takeover events including takeover duration and end time.
- Analyze browser session metrics including session count, duration, and expiration.
- Monitor browser-specific errors and troubleshoot browser tool issues.
- Track browser session trends over time and identify high-usage sessions.
- Monitor browser resource usage and session lifecycle events.
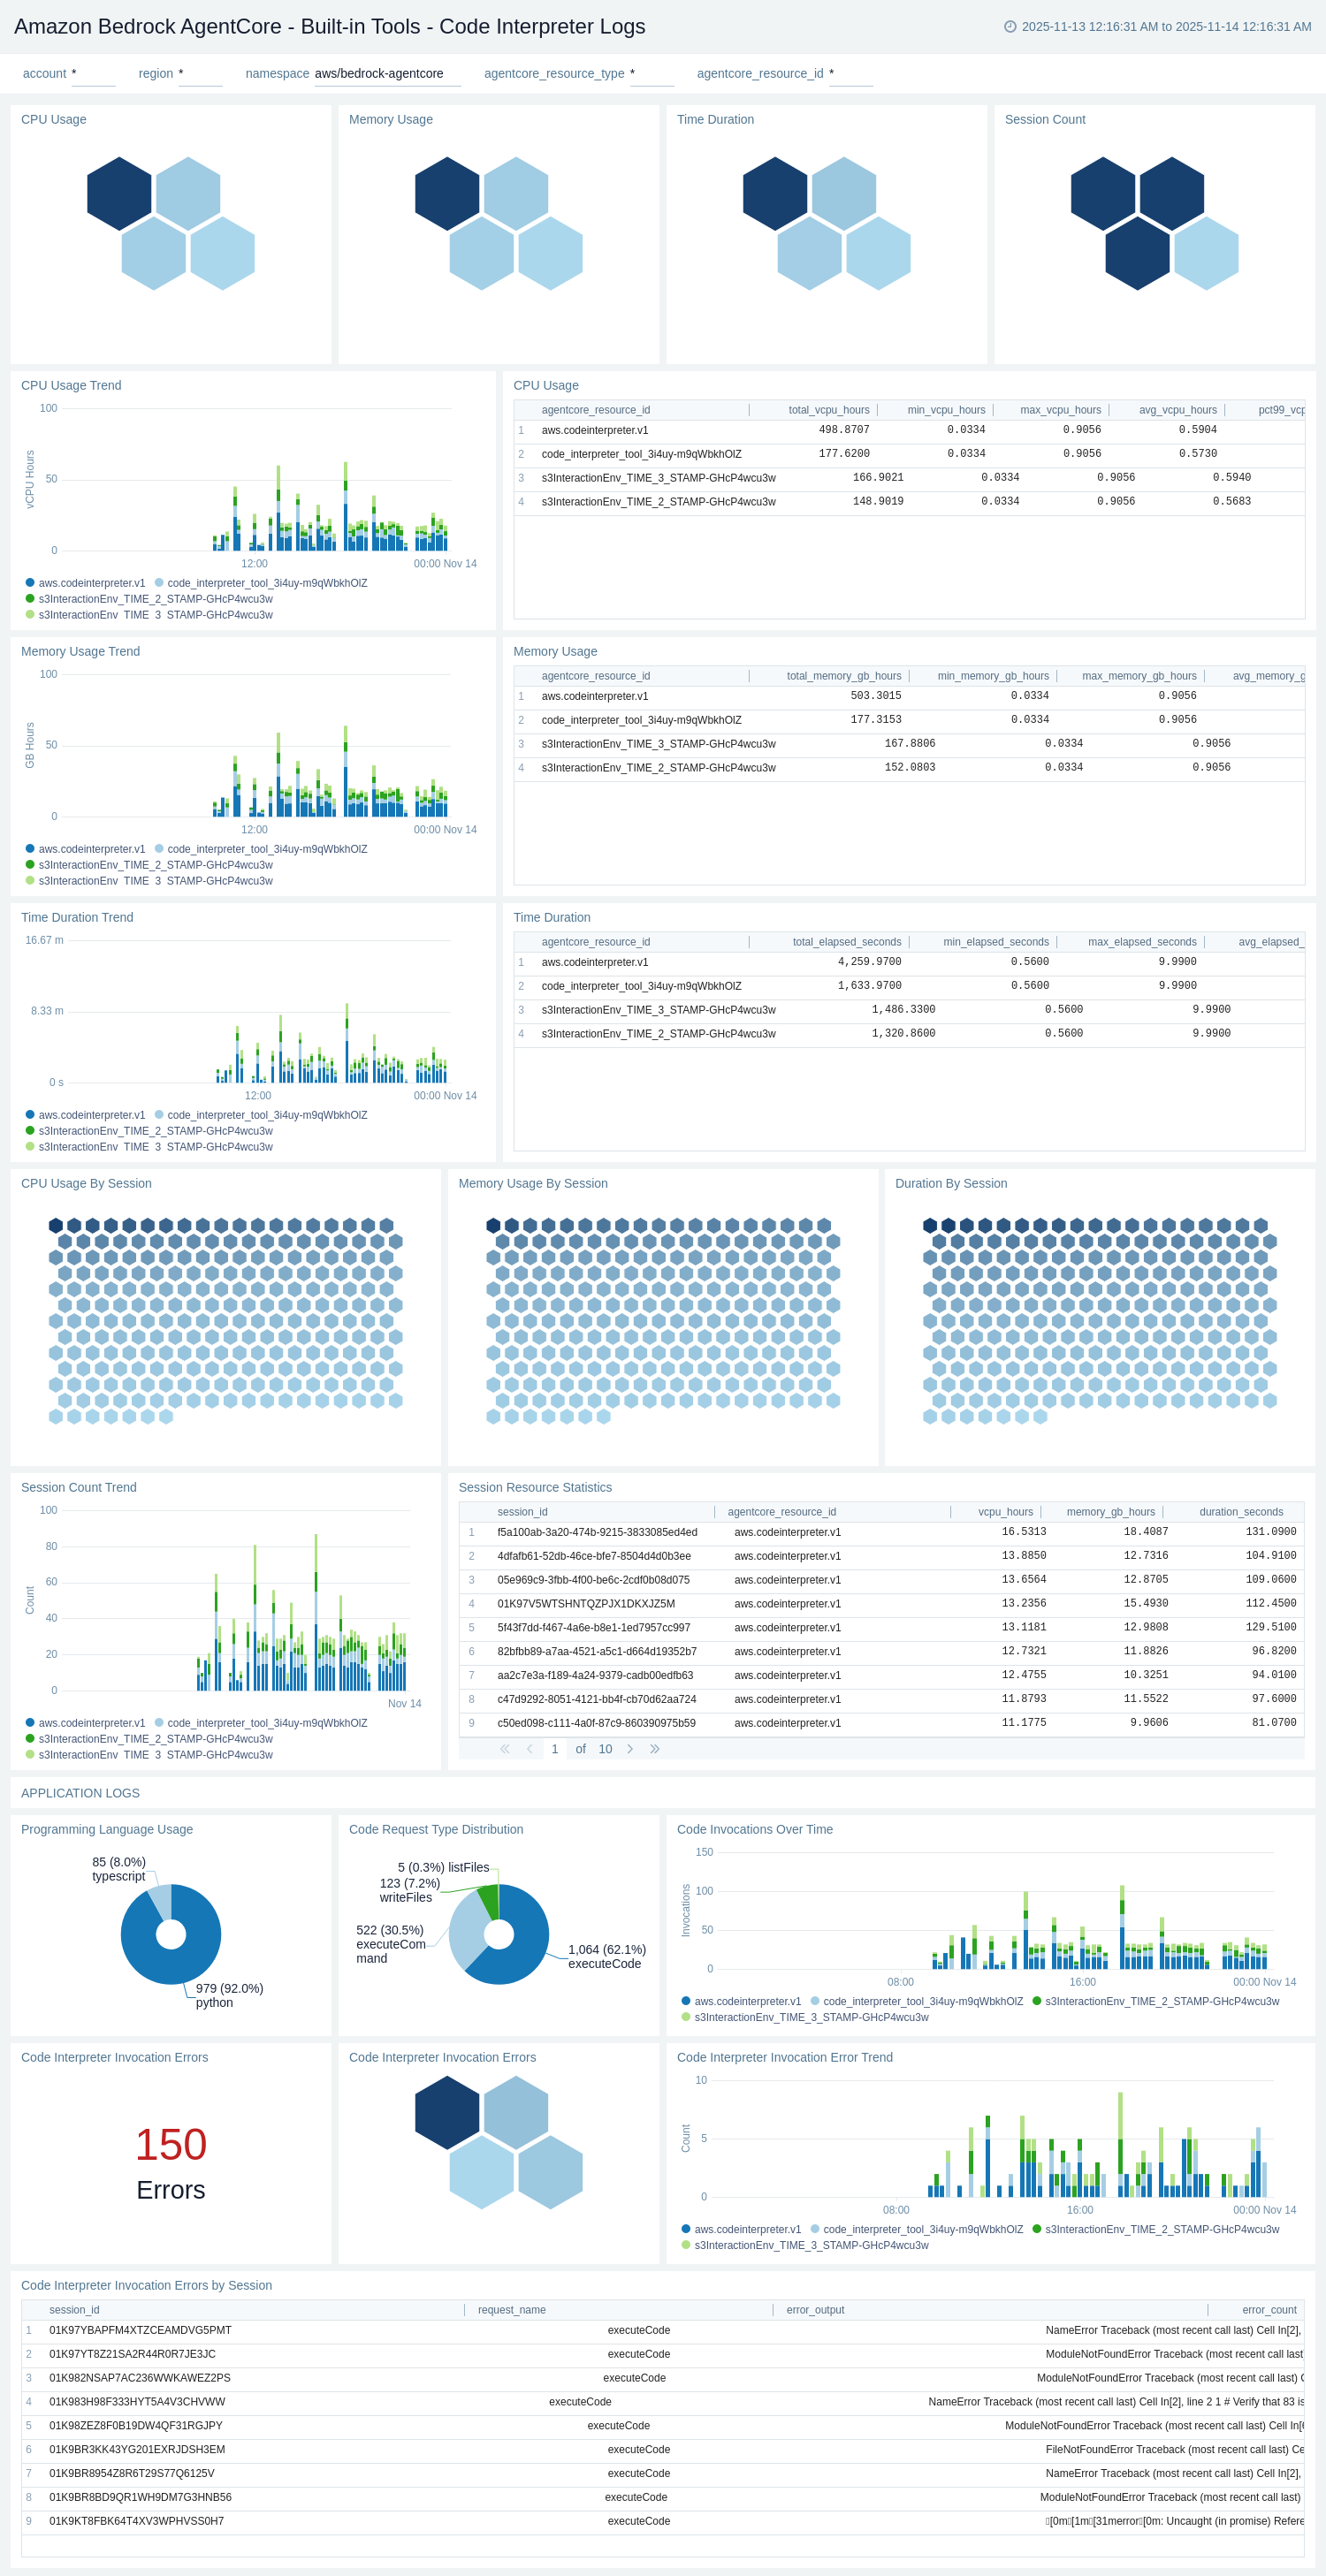
Built-in Tools - Code Interpreter Logs
The Amazon Bedrock AgentCore - Built-in Tools - Code Interpreter Logs dashboard provides detailed insights into code interpreter operations by analyzing CloudWatch USAGE_LOGS and APPLICATION_LOGS. It tracks code execution events, session lifecycle, error patterns, and interpreter-specific operations.
Use this dashboard to:
- Monitor code interpreter invocations and session creation patterns.
- Track code execution events including execution count, duration, and error rates.
- Analyze code interpreter session metrics including session count, duration, and expiration.
- Monitor code interpreter errors and troubleshoot code execution issues.
- Track file operations including file upload, download, and deletion activities.
- Monitor code interpreter usage trends and identify high-volume sessions.
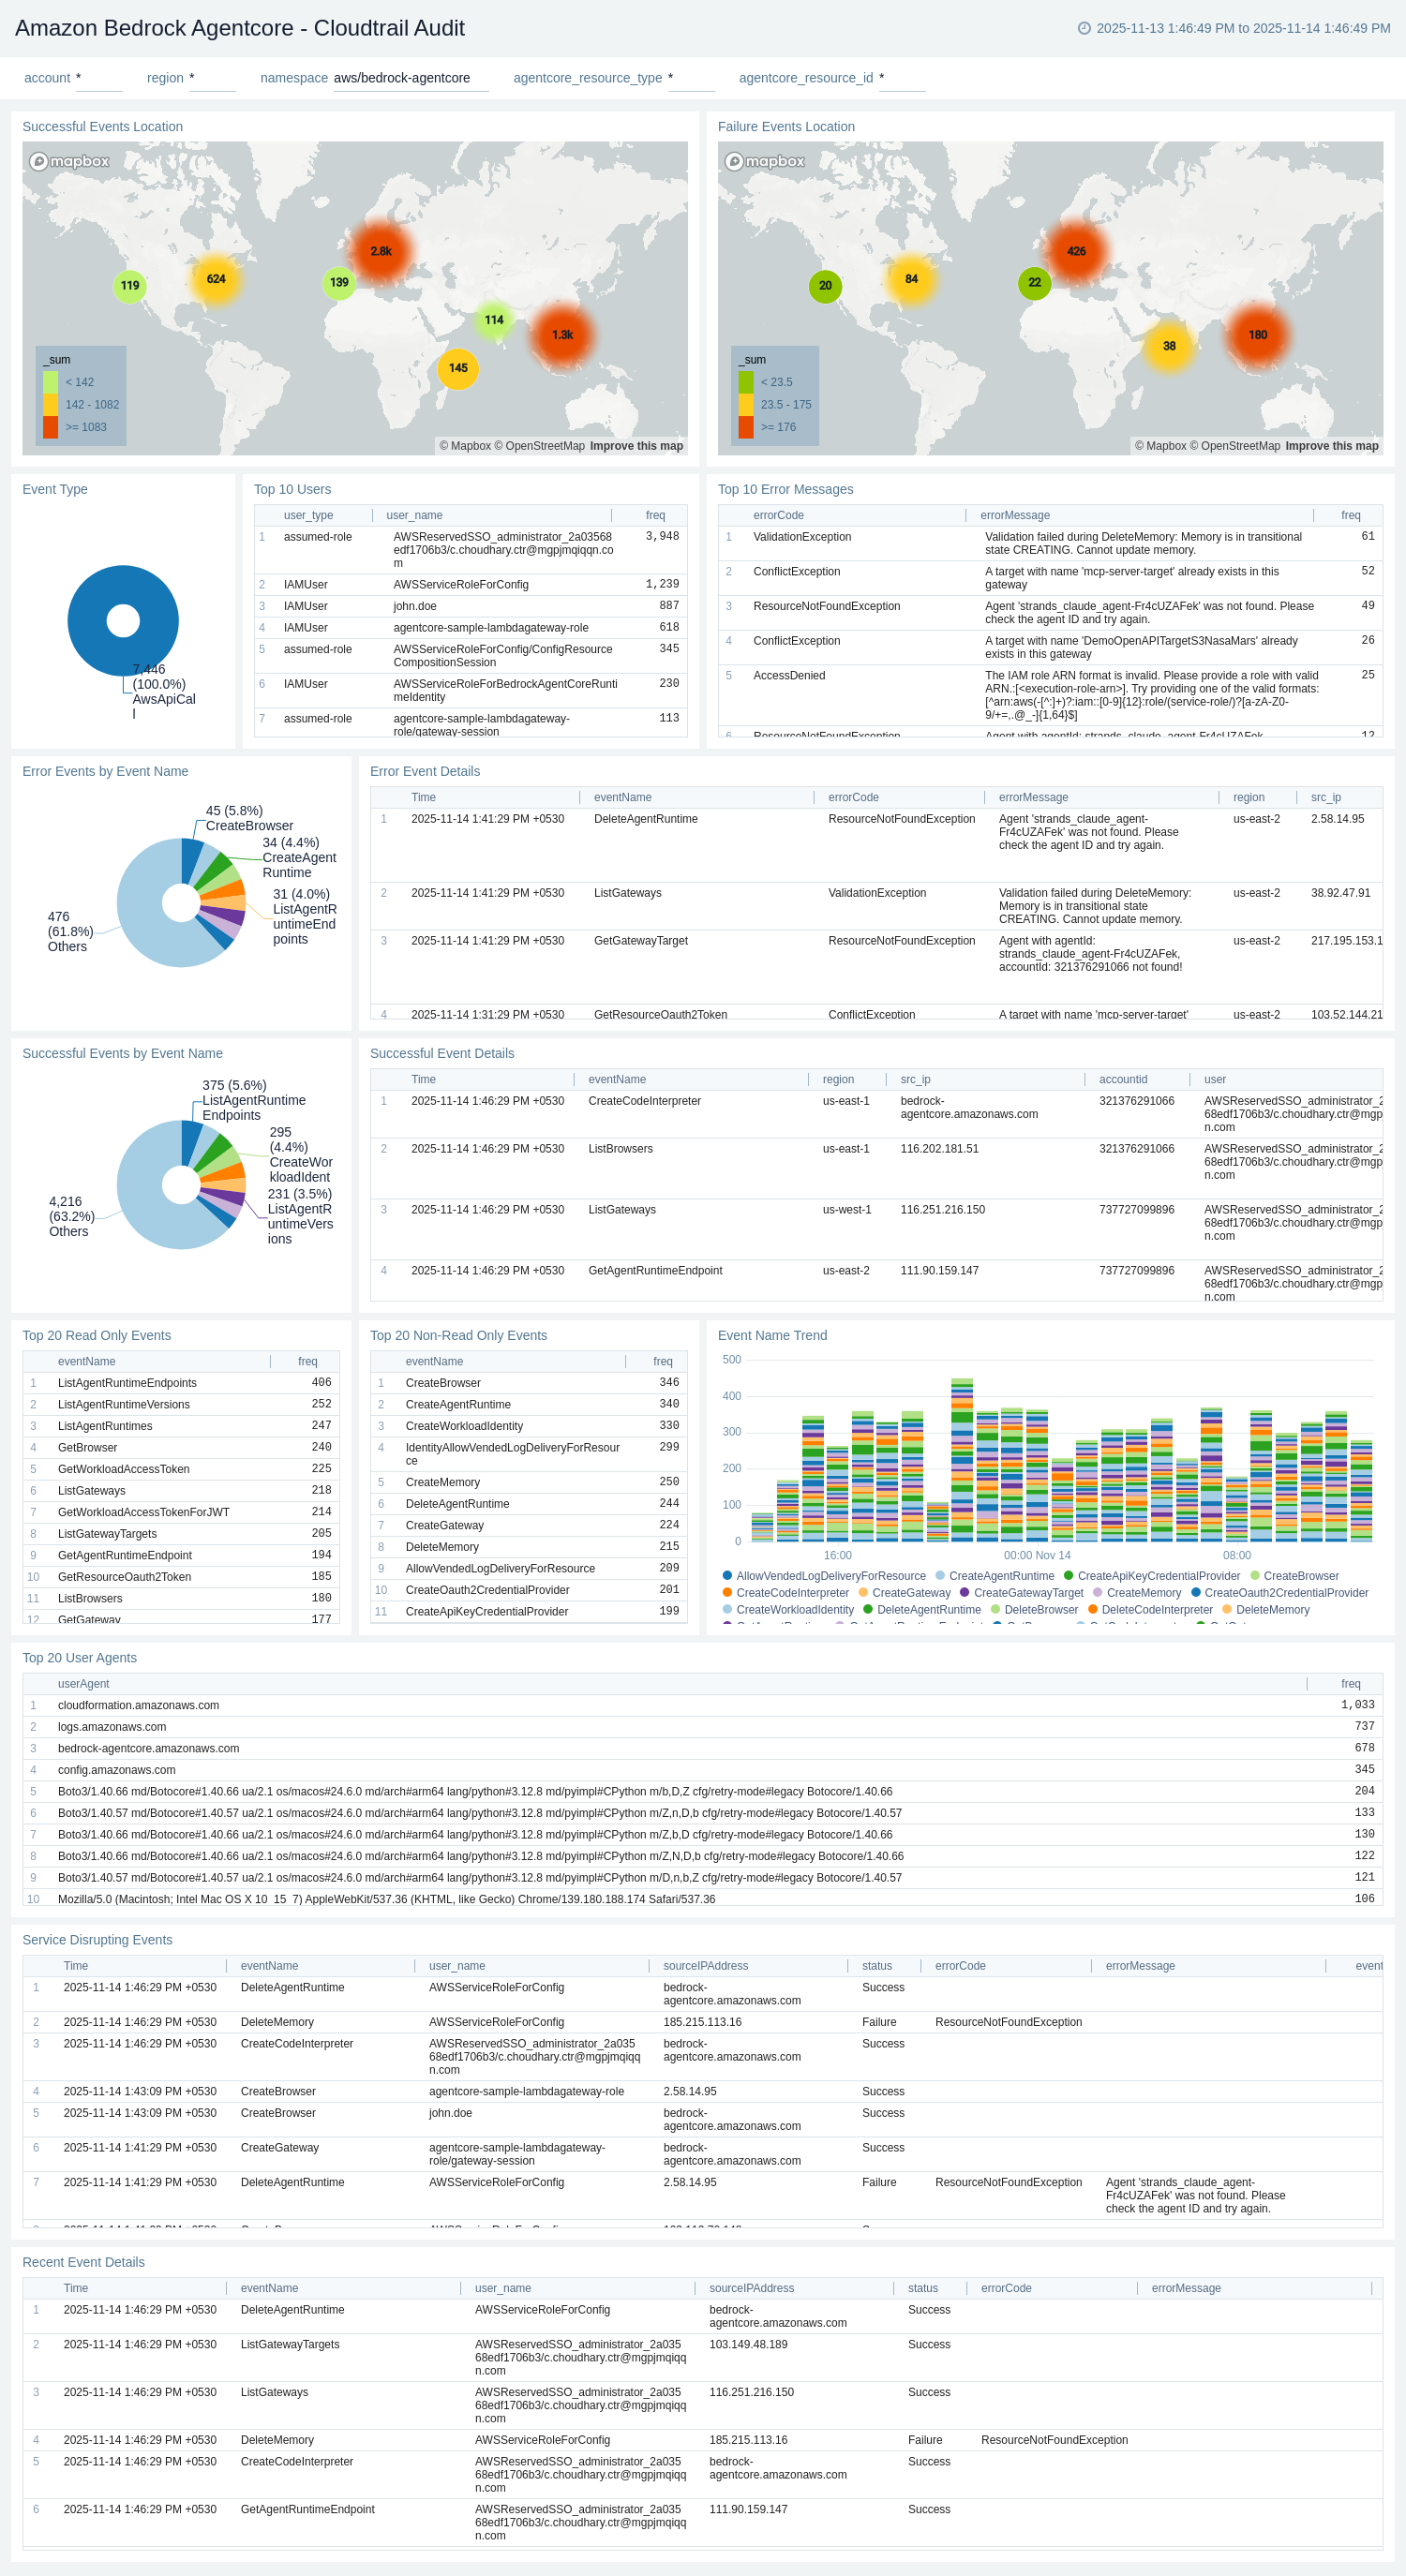
CloudTrail Audit
The Amazon Bedrock AgentCore - CloudTrail Audit dashboard provides comprehensive visibility into CloudTrail audit events for all AgentCore API operations. It tracks user activities, API calls, authentication events, and error patterns across agent, memory, gateway, and identity resources.
Use this dashboard to:
- Monitor CloudTrail events by status (success/failure) and track overall API call patterns.
- Identify top error codes and error messages from AgentCore API operations.
- Track users, IAM roles, and source IPs associated with AgentCore activities.
- Analyze event trends by event type, event name, and resource operations.
- Monitor disruptive events such as CreateAgent, DeleteAgent, UpdateMemory, and gateway configuration changes.
- Investigate security and compliance concerns related to AgentCore resource access.
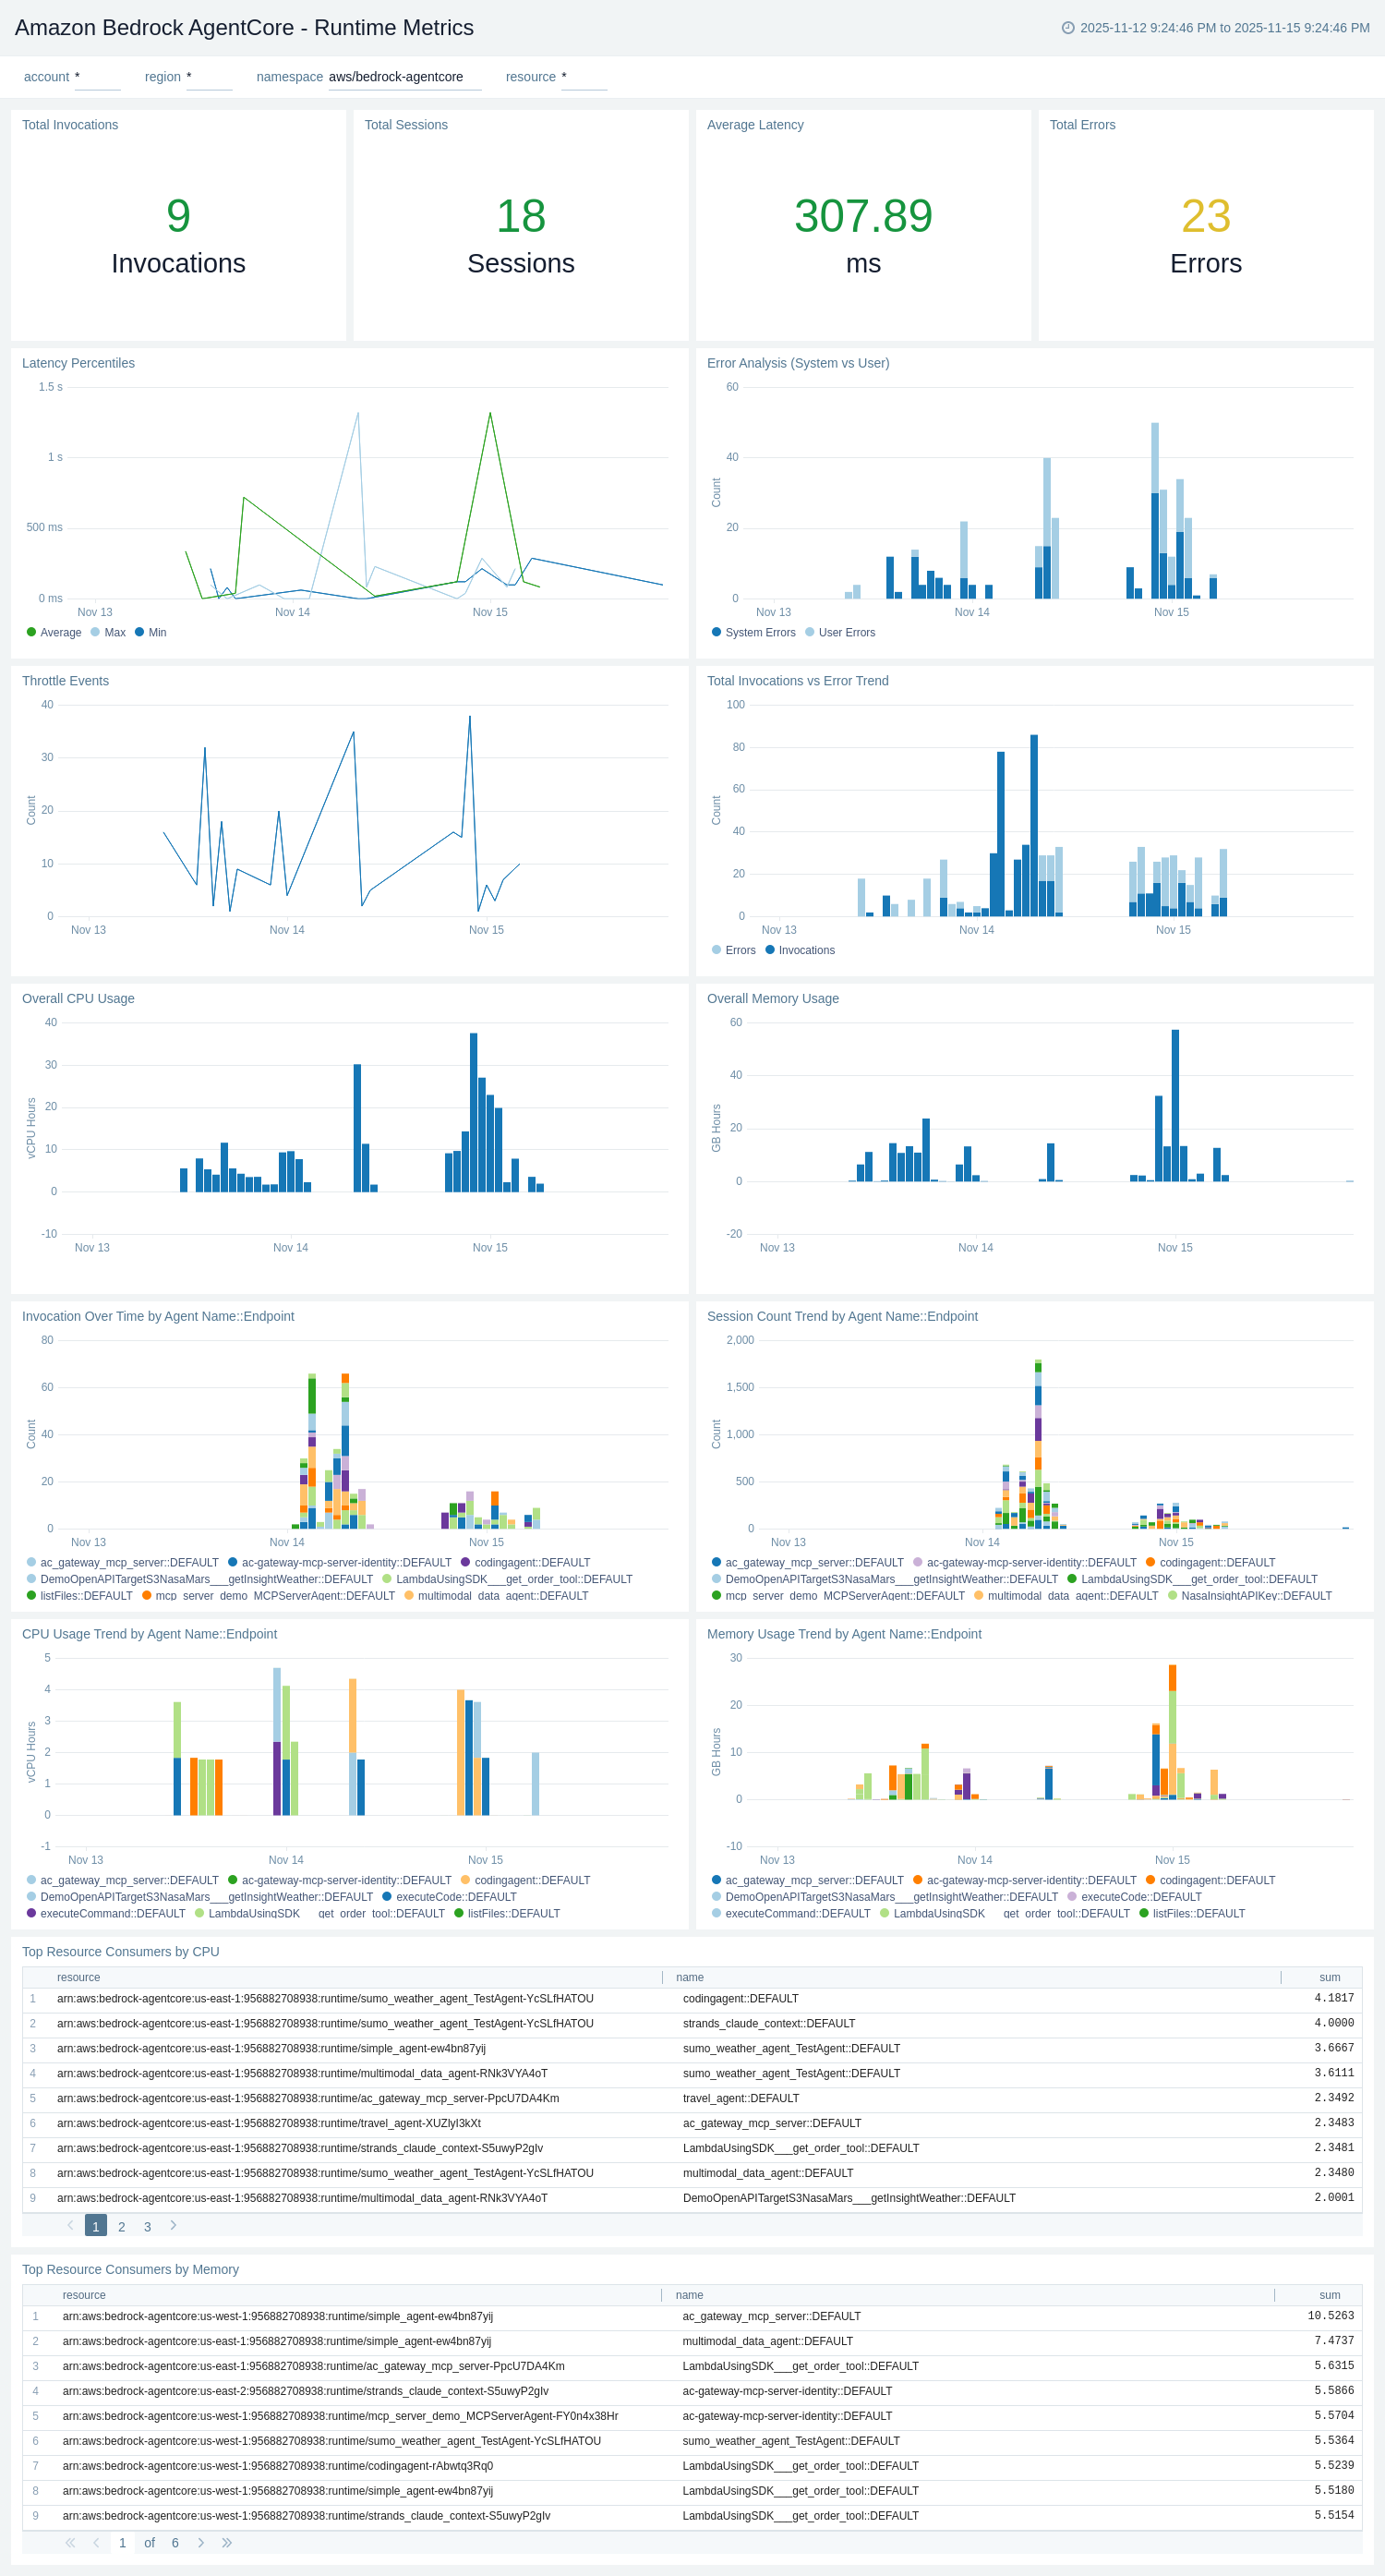
Runtime Metrics
The Amazon Bedrock AgentCore - Runtime Metrics dashboard provides CloudWatch metrics for agent runtime performance, resource utilization, and operational health. It complements the Runtime Logs dashboard with quantitative metrics data.
Use this dashboard to:
- Monitor agent runtime invocation counts and track usage trends over time.
- Track InvokeAgentRuntime operation latency and identify performance bottlenecks.
- Analyze system errors, user errors, and throttling events at the runtime level.
- Monitor resource usage metrics including vCPU-Hours and GB-Hours for agent runtimes.
- Track agent endpoint-level metrics and compare performance across different agents.
- Monitor session count trends and identify capacity planning needs.
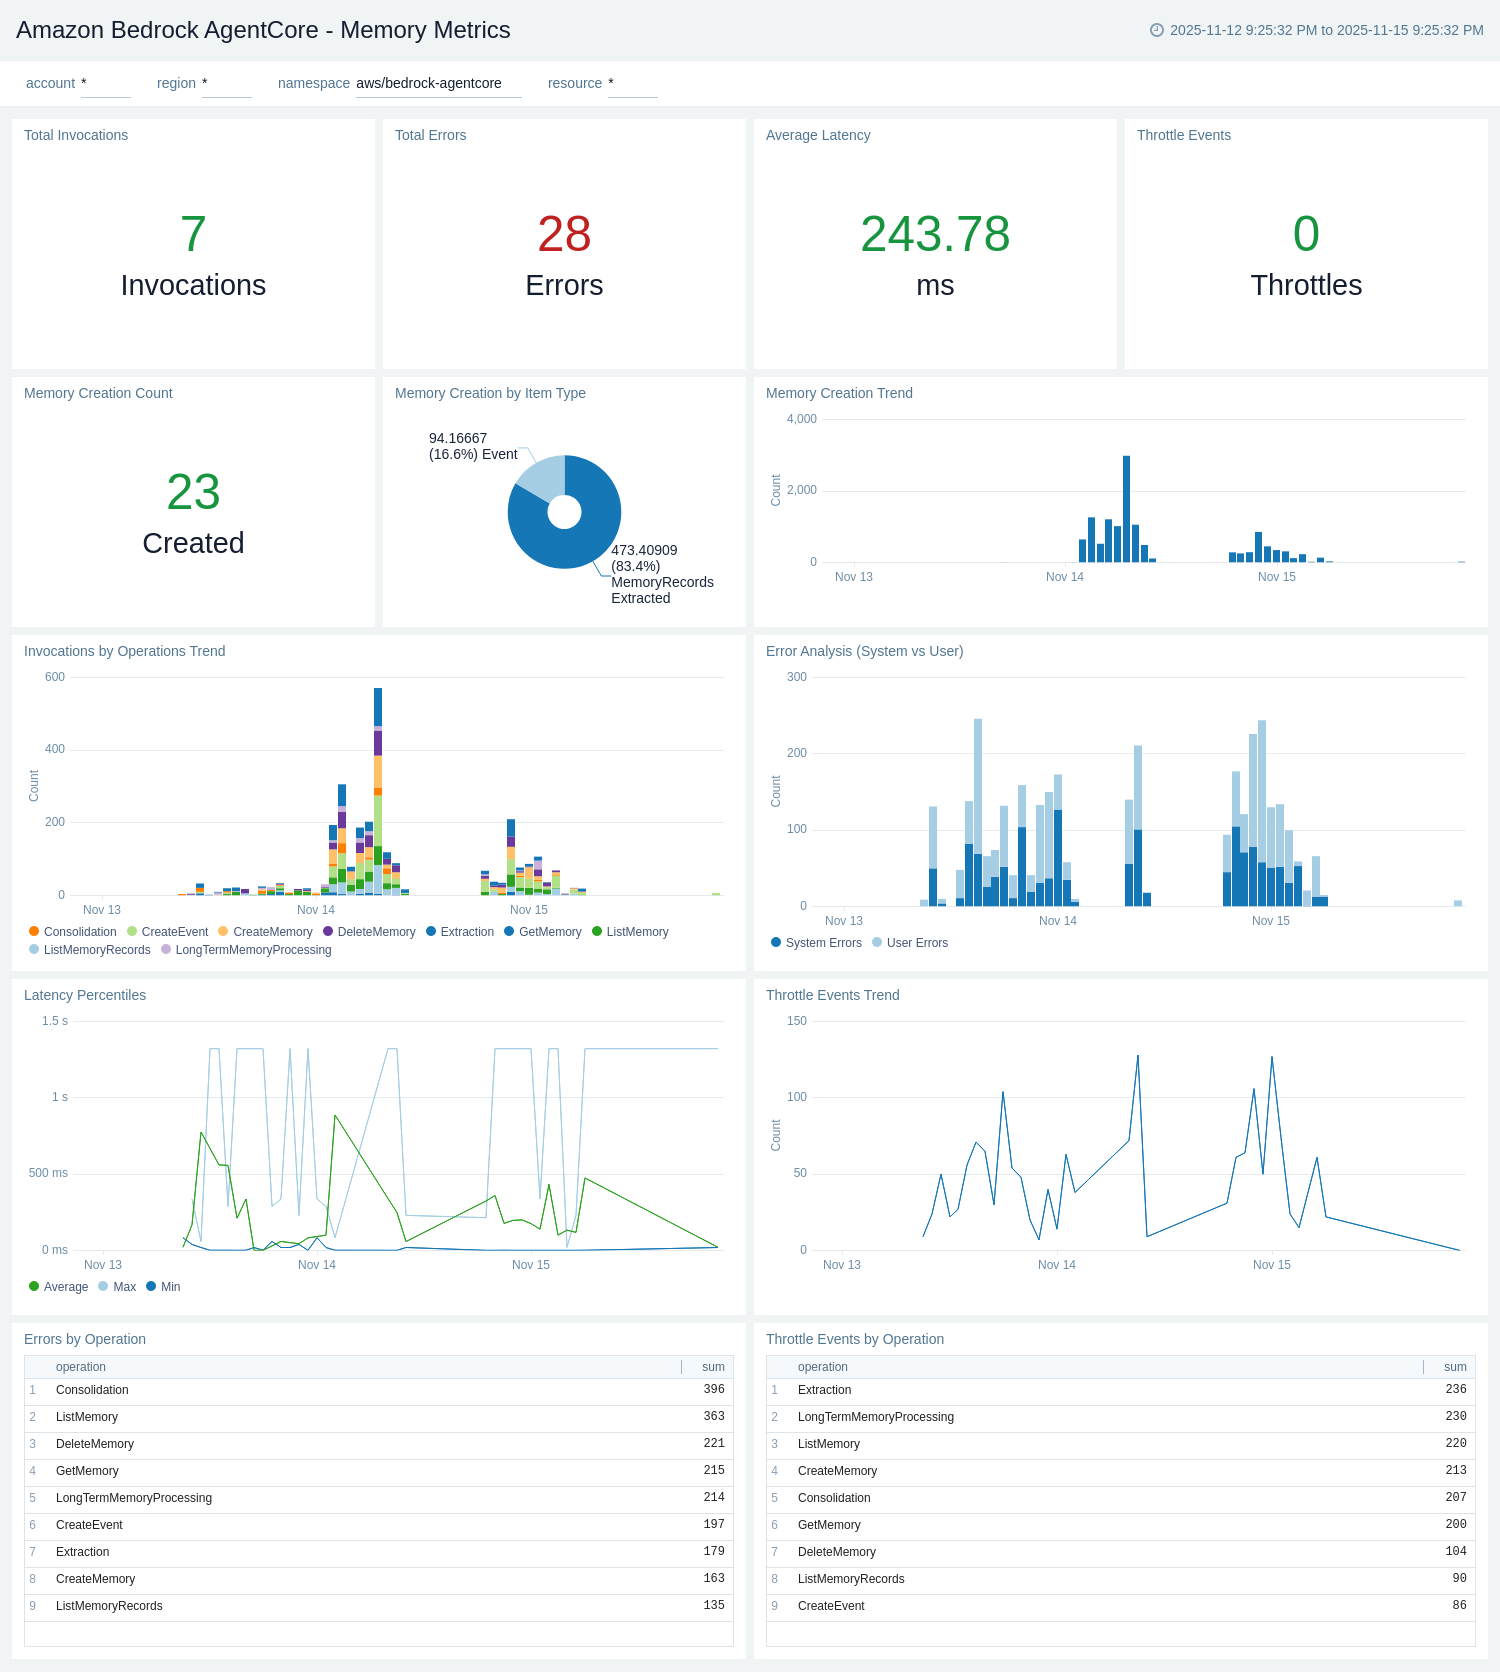
Memory Metrics
The Amazon Bedrock AgentCore - Memory Metrics dashboard provides CloudWatch metrics for memory service performance, operation counts, and error rates. It complements the Memory Logs dashboard with quantitative metrics data.
Use this dashboard to:
- Monitor memory operation invocation counts by operation type (CreateEvent, GetEvent, RetrieveMemoryRecords).
- Track memory operation latency and identify performance issues.
- Analyze memory-related system errors, user errors, and throttling events.
- Monitor memory resource usage and identify high-volume memory operations.
- Track memory invocation trends over time and compare across different memory resources.
- Monitor memory event creation and retrieval rates for capacity planning.
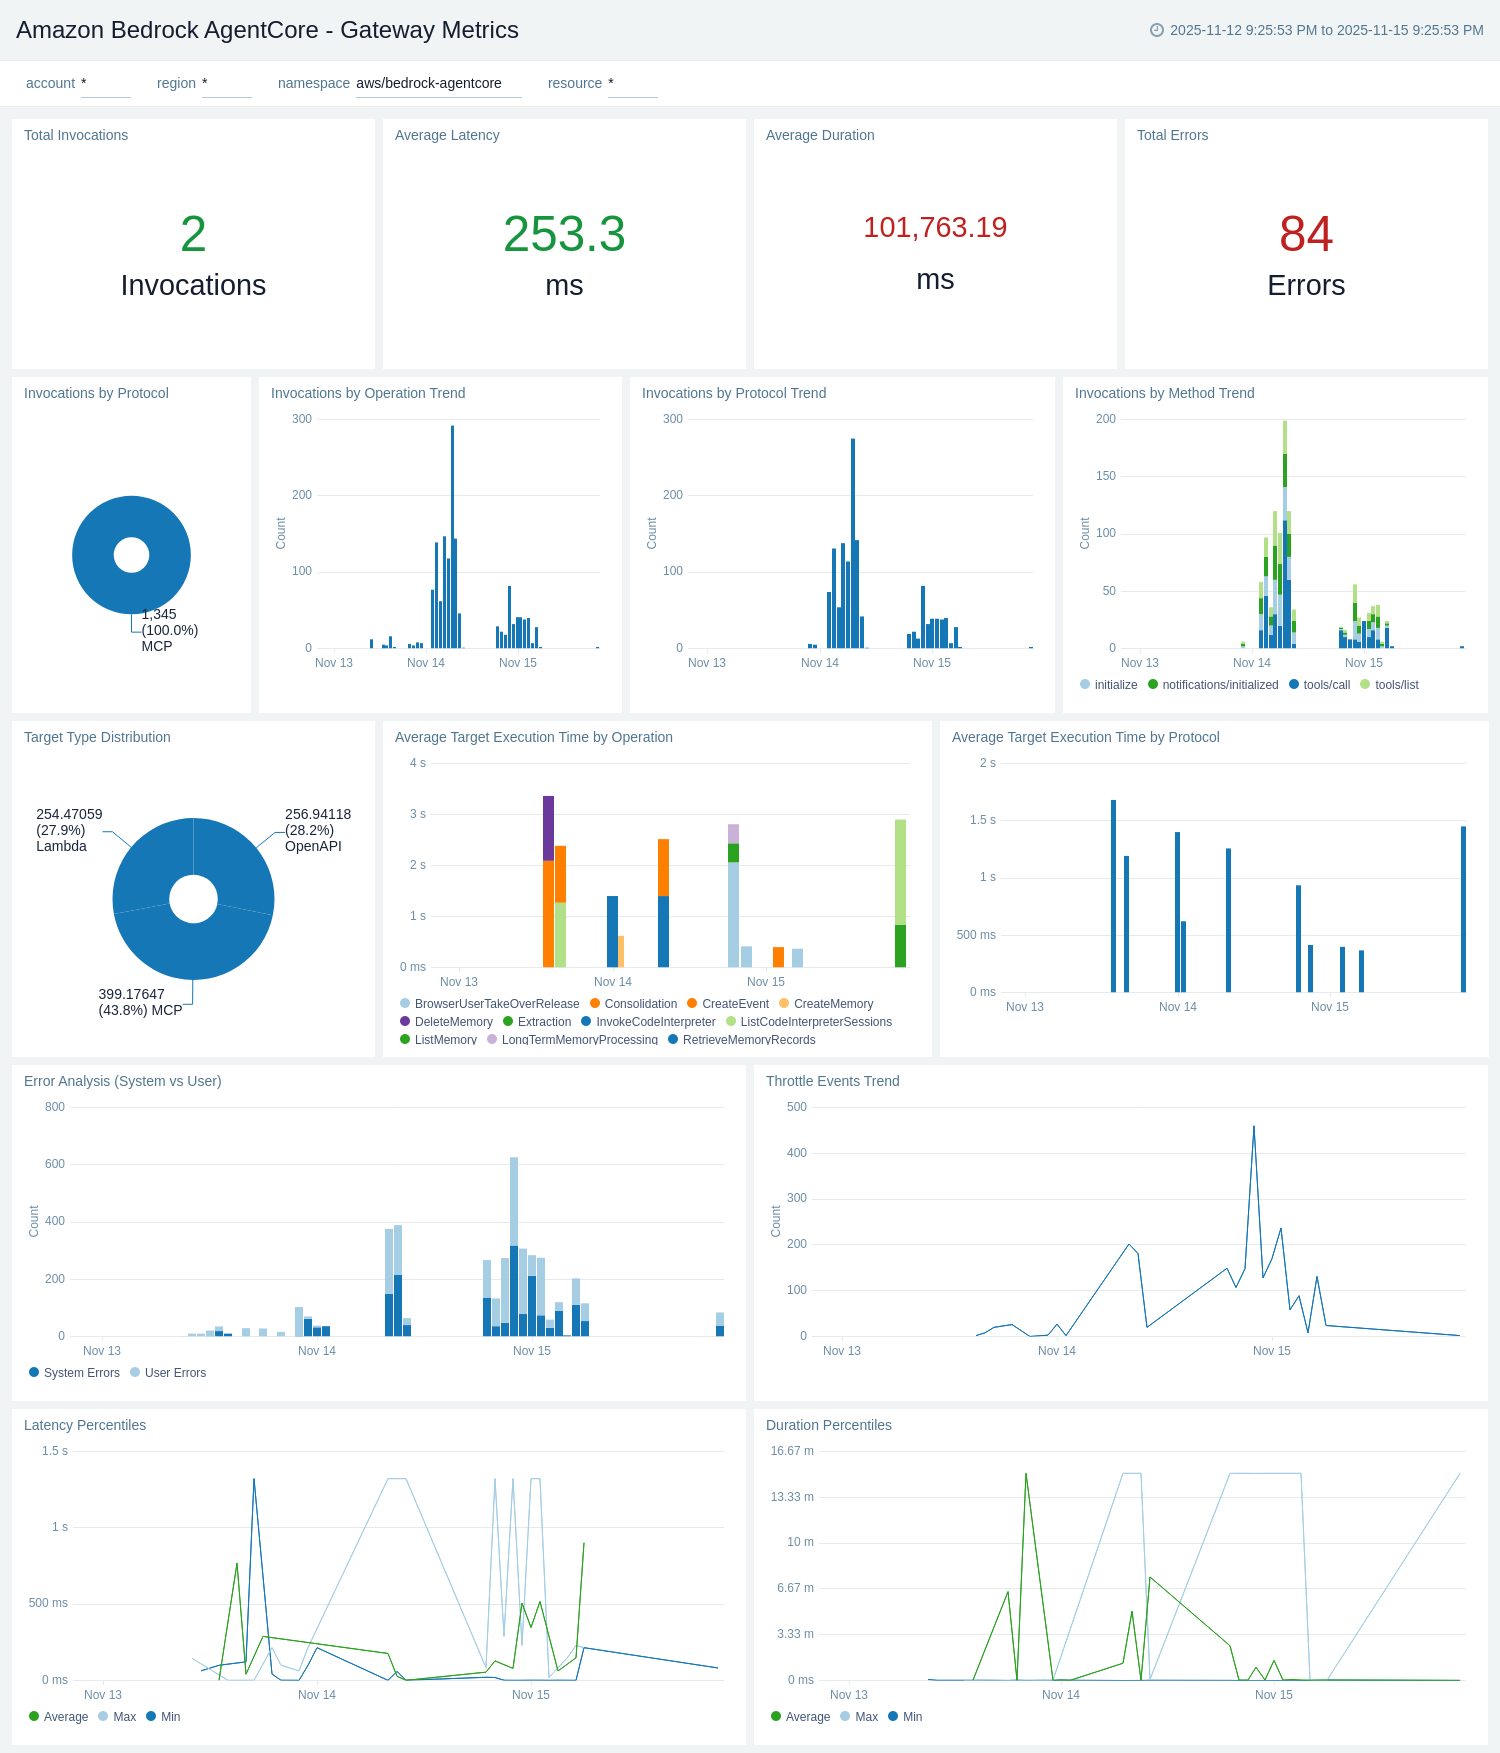
Gateway Metrics
The Amazon Bedrock AgentCore - Gateway Metrics dashboard provides CloudWatch metrics for gateway performance, latency, and operational health. It complements the Gateway Logs dashboard with quantitative metrics data.
Use this dashboard to:
- Monitor gateway invocation counts by target type and track usage trends.
- Track gateway operation latency, duration, and target execution time.
- Analyze gateway throttles, system errors, and user errors by target type.
- Monitor tool invocation metrics and compare performance across different tools.
- Track gateway duration trends and identify performance bottlenecks.
- Monitor gateway usage by target type (MCP, Lambda, OpenAPI) for capacity planning.
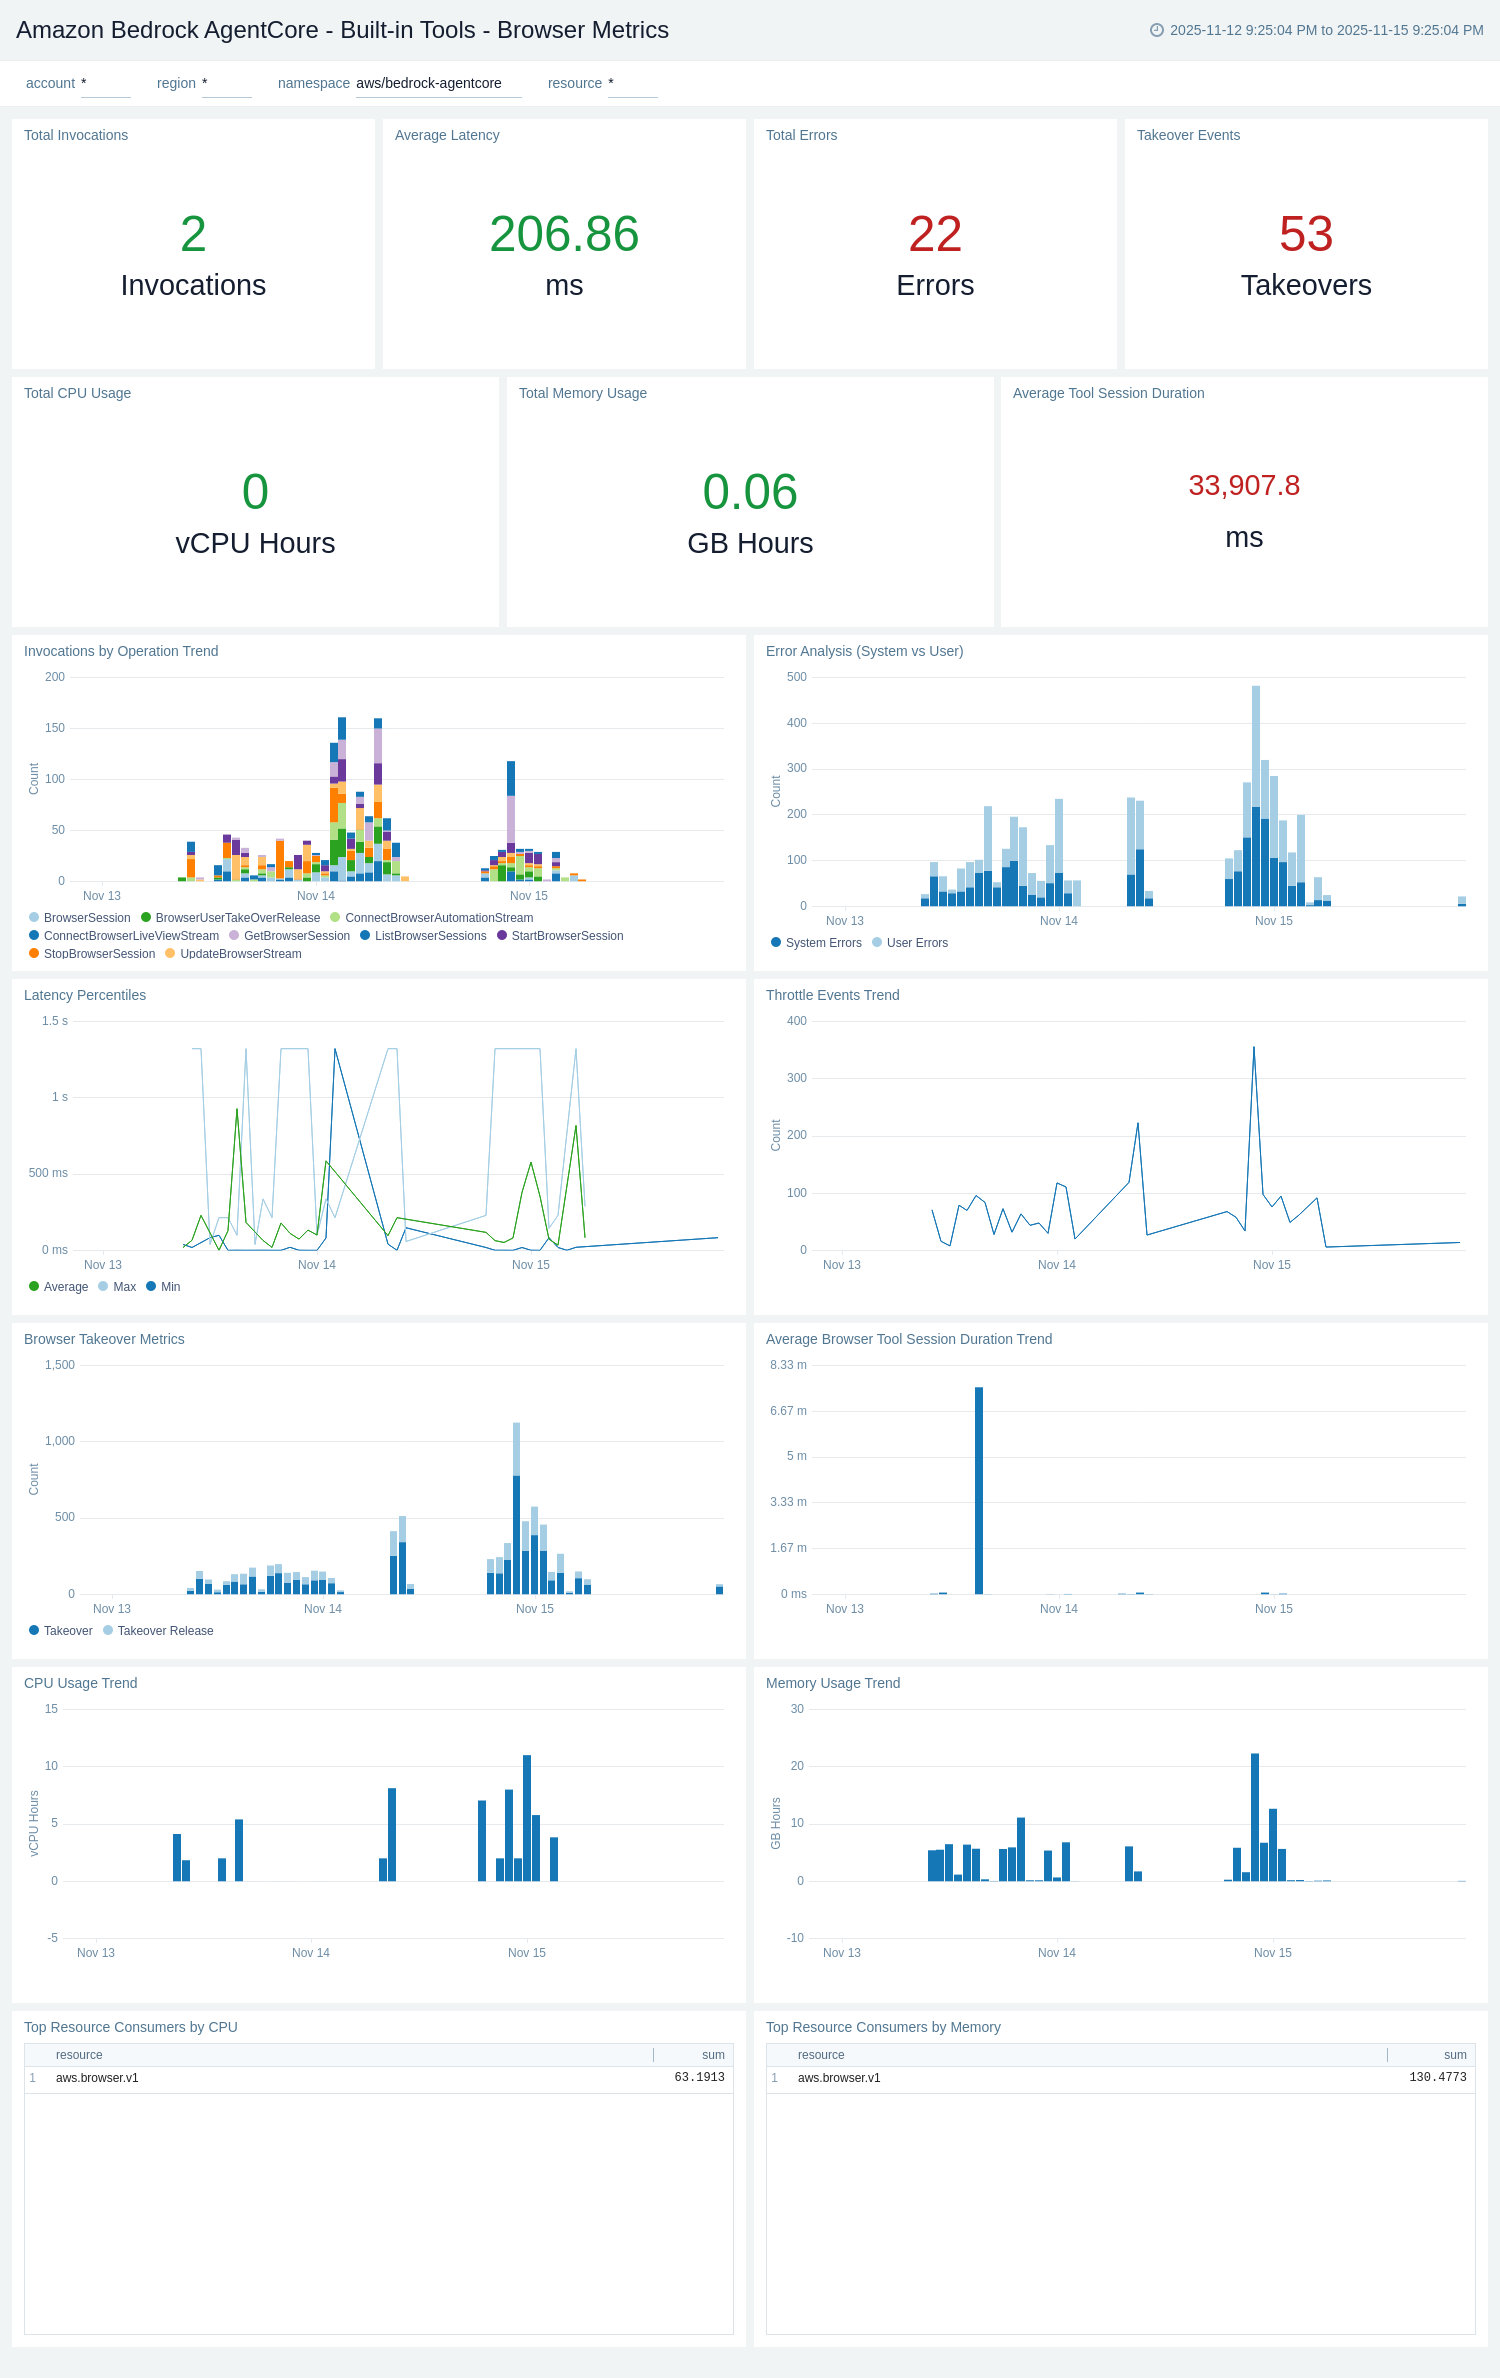
Built-in Tools - Browser Metrics
The Amazon Bedrock AgentCore - Built-in Tools - Browser Metrics dashboard provides CloudWatch metrics for browser tool performance and operational health. It complements the Browser Logs dashboard with quantitative metrics data.
Use this dashboard to:
- Monitor browser tool invocation counts and track usage trends over time.
- Track browser operation latency and identify performance issues.
- Analyze browser-related system errors, user errors, and throttling events.
- Monitor browser session duration metrics and session count trends.
- Track browser takeover events and user takeover duration metrics.
- Monitor browser resource usage for capacity planning and optimization.
Built-in Tools - Code Interpreter Metrics
The Amazon Bedrock AgentCore - Built-in Tools - Code Interpreter Metrics dashboard provides CloudWatch metrics for code interpreter performance and operational health. It complements the Code Interpreter Logs dashboard with quantitative metrics data.
Use this dashboard to:
- Monitor code interpreter invocation counts and track usage trends over time.
- Track code execution latency and identify performance bottlenecks.
- Analyze code interpreter-related system errors, user errors, and throttling events.
- Monitor session duration metrics and session count trends for code interpreter.
- Track code execution duration and identify long-running code executions.
- Monitor code interpreter resource usage for capacity planning and optimization.
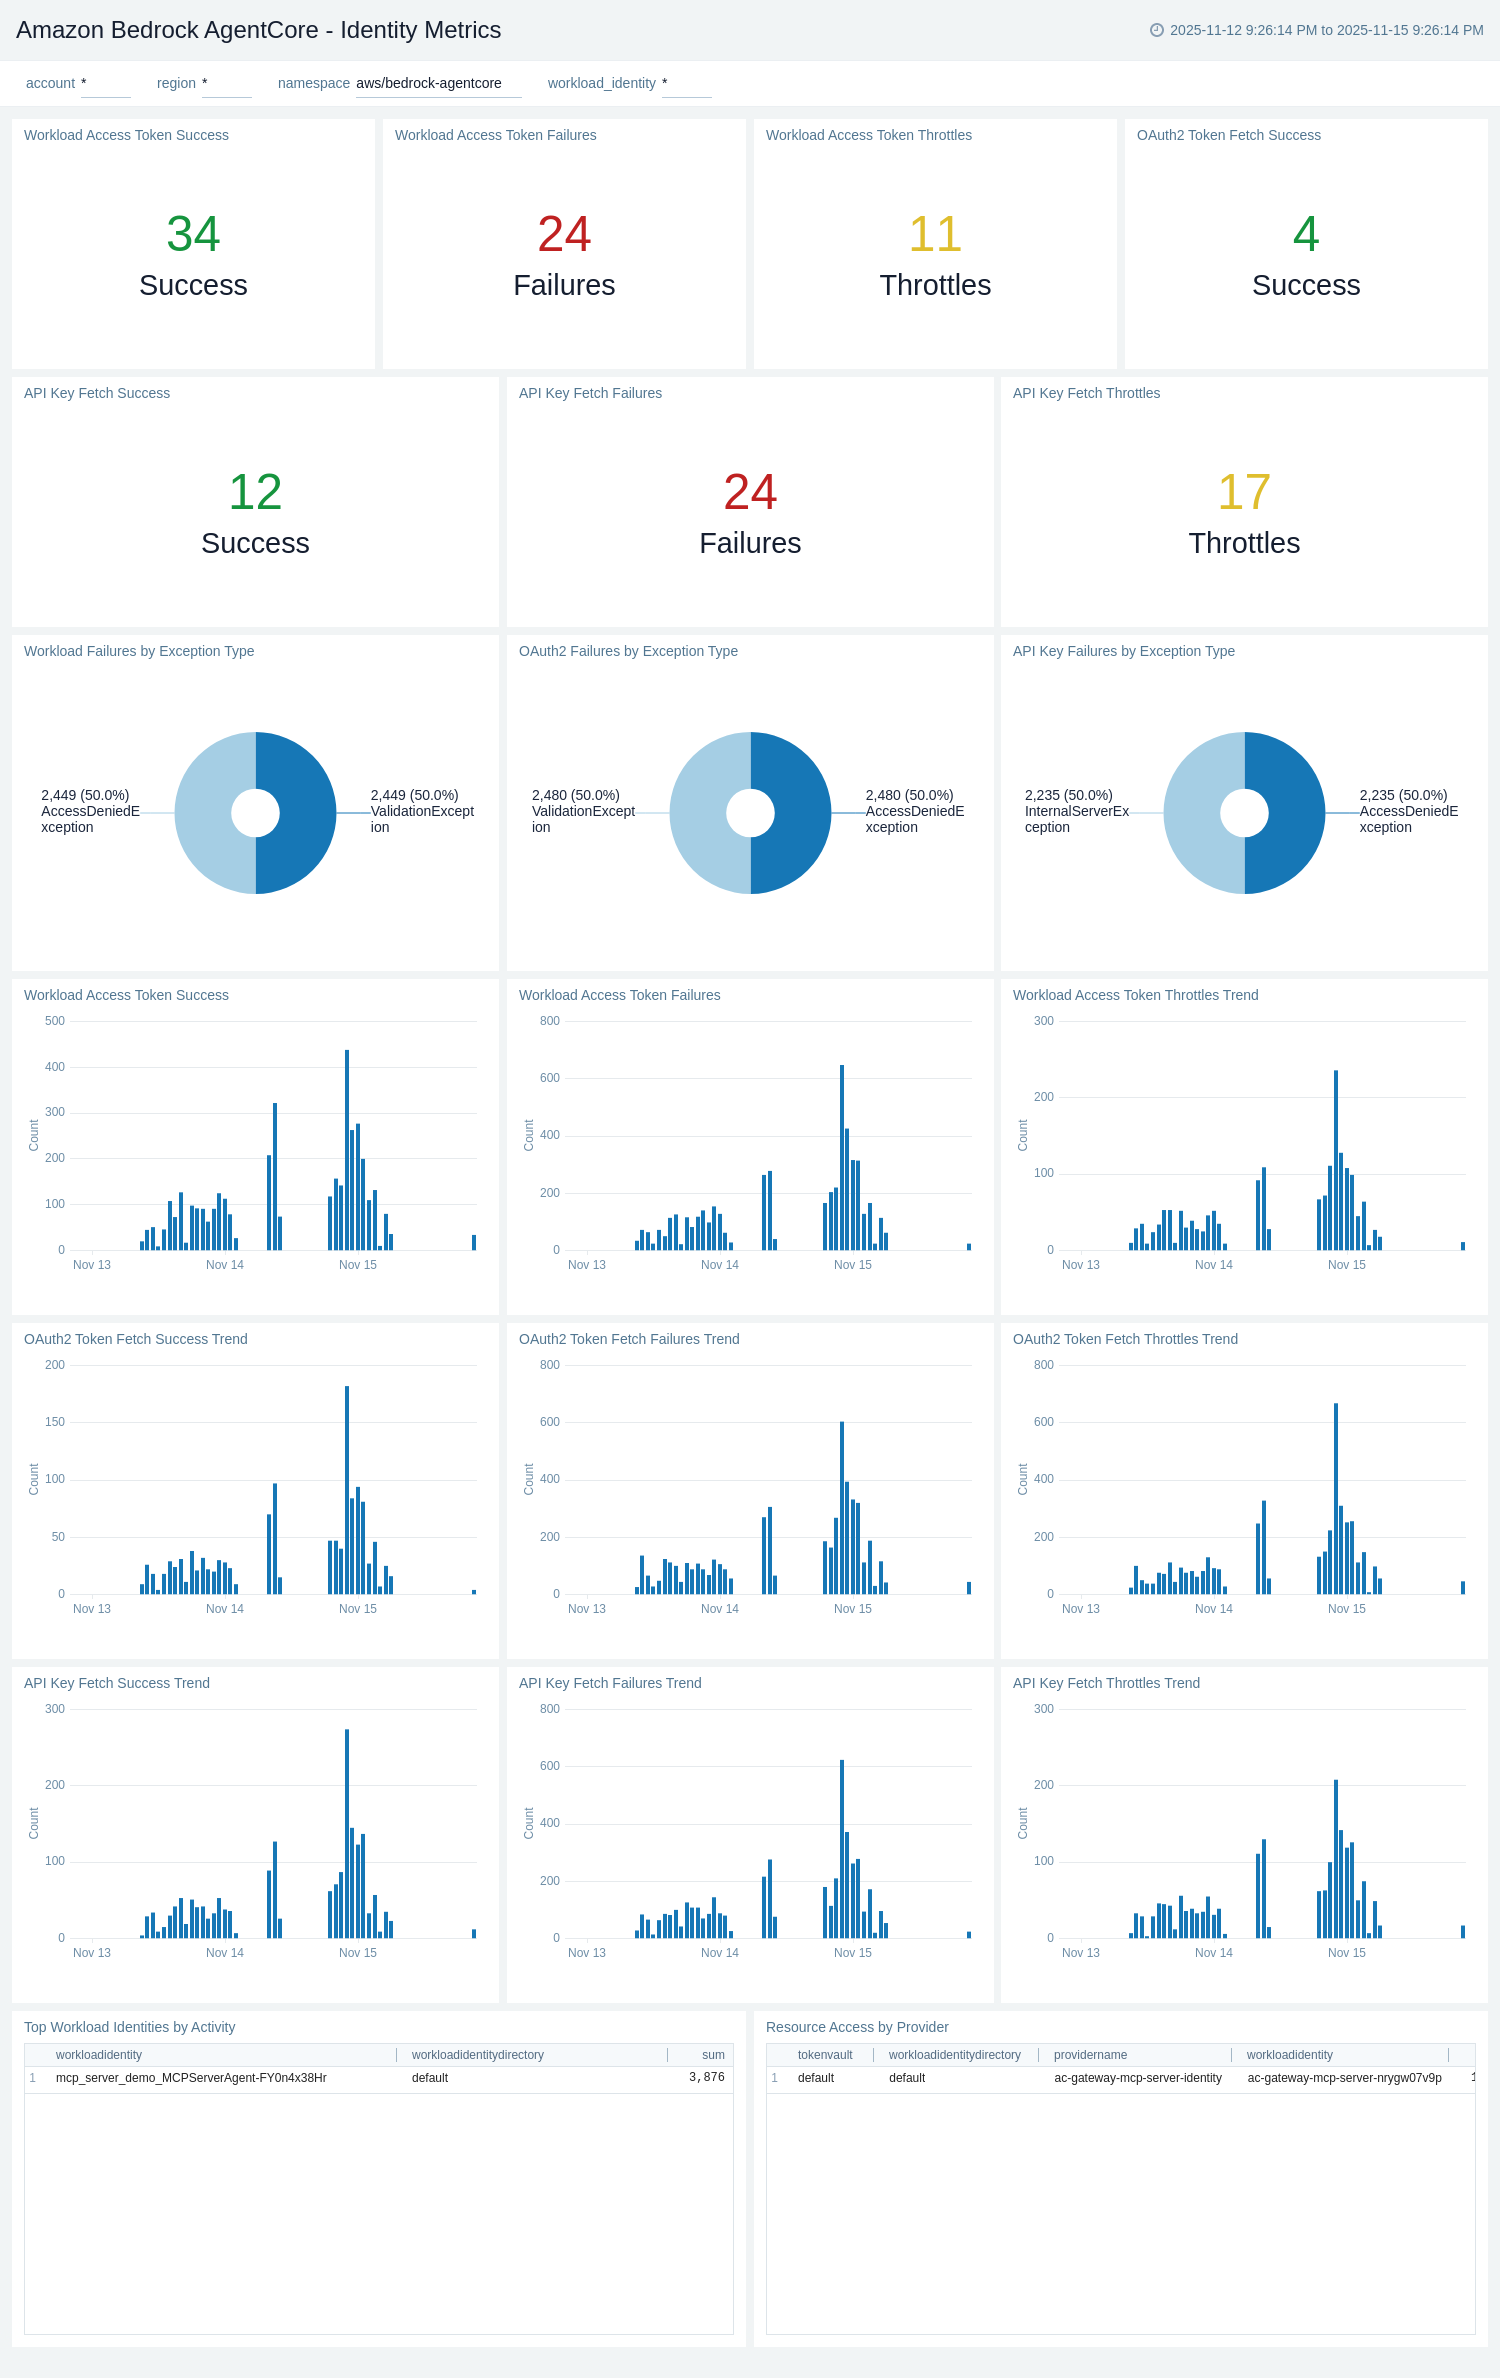
Identity Metrics
The Amazon Bedrock AgentCore - Identity Metrics dashboard provides CloudWatch metrics for workload identity operations, credential provider activities, and token fetch operations. It tracks identity-related performance, errors, and usage patterns.
Use this dashboard to:
- Monitor workload identity token fetch operations and invocation counts.
- Track OAuth2 and API key credential provider operation metrics.
- Analyze identity-related system errors, user errors, and throttling events.
- Monitor resource access token fetch success and failure rates.
- Track identity operation latency and identify authentication performance issues.
- Monitor identity operations by workload identity ID and credential provider for troubleshooting.
Create monitors for Amazon Bedrock AgentCore app
From your App Catalog:
- From the Sumo Logic navigation, select App Catalog.
- In the Search Apps field, search for and then select your app.
- Make sure the app is installed.
- Navigate to What's Included tab and scroll down to the Monitors section.
- Click Create next to the pre-configured monitors. In the create monitors window, adjust the trigger conditions and notifications settings based on your requirements.
- Scroll down to Monitor Details.
- Under Location click on New Folder.
note
By default, monitor will be saved in the root folder. So to make the maintenance easier, create a new folder in the location of your choice.
- Enter Folder Name. Folder Description is optional.
tip
Using app version in the folder name will be helpful to determine the versioning for future updates.
- Click Create. Once the folder is created, click on Save.
Amazon Bedrock AgentCore Alerts
| Name | Description | Alert Condition | Recover Condition |
|---|---|---|---|
Amazon Bedrock AgentCore - Code Interpreter Execution Failures | Monitors Code Interpreter invocation errors that may indicate malicious code attempts, sandbox escape attempts, or critical runtime failures. High error rates suggest potential security threats or fundamental service instability requiring immediate security investigation. | Count > = 20 | Count < 20 |
Amazon Bedrock AgentCore - Gateway Request Failures | Monitors Gateway errors that prevent tool invocation and MCP protocol communication. Gateway failures block agents from accessing external tools and APIs, causing complete workflow breakage. This is a critical single point of failure for the platform. | Count > = 20 | Count < 20 |
Amazon Bedrock AgentCore - High Average Operation Latency | Monitors elevated latency across AgentCore operations indicating performance degradation. High latency directly impacts user experience and can lead to timeouts and failed operations requiring immediate capacity or performance optimization. | Count > 5000 | Count < = 5000 |
Amazon Bedrock AgentCore - High System Errors | Detects abnormally high system errors across AgentCore components indicating infrastructure failures or service degradation that directly impact operations. System errors are non-user-caused and suggest platform instability requiring immediate investigation. | Count > = 50 | Count < 50 |
Amazon Bedrock AgentCore - Throttling Events Detected | Detects throttling across AgentCore operations indicating quota exhaustion or capacity constraints. Sustained throttling degrades user experience and signals need for capacity scaling before complete service degradation. | Count > = 20 | Count < 20 |
Upgrade/Downgrade the Amazon Bedrock AgentCore app (Optional)
To update the app, do the following:
Next-Gen App: To install or update the app, you must be an account administrator or a user with Manage Apps, Manage Monitors, Manage Fields, Manage Metric Rules, and Manage Collectors capabilities depending upon the different content types part of the app.
- Select App Catalog.
- In the Search Apps field, search for and then select your app.
Optionally, you can identify apps that can be upgraded in the Upgrade available section. - To upgrade the app, select Upgrade from the Manage dropdown.
- If the upgrade does not have any configuration or property changes, you will be redirected to the Preview & Done section.
- If the upgrade has any configuration or property changes, you will be redirected to the Setup Data page.
- In the Configure section of your respective app, complete the following fields.
- Field Name. If you already have collectors and sources set up, select the configured metadata field name (eg _sourcecategory) or specify other custom metadata (eg: _collector) along with its metadata Field Value.
- Click Next. You will be redirected to the Preview & Done section.
Post-update
Your upgraded app will be installed in the Installed Apps folder and dashboard panels will start to fill automatically.
See our Release Notes changelog for new updates in the app.
To revert the app to a previous version, do the following:
- Select App Catalog.
- In the Search Apps field, search for and then select your app.
- To version down the app, select Revert to < previous version of your app > from the Manage dropdown.
Uninstalling the Amazon Bedrock AgentCore app (Optional)
To uninstall the app, do the following:
- Select App Catalog.
- In the 🔎 Search Apps field, run a search for your desired app, then select it.
- Click Uninstall.