 Meet the new
 Amazon Security Lake
The Sumo Logic app for Amazon Security Lake provides unified visibility into security activity across AWS accounts and regions by analyzing events ingested from Amazon Security Lake and normalized using the Open Cybersecurity Schema Framework (OCSF). With pre-built dashboards for network activity, identity and access management, application telemetry, and host-level system activity, the app helps security teams detect threats, investigate anomalies, monitor trends, and continuously assess their AWS security posture.
This app includes built-in monitors. For details on creating custom monitors, refer to Create monitors for Amazon Security Lake app.
Log type
This app uses the Amazon Security Lake Source to collect security events from Amazon Security Lake. Events follow the Open Cybersecurity Schema Framework (OCSF) and are delivered in JSON format. The app supports the following OCSF event categories:
- Identity & Access Management (IAM). Authentication, Authorize Session, Entity Management, Group Management, User Management, and Role Management events.
- Network Activity. Network, DHCP, HTTP, DNS, RDP, SMB, SSH, FTP, Email, NTP, and Tunnel activity events.
- Application Activity. Web Resources, Application Lifecycle, API, Datastore, File Hosting, Scan, and Application Errors events.
- System Activity. File System, Kernel Extension, Kernel, Memory, Module, Scheduled Job, Process, Event Log, Script, Peripheral, Device Power State, and Clipboard events.
Sample log message
Click to expand
{
  "metadata": {
    "product": {
      "name": "Amazon VPC",
      "uid": "arn:aws:securitylake:us-east-1::product/aws/vpc-flow-logs",
      "vendor_name": "AWS",
      "version": "5"
    },
    "profiles": ["cloud", "datetime", "network"],
    "version": "1.9.0"
  },
  "time": 1695000000000,
  "severity": "Informational",
  "severity_id": 1,
  "class_name": "Network Activity",
  "class_uid": 4001,
  "category_name": "Network Activity",
  "category_uid": 4,
  "activity_id": 1,
  "activity_name": "Open",
  "type_name": "Network Activity: Open",
  "type_uid": 400101,
  "status": "Success",
  "status_id": 1,
  "cloud": {
    "account": {
      "type": "AWS Account",
      "type_id": 10,
      "uid": "123456789012"
    },
    "region": "us-east-1",
    "provider": "AWS"
  },
  "src_endpoint": {
    "ip": "10.0.1.25",
    "port": 54832,
    "vpc_uid": "vpc-0a1b2c3d4e5f6",
    "subnet_uid": "subnet-0abc123",
    "interface_uid": "eni-0aabbccdd1122",
    "type": "Server",
    "os": {
      "type": "Linux"
    }
  },
  "dst_endpoint": {
    "ip": "198.51.100.42",
    "port": 443,
    "type": "Unknown",
    "name": "external-host"
  },
  "connection_info": {
    "protocol_name": "TCP",
    "protocol_num": 6,
    "direction": "Outbound",
    "boundary": "External"
  },
  "traffic": {
    "bytes": 15234,
    "packets": 42
  },
  "disposition": "Allowed",
  "disposition_id": 1,
  "actor": {
    "user": {
      "account": {
        "uid": "123456789012"
      }
    }
  },
  "app_name": "HTTPS",
  "message": "Connection successfully established",
  "status_details": "OK",
  "device": {
    "hostname": "ip-10-0-1-25.ec2.internal",
    "type": "Server",
    "os": {
      "type": "Linux"
    },
    "region": "us-east-1"
  }
}
Sample queries
={{Logsdatasource}} class_name activity_name category_name severity status metadata
| json "category_name","class_name","activity_name","cloud.account.uid","cloud.region","metadata.product.name","severity","status" as category_name,event_name,activity_name,aws_account, region, product_name, severity, status nodrop
| where !isBlank(category_name)
// global filters
| where if("{{aws_account}}" = "*", true, aws_account matches "{{aws_account}}") and if("{{region}}" = "*", true, region matches "{{region}}") and if("{{product}}" = "*", true, product_name matches "{{product}}") and if("{{category_type}}" = "*", true, category_name matches "{{category_type}}") and if("{{event_type}}" = "*", true, event_name matches "{{event_type}}") and if("{{severity}}" = "*", true, severity matches "{{severity}}") and if("{{status}}" = "*", true, status matches "{{status}}")
| count by category_name
| sort by _count, category_name asc
={{Logsdatasource}} class_name activity_name category_name severity status metadata ("High" OR "Critical" OR "Fatal")
| json "category_name","class_name","activity_name","cloud.account.uid","cloud.region","metadata.product.name","severity","status" as category_name,event_name,activity_name,aws_account,region,product_name,severity,status nodrop
| where severity in ("High", "Critical", "Fatal")
// global filters
| where if("{{aws_account}}" = "*", true, aws_account matches "{{aws_account}}") and if("{{region}}" = "*", true, region matches "{{region}}") and if("{{product}}" = "*", true, product_name matches "{{product}}") and if("{{category_type}}" = "*", true, category_name matches "{{category_type}}") and if("{{event_type}}" = "*", true, event_name matches "{{event_type}}") and if("{{severity}}" = "*", true, severity matches "{{severity}}") and if("{{status}}" = "*", true, status matches "{{status}}")
| count
Collection configuration and app installation
Depending on the set up collection method, you can configure and install the app in three ways:
- Create a new collector and install the app. Create a new Sumo Logic Cloud-to-Cloud (C2C) source under a new Sumo Logic Collector and later install the app, or
- Use an existing collector and install the app. Create a new Sumo Logic Cloud-to-Cloud (C2C) source under an existing Sumo Logic Collector and later install the app, or
- Use existing source and install the app. Use your existing configured Sumo Logic Cloud-to-Cloud (C2C) source and install the app.
Use the Amazon Security Lake Source to create the source and use the same source category while installing the app.
Create a new collector and install the app
To set up collection and install the app, do the following:
Next-Gen App: To install or update the app, you must be an account administrator or a user with Manage Apps, Manage Monitors, Manage Fields, Manage Metric Rules, and Manage Collectors capabilities depending upon the different content types part of the app.
- Select App Catalog.
- In the 🔎 Search Apps field, run a search for your desired app, then select it.
- Click Install App.
note
Sometimes this button says Add Integration.
- In the Set Up Collection section of your respective app, select Create a new Collector.
- Collector Name. Enter a Name to display the Source in the Sumo Logic web application. The description is optional.
- Timezone. Set the default time zone when it is not extracted from the log timestamp. Time zone settings on Sources override a Collector time zone setting.
- (Optional) Metadata. Click the +Add Metadata link to add a custom log Metadata Fields. Define the fields you want to associate, each metadata field needs a name (key) and value.
 A green circle with a checkmark is shown when the field exists and is enabled in the Fields table schema.
 An orange triangle with an exclamation point is shown when the field doesn't exist, or is disabled in the Fields table schema. In this case, you'll see an option to automatically add or enable the nonexistent fields to the Fields table schema. If a field is sent to Sumo Logic but isn’t present or enabled in the schema, it’s ignored and marked as Dropped.
- Click Next.
- Configure the source as specified in the
Infobox above, ensuring all required fields are included. - In the Configure section of your respective app, complete the following fields.
- Field Name. If you already have collectors and sources set up, select the configured metadata field name (eg _sourcecategory) or specify other custom metadata (eg: _collector) along with its metadata Field Value.
- Click Next. You will be redirected to the Preview & Done section.
Post-installation
Once your app is installed, it will appear in your Installed Apps folder, and dashboard panels will start to fill automatically.
Each panel slowly fills with data matching the time range query received since the panel was created. Results will not immediately be available but will be updated with full graphs and charts over time.
Use an existing collector and install the app
To set up the source in the existing collector and install the app, do the following:
Next-Gen App: To install or update the app, you must be an account administrator or a user with Manage Apps, Manage Monitors, Manage Fields, Manage Metric Rules, and Manage Collectors capabilities depending upon the different content types part of the app.
- Select App Catalog.
- In the 🔎 Search Apps field, run a search for your desired app, then select it.
- Click Install App.
note
Sometimes this button says Add Integration.
- In the Set Up Collection section of your respective app, select Use an existing Collector.
- From the Select Collector dropdown, select the collector that you want to set up your source with and click Next.
- Configure the source as specified in the
Infobox above, ensuring all required fields are included. - In the Configure section of your respective app, complete the following fields.
- Field Name. If you already have collectors and sources set up, select the configured metadata field name (eg _sourcecategory) or specify other custom metadata (eg: _collector) along with its metadata Field Value.
- Click Next. You will be redirected to the Preview & Done section.
Post-installation
Once your app is installed, it will appear in your Installed Apps folder, and dashboard panels will start to fill automatically.
Each panel slowly fills with data matching the time range query received since the panel was created. Results will not immediately be available but will be updated with full graphs and charts over time.
Use an existing source and install the app
To skip collection and only install the app, do the following:
Next-Gen App: To install or update the app, you must be an account administrator or a user with Manage Apps, Manage Monitors, Manage Fields, Manage Metric Rules, and Manage Collectors capabilities depending upon the different content types part of the app.
- Select App Catalog.
- In the 🔎 Search Apps field, run a search for your desired app, then select it.
- Click Install App.
note
Sometimes this button says Add Integration.
- In the Set Up Collection section of your respective app, select Skip this step and use existing source and click Next.
- In the Configure section of your respective app, complete the following fields.
- Field Name. If you already have collectors and sources set up, select the configured metadata field name (eg _sourcecategory) or specify other custom metadata (eg: _collector) along with its metadata Field Value.
- Click Next. You will be redirected to the Preview & Done section.
Post-installation
Once your app is installed, it will appear in your Installed Apps folder, and dashboard panels will start to fill automatically.
Each panel slowly fills with data matching the time range query received since the panel was created. Results will not immediately be available but will be updated with full graphs and charts over time.
Viewing Amazon Security Lake dashboards
All dashboards have a set of filters that you can apply to the entire dashboard. Use these filters to drill down and examine the data to a granular level.
- You can change the time range for a dashboard or panel by selecting a predefined interval from a drop-down list, choosing a recently used time range, or specifying custom dates and times. Learn more.
- You can use template variables to drill down and examine the data on a granular level. For more information, see Filtering Dashboards with Template Variables.
- Most Next-Gen apps allow you to provide the scope at the installation time and are comprised of a key (
_sourceCategoryby default) and a default value for this key. Based on your input, the app dashboards will be parameterized with a dashboard variable, allowing you to change the dataset queried by all panels. This eliminates the need to create multiple copies of the same dashboard with different queries.
Overview
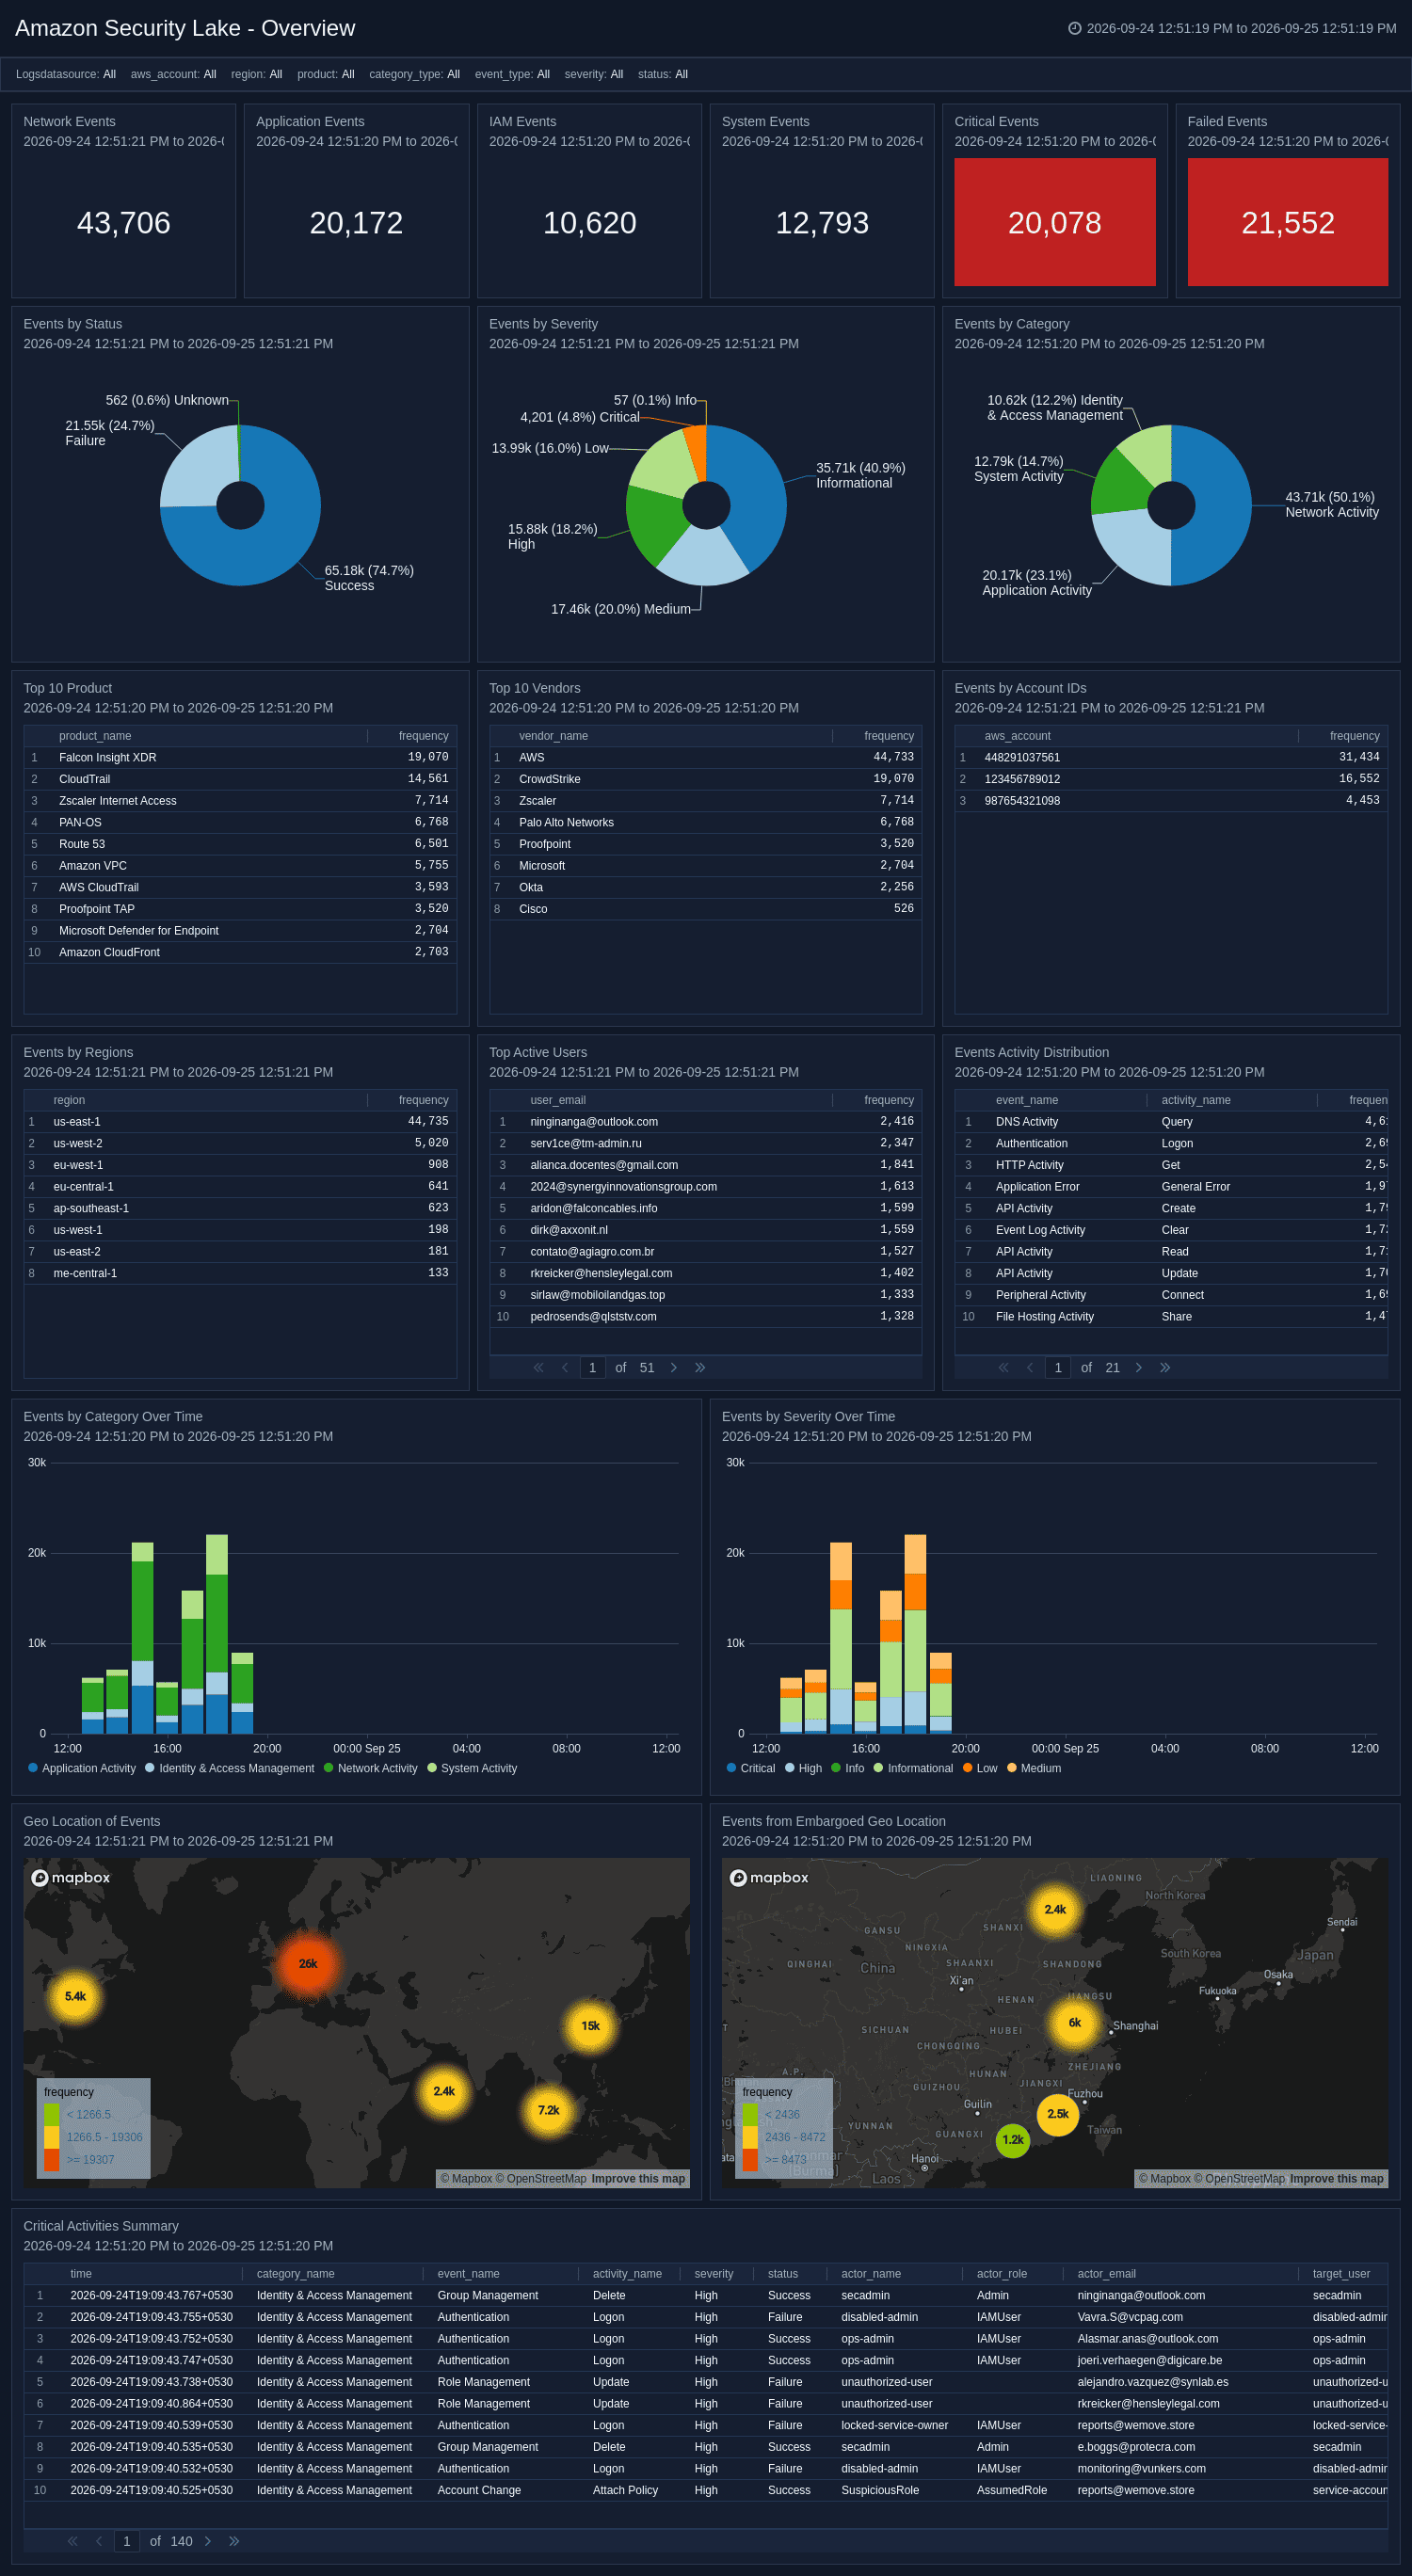
The Amazon Security Lake - Overview dashboard provides a consolidated, high-level view of every OCSF event collected into your Security Lake. It tracks event volume by category, severity, status, AWS account, region, and reporting product, and highlights critical and failed activity across your environment. Geo-location panels map the global distribution of events and flag activity originating from embargoed locations, while trend charts reveal shifts in category and severity patterns over time.
Application - API Activity
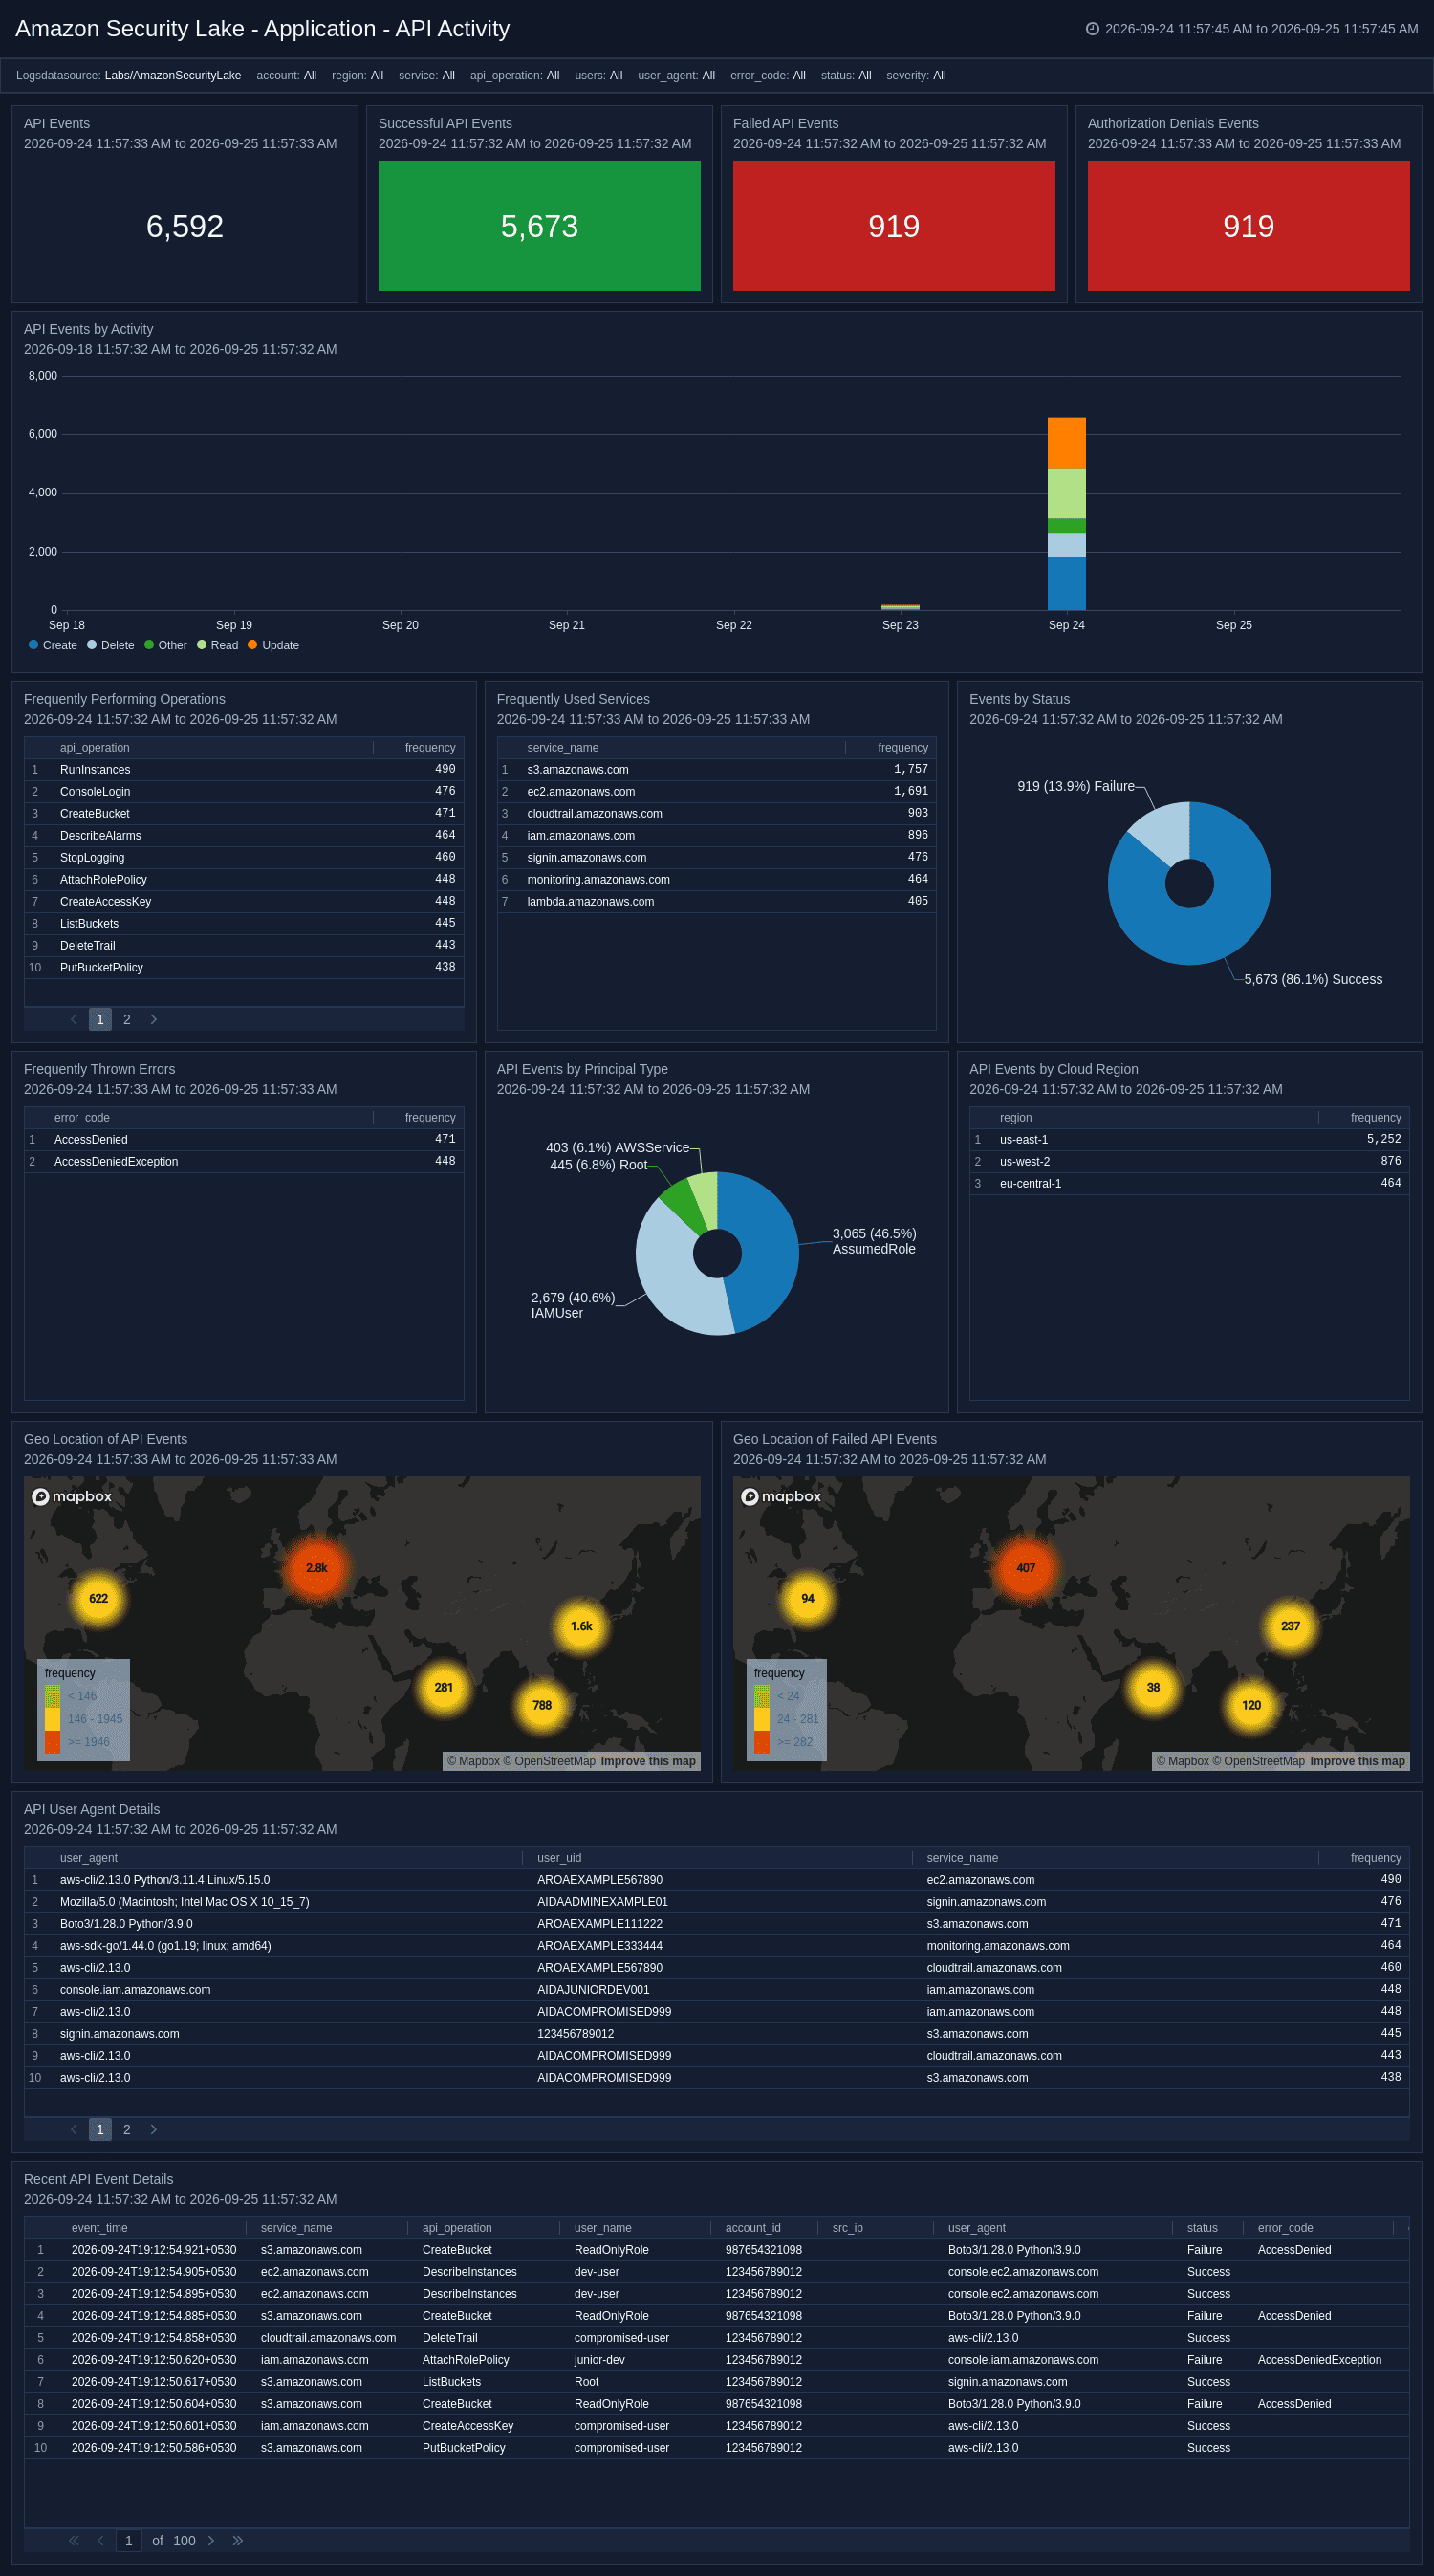
The Application - API Activity dashboard provides visibility into API call events across your AWS environment, tracking request volume, success and failure rates, authorization denials, and service usage patterns. It breaks down activity by principal type, cloud region, user agent, and operation, while geo-location panels map the origin of both successful and failed API calls. Error analysis panels surface frequently thrown errors and failed operations to help identify misconfigurations or potential abuse.
Application - Datastore and File Hosting Activity
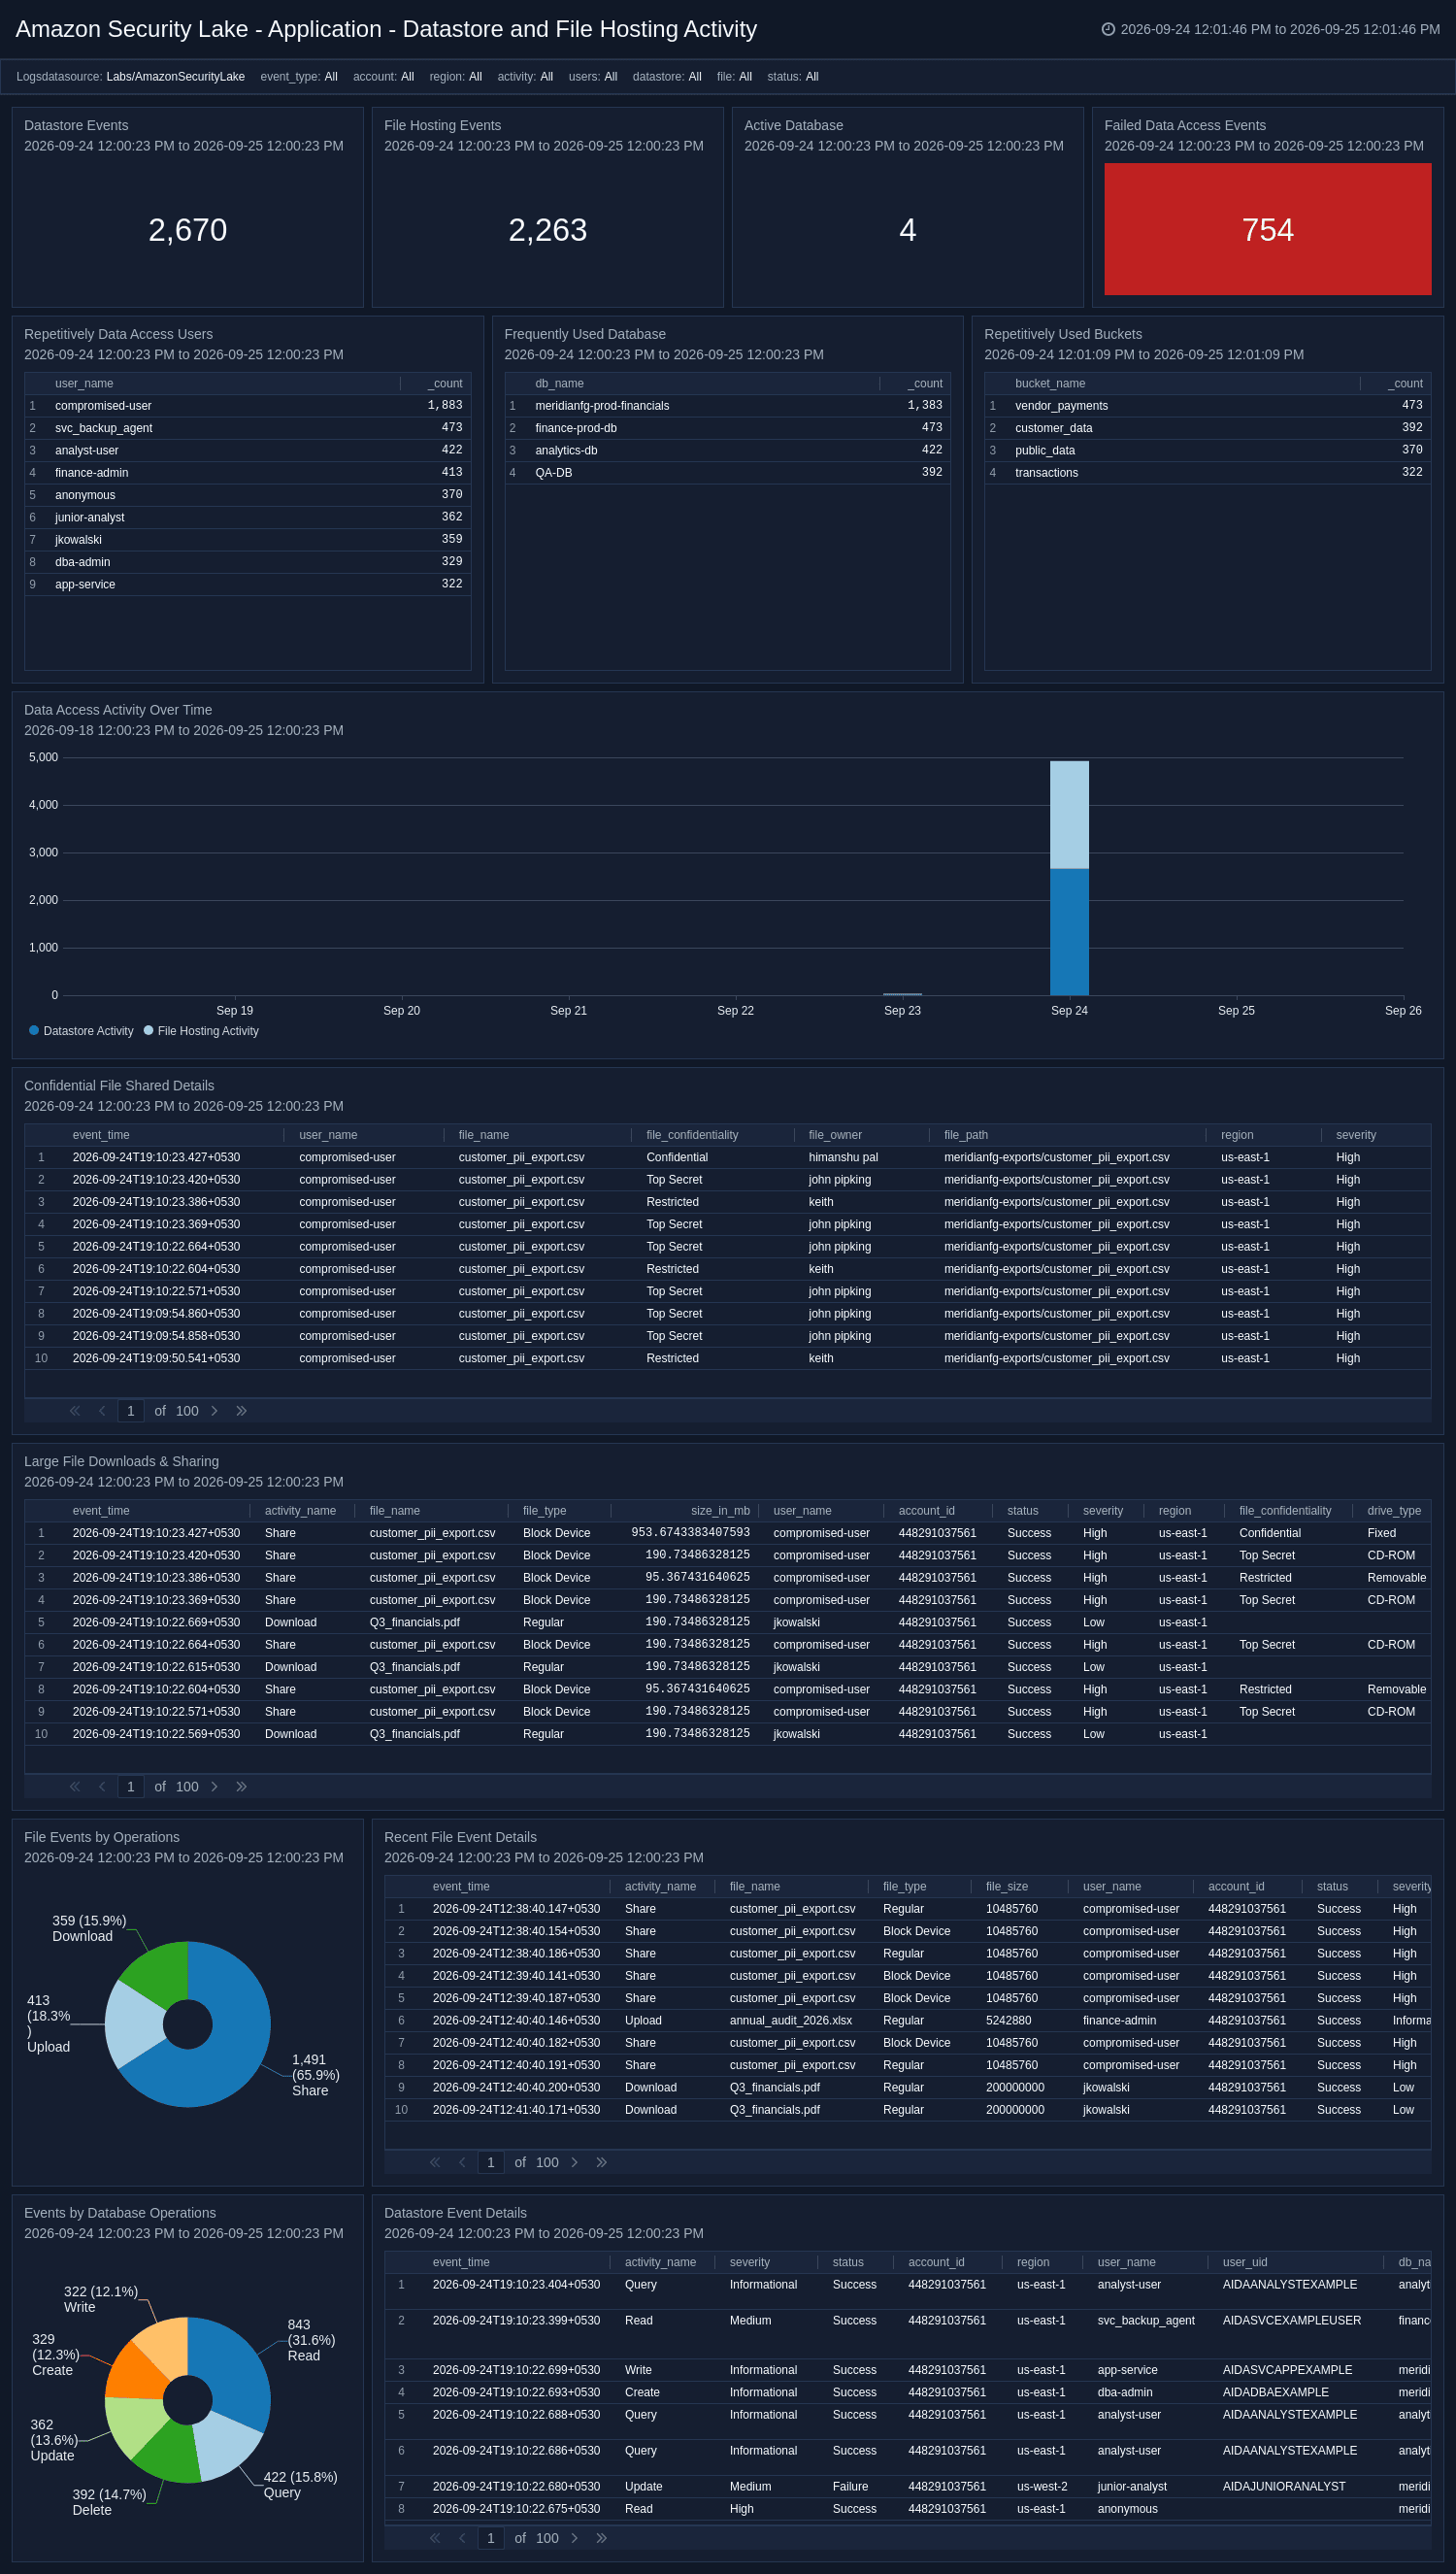
The Application - Datastore and File Hosting Activity dashboard monitors data access events across databases, storage services, and file hosting platforms. It tracks datastore operations, large file downloads and sharing activity, frequently accessed buckets and databases, and identifies the most active data access users. Dedicated panels surface failed data access attempts and confidential file sharing details, enabling teams to spot data exfiltration risks and policy violations.
Application - Health and Vulnerability Management
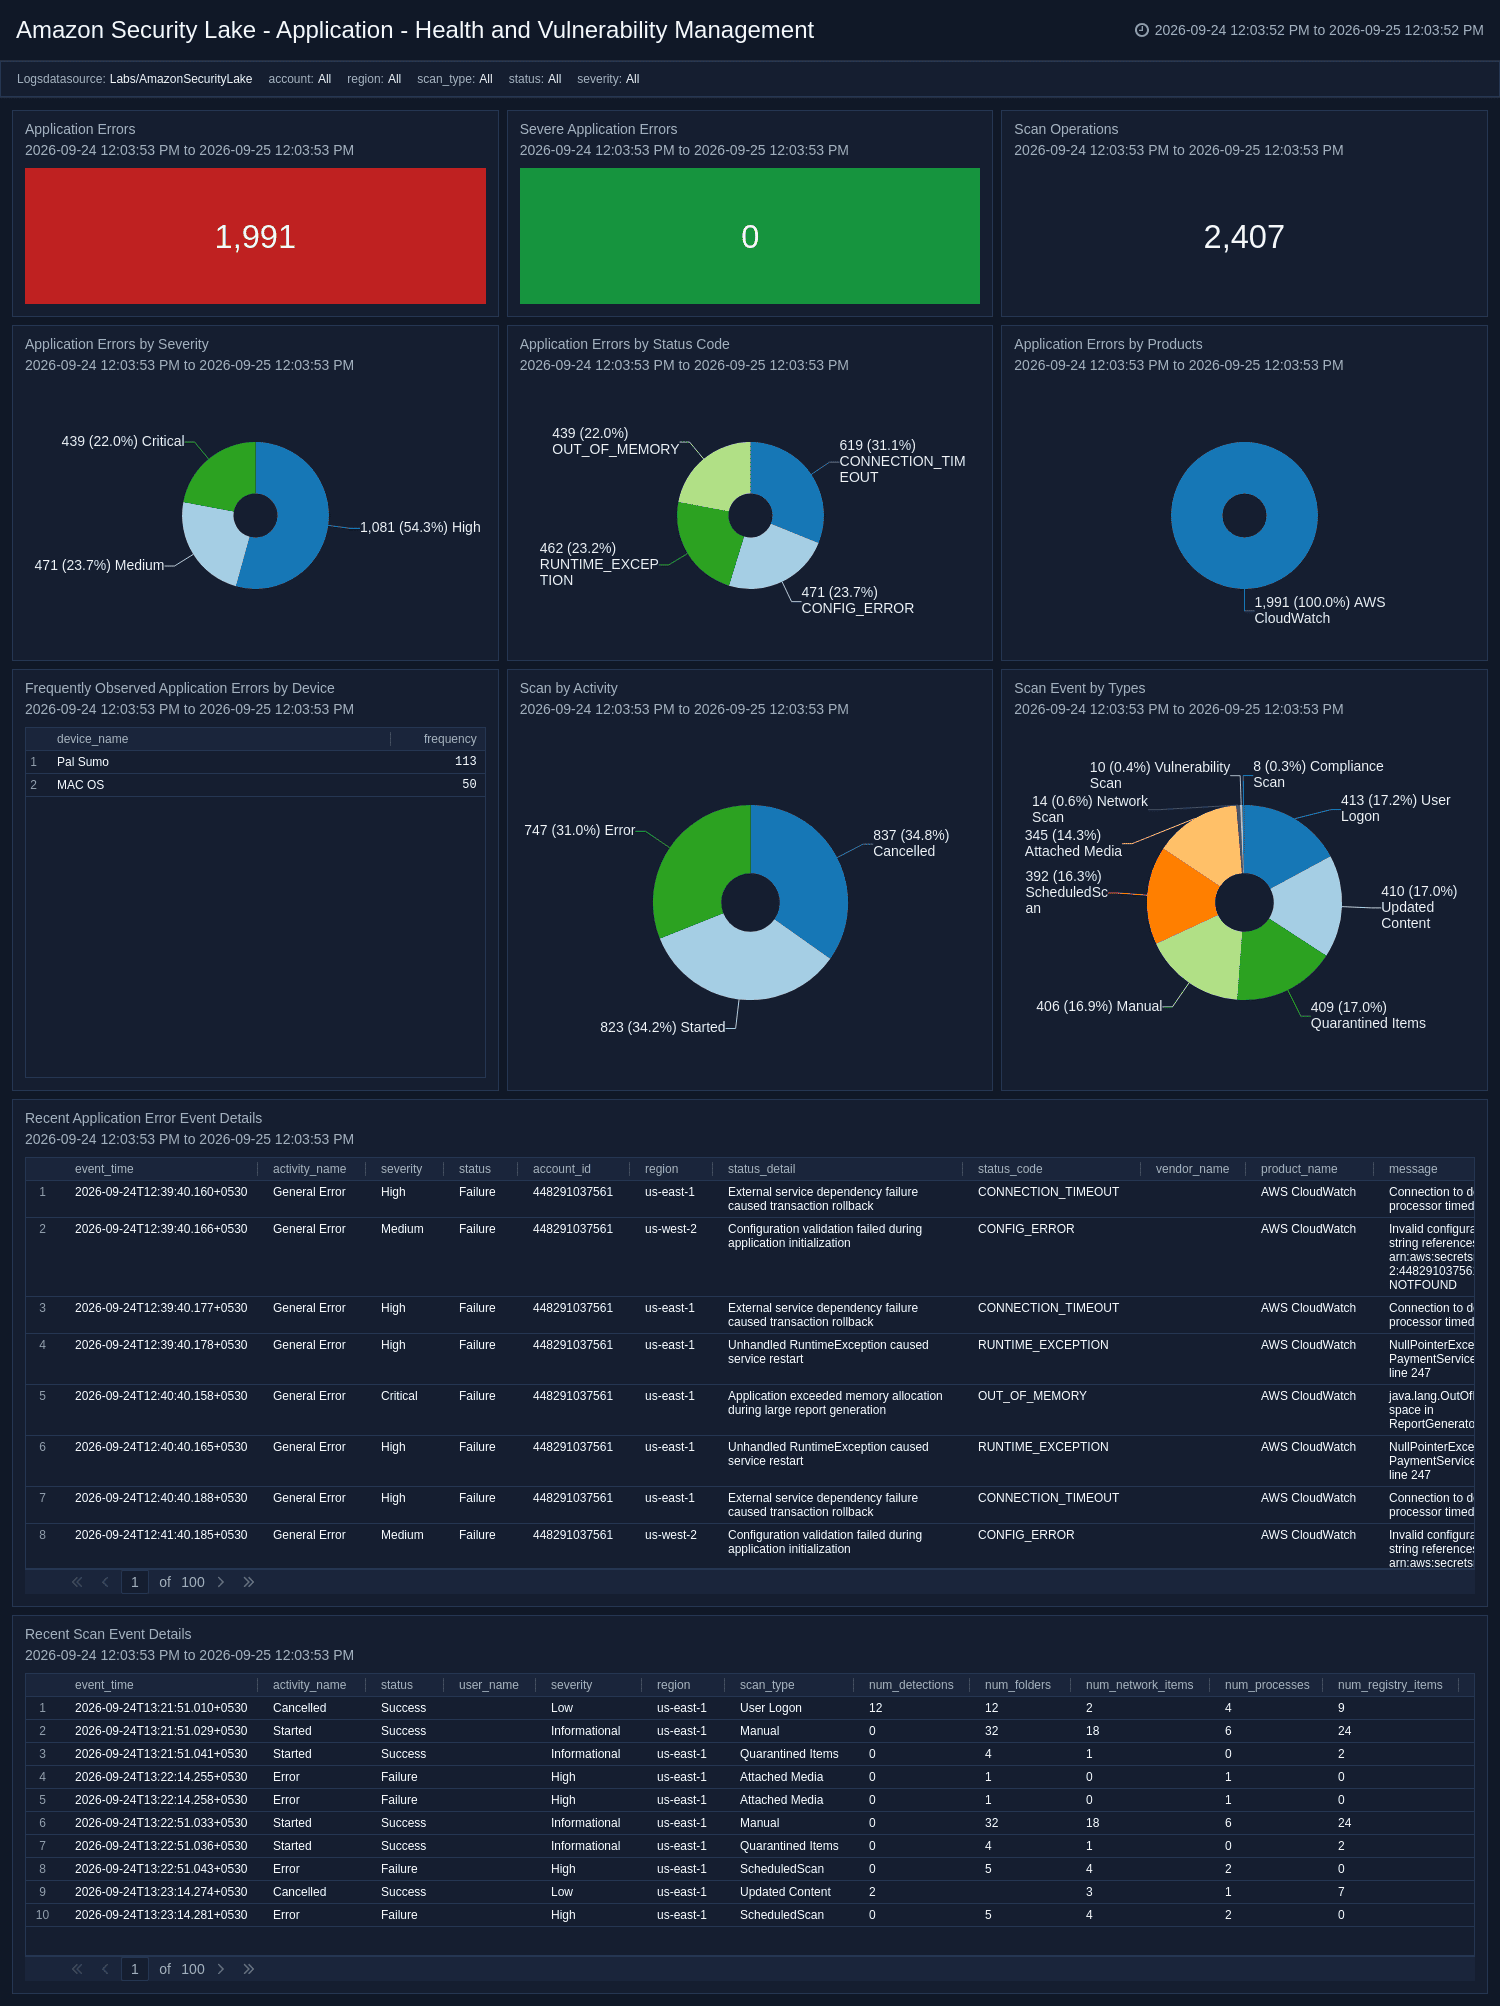
The Application - Health and Vulnerability Management dashboard provides visibility into application errors and vulnerability scan operations across your environment. It tracks error volume by severity and status code, identifies frequently impacted devices and products, and monitors scan activity by type and operation. Dedicated detail panels surface recent error events and scan results, enabling teams to correlate application health issues with security vulnerabilities.
Application - Web Resources and Change Management
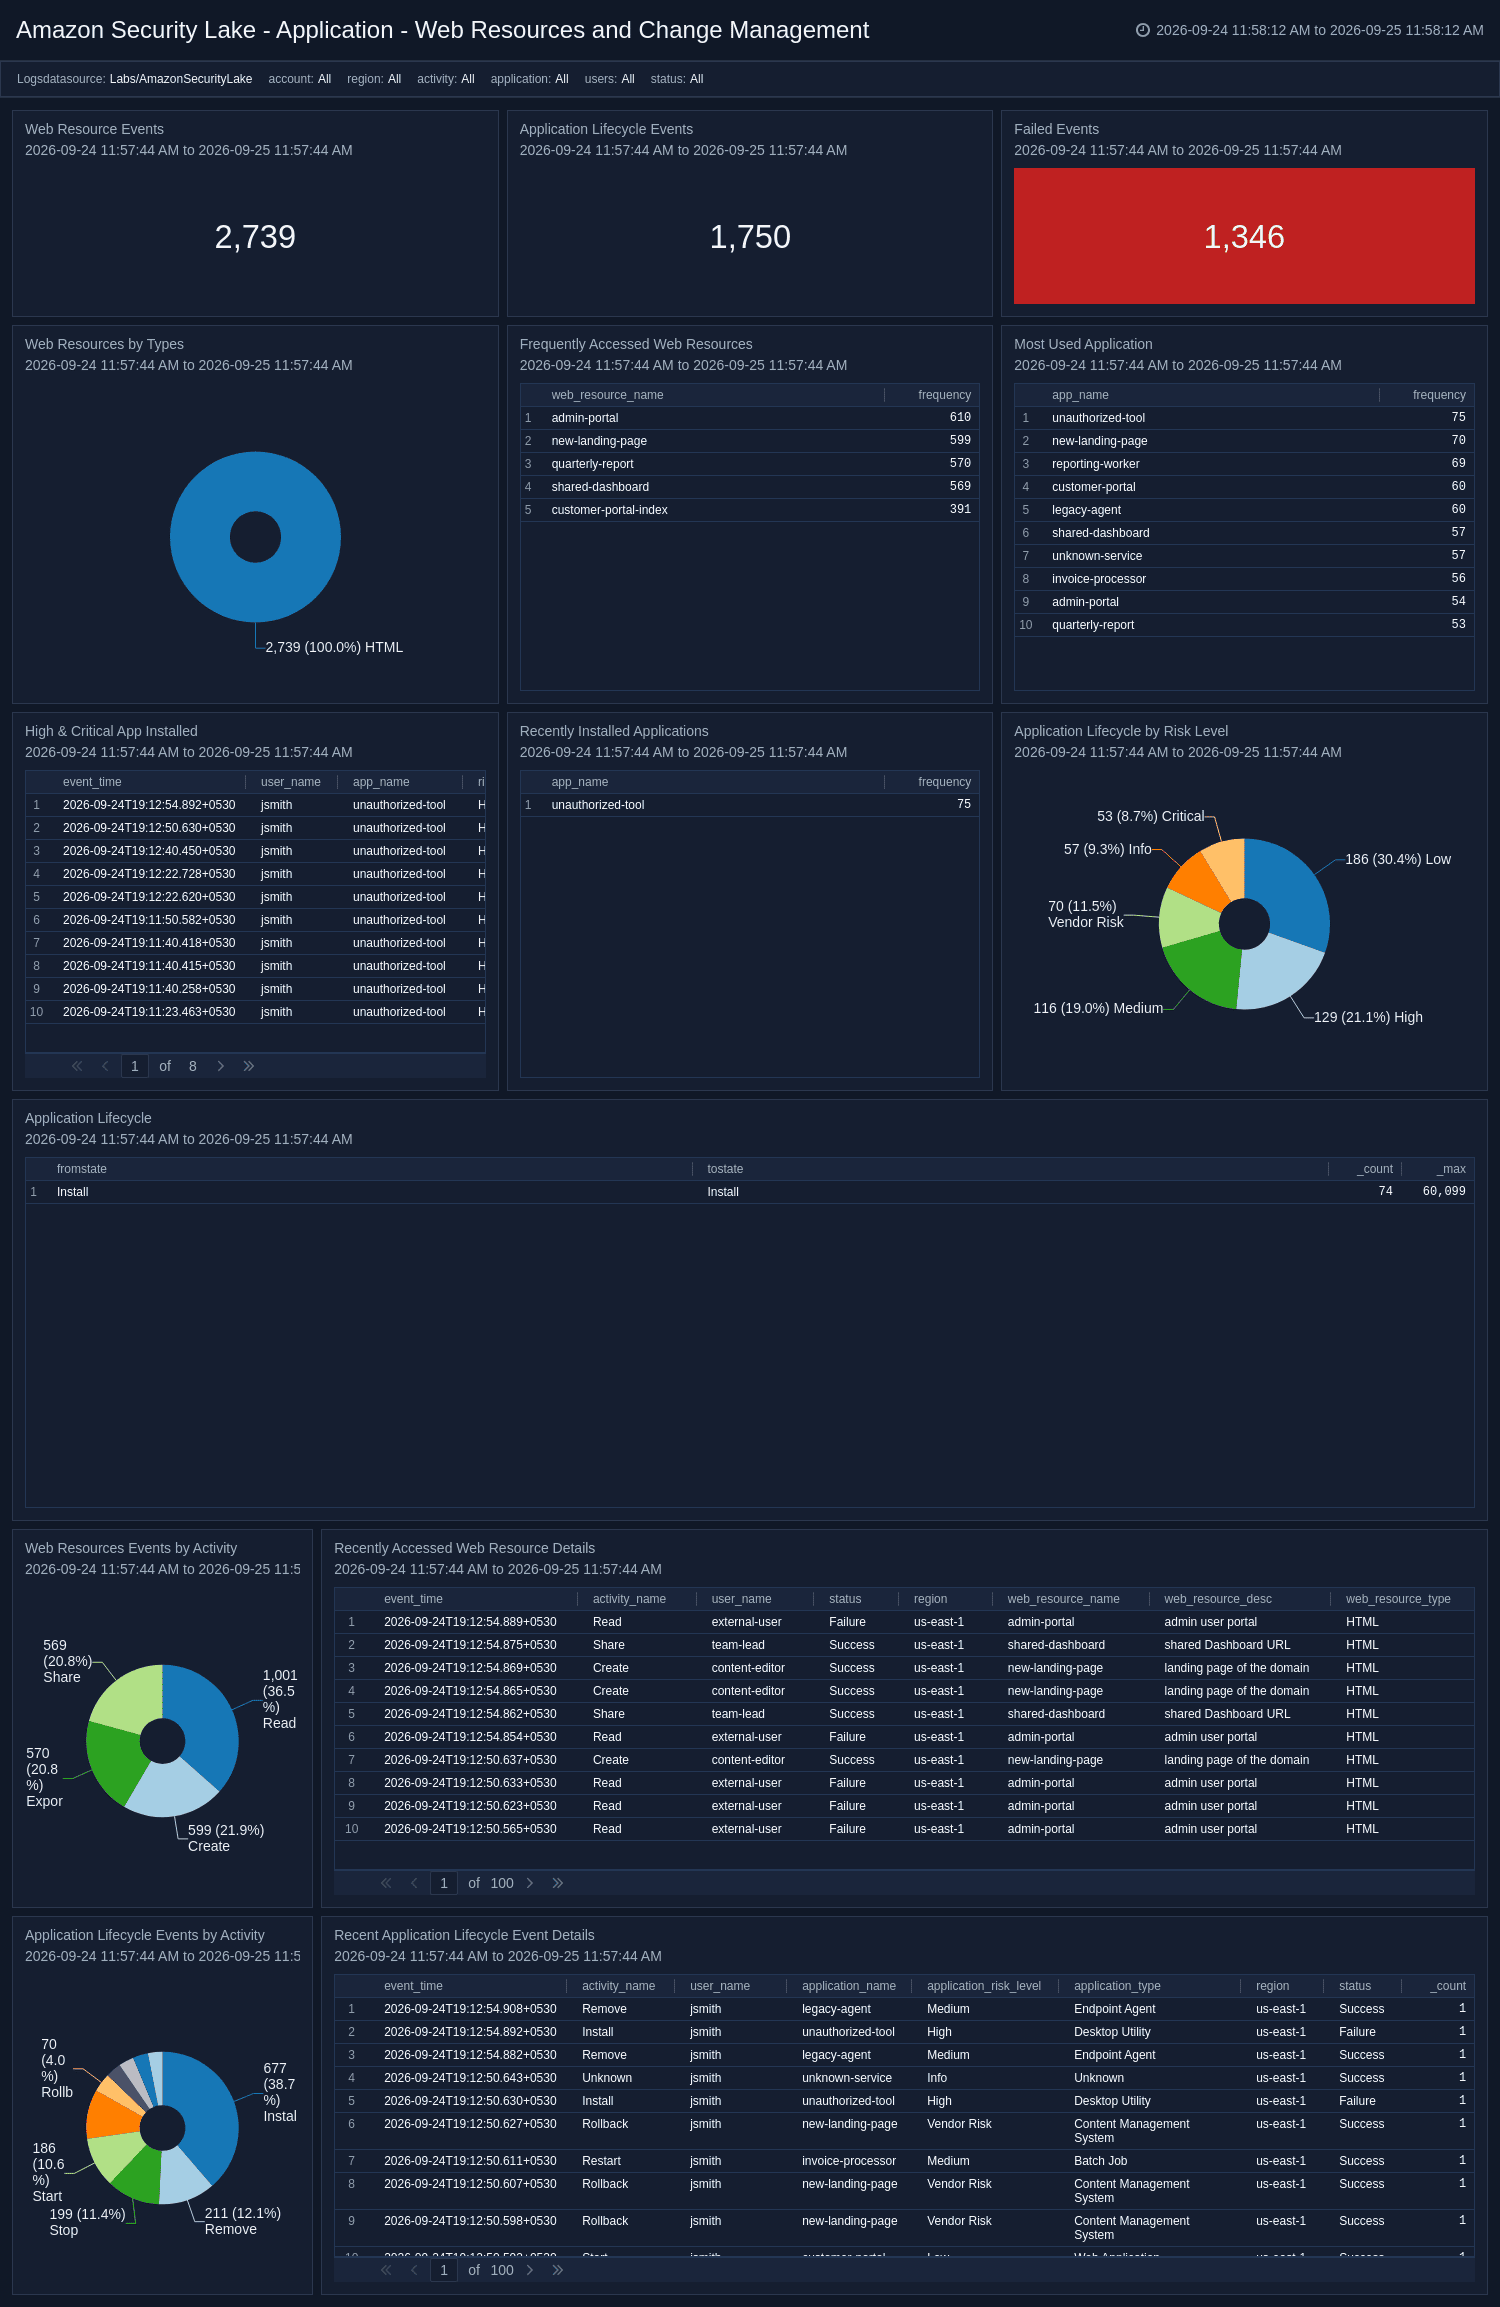
The Application - Web Resources and Change Management dashboard monitors web resource access and application lifecycle events across your environment. It tracks frequently accessed web resources by type, recently installed applications, high and critical risk app installations, and application lifecycle changes including installs, updates, and removals. Dedicated panels surface failed events and visualize lifecycle activity by risk level, giving teams control over their software supply chain.
IAM - Successful Logins and Sessions
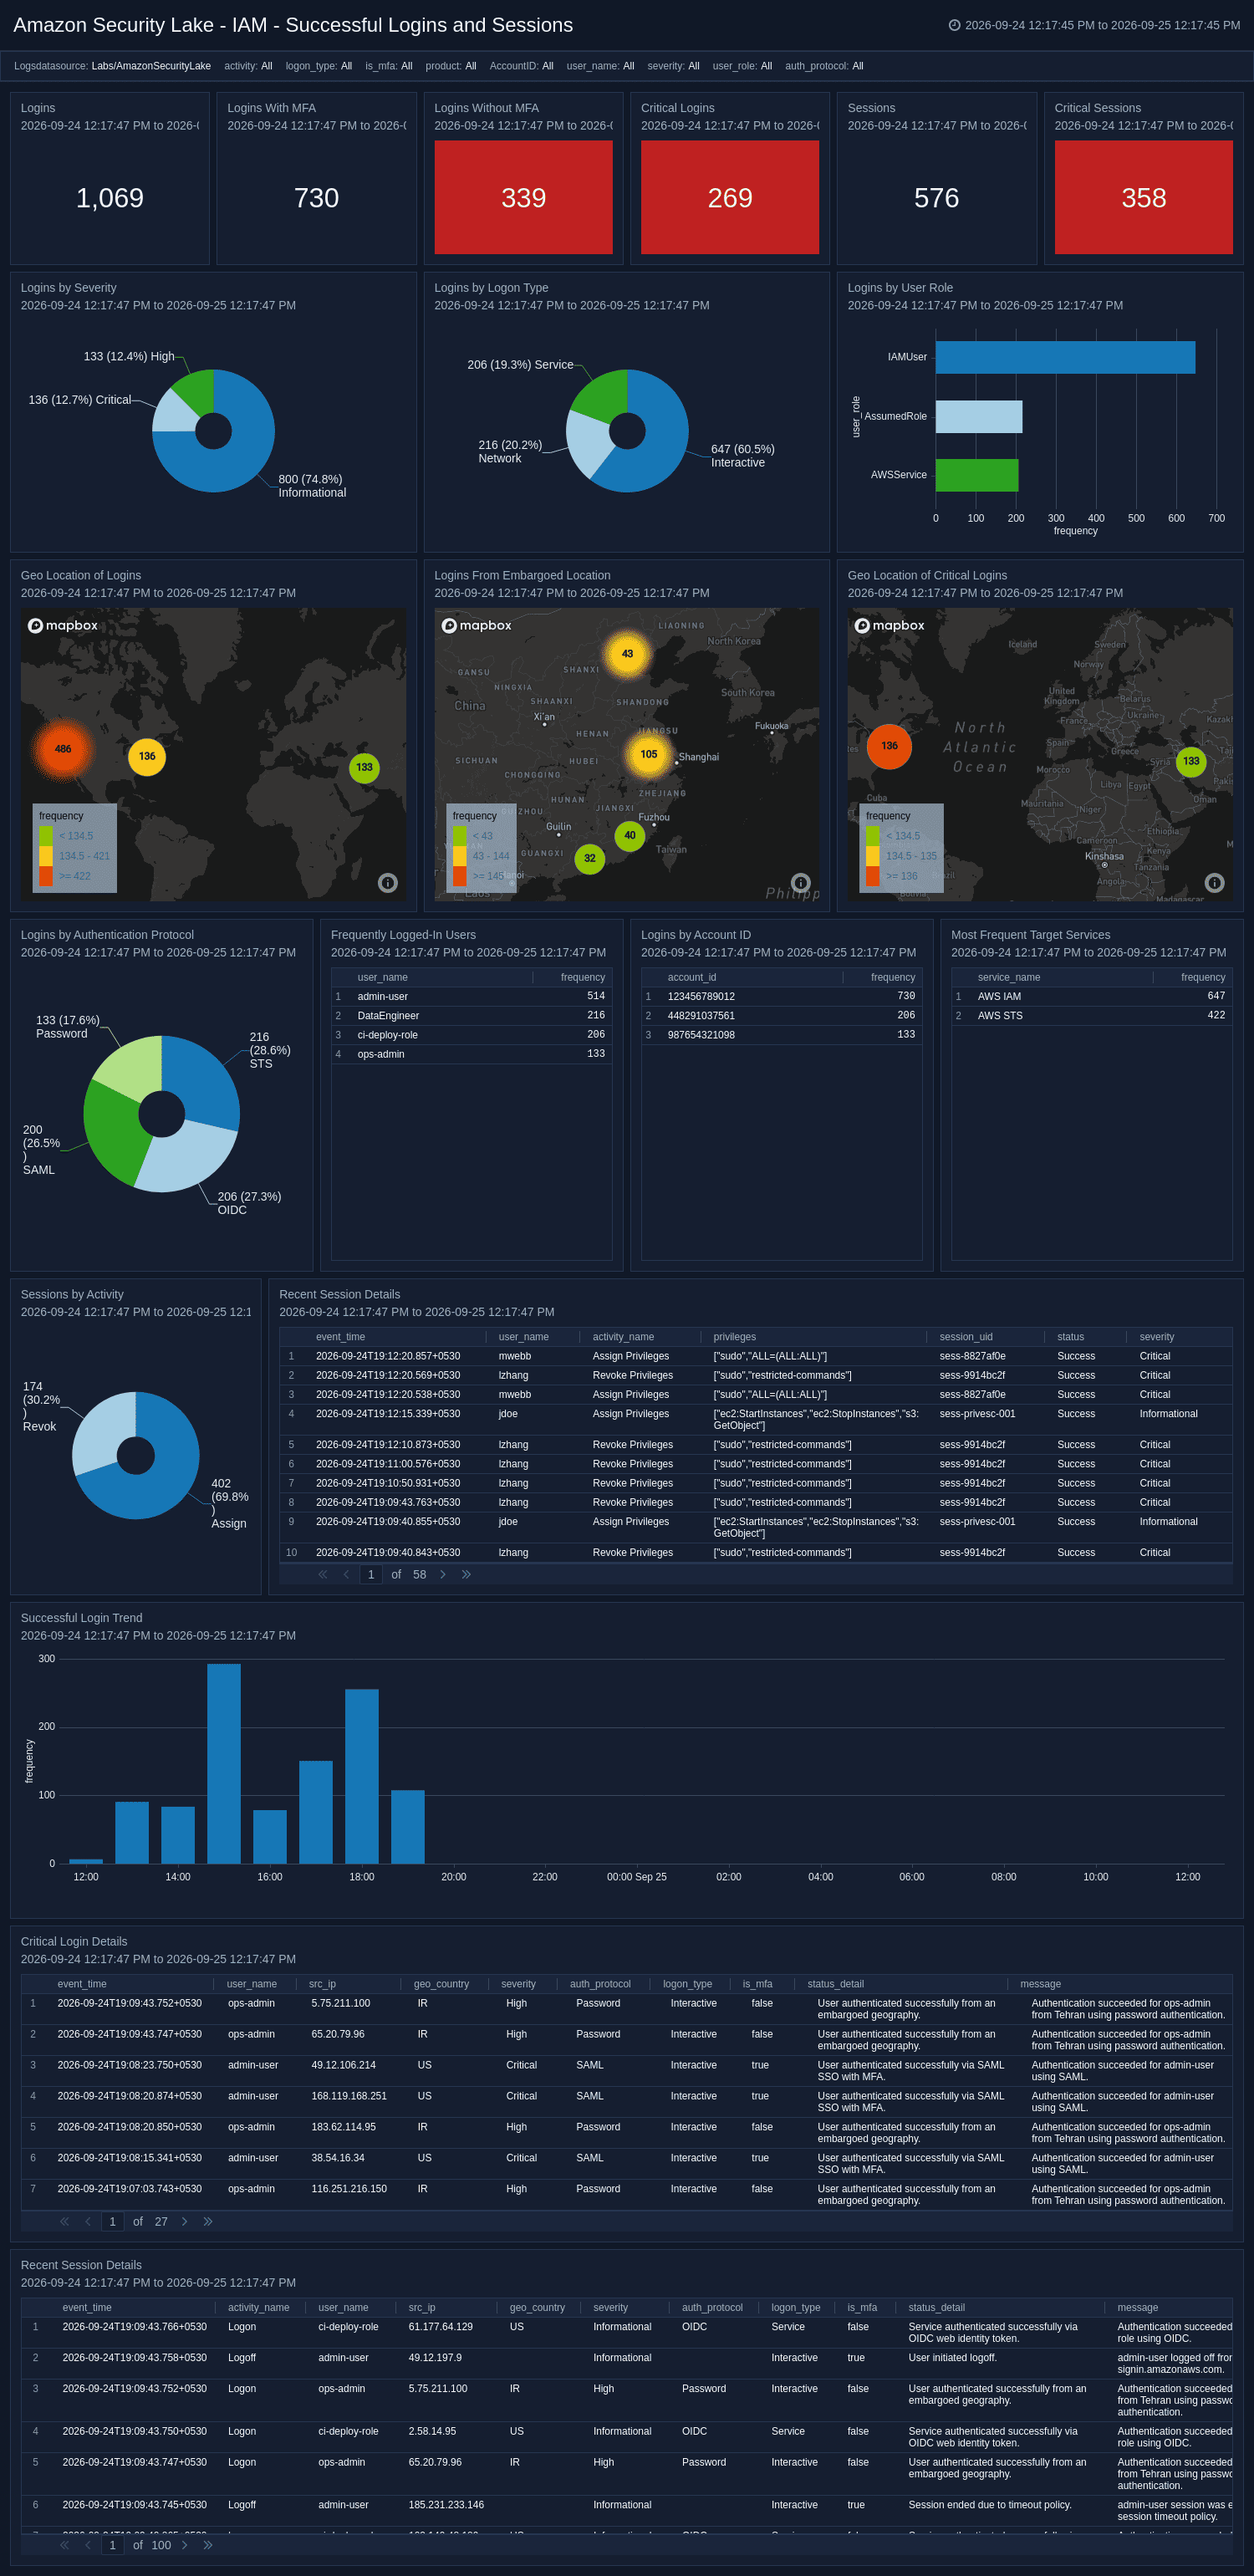
The IAM - Successful Logins & Sessions dashboard provides visibility into successful authentication and session authorization events normalized to the OCSF Identity & Access Management category. It tracks login volume, MFA adoption, logon type and protocol distribution, user role activity, and session privilege assignments. Geo-location panels map login origins and flag logins from embargoed locations, while trend charts reveal authentication patterns over time.
IAM - Failed Logins and Sessions
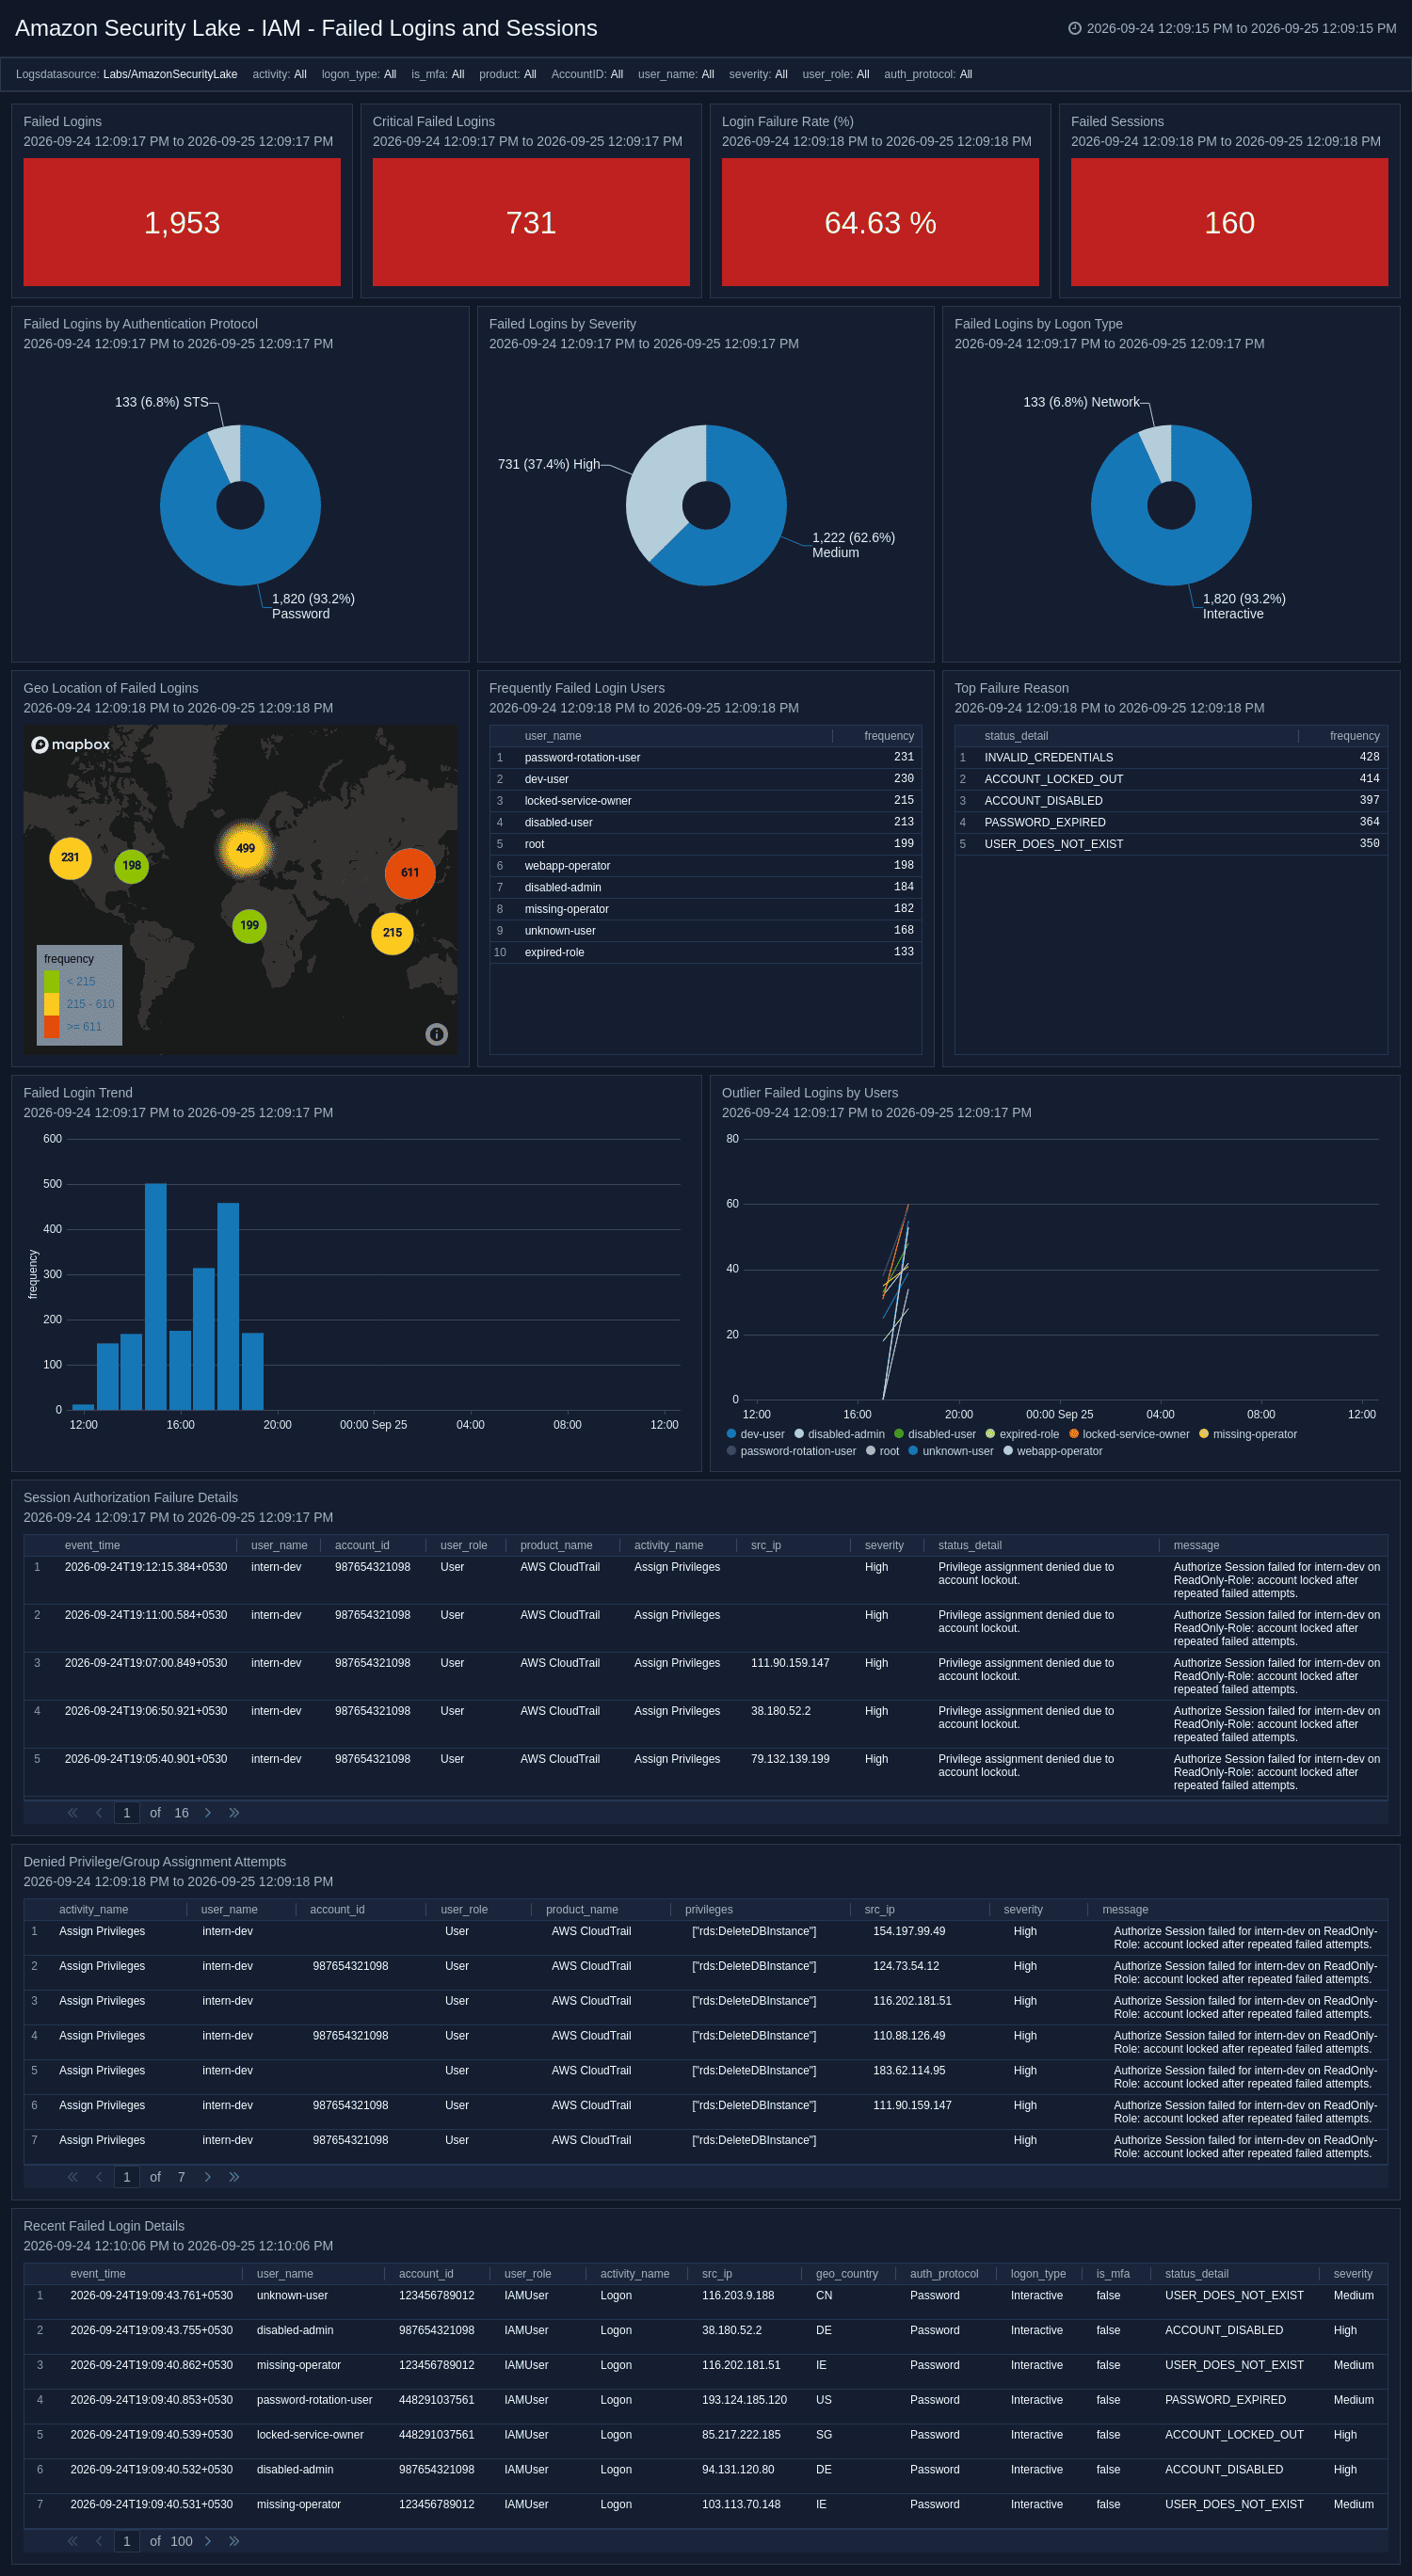
The IAM - Failed Logins & Sessions dashboard provides visibility into failed authentication and session authorization events across your environment. It tracks failure volume, failure rate percentage, top failure reasons, targeted users, and denied privilege assignments. Geo-location panels map the origin of failed login attempts, while outlier detection highlights users experiencing abnormally high failure counts, enabling rapid identification of brute-force or credential-stuffing attacks.
IAM - Change and Account Lifecycle Monitoring
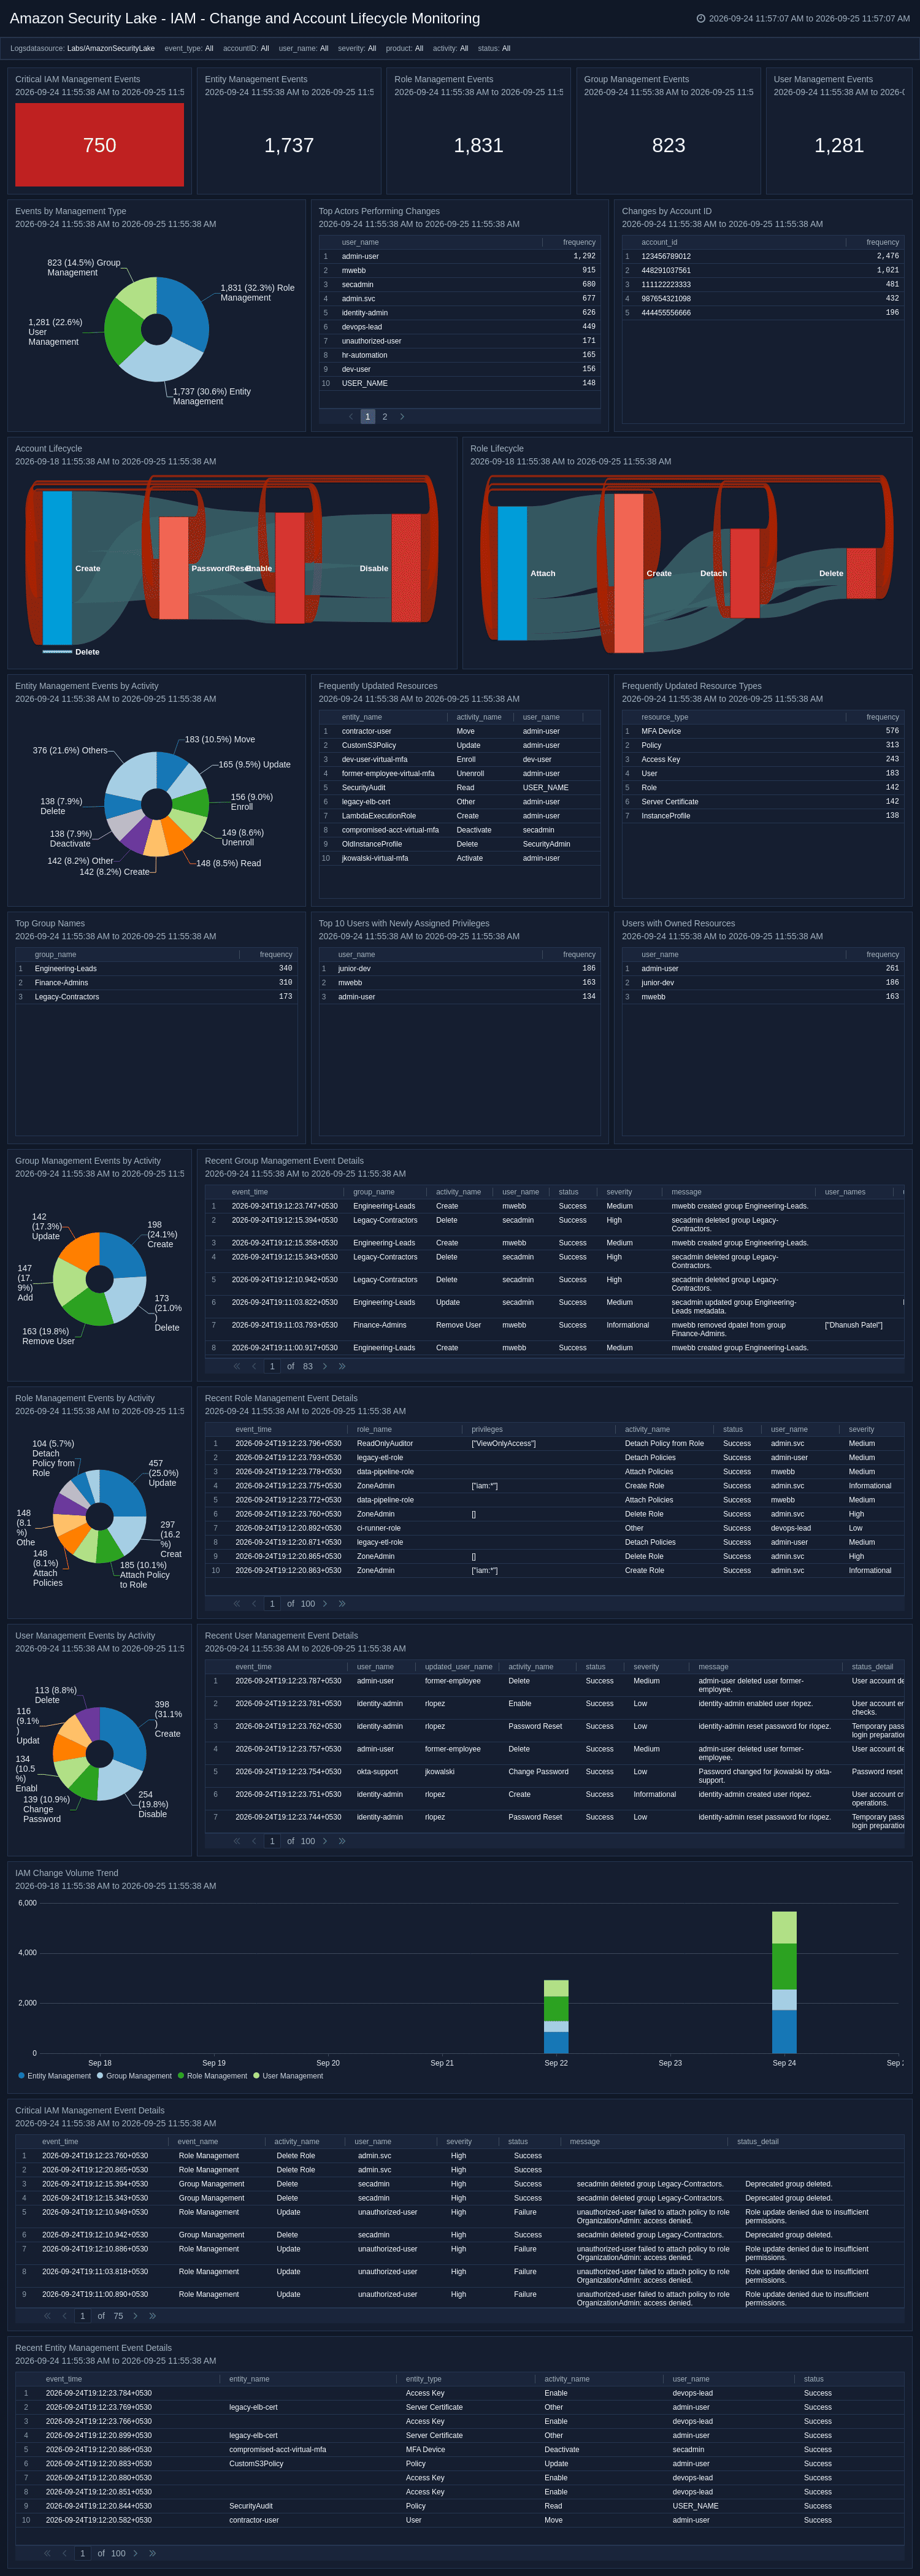
The IAM - Change & Account Lifecycle Monitoring dashboard provides visibility into user, group, role, and entity management events across your AWS environment. It tracks change volume by management type and actor, monitors account and role lifecycle flows, and surfaces newly assigned privileges and resource ownership changes. Dedicated panels highlight critical IAM management events and display the most frequently updated resources and resource types, enabling teams to enforce least-privilege policies.
Network - DNS Activity
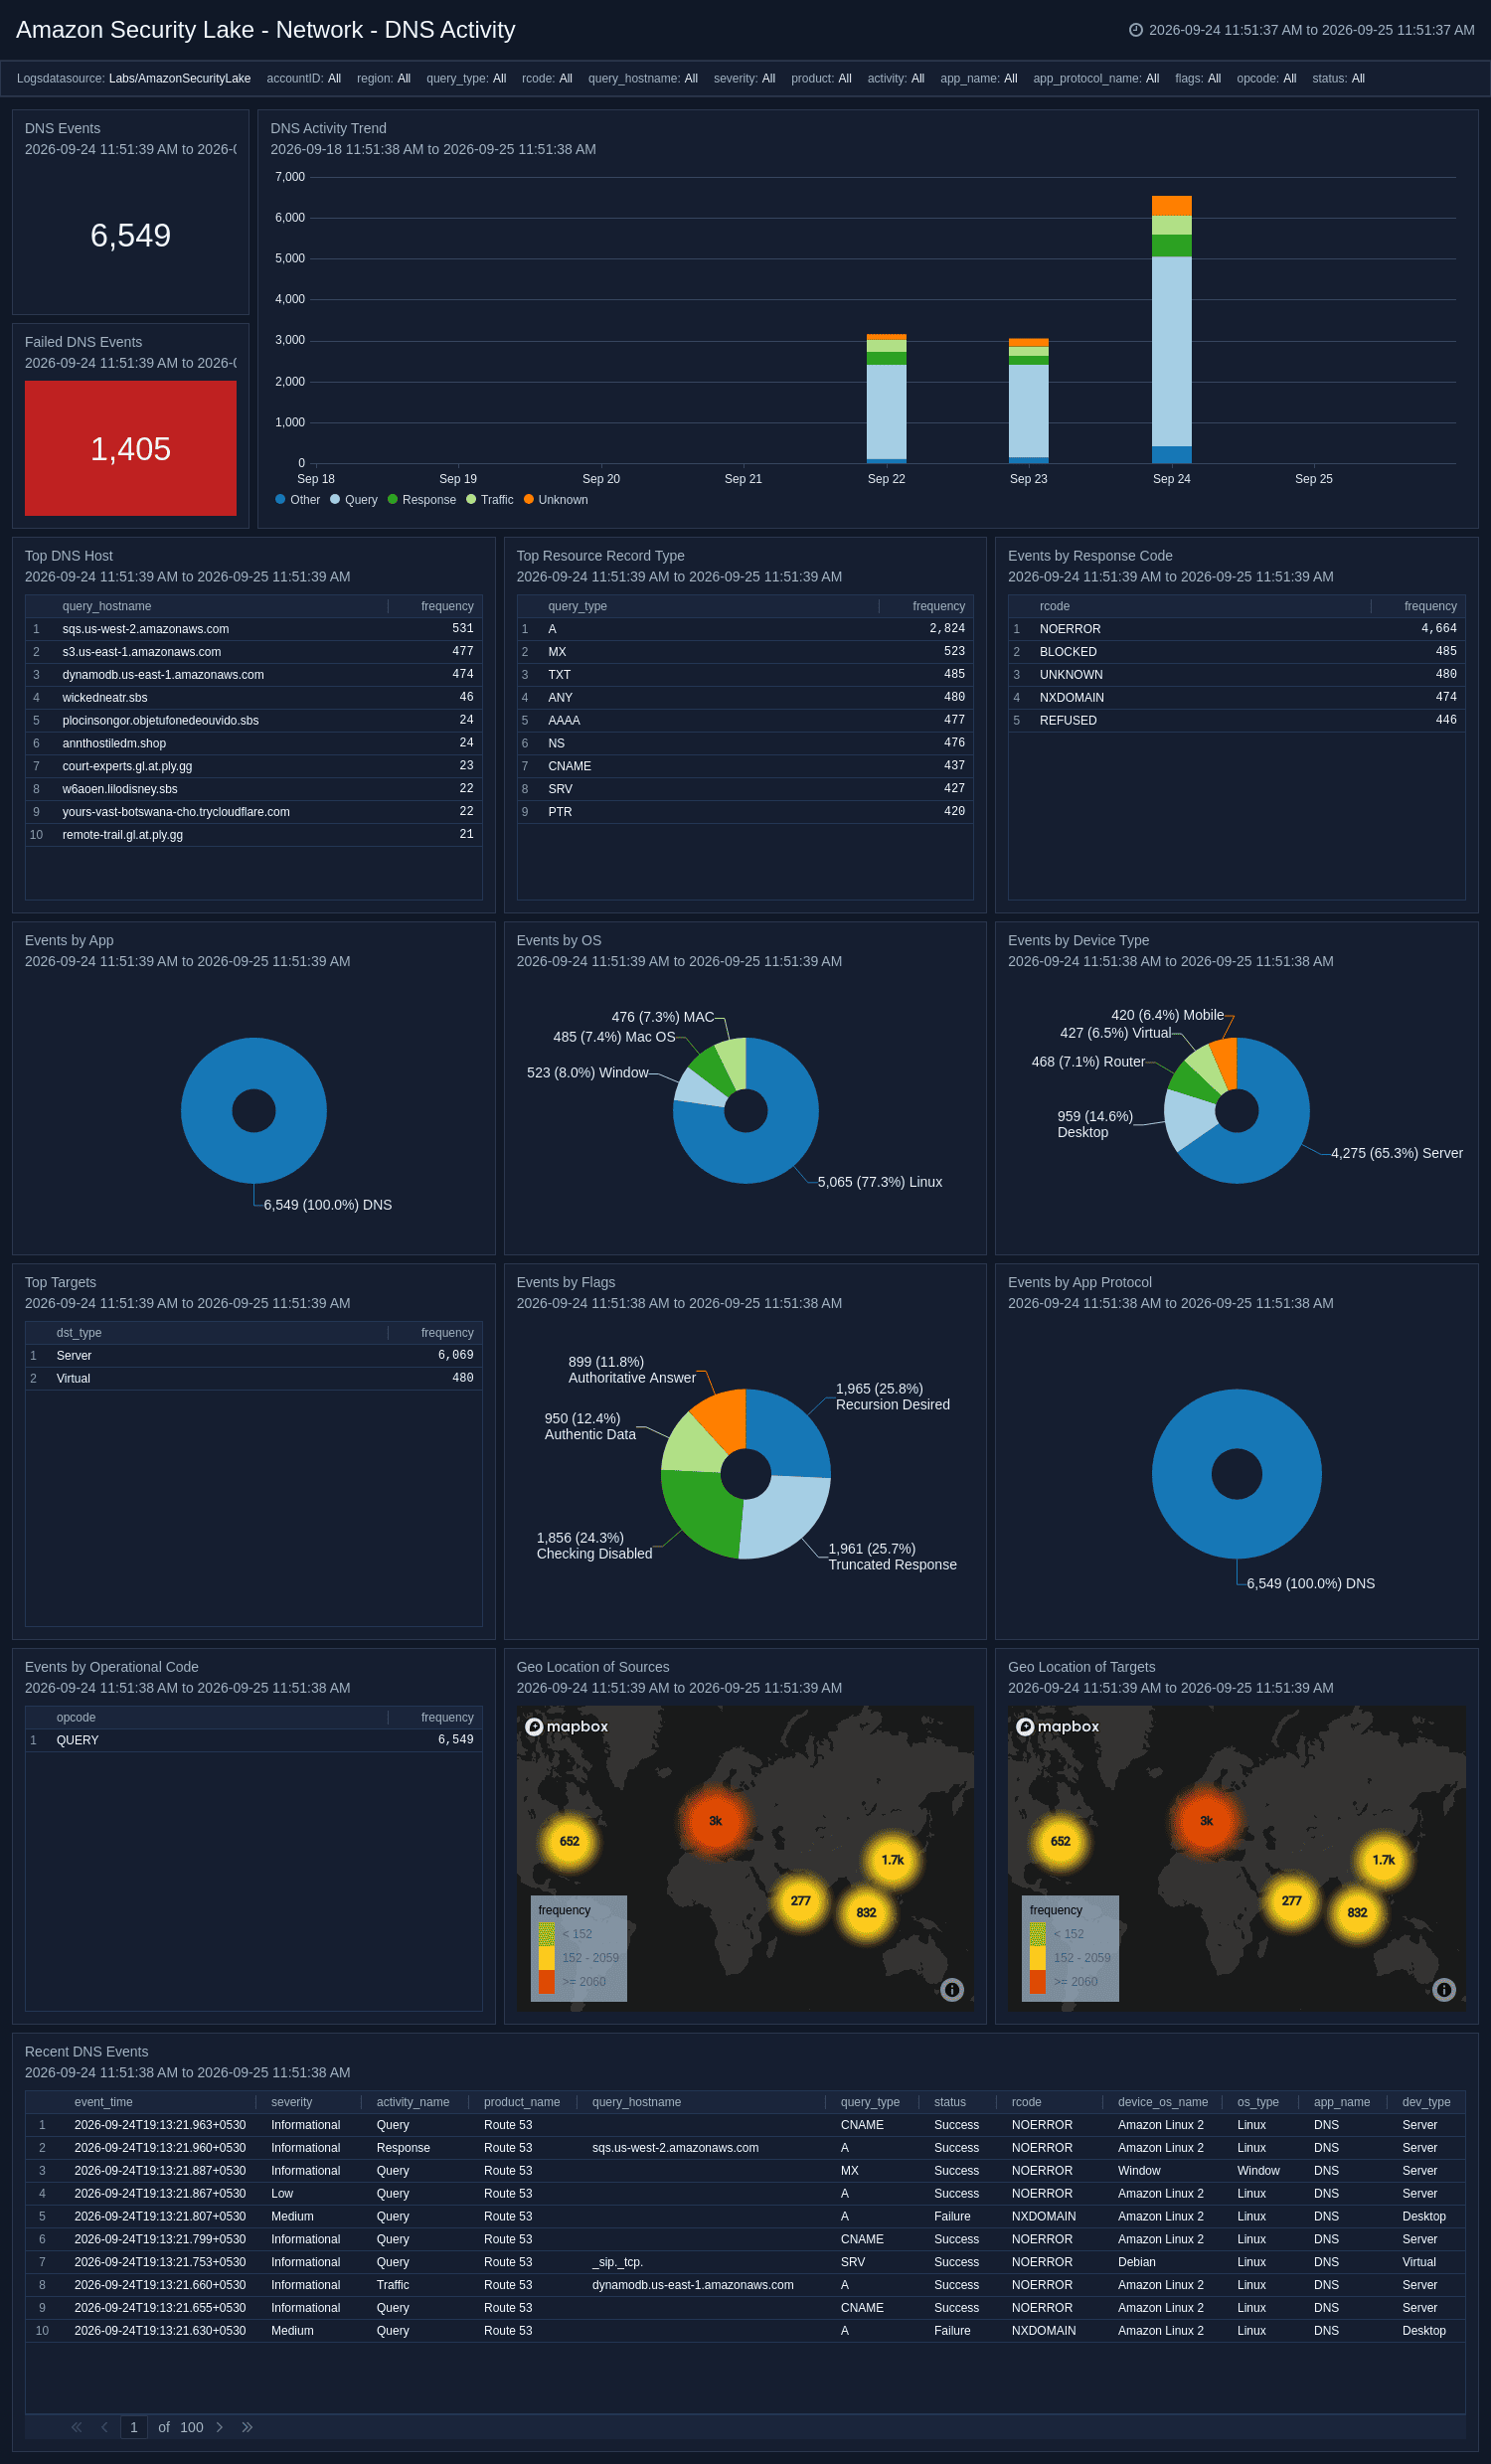
The Network - DNS Activity dashboard provides visibility into OCSF DNS Activity events across your environment, tracking query and response volume trends, top queried hostnames, record types, response and operational codes, and DNS flags. It breaks down activity by application, protocol, operating system, and device type, while geo-location panels map the origin of DNS sources and targets. Detailed event panels surface recent DNS queries for forensic investigation.
Network - Email Activity
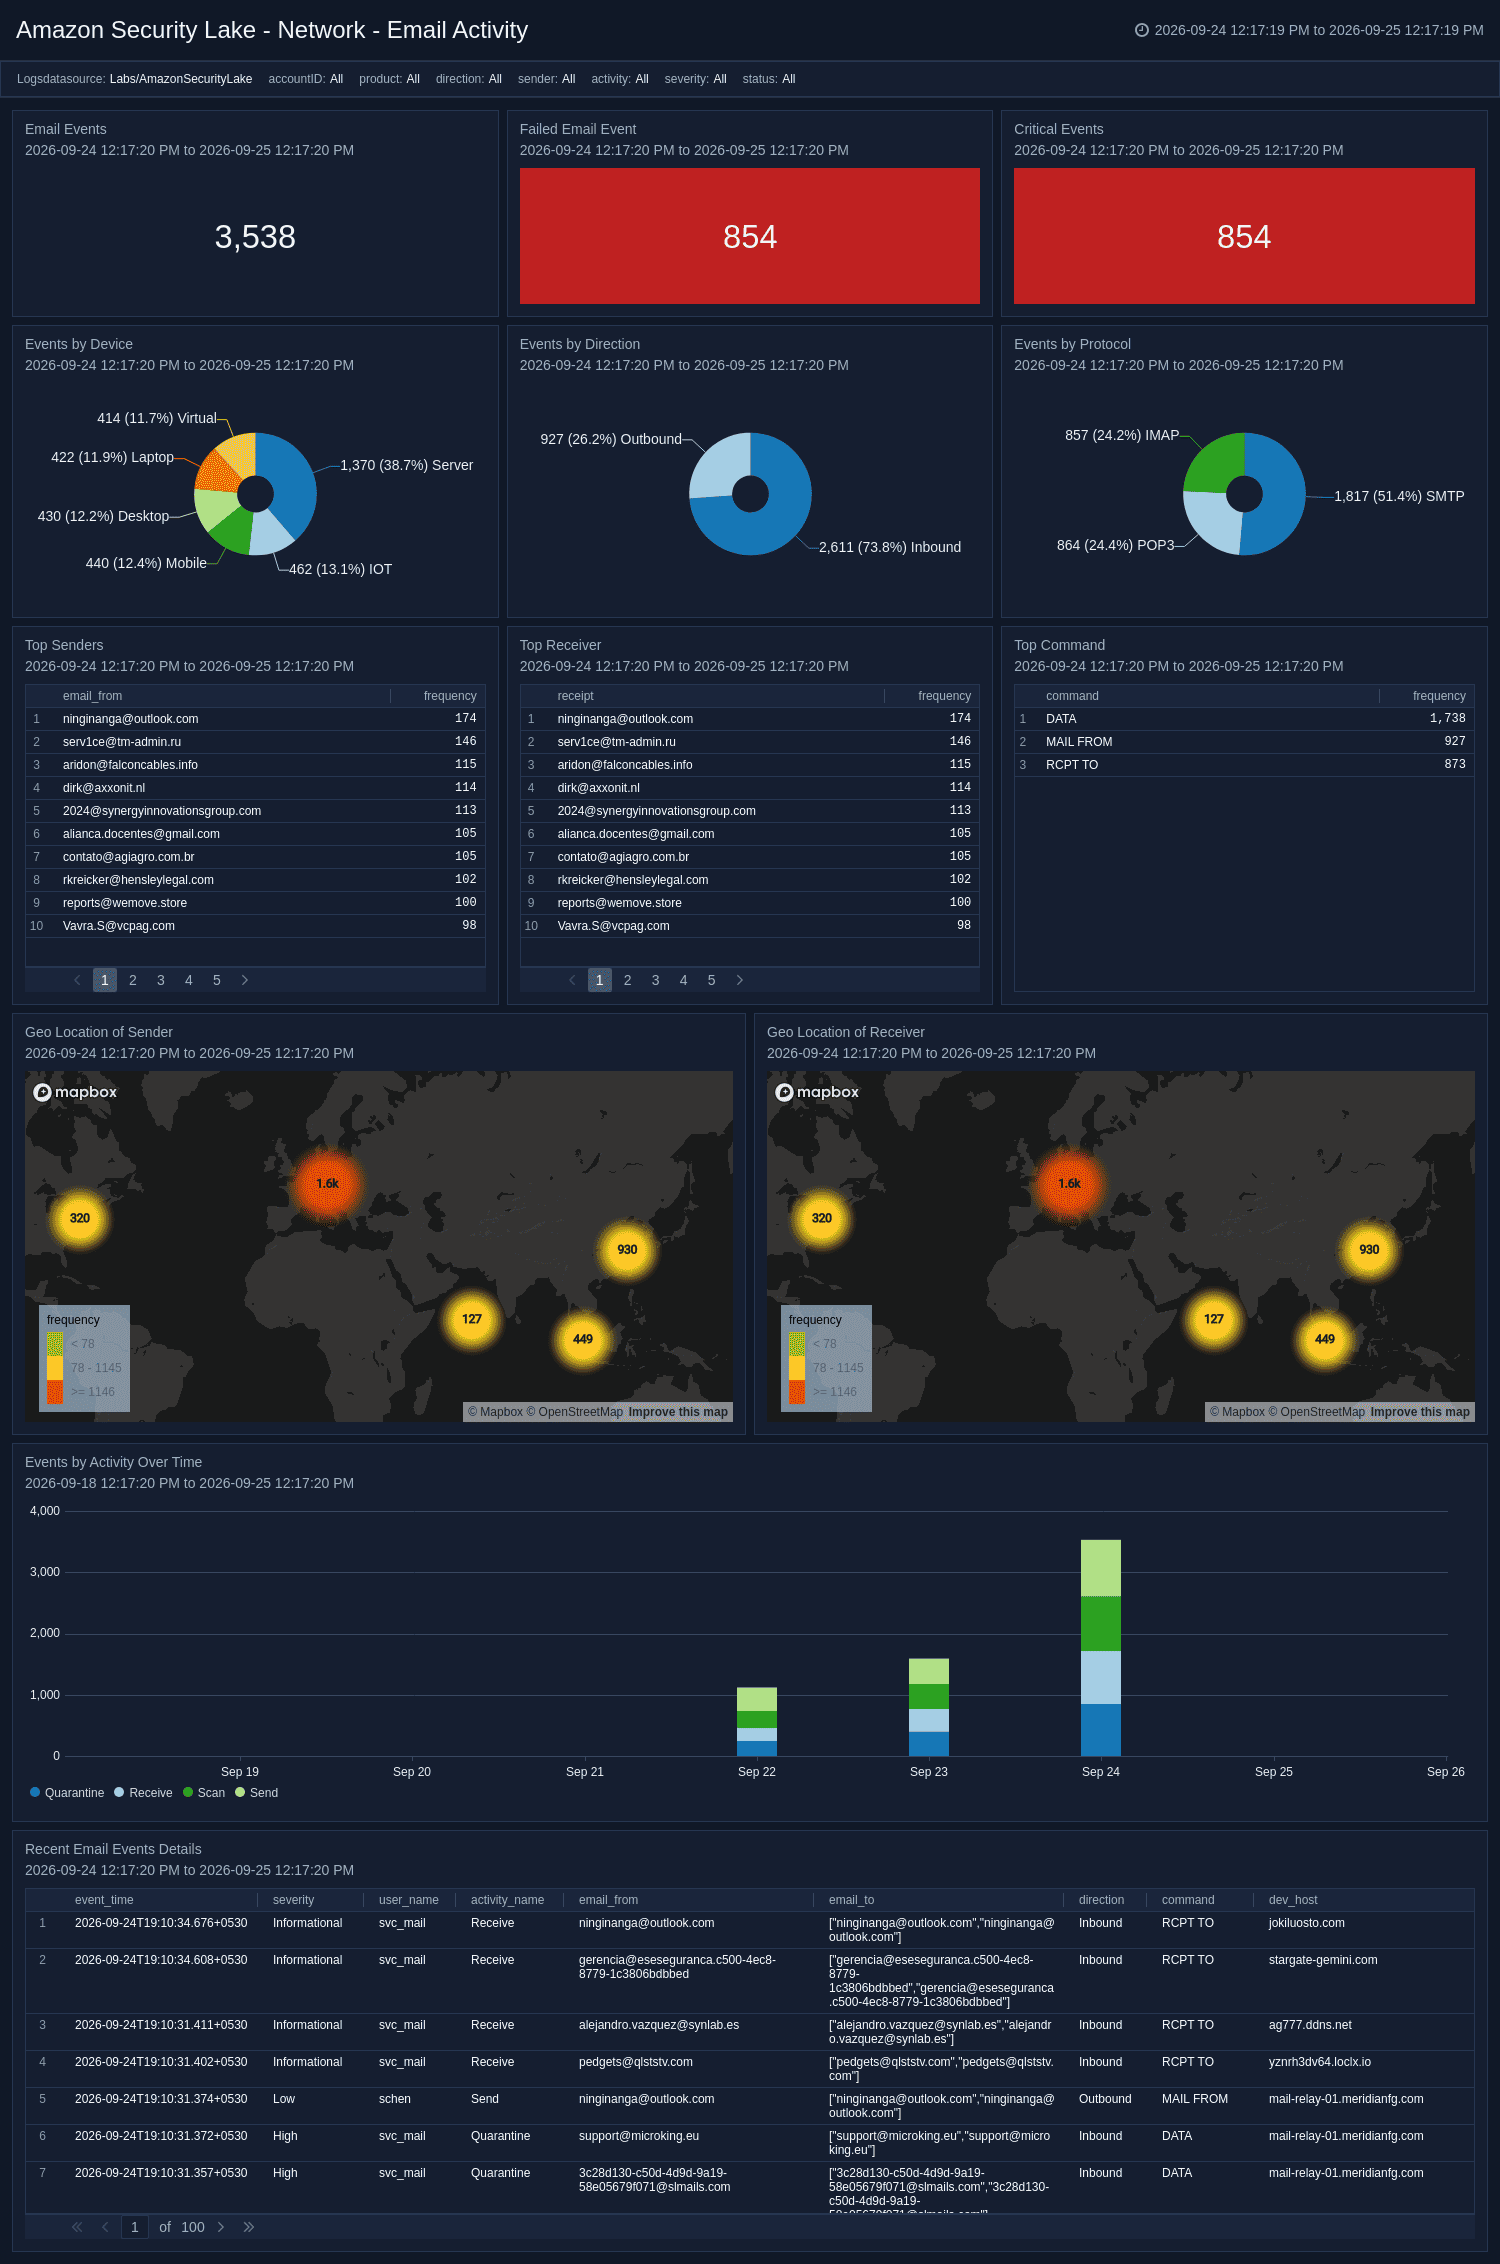
The Network - Email Activity dashboard provides visibility into OCSF Email Activity events, tracking message volume trends, top senders and recipients, email direction and protocol distribution, and frequently used commands. Geo-location panels map sender and receiver origins globally, while severity-based filtering highlights critical email events. Dedicated detail panels surface recent email activity for forensic analysis of suspicious communications.
Network - Network and Tunnel Activity
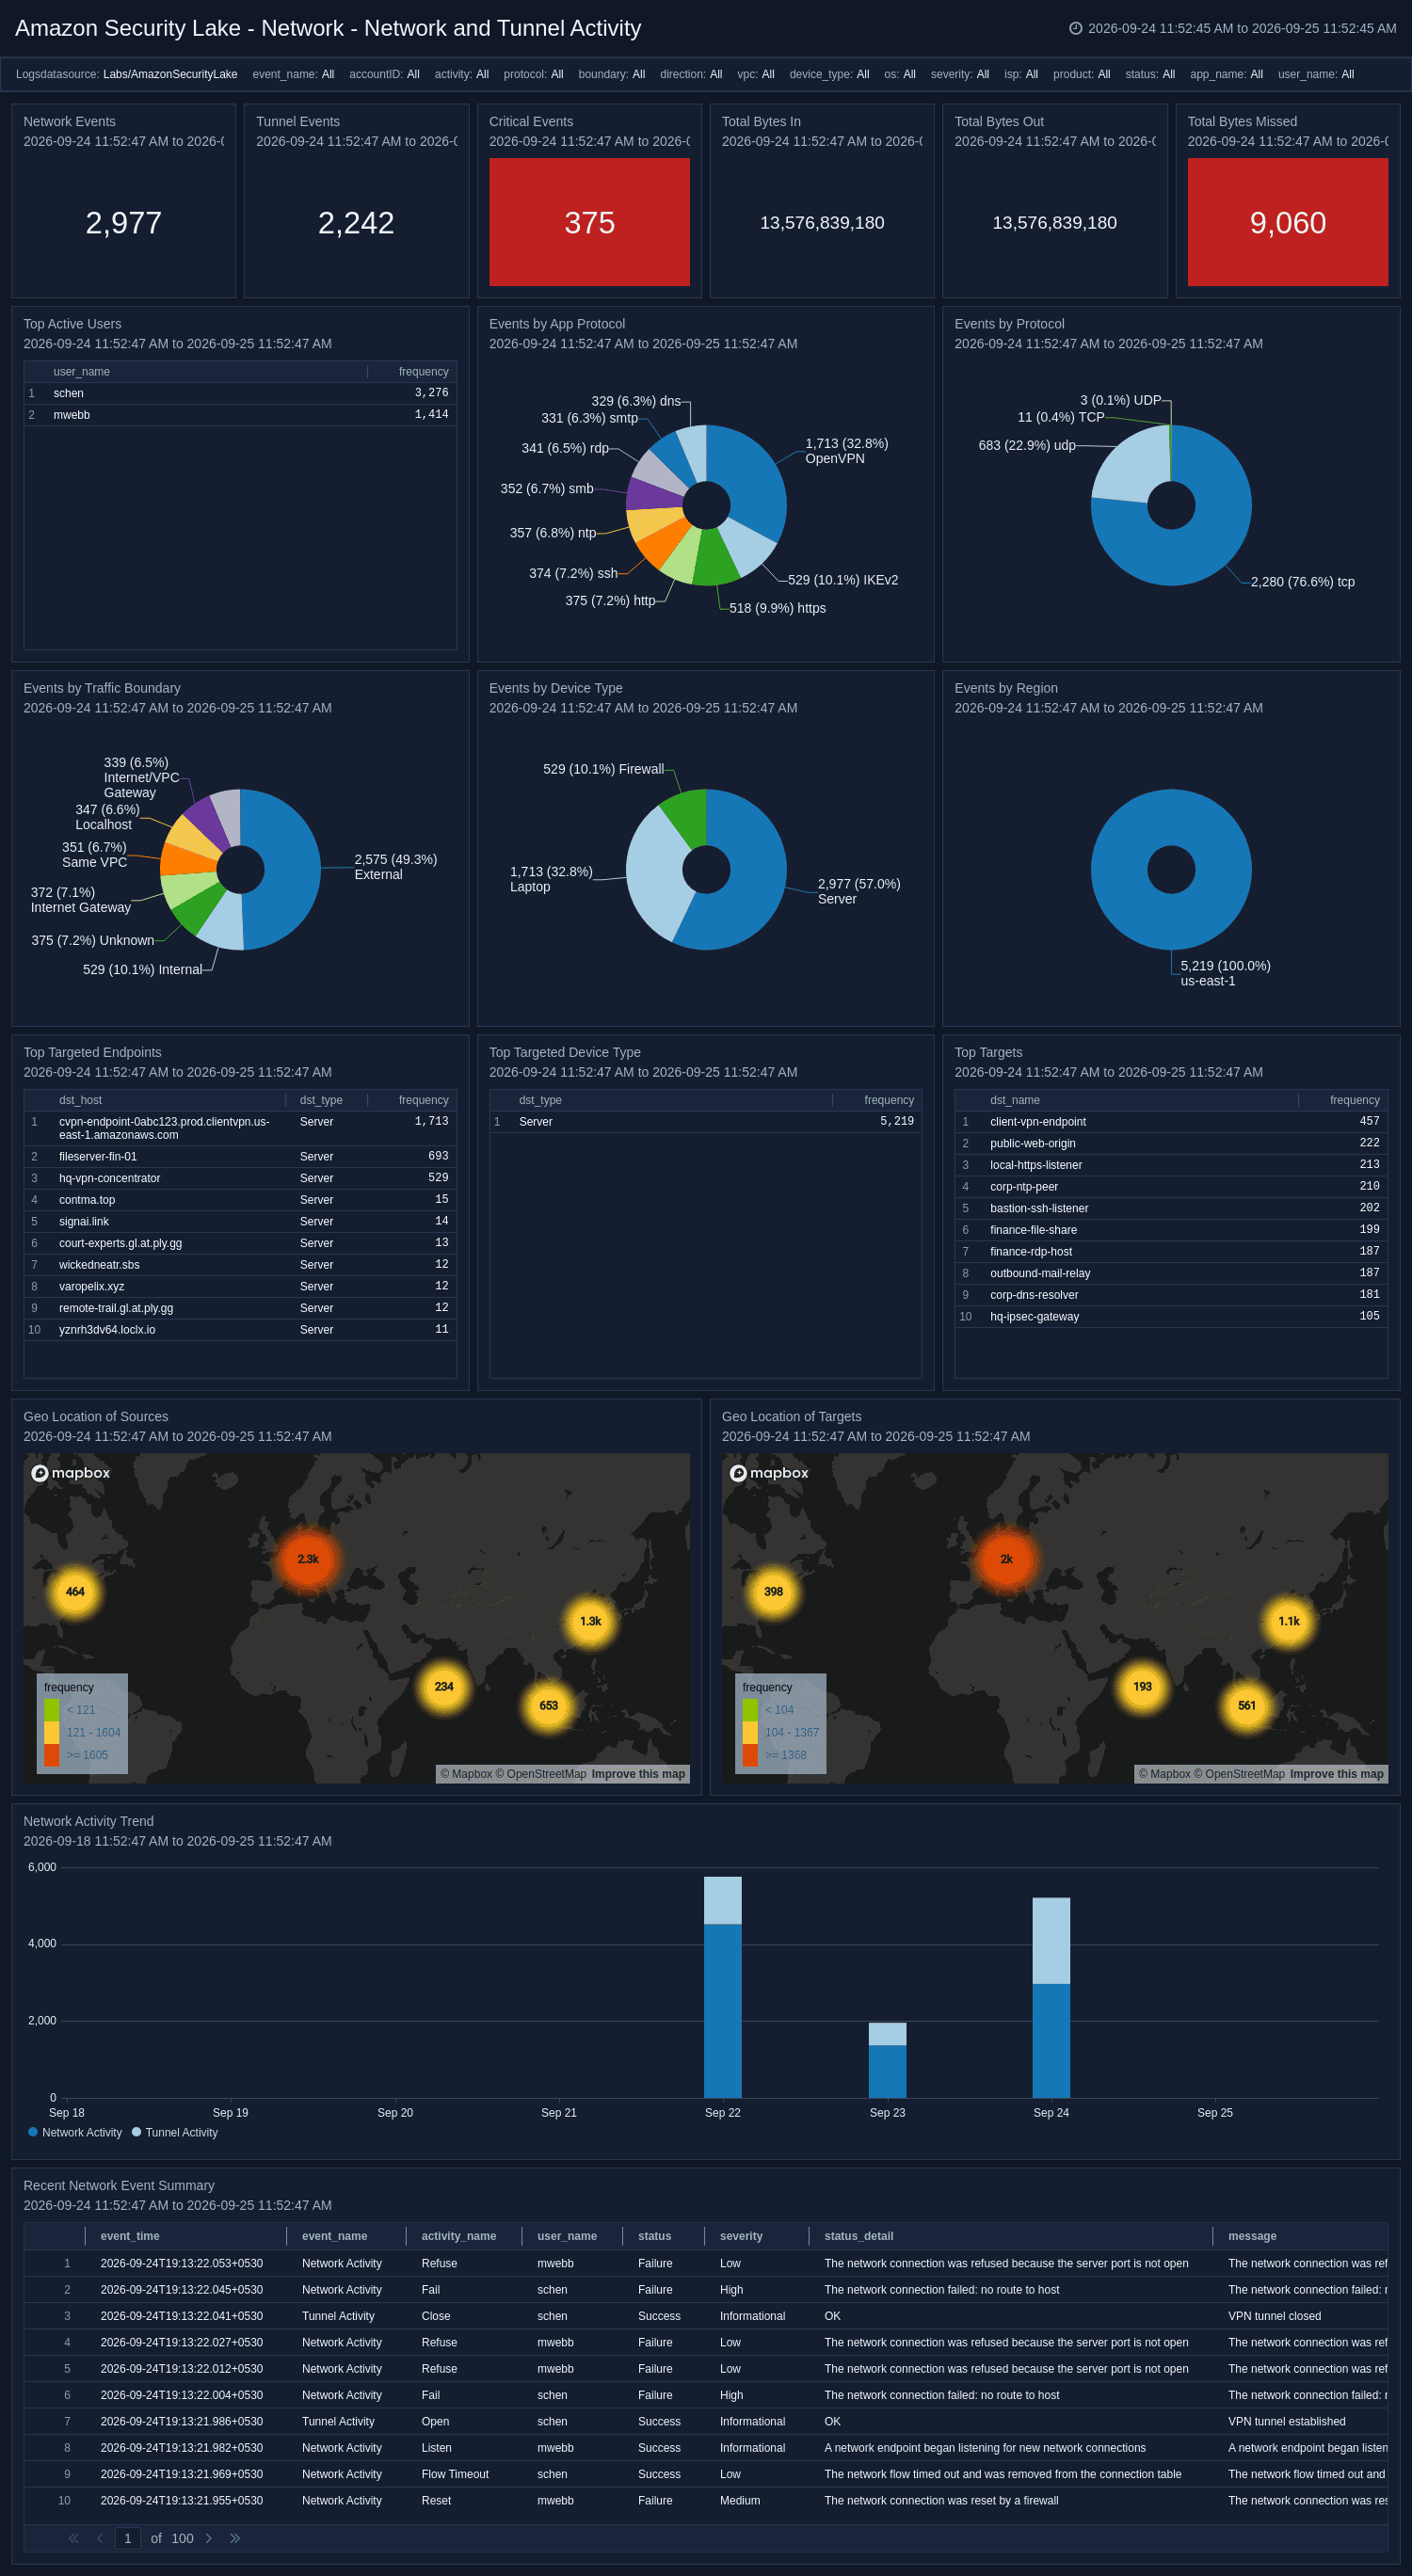
The Network - Network and Tunnel Activity dashboard provides visibility into OCSF Network Activity and Tunnel Activity events, tracking connection volume, outcomes, and traffic byte and packet counts. It breaks down activity by application protocol, traffic boundary, direction, region, and device type, while geo-location panels map source and target endpoints globally. Dedicated panels surface top targeted endpoints, active users, and total bytes in, out, and missed for bandwidth analysis.
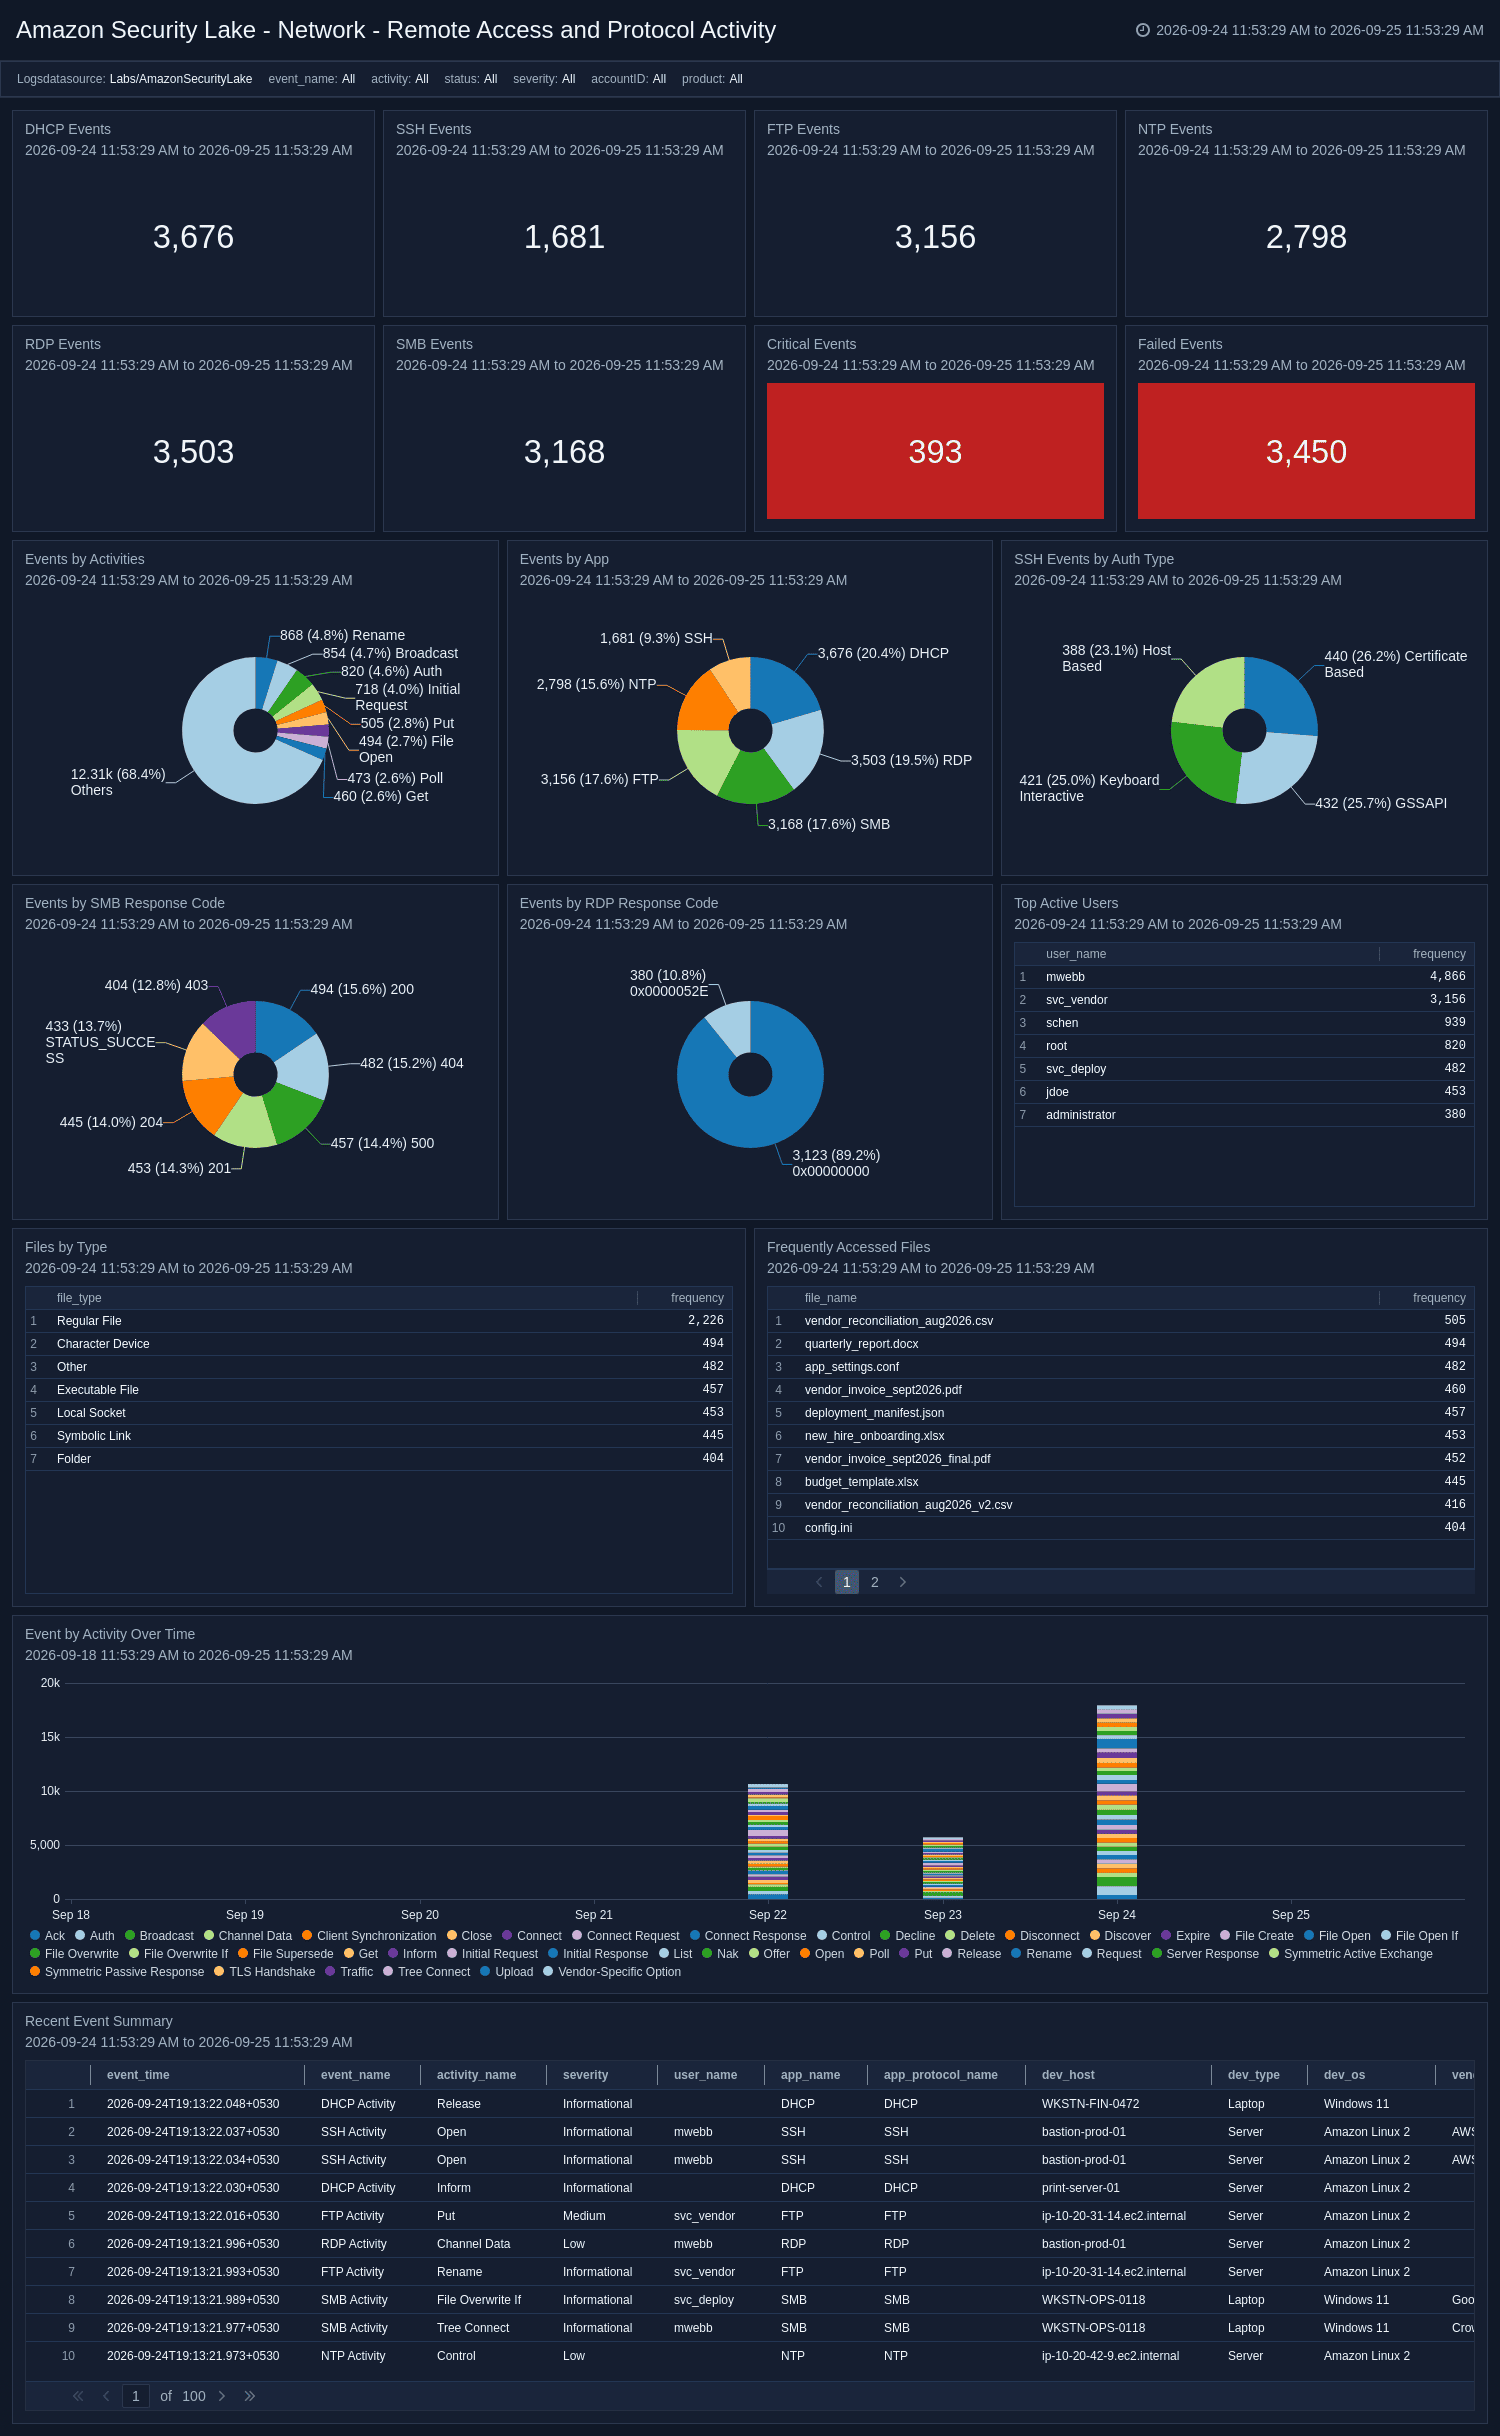
Network - Remote Access and Protocol Activity
The Network - Remote Access and Protocol Activity dashboard provides unified visibility into DHCP, RDP, SMB, SSH, FTP, and NTP activity events across your environment. It tracks per-protocol volumes, activity and application distribution, SSH authentication methods, SMB and RDP response codes, and file access patterns. Dedicated panels surface critical events, active users, and recently accessed file types, enabling detection of remote access misuse and unauthorized protocol activity.
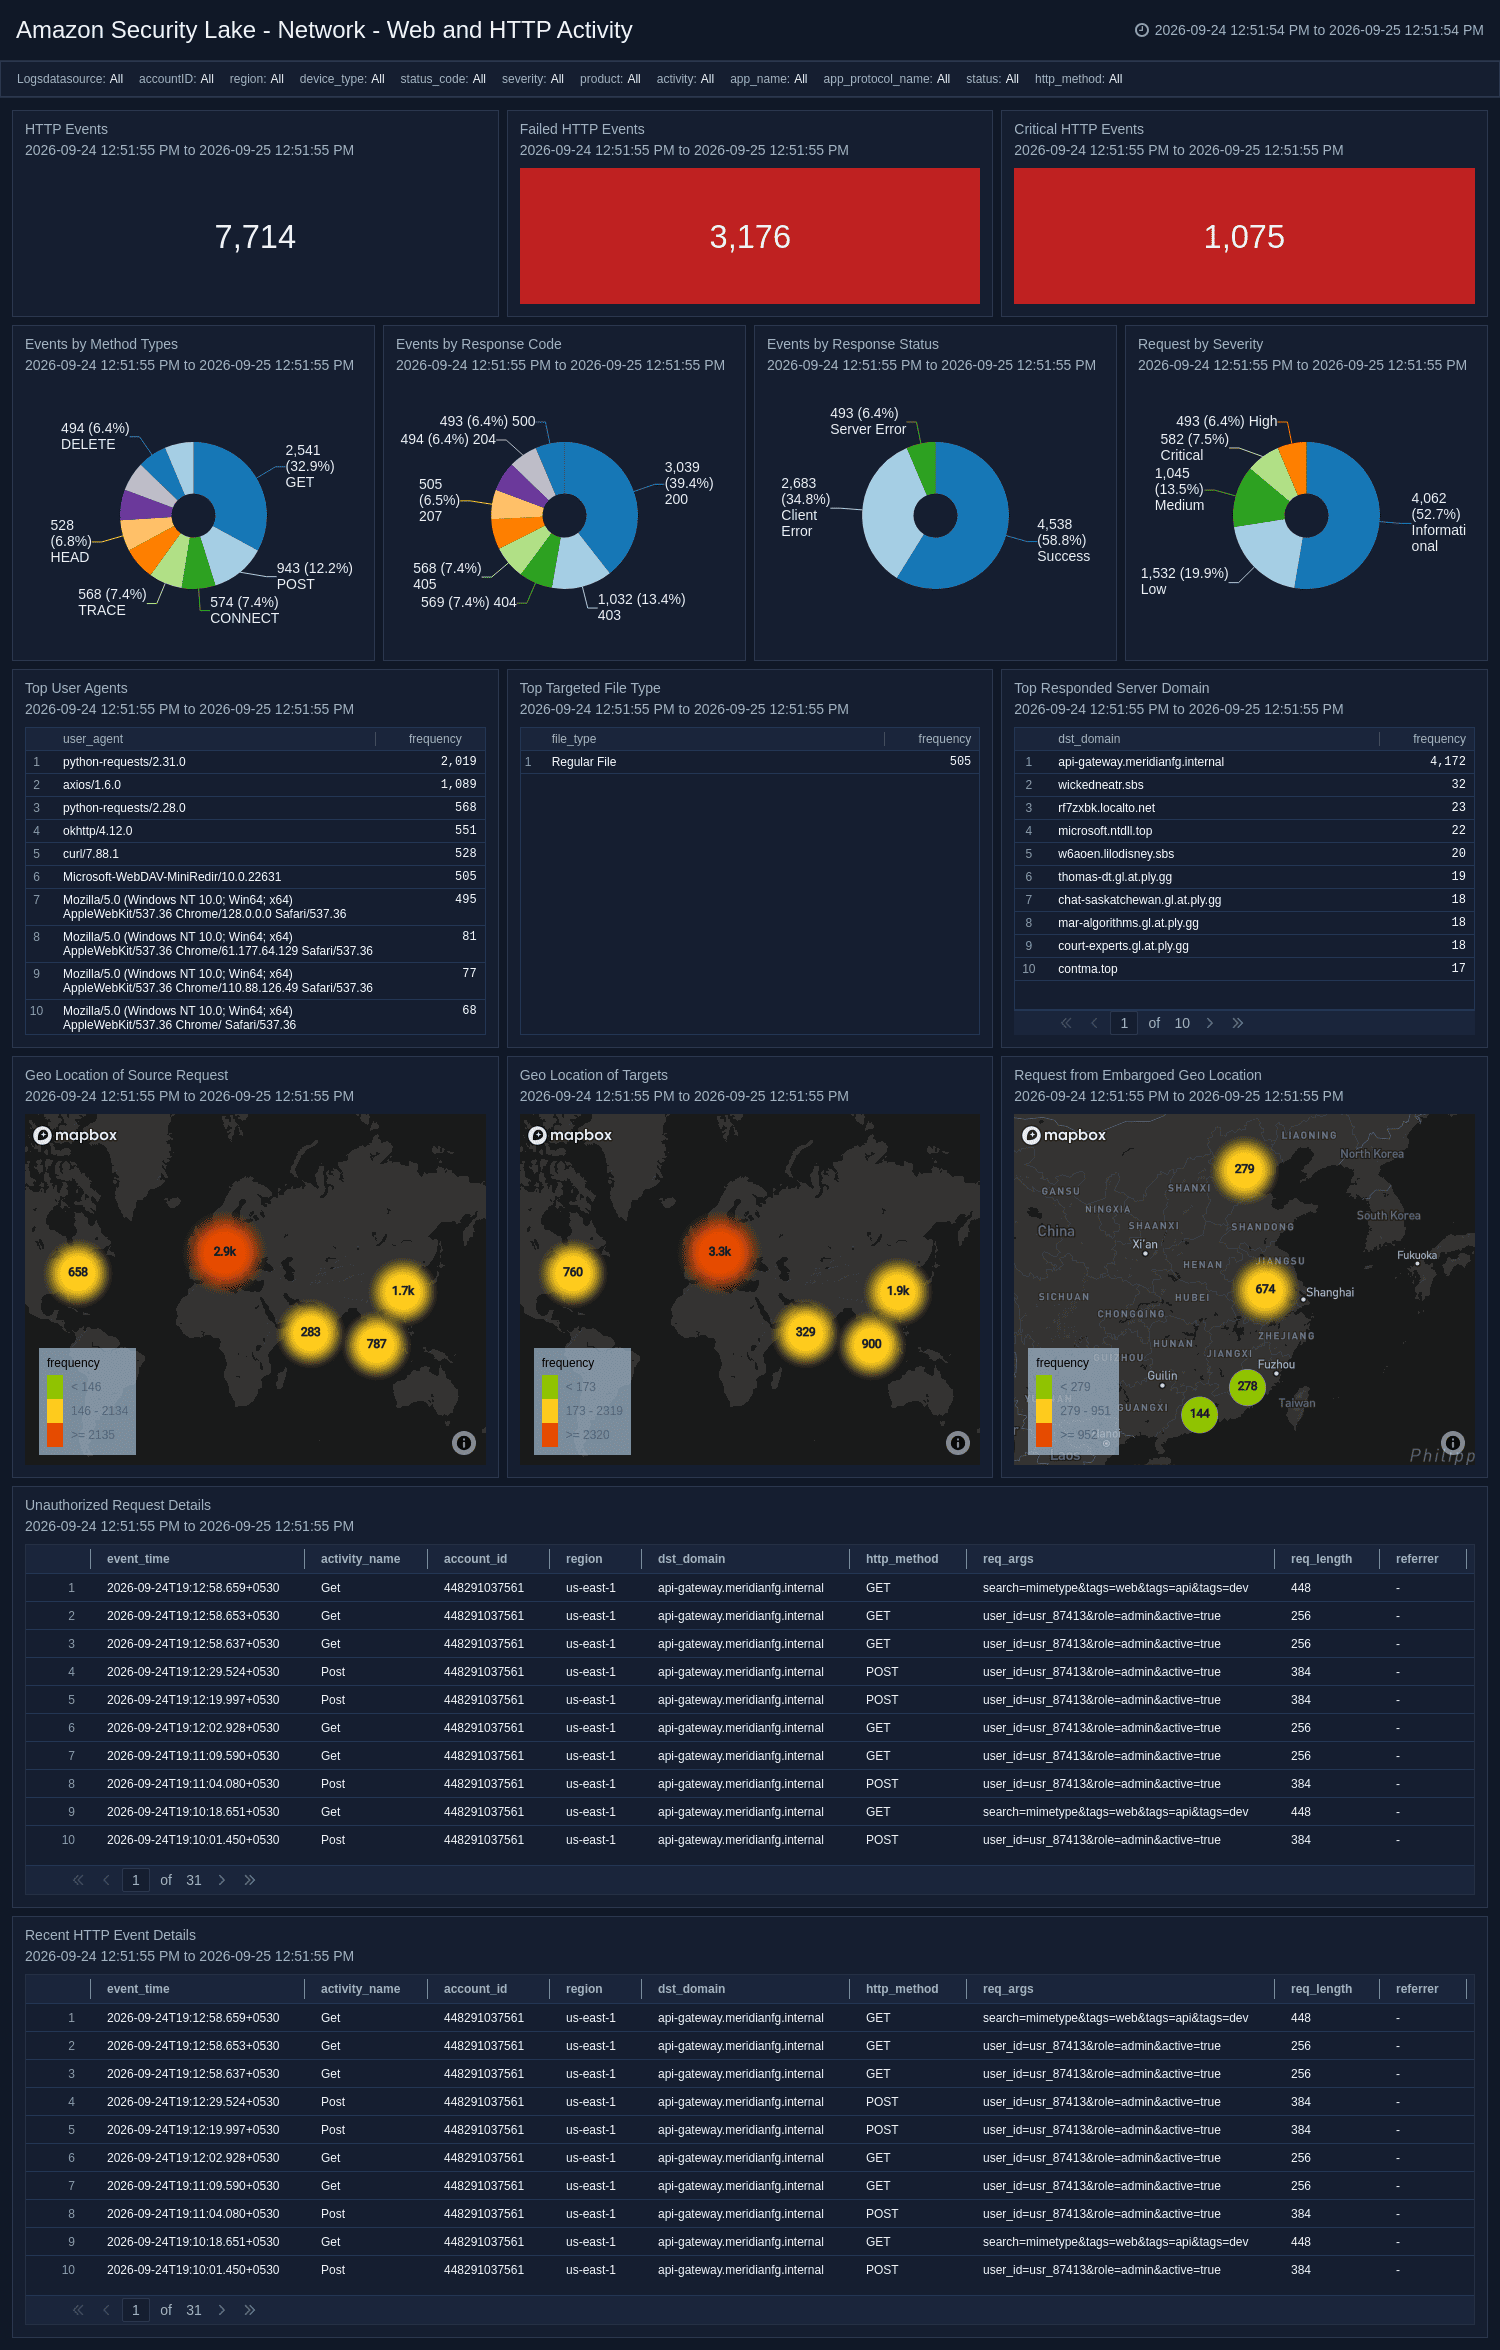
Network - Web and HTTP Activity
The Network - Web and HTTP Activity dashboard provides visibility into OCSF HTTP Activity events, tracking request methods, response codes and statuses, top user agents, requested file types, and server domains contacted. It highlights unauthorized (401/403) requests and critical HTTP events, while geo-location panels map the origin of source requests and identify traffic from embargoed locations. Severity-based filtering enables prioritization of the most critical web threats.
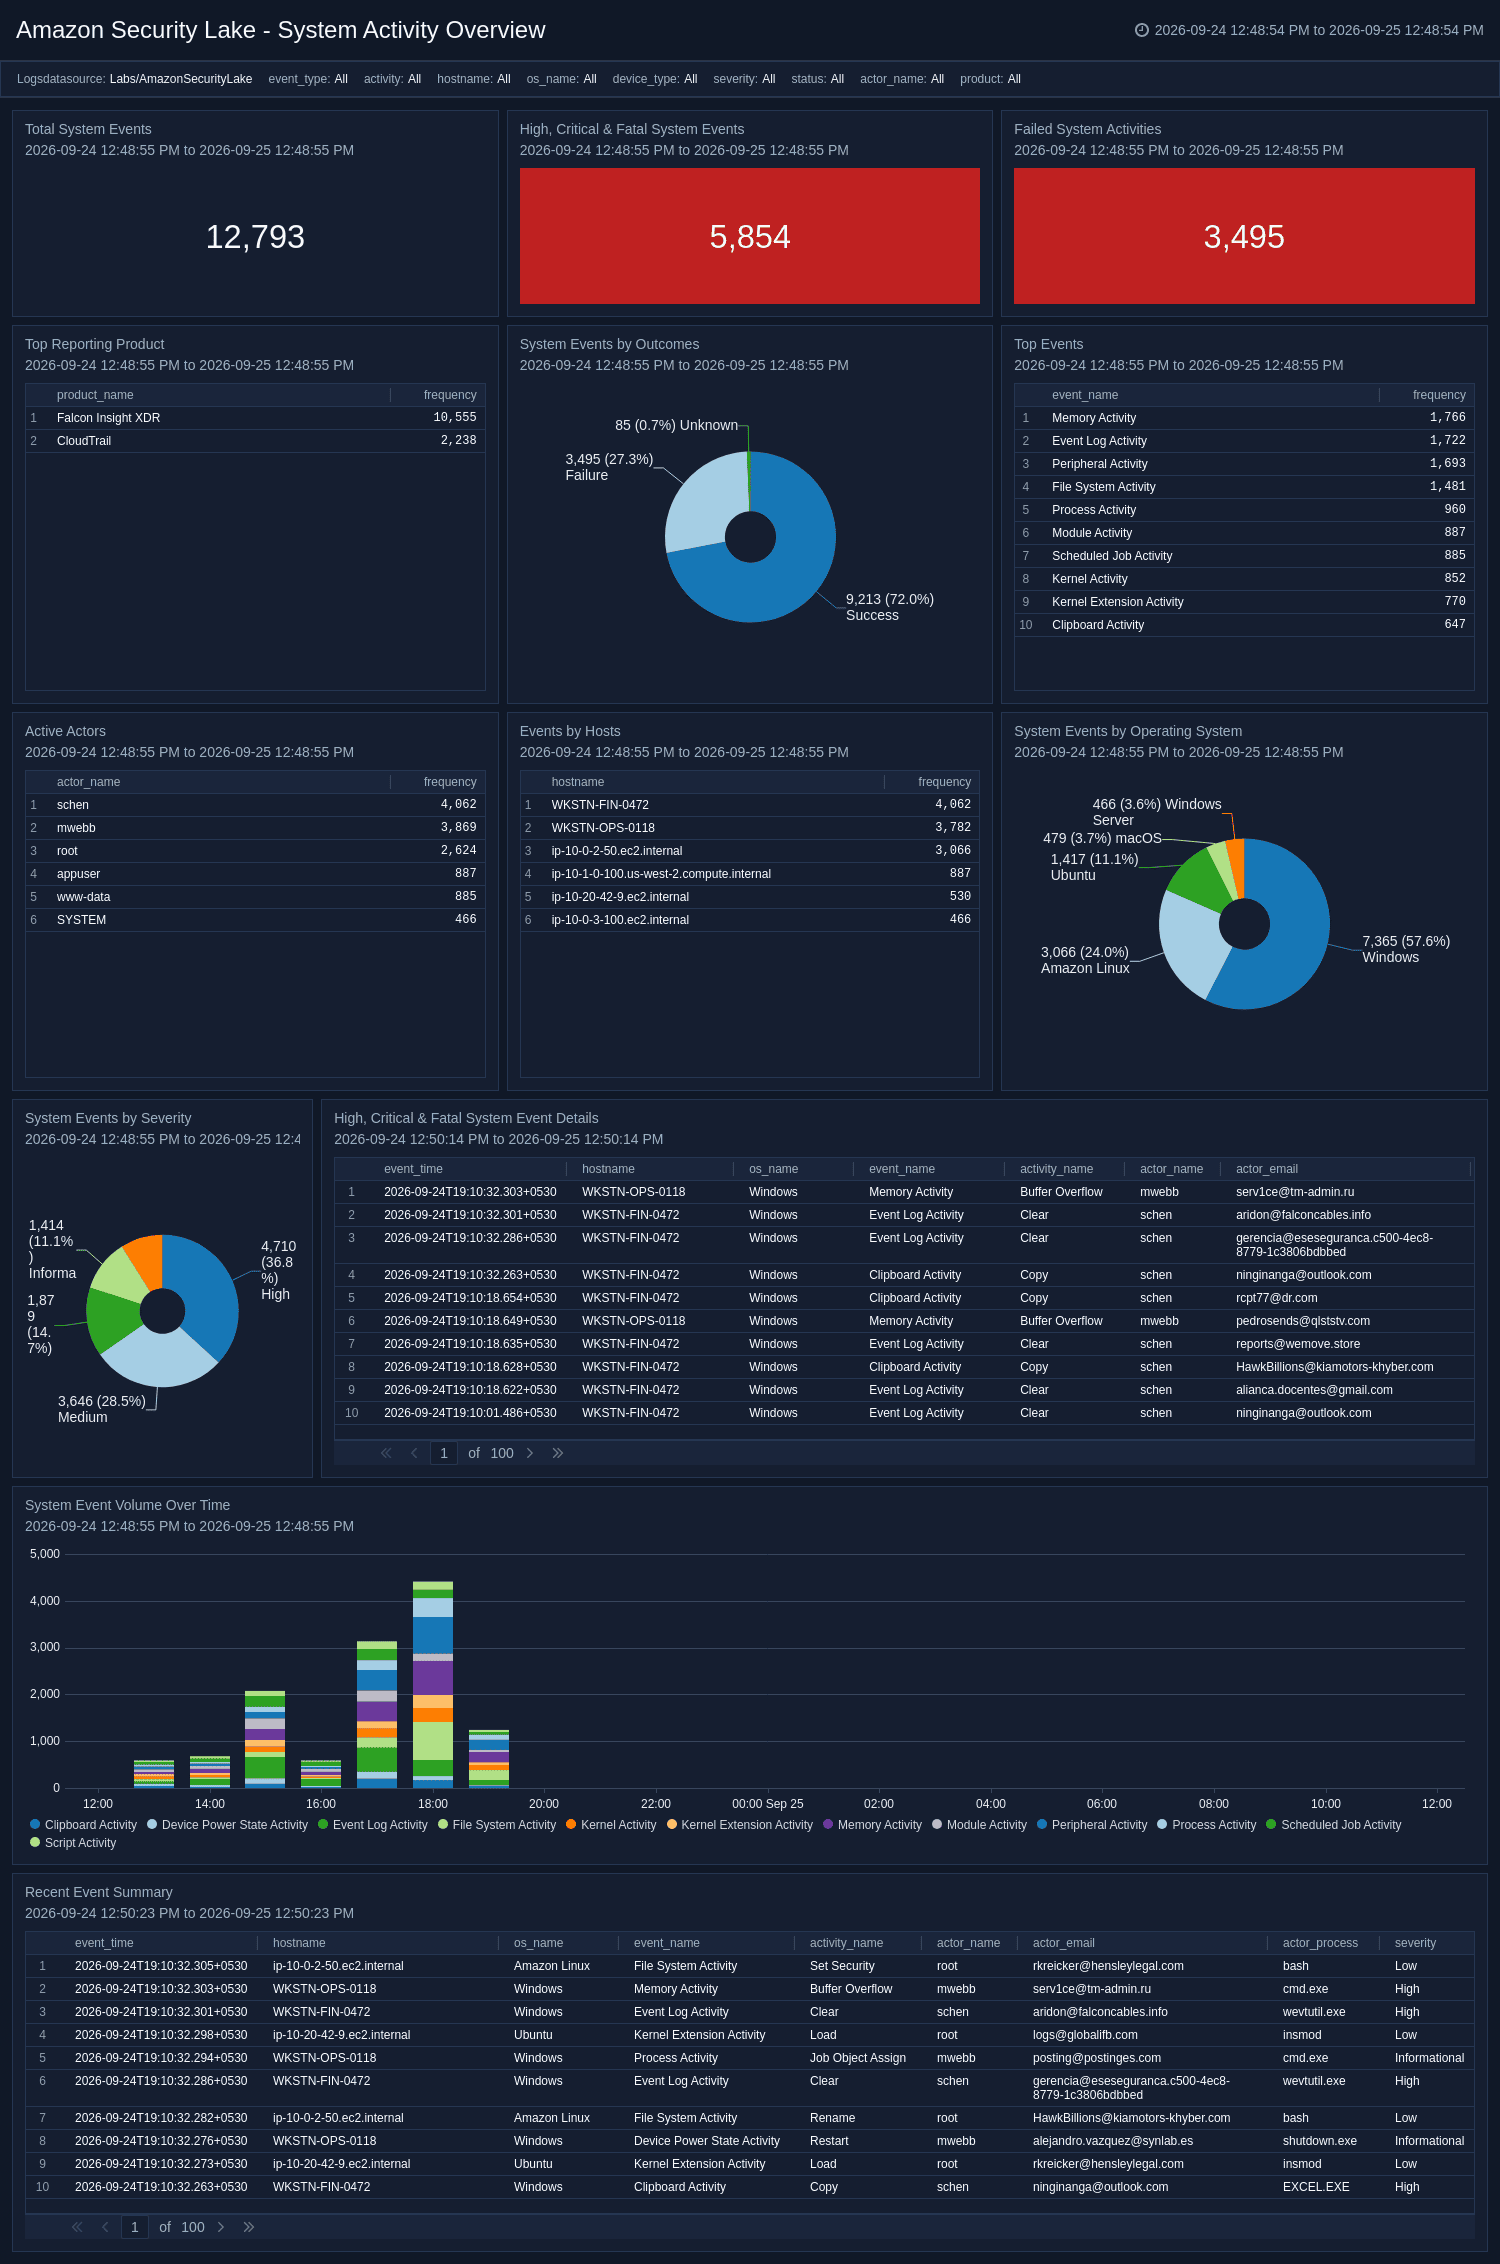
System Activity Overview
The System Activity Overview dashboard provides a consolidated view of endpoint and host telemetry normalized into the OCSF System Activity category. It tracks event volume by event type, severity, outcome, operating system, host, and reporting product, while highlighting high, critical, and fatal system events. Trend charts reveal system event volume patterns over time, and a recent event summary enables rapid triage of the latest host-level activity.
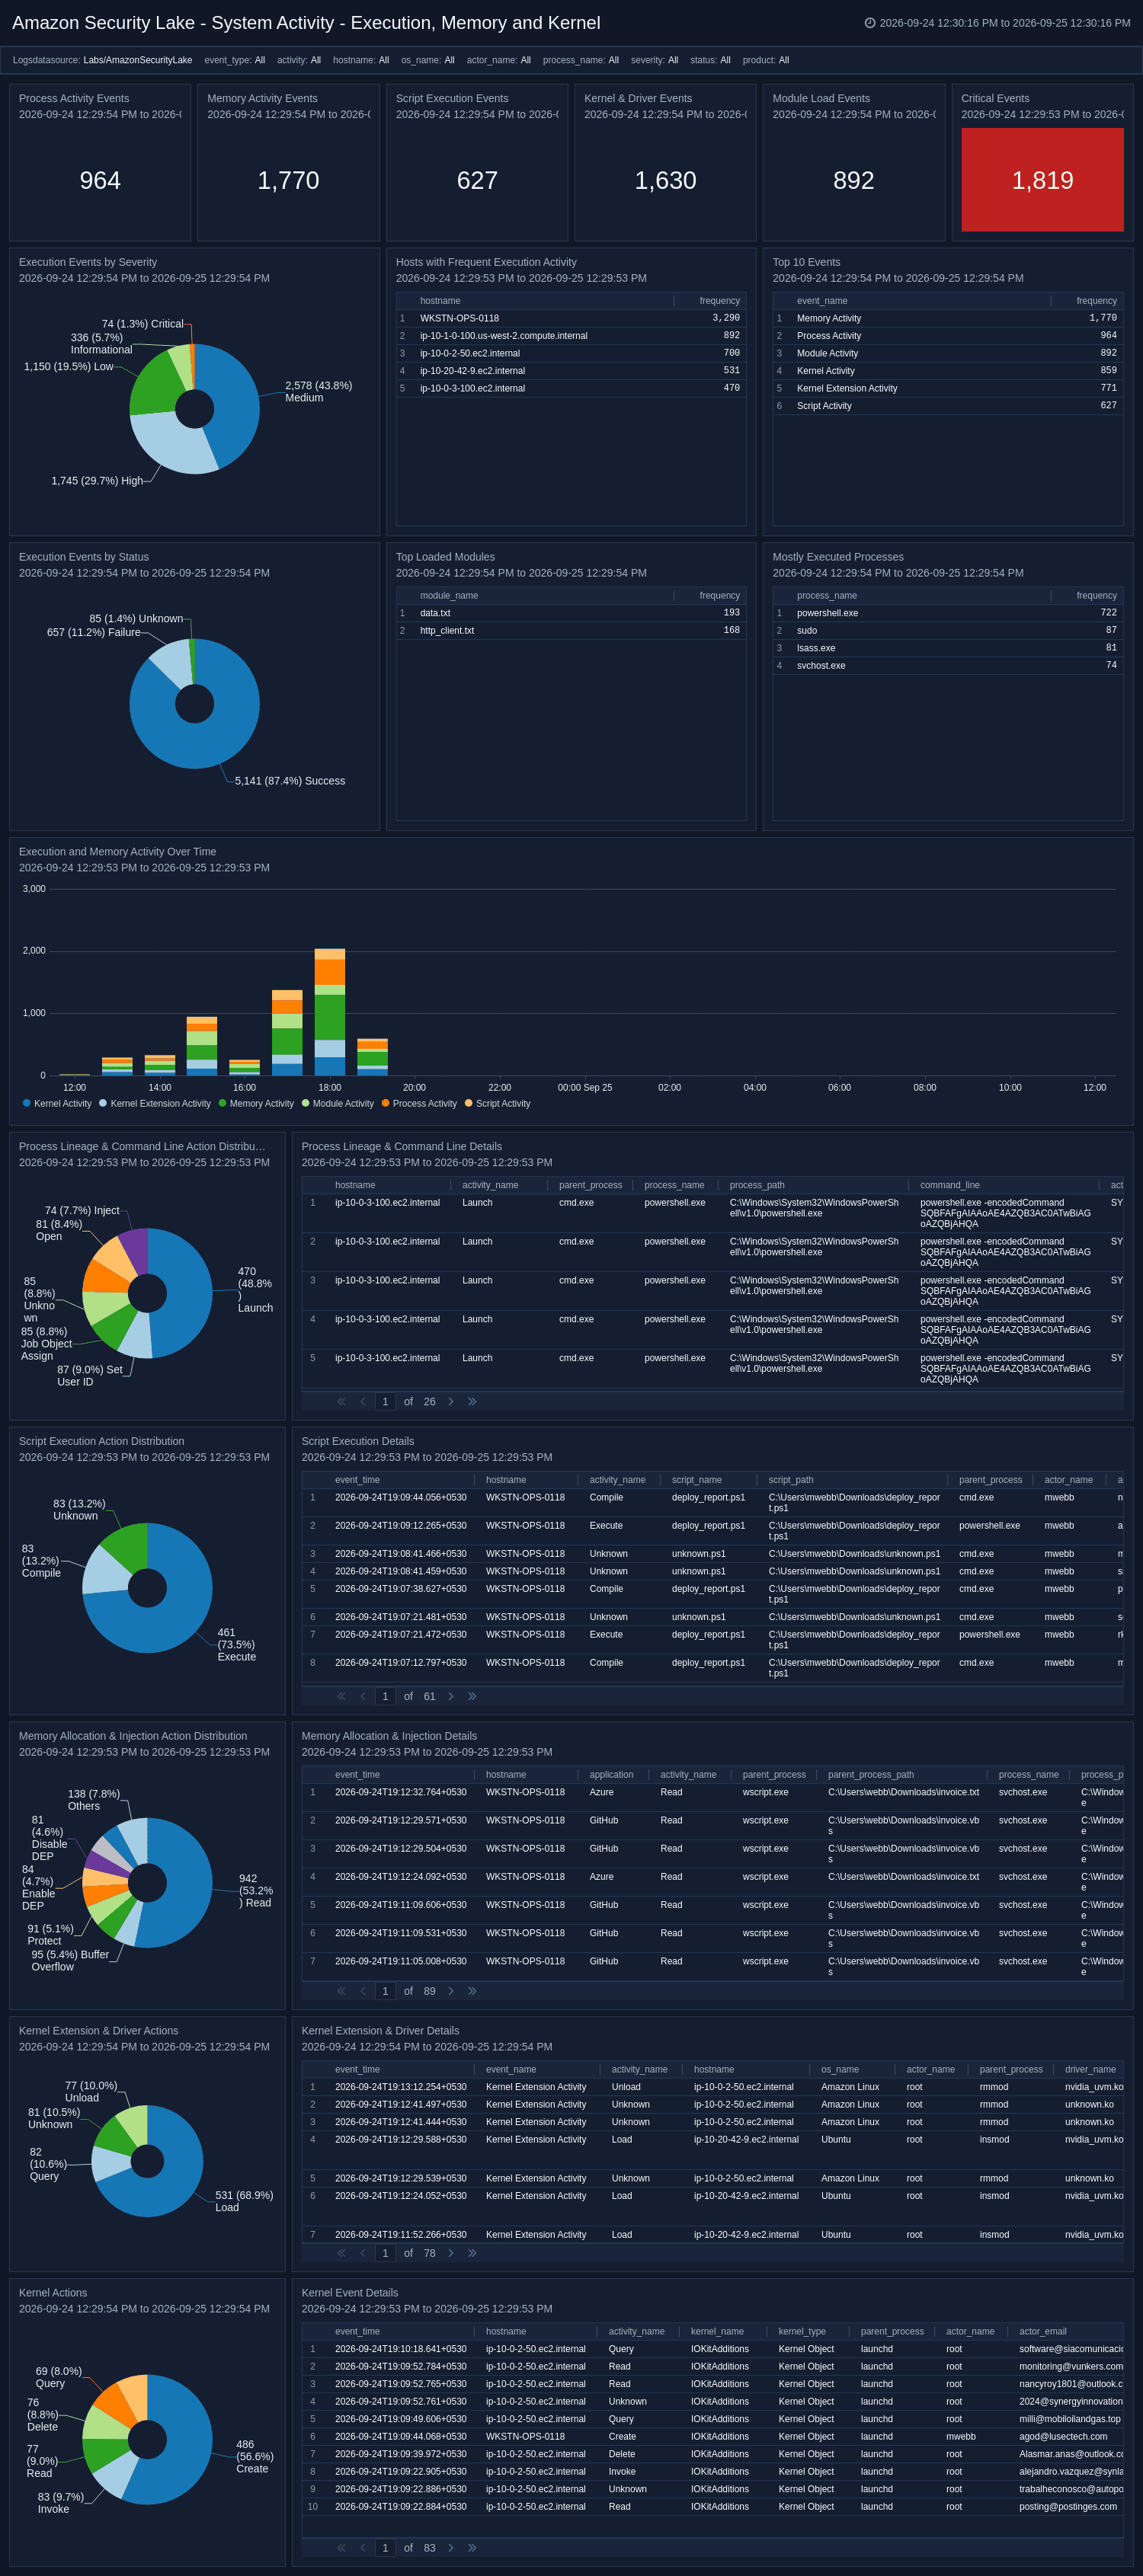
System Activity - Execution, Memory and Kernel
The System Activity - Execution, Memory & Kernel dashboard provides deep visibility into what is running on your monitored hosts, tracking process launches, command-line arguments, script execution, module and driver loads, kernel object operations, and memory activity such as remote allocation and injection. It identifies the most frequently executed processes, top loaded modules, and hosts with the highest execution activity. Dedicated panels surface process lineage, memory injection details, and kernel extension actions for advanced threat hunting.
System Activity - File, Persistence, Media and Audit
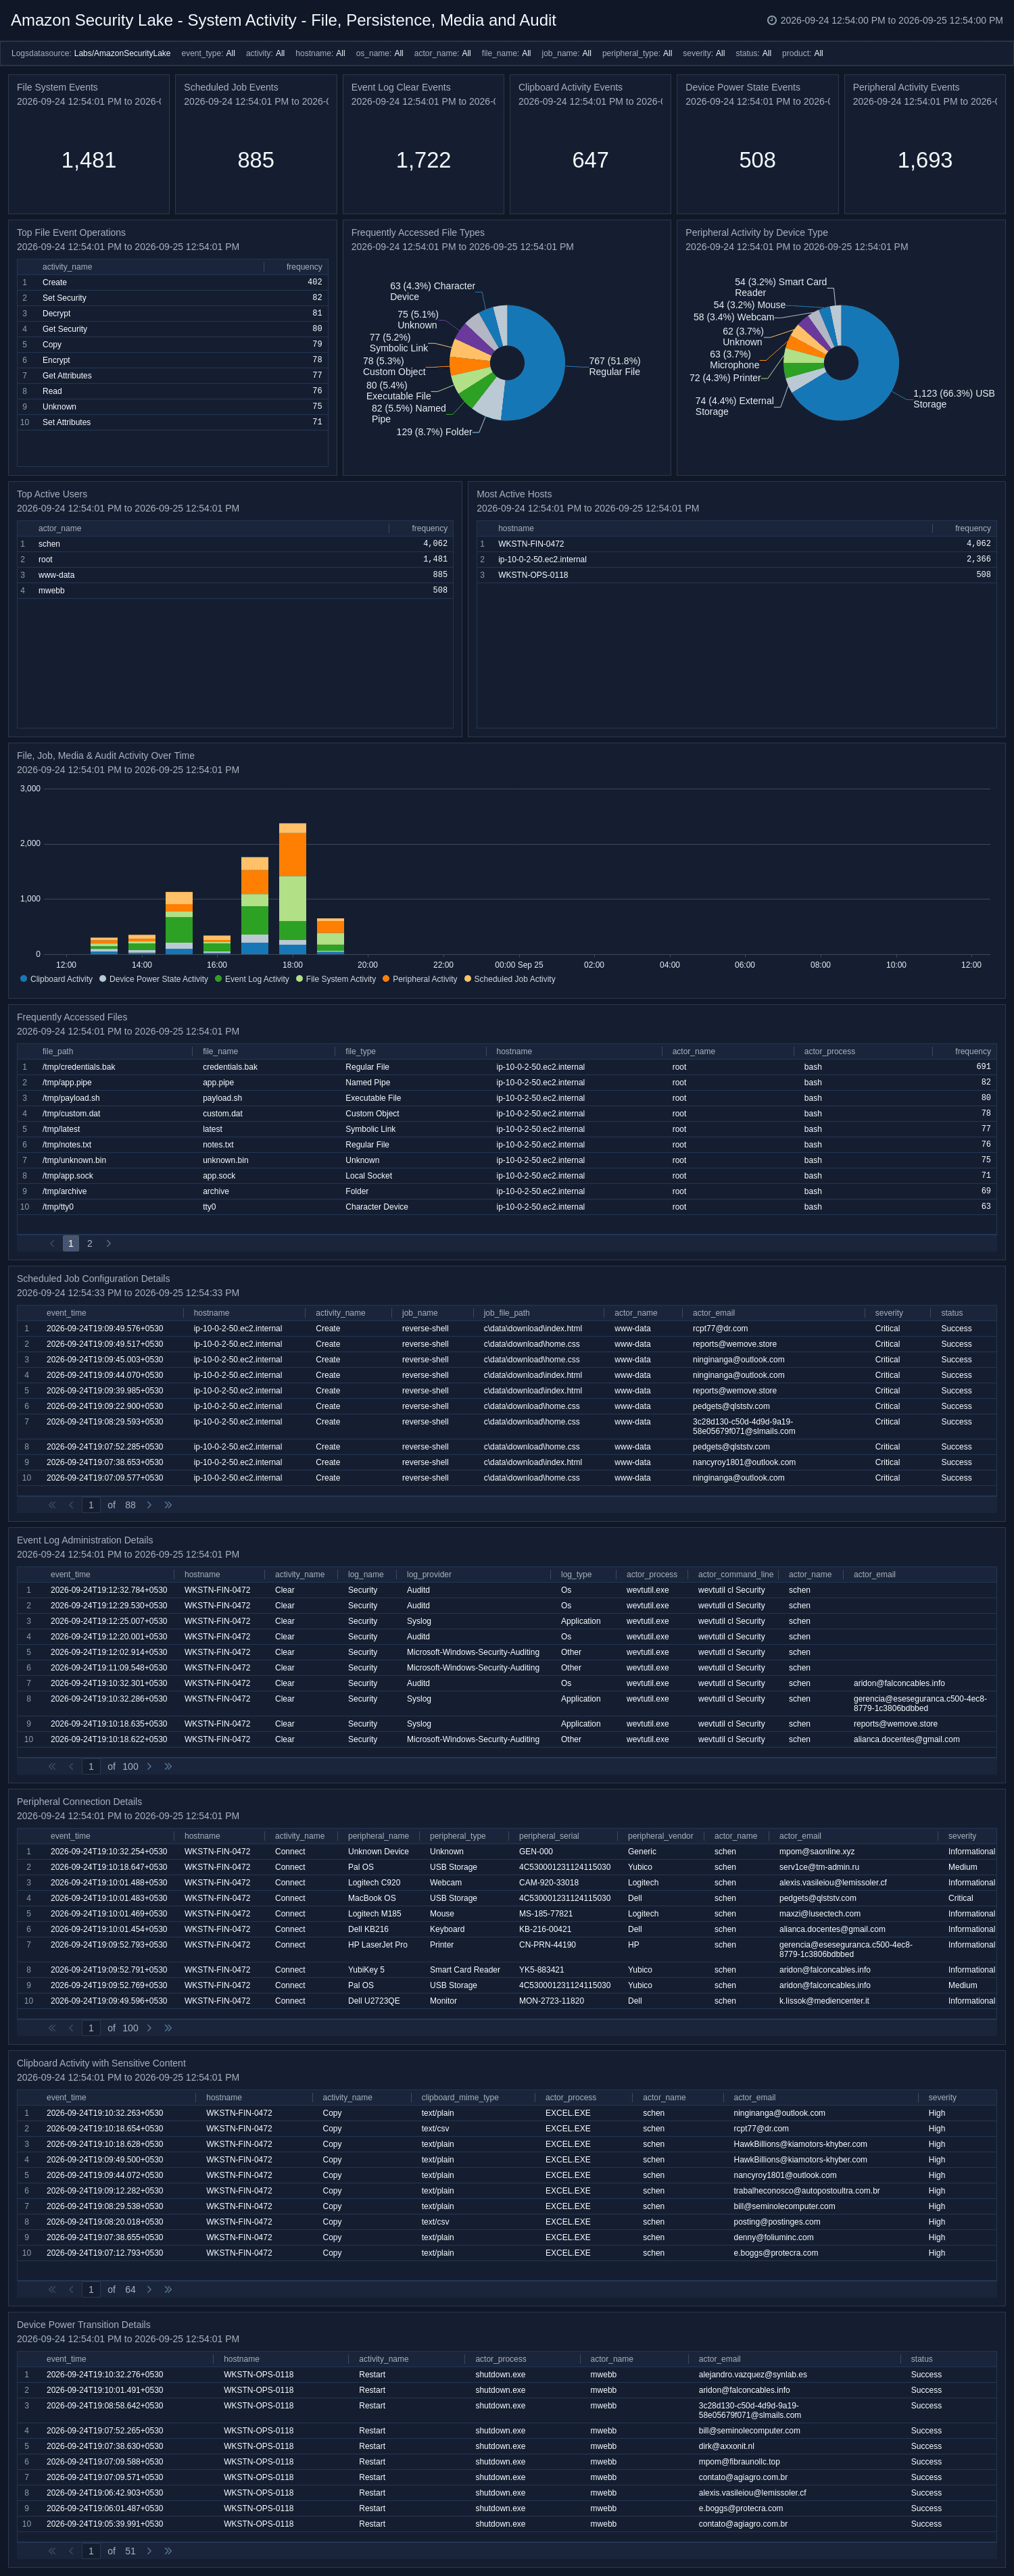
The System Activity - File, Persistence, Media & Audit dashboard monitors host activity that affects data integrity, persistence mechanisms, and audit trails. It tracks file system operations, scheduled job changes, event log clearing, peripheral and removable media use, clipboard activity, and device power state transitions. Dedicated panels surface frequently accessed file types, scheduled job configurations, and clipboard activity containing sensitive content, enabling detection of data theft and anti-forensic activity.
Create monitors for Amazon Security Lake app
From your App Catalog:
- From the Sumo Logic navigation, select App Catalog.
- In the Search Apps field, search for and then select your app.
- Make sure the app is installed.
- Navigate to What's Included tab and scroll down to the Monitors section.
- Click Create next to the pre-configured monitors. In the create monitors window, adjust the trigger conditions and notifications settings based on your requirements.
- Scroll down to Monitor Details.
- Under Location click on New Folder.
note
By default, monitor will be saved in the root folder. So to make the maintenance easier, create a new folder in the location of your choice.
- Enter Folder Name. Folder Description is optional.
tip
Using app version in the folder name will be helpful to determine the versioning for future updates.
- Click Create. Once the folder is created, click on Save.
Amazon Security Lake alerts
| Name | Description | Trigger Type (Critical / Warning / MissingData) | Alert Condition |
|---|---|---|---|
Amazon Security Lake - Application Error Event Detected | This alert is triggered when application error events are detected. Such errors may indicate underlying application failures, misconfigurations, or service disruptions that could impact system availability and security. | Critical | Count > 0 |
Amazon Security Lake - Confidential File Sharing Detected | This alert is triggered when confidential files are being shared. The activity may indicate potential data exposure or unauthorized sharing of sensitive information. | Critical | Count > 0 |
Amazon Security Lake - High or Critical Severity Application Installed | This alert is triggered when applications classified as High or Critical severity are installed. Such installations may introduce security risks and should be reviewed to verify that the software is authorized and safe. | Critical | Count > 0 |
Amazon Security Lake - Multiple Failed Logins From User | This alert is triggered when multiple failed login attempts from a single user are detected within a short period, helping identify potential brute-force attacks, account lockouts, or use of compromised credentials. | Critical | Count > 5 |
Amazon Security Lake - Confidential File Download Detected | This alert is triggered when frequently downloaded confidential files are identified. Unusual download activity may indicate unauthorized access or potential data exfiltration. | Critical | Count > 0 |
Amazon Security Lake - Repeated Authentication Failures Detected | This alert is triggered when a surge in authentication failures occurs across multiple user accounts. The activity may indicate a coordinated credential stuffing campaign, automated attack tooling, or a widespread access disruption affecting the organization. | Critical | Count > 5 |
Amazon Security Lake - Event from Embargoed Geo Location Detected | This alert is triggered when events originating from embargoed or restricted geographic locations are detected. Such activity may indicate a policy violation, unauthorized access, or attempts to bypass geographic access controls. | Critical | Count > 0 |
Amazon Security Lake - Critical Severity Event Detected | This alert is triggered when security events with Critical, High, or Fatal severity levels are detected in Amazon Security Lake data. These events may indicate significant security risks and should be reviewed promptly. | Critical | Count > 0 |
Upgrading/Downgrading the Amazon Security Lake app (Optional)
To update the app, do the following:
Next-Gen App: To install or update the app, you must be an account administrator or a user with Manage Apps, Manage Monitors, Manage Fields, Manage Metric Rules, and Manage Collectors capabilities depending upon the different content types part of the app.
- Select App Catalog.
- In the Search Apps field, search for and then select your app.
Optionally, you can identify apps that can be upgraded in the Upgrade available section. - To upgrade the app, select Upgrade from the Manage dropdown.
- If the upgrade does not have any configuration or property changes, you will be redirected to the Preview & Done section.
- If the upgrade has any configuration or property changes, you will be redirected to the Setup Data page.
- In the Configure section of your respective app, complete the following fields.
- Field Name. If you already have collectors and sources set up, select the configured metadata field name (eg _sourcecategory) or specify other custom metadata (eg: _collector) along with its metadata Field Value.
- Click Next. You will be redirected to the Preview & Done section.
Post-update
Your upgraded app will be installed in the Installed Apps folder and dashboard panels will start to fill automatically.
See our Release Notes changelog for new updates in the app.
To revert the app to a previous version, do the following:
- Select App Catalog.
- In the Search Apps field, search for and then select your app.
- To version down the app, select Revert to < previous version of your app > from the Manage dropdown.
Uninstalling the Amazon Security Lake app (Optional)
To uninstall the app, do the following:
- Select App Catalog.
- In the 🔎 Search Apps field, run a search for your desired app, then select it.
- Click Uninstall.