 Meet the new
 AWS Application Load Balancer
The AWS Application Load Balancer functions at the application layer, receives requests, evaluates the listener rules in priority order to determine which rule to apply, and then selects a target from the target group.
The Sumo Logic app for AWS Application Load Balancing uses logs and metrics to give you visibility into the health of your Application Load Balancer and target groups. Use the pre-configured dashboards to understand the latency, request and host status, threat intel, and HTTP backend codes by availability zone and target group.
Log and metric types
The Sumo Logic app for AWS Application Load Balancer uses the following logs and metrics:
- AWS Application Load Balancer CloudTrail Logs
- The Application Load Balancer Access Logs introduces two new fields in addition to the fields contained in the Classic ELB Access log:
Type. This is the type of request or connection (HTTP, HTTPS, H2, ws, wss).target_group_arn. This is the Amazon Resource Name (ARN) of the target group. The logs are stored in a .gzip format in the specified S3 bucket and contain these fields in this order:
The log format is described in AWS Application Load Balancer Access Log Collection.timestamp, elb, client:port, target:port, \request_processing_time, target_processing_time, \response_processing_time, elb_status_code, \target_status_code, received_bytes, sent_bytes, \request, user_agent, ssl_cipher, ssl_protocol, \target_group_arn, trace_id - AWS Application Load Balancer CloudWatch Metrics. The metrics are included in the AWS/Application ELB namespace. For more details, see here.
Sample log messages
https 2017-11-20T22:05:36 long-bill-lb 77.222.19.149:41148 10.168.203.134:23662 0.000201 0.401924 0.772005 500 200 262 455 "GET https://elmagek.no-ip.org:443/json/v1/collector/histogram/100105037?startTimestamp=1405571270000&endTimestamp=1405574870000&bucketCount=60&_=1405574870206 HTTP/1.1" "Mozilla/5.0 (Macintosh; U; Intel Mac OS X 10.5; en-US; rv:1.9.0.4) Gecko/2008102920 Firefox/3.0.4" DH-RSA-AES256-GCM-SHA384 TLSv1.2 arn:aws:elasticloadbalancing:us-west-2:104030218370:targetgroup/Prod-frontend/92e3199b1rc814fe9 "Root=1-58337364-23a8c76965a2ef7629b185e134"
Sample queries
account="account" region="region" namespace="AWS/ApplicationELB"
| parse "* * * * * * * * * * * * \"*\" \"*\" * * * \"*\"" as Type, DateTime, loadbalancer, Client, Target, RequestProcessingTime, TargetProcessingTime, ResponseProcessingTime, ElbStatusCode, TargetStatusCode, ReceivedBytes, SentBytes, Request, UserAgent, SslCipher, SslProtocol, TargetGroupArn, TraceId
| where tolowercase(loadbalancer) matches tolowercase("{{loadbalancer}}")
| parse field=Request "* *://*:*/* HTTP" as Method, Protocol, Domain, ServerPort, URI nodrop
| parse field=TargetGroupArn "arn:aws:elasticloadbalancing:*:*:*" as AwsRegion, AccountId, TargetGroup nodrop
| if (TargetStatusCode matches "5*",1,0) as Target_5XX
| if (TargetStatusCode matches "4*",1,0) as Target_4XX
| if (TargetStatusCode matches "3*",1,0) as Target_3XX
| if (TargetStatusCode matches "2*",1,0) as Target_2XX
| sum(Target_5XX) as Target_5XX, sum(Target_4XX) as Target_4XX, sum(Target_3XX) as Target_3XX, sum(Target_2XX) as Target_2XX by loadbalancer, TargetGroup, Domain, URI
| limit 20
| sort by Target_5XX, Target_4XX, Target_3XX, Target_2XX
account="account" region="region" Namespace="AWS/ApplicationELB" loadbalancer="loadbalancer" AvailabilityZone=* TargetGroup=* metric=HTTPCode_Target_5XX_Count Statistic=Sum | parse field= TargetGroup */* as Unused, TargetGroup | sum by account, region, namespace, loadbalancer, TargetGroup, AvailabilityZone
Collecting logs and metrics for AWS Application Load Balancer
Configure Hosted Collector
When you create an AWS Source, you'll need to identify the Hosted Collector you want to use or create a new Hosted Collector. Once you create an AWS Source, associate it with a Hosted Collector. For instructions, see Configure a Hosted Collector and Source.
Collect AWS Application Load Balancer CloudWatch metrics
Sumo Logic supports collecting metrics using one of the following source types:
-
Configure an AWS Kinesis Firehose for Metrics Source (recommended)
-
Configure an Amazon CloudWatch Source for Metrics
noteNamespace for AWS Application Load Balancer service is AWS/ApplicationELB.
Follow the steps below to add custom metadata fields with your metrics:
- Click +Add Field under Metadata. Each field consists of a name (key) and a corresponding value.
- Create a field named
accountand assign it a value that represents a friendly name or alias to your AWS account from which metrics are collected. This value will appear in the AWS Observability view, and metrics can be queried using theaccountfield.
- After adding fields, check their status indicators:
 A green check mark indicates the field exists and is enabled in the Fields table schema.
 An orange exclamation icon indicates the field does not exist or is disabled in the schema.
- You will have the option to automatically add or enable the field.
- If a field is sent but not present or enabled in the schema, it is ignored and marked as Dropped.
Collect AWS Application Load Balancer Access logs
Prerequisites
Before you begin to use the AWS Elastic Load Balancing (ELB) Application app, complete the following steps:
- Grant Sumo Logic access to an Amazon S3 bucket.
- Enable Application Load Balancer logging in AWS.
- Confirm that logs are being delivered to the Amazon S3 bucket.
Follow the steps below to collect access logs for AWS Application Load Balancer:
- Configure the Access Logs Source.
- Add custom metadata fields with your logs:
- Click +Add Field under Metadata. Each field consists of a name (key) and a corresponding value.
- Create a field named
accountand assign it a value that represents a friendly name or alias to your AWS account from which logs are collected. This value will appear in the AWS Observability view, and logs can be queried using theaccountfield. - After adding fields, check their status indicators:
- A green check mark indicates the field exists and is enabled in the Fields table schema.
- An orange exclamation icon indicates the field does not exist or is disabled in the schema.
- You will have the option to automatically add or enable the field.
- If a field is sent but not present or enabled in the schema, it is ignored and marked as Dropped.
Collect AWS Application Load Balancer CloudTrail logs
Prerequisites
- Grant Sumo Logic access to an Amazon S3 bucket.
- Create a trail for your AWS account.
- Confirm that logs are being delivered to the Amazon S3 bucket.
Namespace for AWS Application Load Balancer service is AWS/ApplicationELB.
Follow the steps below to collect logs for AWS Application Load Balancer:
- Configure a CloudTrail Logs Source.
- Add custom metadata fields with your logs:
- Click +Add Field under Metadata. Each field consists of a name (key) and a corresponding value.
- Create a field named
accountand assign it a value that represents a friendly name or alias to your AWS account from which logs are collected. This value will appear in the AWS Observability view, and logs can be queried using theaccountfield. - After adding fields, check their status indicators:
- A green check mark indicates the field exists and is enabled in the Fields table schema.
- An orange exclamation icon indicates the field does not exist or is disabled in the schema.
- You will have the option to automatically add or enable the field.
- If a field is sent but not present or enabled in the schema, it is ignored and marked as Dropped.
Centralized AWS CloudTrail log collection
In case you have a centralized collection of CloudTrail logs and are ingesting them from all accounts into a single Sumo Logic CloudTrail log source, create the following field extraction rule to map proper AWS account(s) friendly name/alias. You'll need to create it if not already present or update it as required.
Rule Name: AWS Accounts
Applied at: Ingest Time
Scope (Specific Data):
=aws/observability/cloudtrail/logs
Parse Expression
Enter a parse expression to create an account field that maps to the alias you set for each sub account. For example, if you used the dev alias for an AWS account with ID 528560886094 and the prod alias for an AWS account with ID 567680881046, your parse expression would look like this:
| json "recipientAccountId"
// Manually map your aws account id with the AWS account alias you setup earlier for individual child account
| "" as account
| if (recipientAccountId = "528560886094",  "dev", account) as account
| if (recipientAccountId = "567680881046",  "prod", account) as account
| fields account
Installing the AWS Application Load Balancer app
Now that you have set up collection for AWS Application Load Balancer, install the Sumo Logic App to use the pre-configured searches and dashboards that provide visibility into your environment for real-time analysis of overall usage.
To install the app:
- Select App Catalog.
- In the Search Apps field, search for and then select your app.
- Optionally, you can scroll down to preview the dashboards included with the app. Then, click Install App (sometimes this button says Add Integration).
- Click Next.
- Look for the dialog confirming that your app was installed successfully.

Once an app is installed, it will appear in your Personal folder or the folder that you specified. From here, you can share it with other users in your organization. Dashboard panels will automatically start to fill with data matching the time range query received since you created the panel. Results won't be available immediately, but within about 20 minutes, you'll see completed graphs and maps.
As part of the app installation process, the following content will be created by default along with dashboards and monitor template:
Fields
accountName / alias to the AWS account.accountidAWS account id.regionThe region to which the resource name belongs to.namespaceNamespace for AWS Application Load Balancer Service is AWS/ApplicationELB.loadbalancerApplication Load Balancer name.
Field Extraction Rule(s)
The FER AwsObservabilityALBAccessLogsFER to extract fields loadbalancer and namespace from access logs will be created as a part of app installation.
The FER AwsObservabilityALBCloudTrailLogsFER to extract fields accountid, namespace, region, and loadbalancer from CloudTrail logs will be created as a part of app installation.
As a best practice, do not delete or modify any fields, Field Extraction Rules (FERs), or Metric Rules created during the app installation. If you need to make updates, contact the Sumo Logic Support team.
Viewing AWS Application Load Balancer dashboards
We highly recommend you view these dashboards in the AWS Observability view of the AWS Observability solution.
Overview
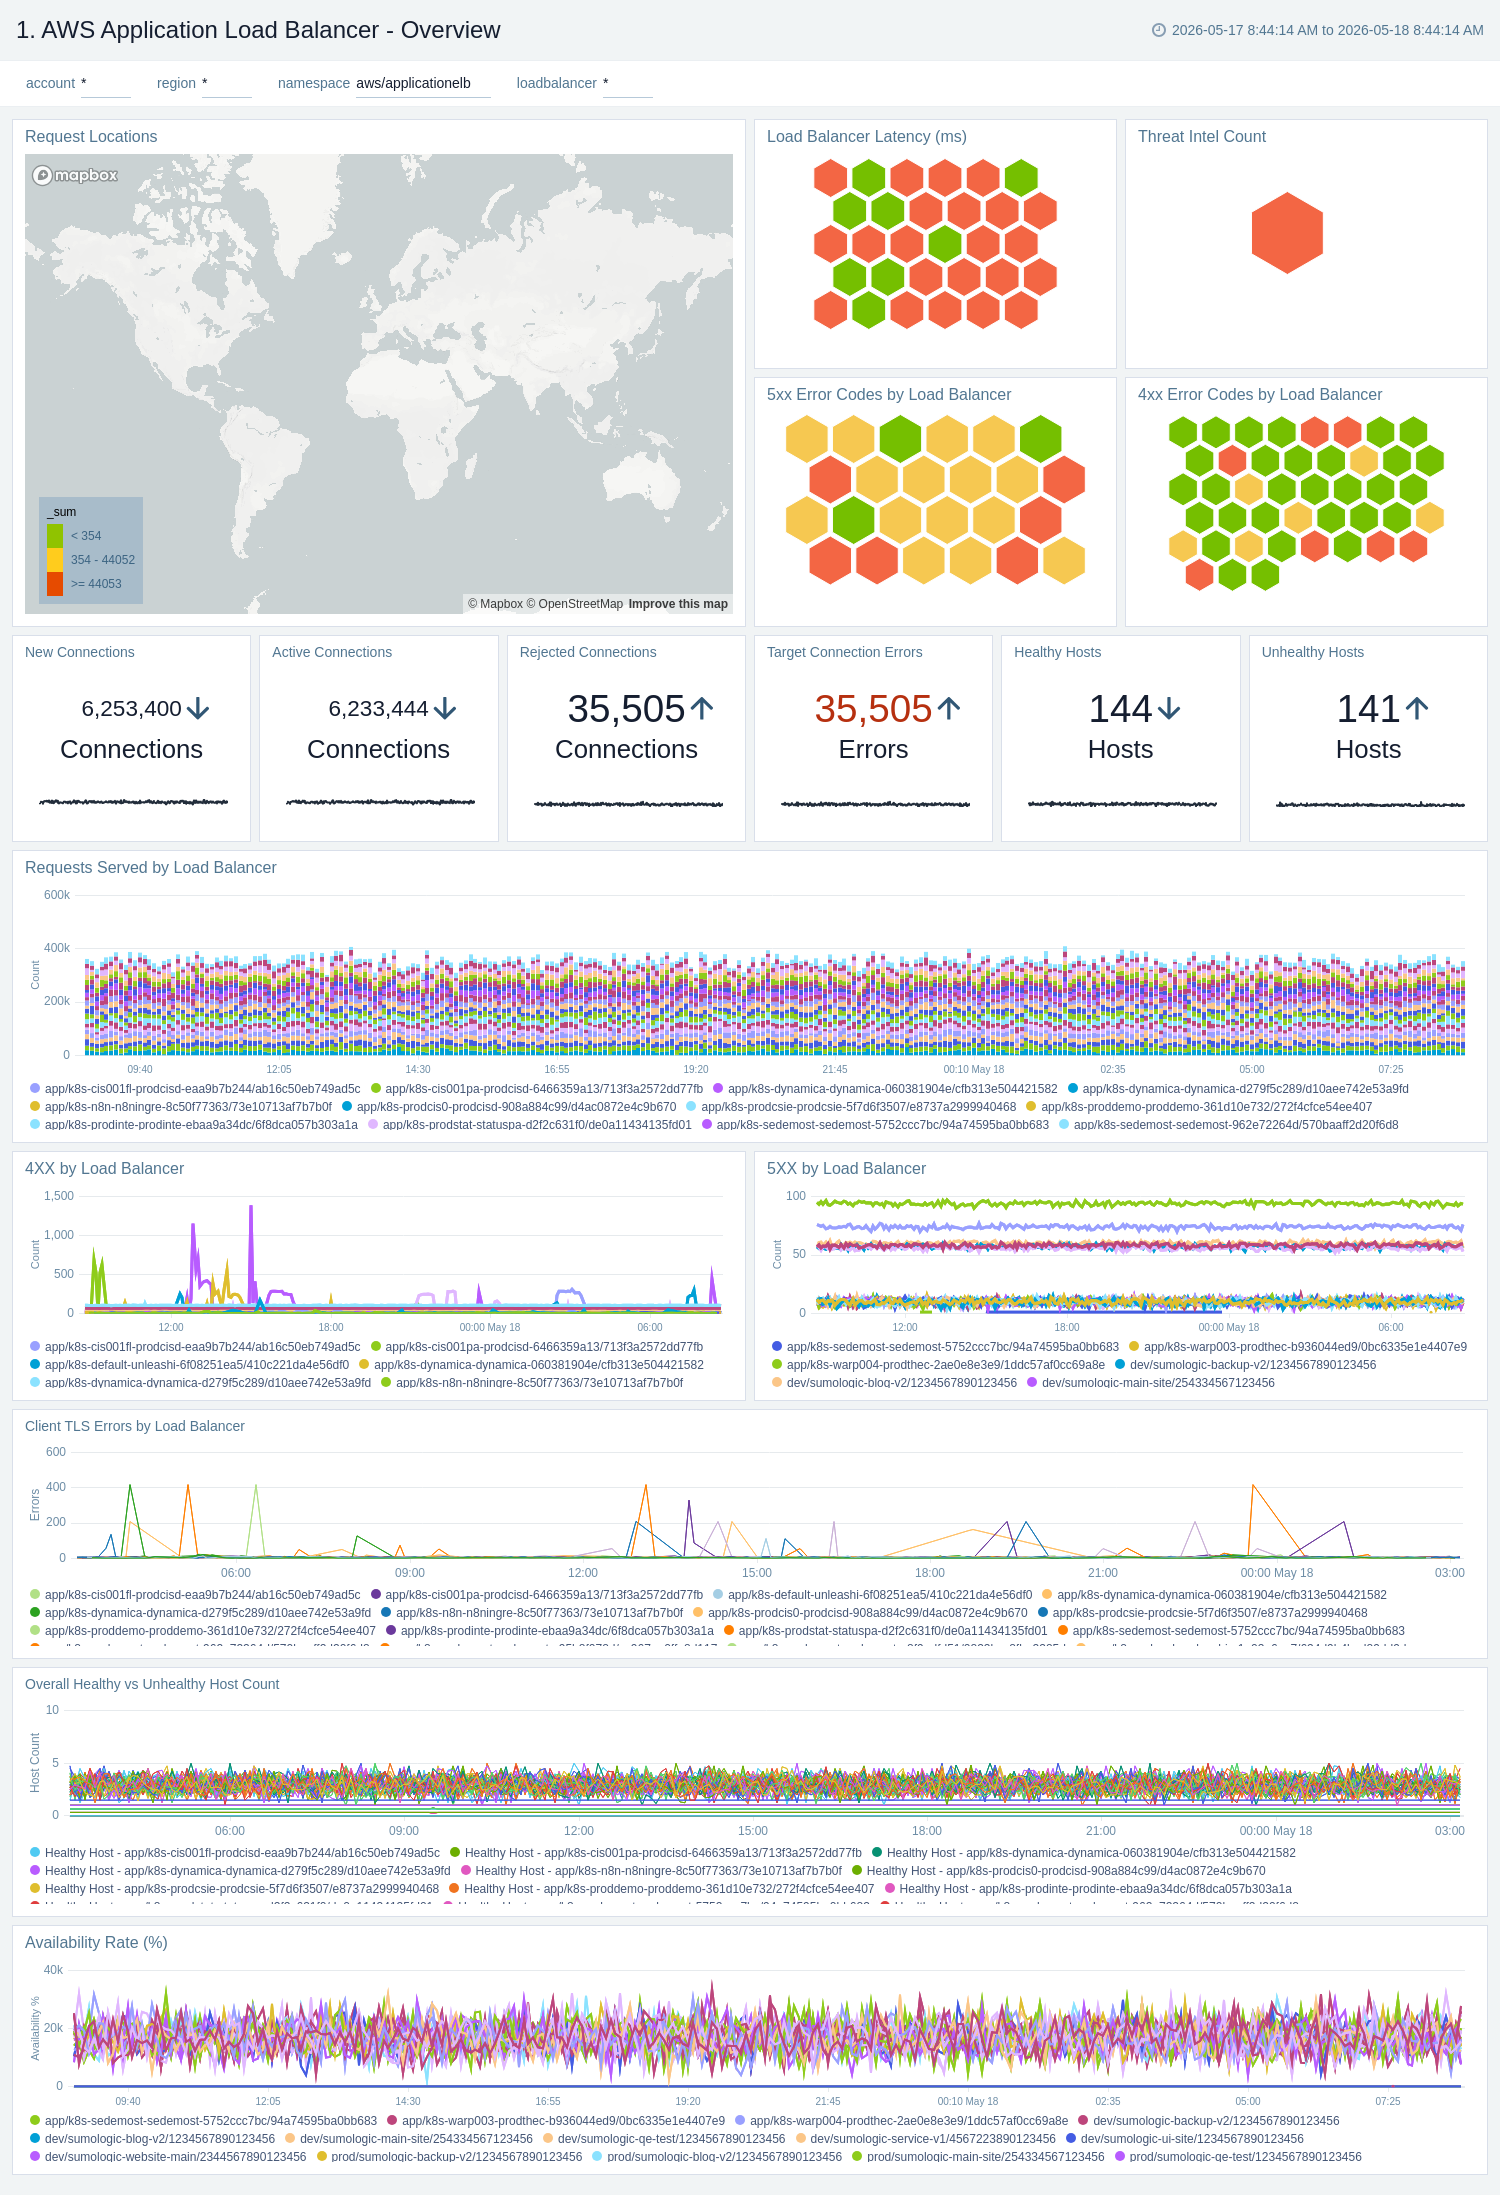
The AWS Application Load Balancer - Overview dashboard provides visibility into the health of your Application Load Balancer and target groups, with at-a-glance views of latency, request and host status, requests from malicious sources, and HTTP backend codes.
Use this dashboard to:
- Monitor requests to each load balancer to ensure the load is being distributed as desired.
- Quickly identify healthy and unhealthy hosts.
- Monitor trends for load balancers errors, 4XX, and 5XX errors, as well as healthy and unhealthy hosts.
- Monitor the current state across all load balancers through active connections, new connections, target connection errors, and rejected connections.
Response Analysis
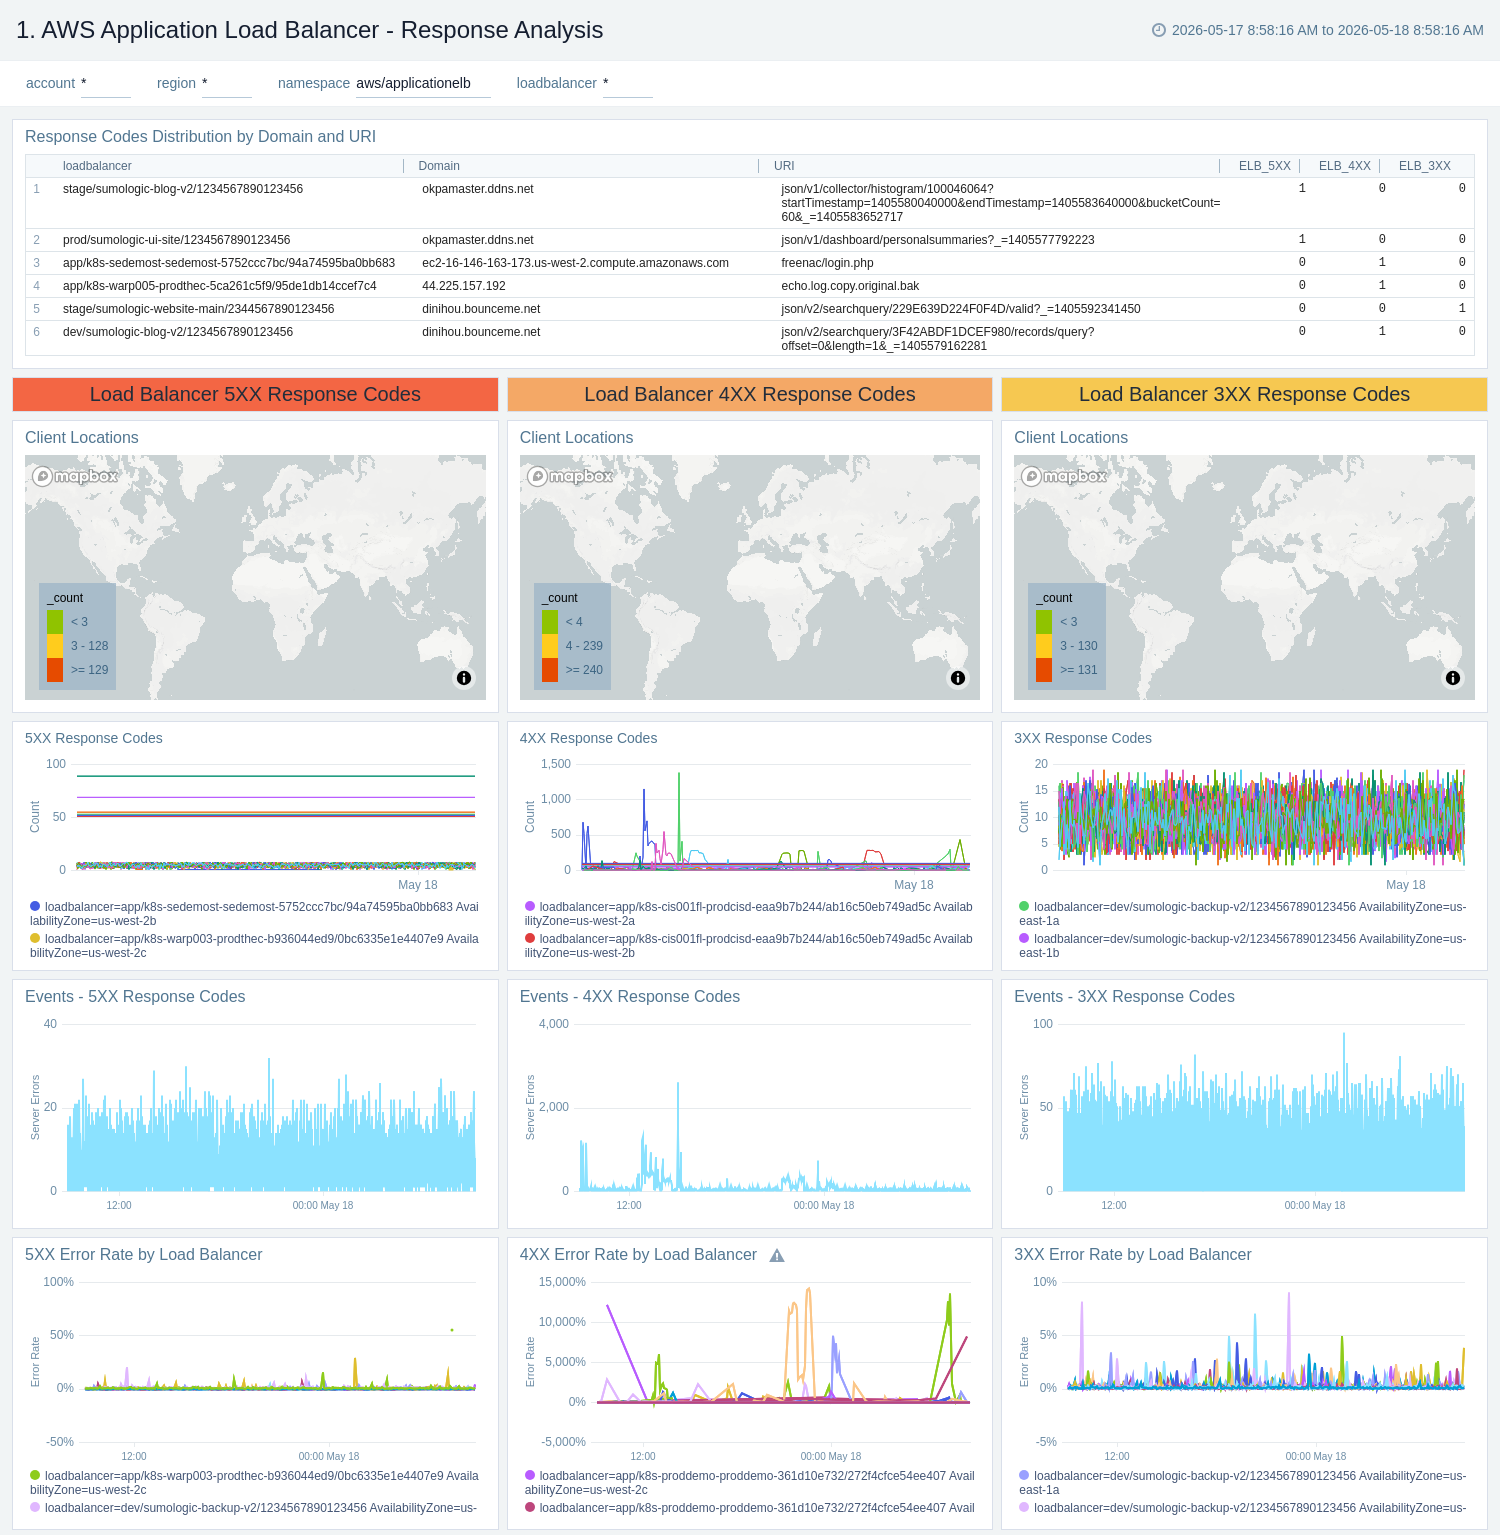
The AWS Application Load Balancer - Response Analysis dashboard provides insights into how your load balancers are responding to clients.
Use this dashboard to:
- Monitor incoming client locations for all 5XX, 4XX, and 3XX error responses.
- Quickly correlate error responses using load balancer access logs and AWS CloudWatch metrics to determine the possible cause for failures and decide corrective actions.
Target Group Response Analysis
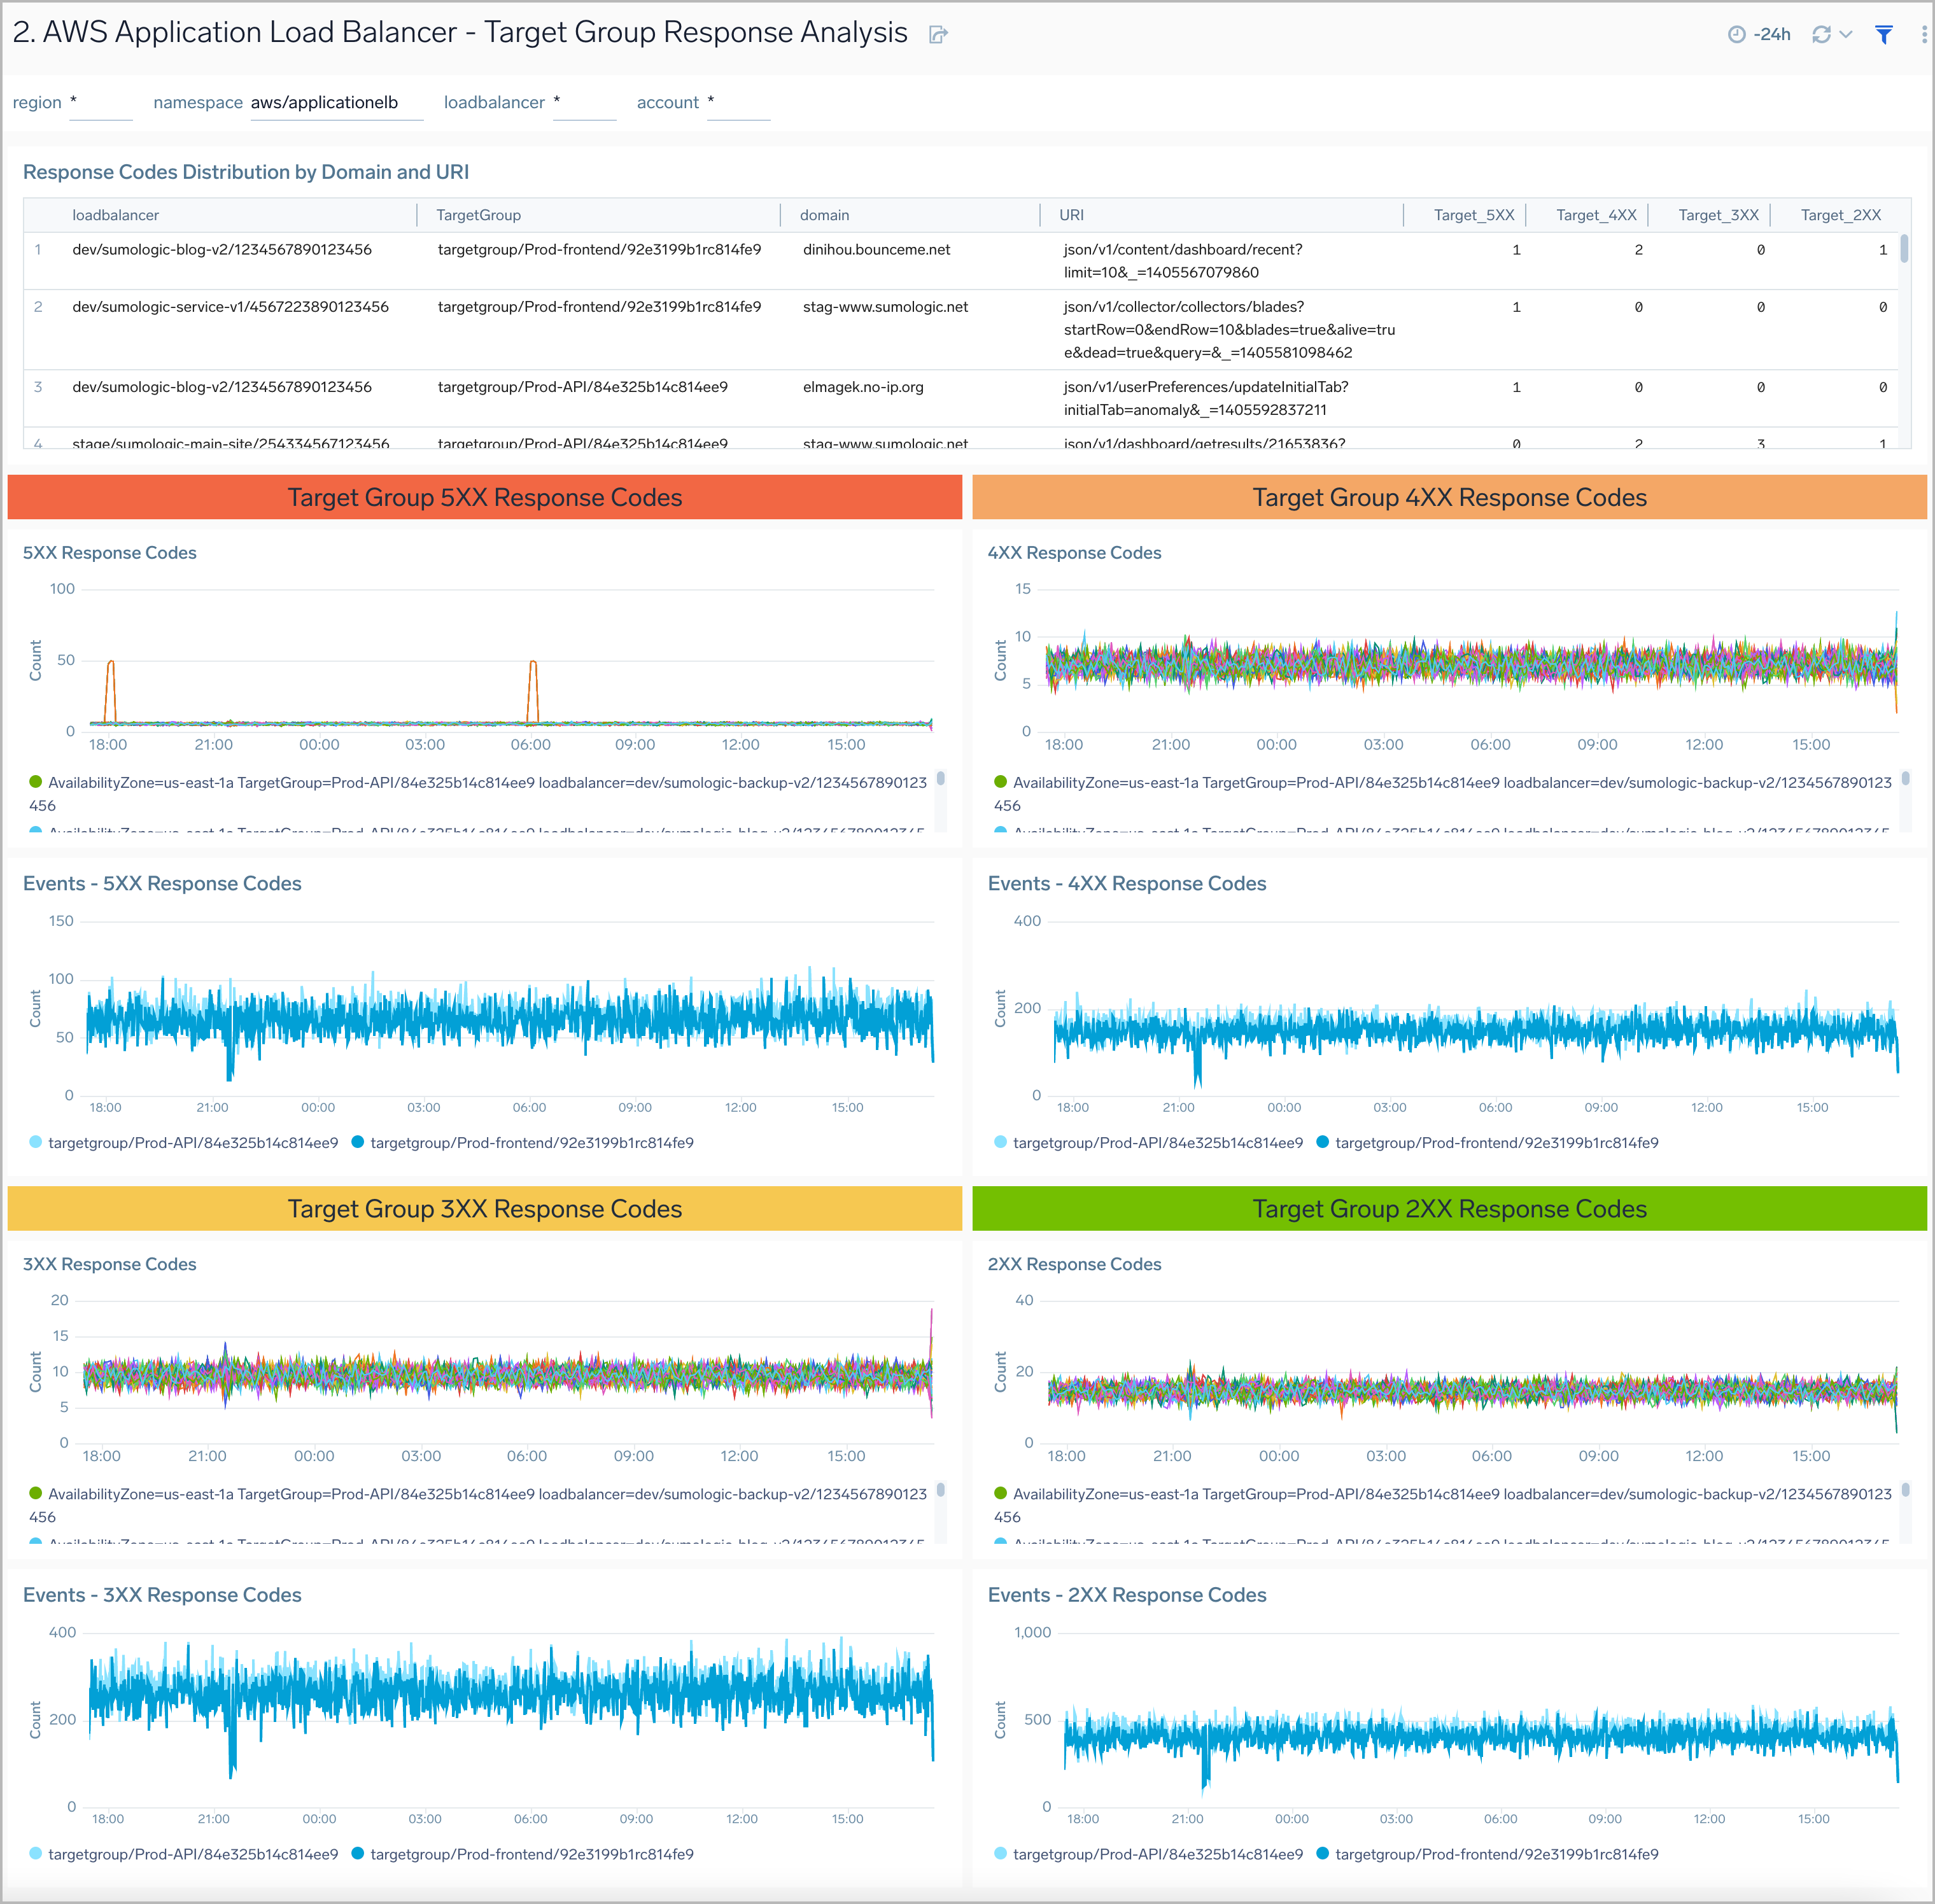
The AWS Application Load Balancer - Target Group Response Analysis dashboard provides insights into how various target groups are responding to client requests.
Use this dashboard to:
- Monitor trends of all response codes for your target groups by LoadBalancer, Target Group, and availability zones.
- Correlate response code trends across load balancer access logs and CloudWatch metrics to determine the root cause for failures.
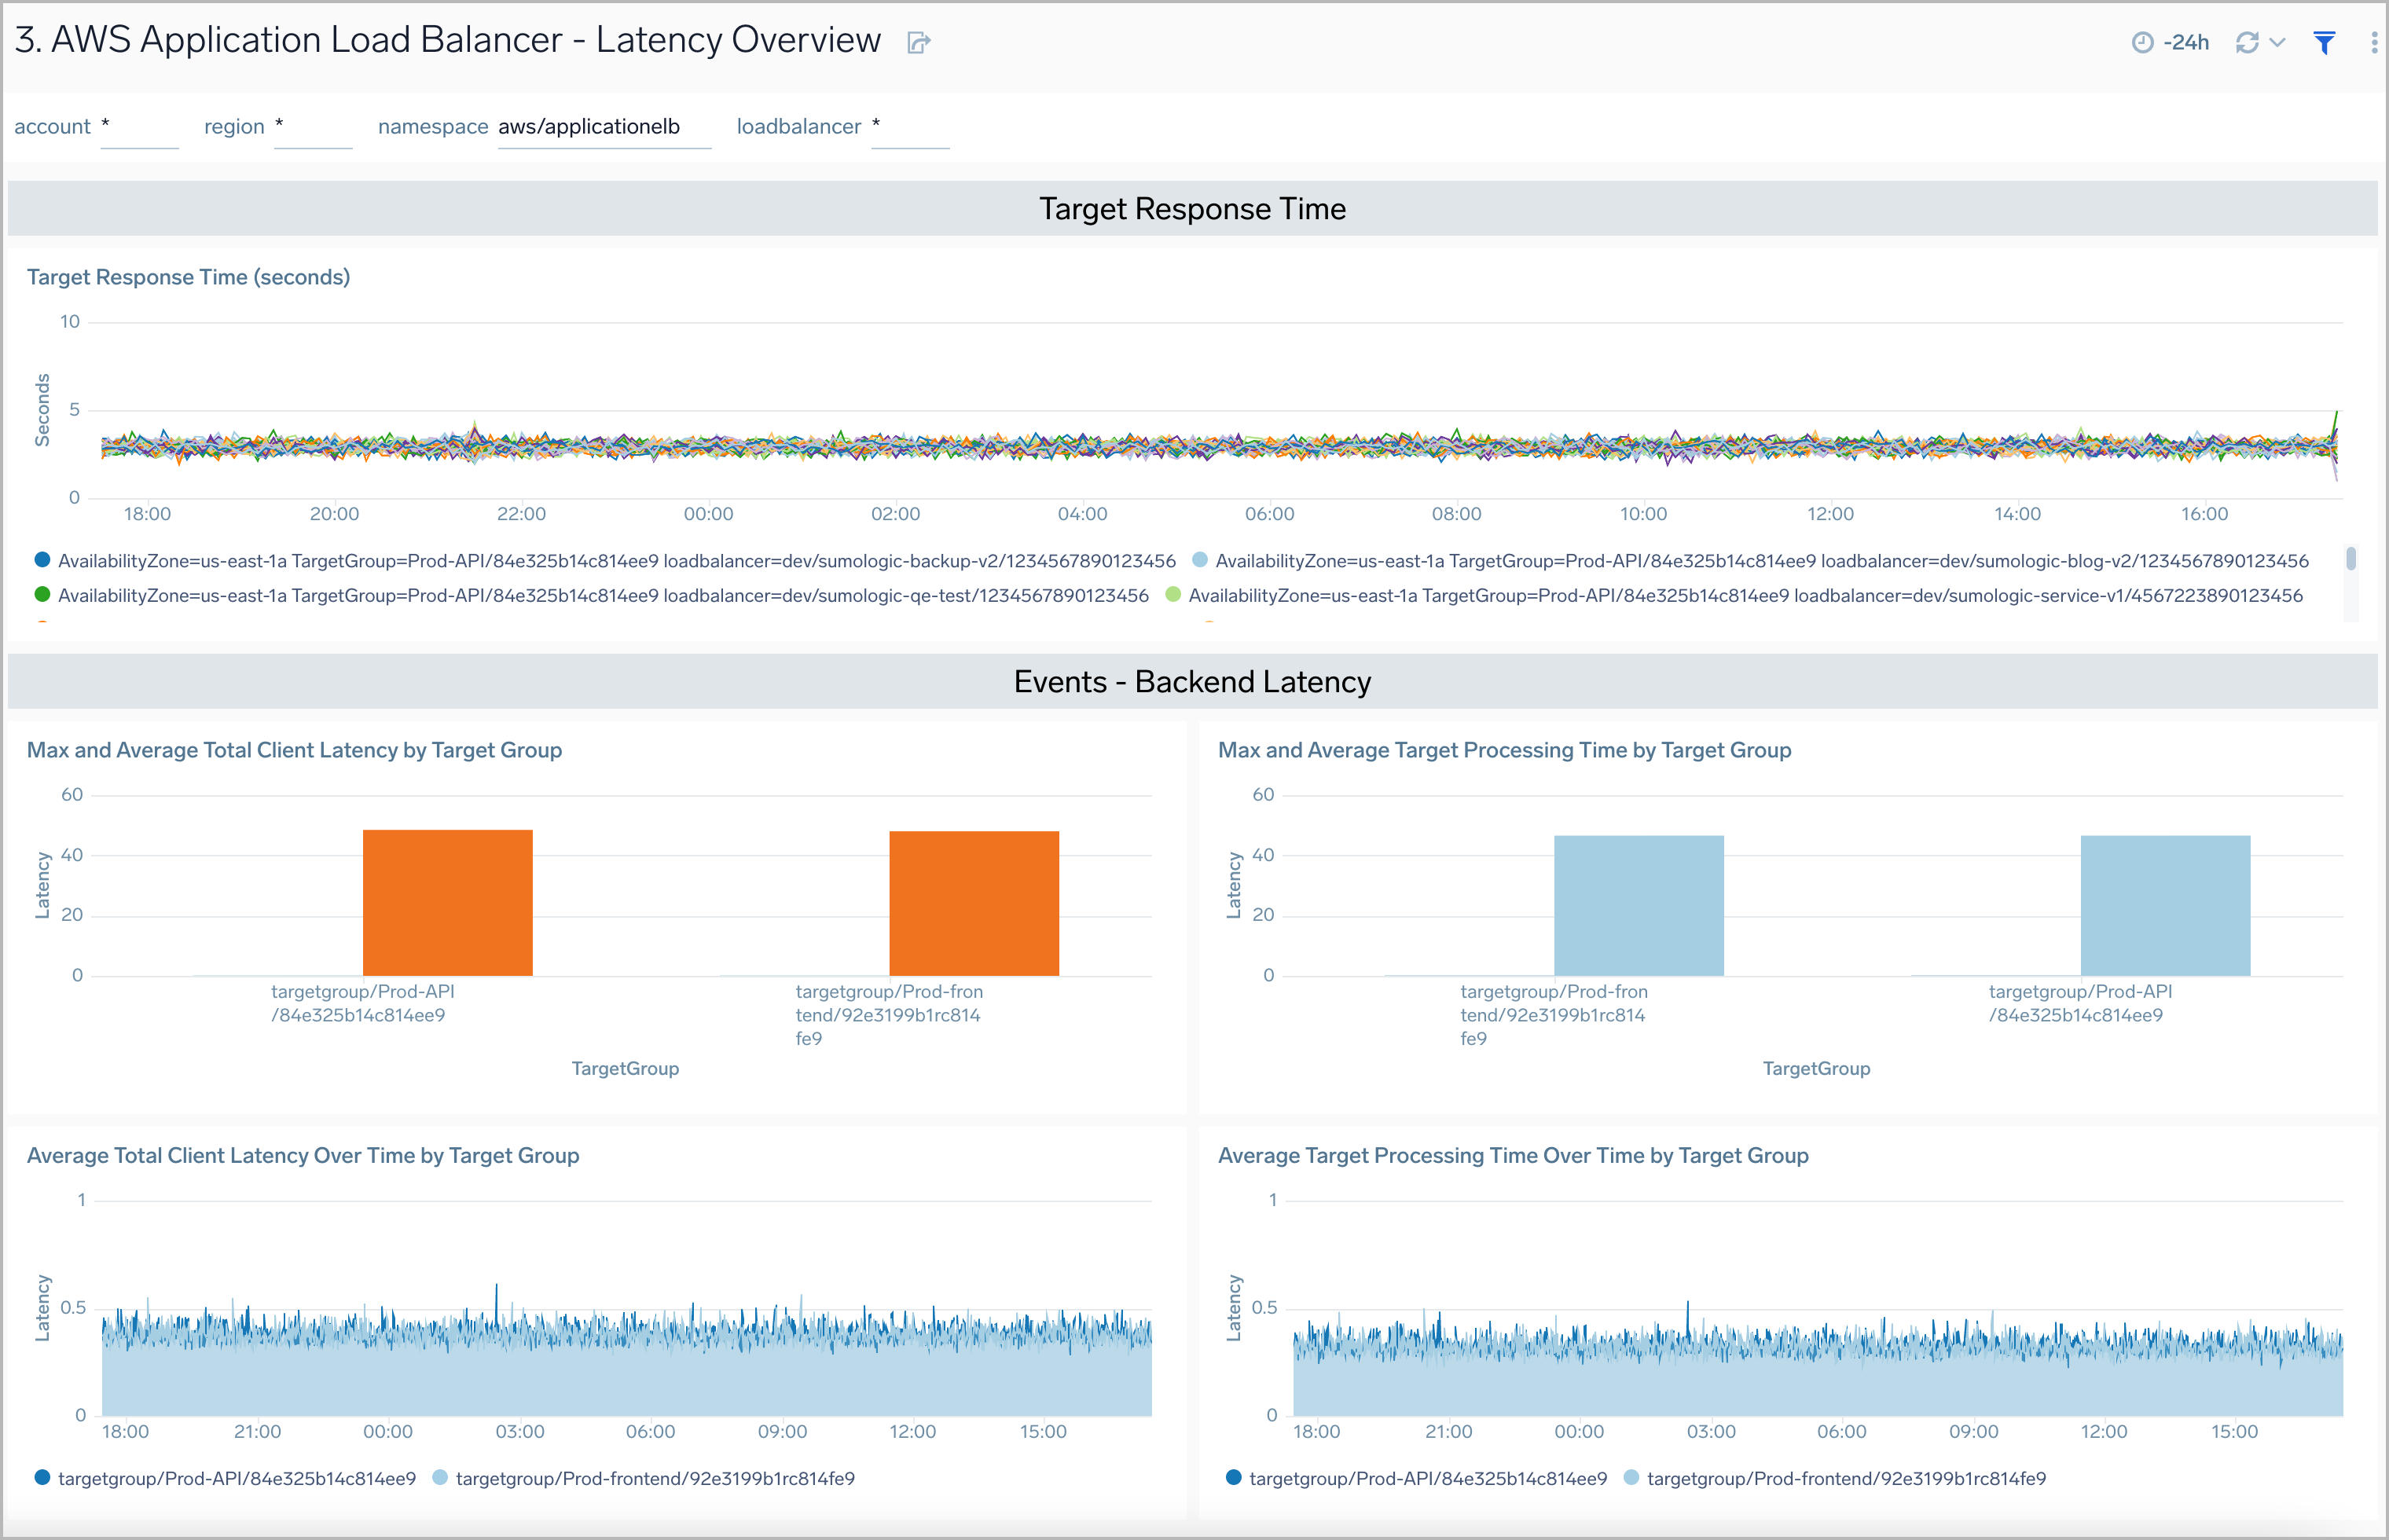
Latency Overview
The AWS Application Load Balancer - Latency Overview dashboard provides insights into response times for load balancers, target groups, and availability zones, including backend log response times.
Use this dashboard to:
- Monitor response times by load balancer, target group, and availability zone.
- Monitor client latency and processing times for target groups.
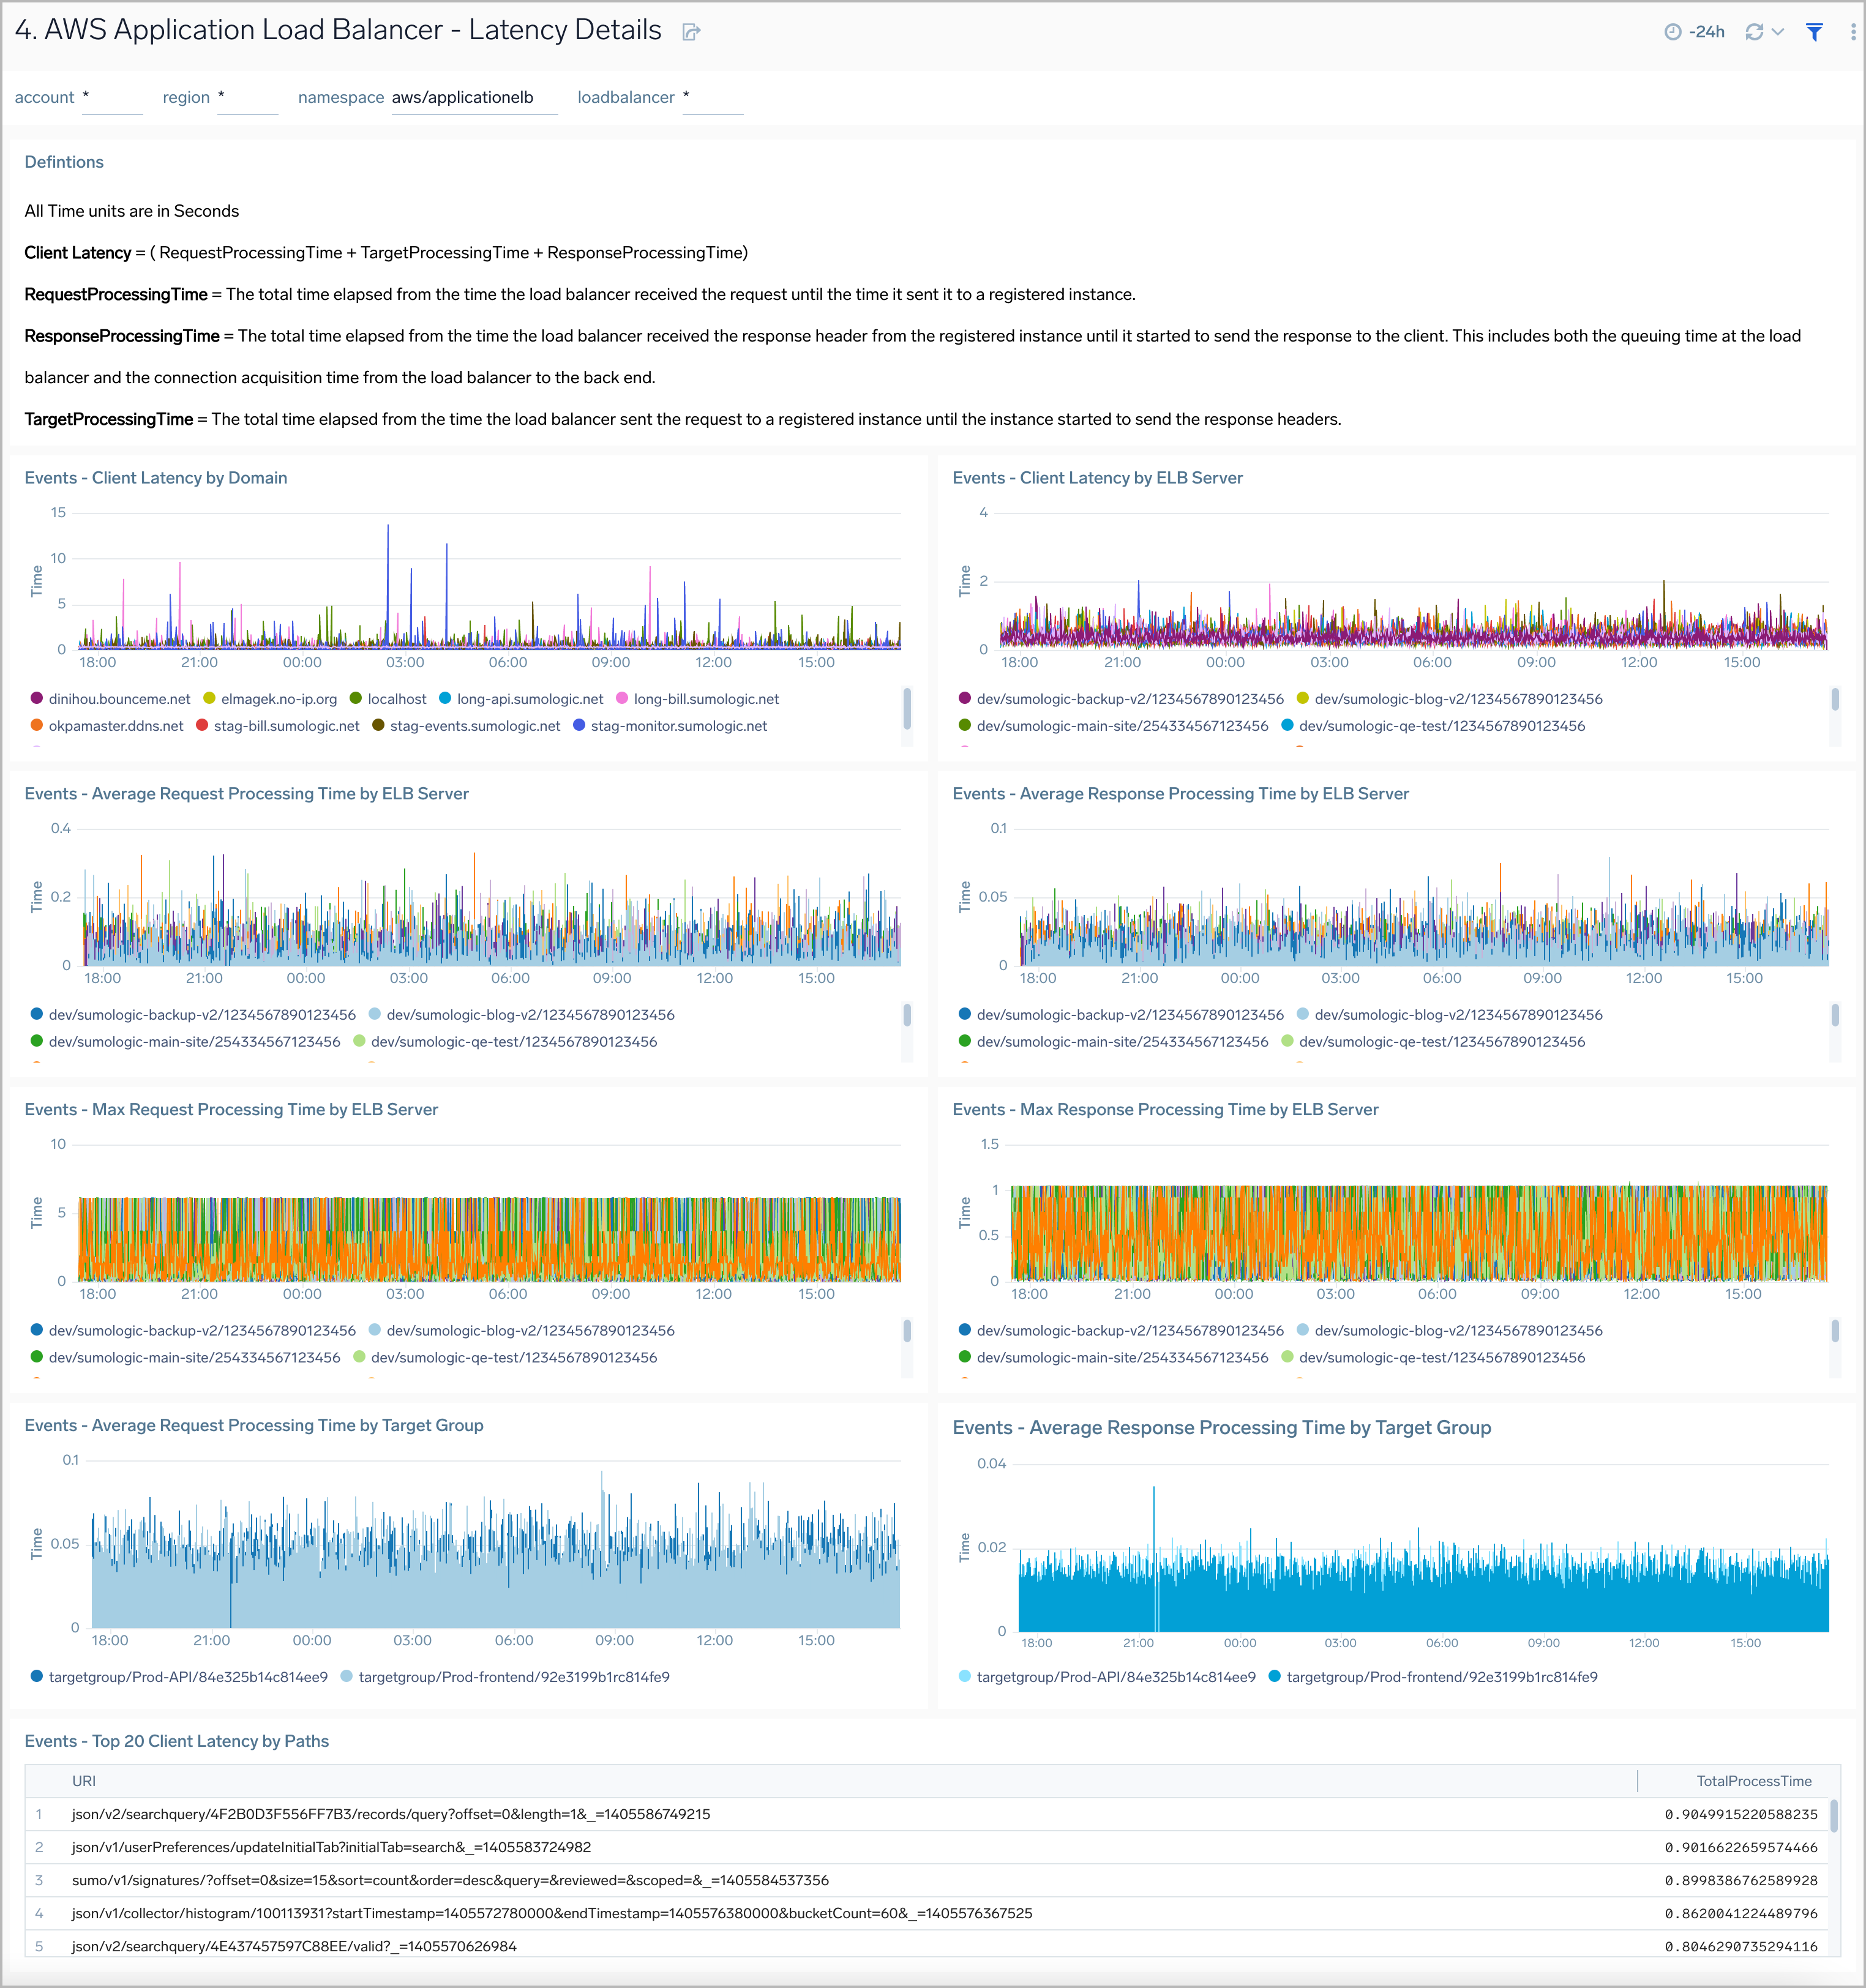
Latency Details
The AWS Application Load Balancer - Latency Details dashboard provides insights into client latency by domain and ELB server, as well as processing times by ELB server and target groups throughout your infrastructure.
Use this dashboard to:
- Troubleshoot load balancer performance through detailed views across client, request processing, and response time latencies.
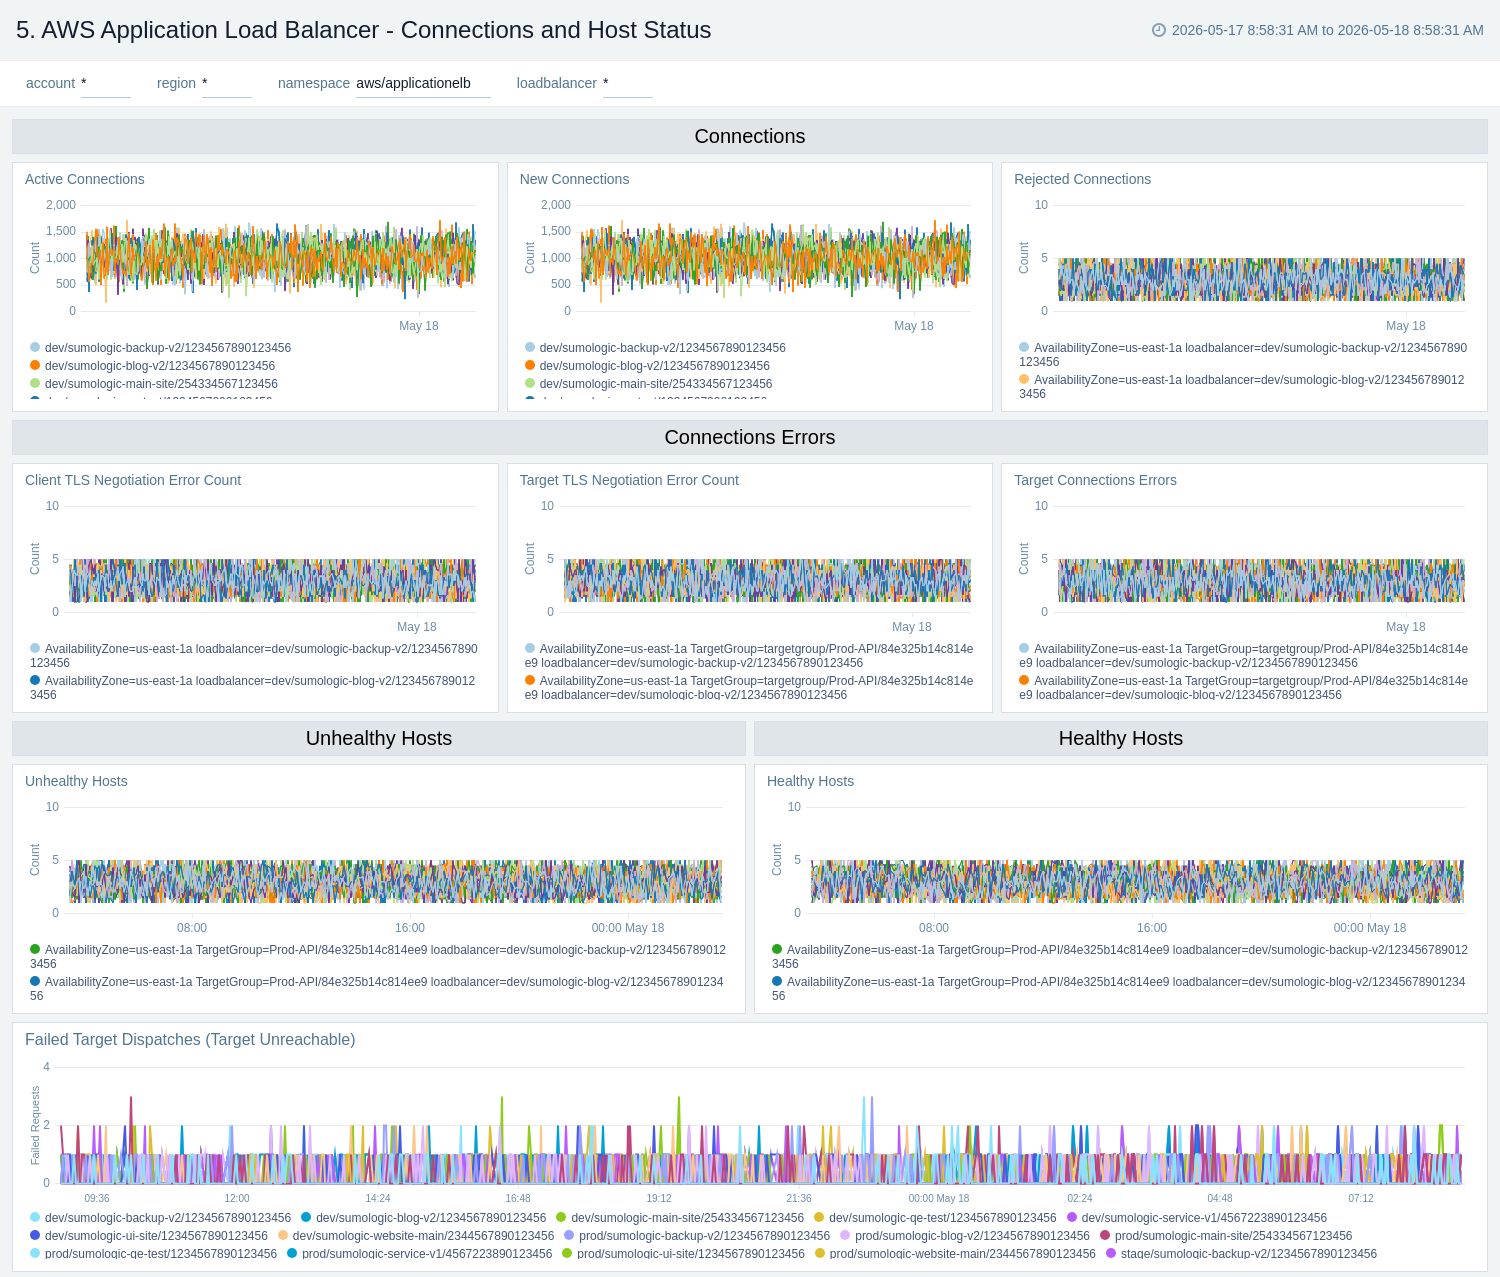
Connection and Host Status
The AWS Application Load Balancer - Connection and Host Status dashboard provides insights into active and rejected connections, target connection errors, and healthy and unhealthy hosts.
Use this dashboard to:
- Monitor active connections, new connections, rejected connections, and connection errors for the load balancer.
- Monitor healthy and unhealthy host counts by the load balancer, target group, and availability zone across your infrastructure.
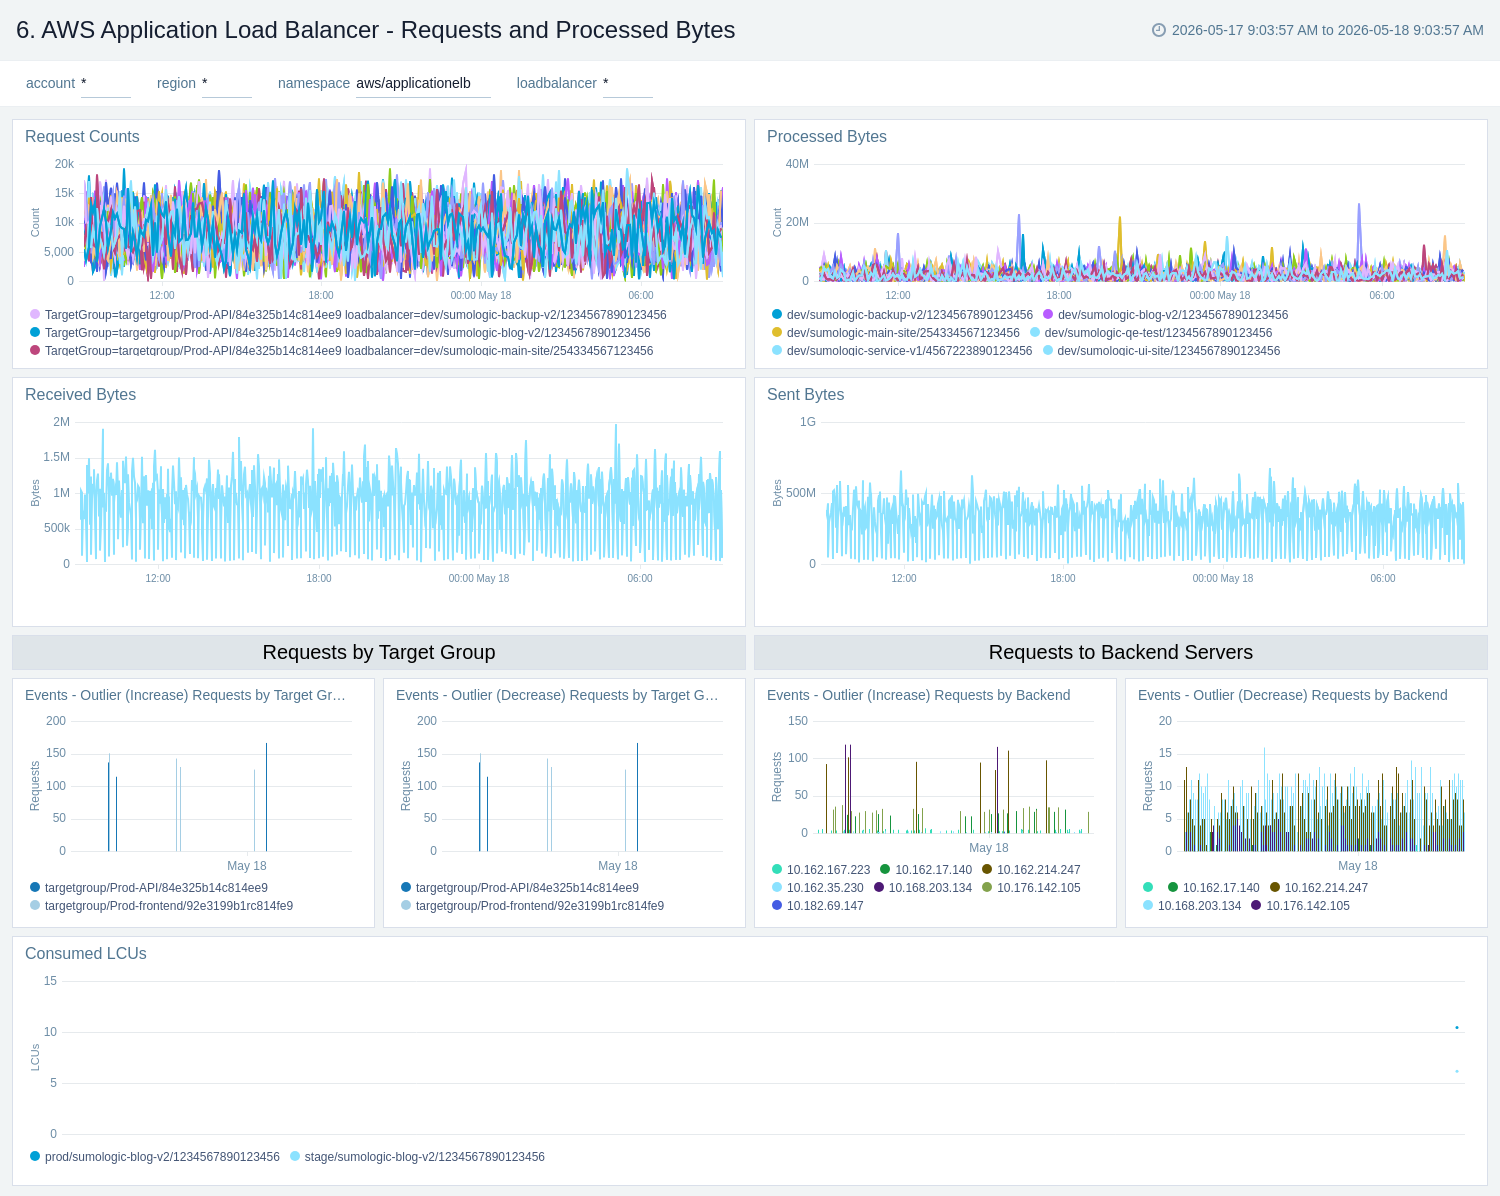
Requests and Processed Bytes
The AWS Application Load Balancer - Requests and Processed Bytes dashboard provides insights into client requests, network traffic, and processed data.
Use this dashboard to:
- Monitor client request load, network traffic, and processed bytes to determine how to best configure load balancers for optimal performance.
- Determine how to best allocate backend resources and target groups based on load.
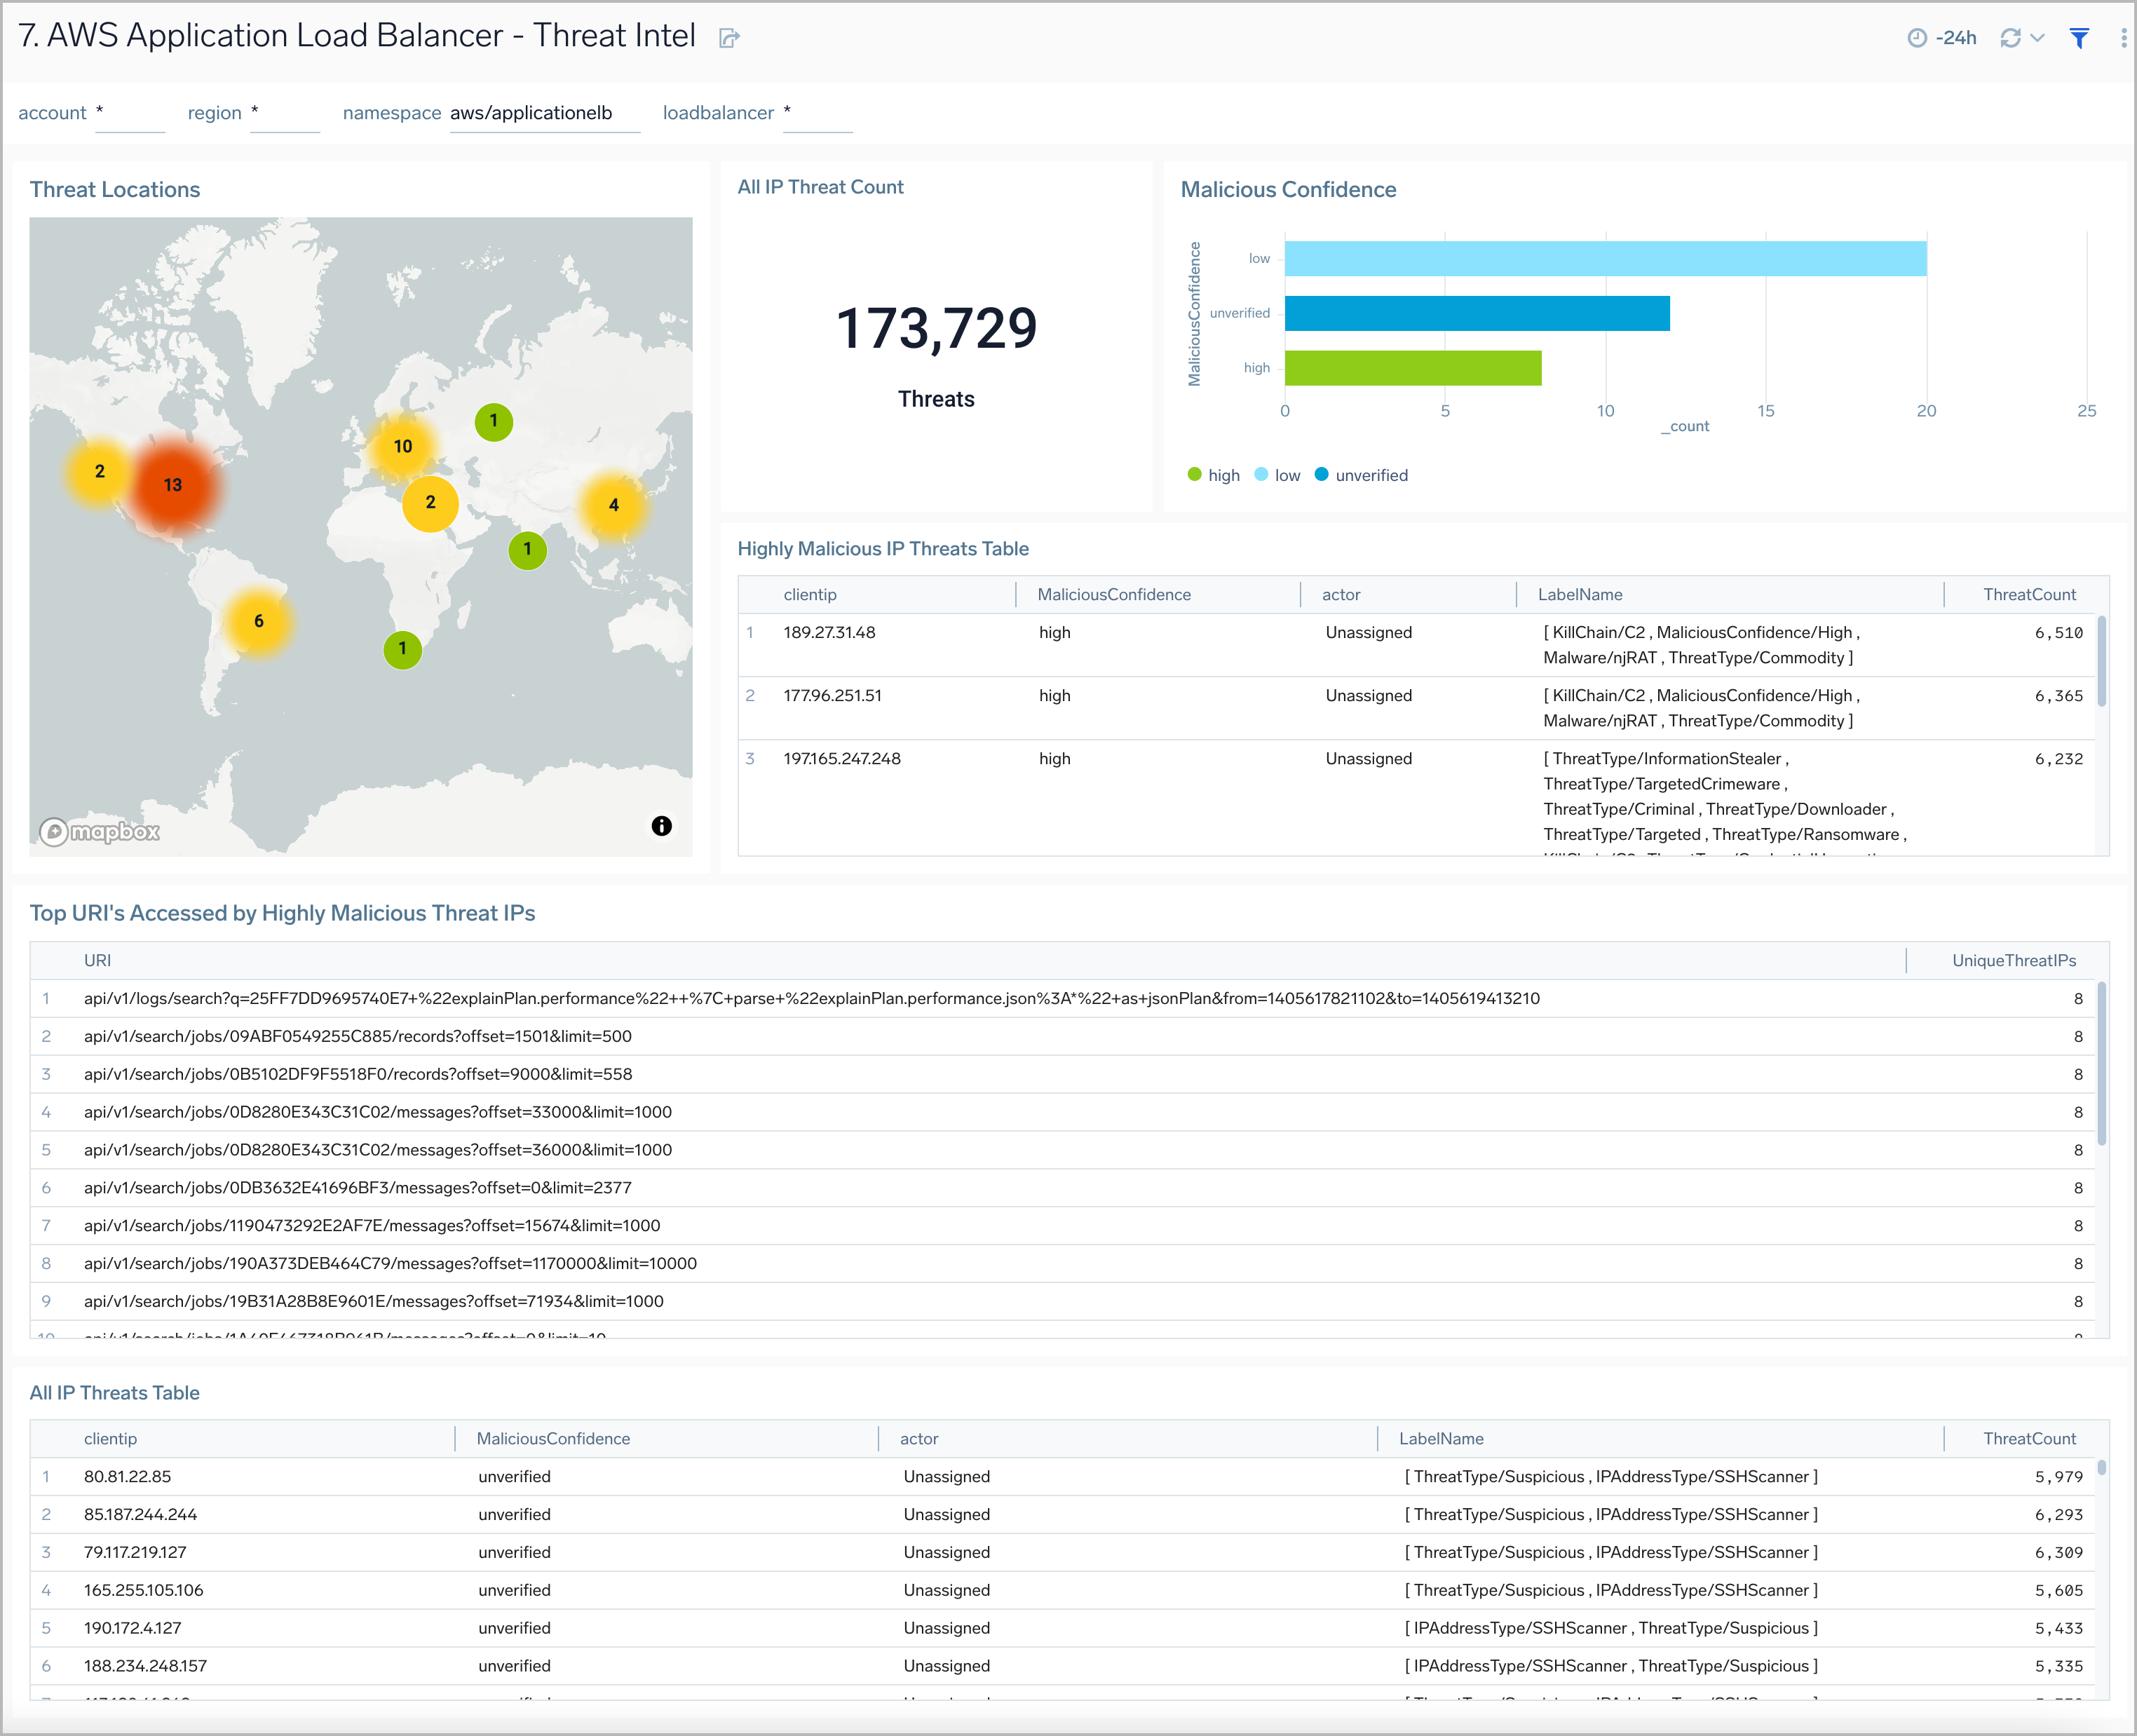
Threat Intel
The AWS Application Load Balancer - Threat Intel dashboard provides insights into incoming requests from malicious sources determined through Sumo Logic threat intelligence. Panels show detailed information on malicious IPs and the malicious confidence of each threat.
Use this dashboard to:
- Identify known malicious IPs that access your load-balancers and use firewall access control lists to prevent them from sending you traffic going forward.
- Monitor the malicious confidence level for all incoming malicious IP addresses the threats.
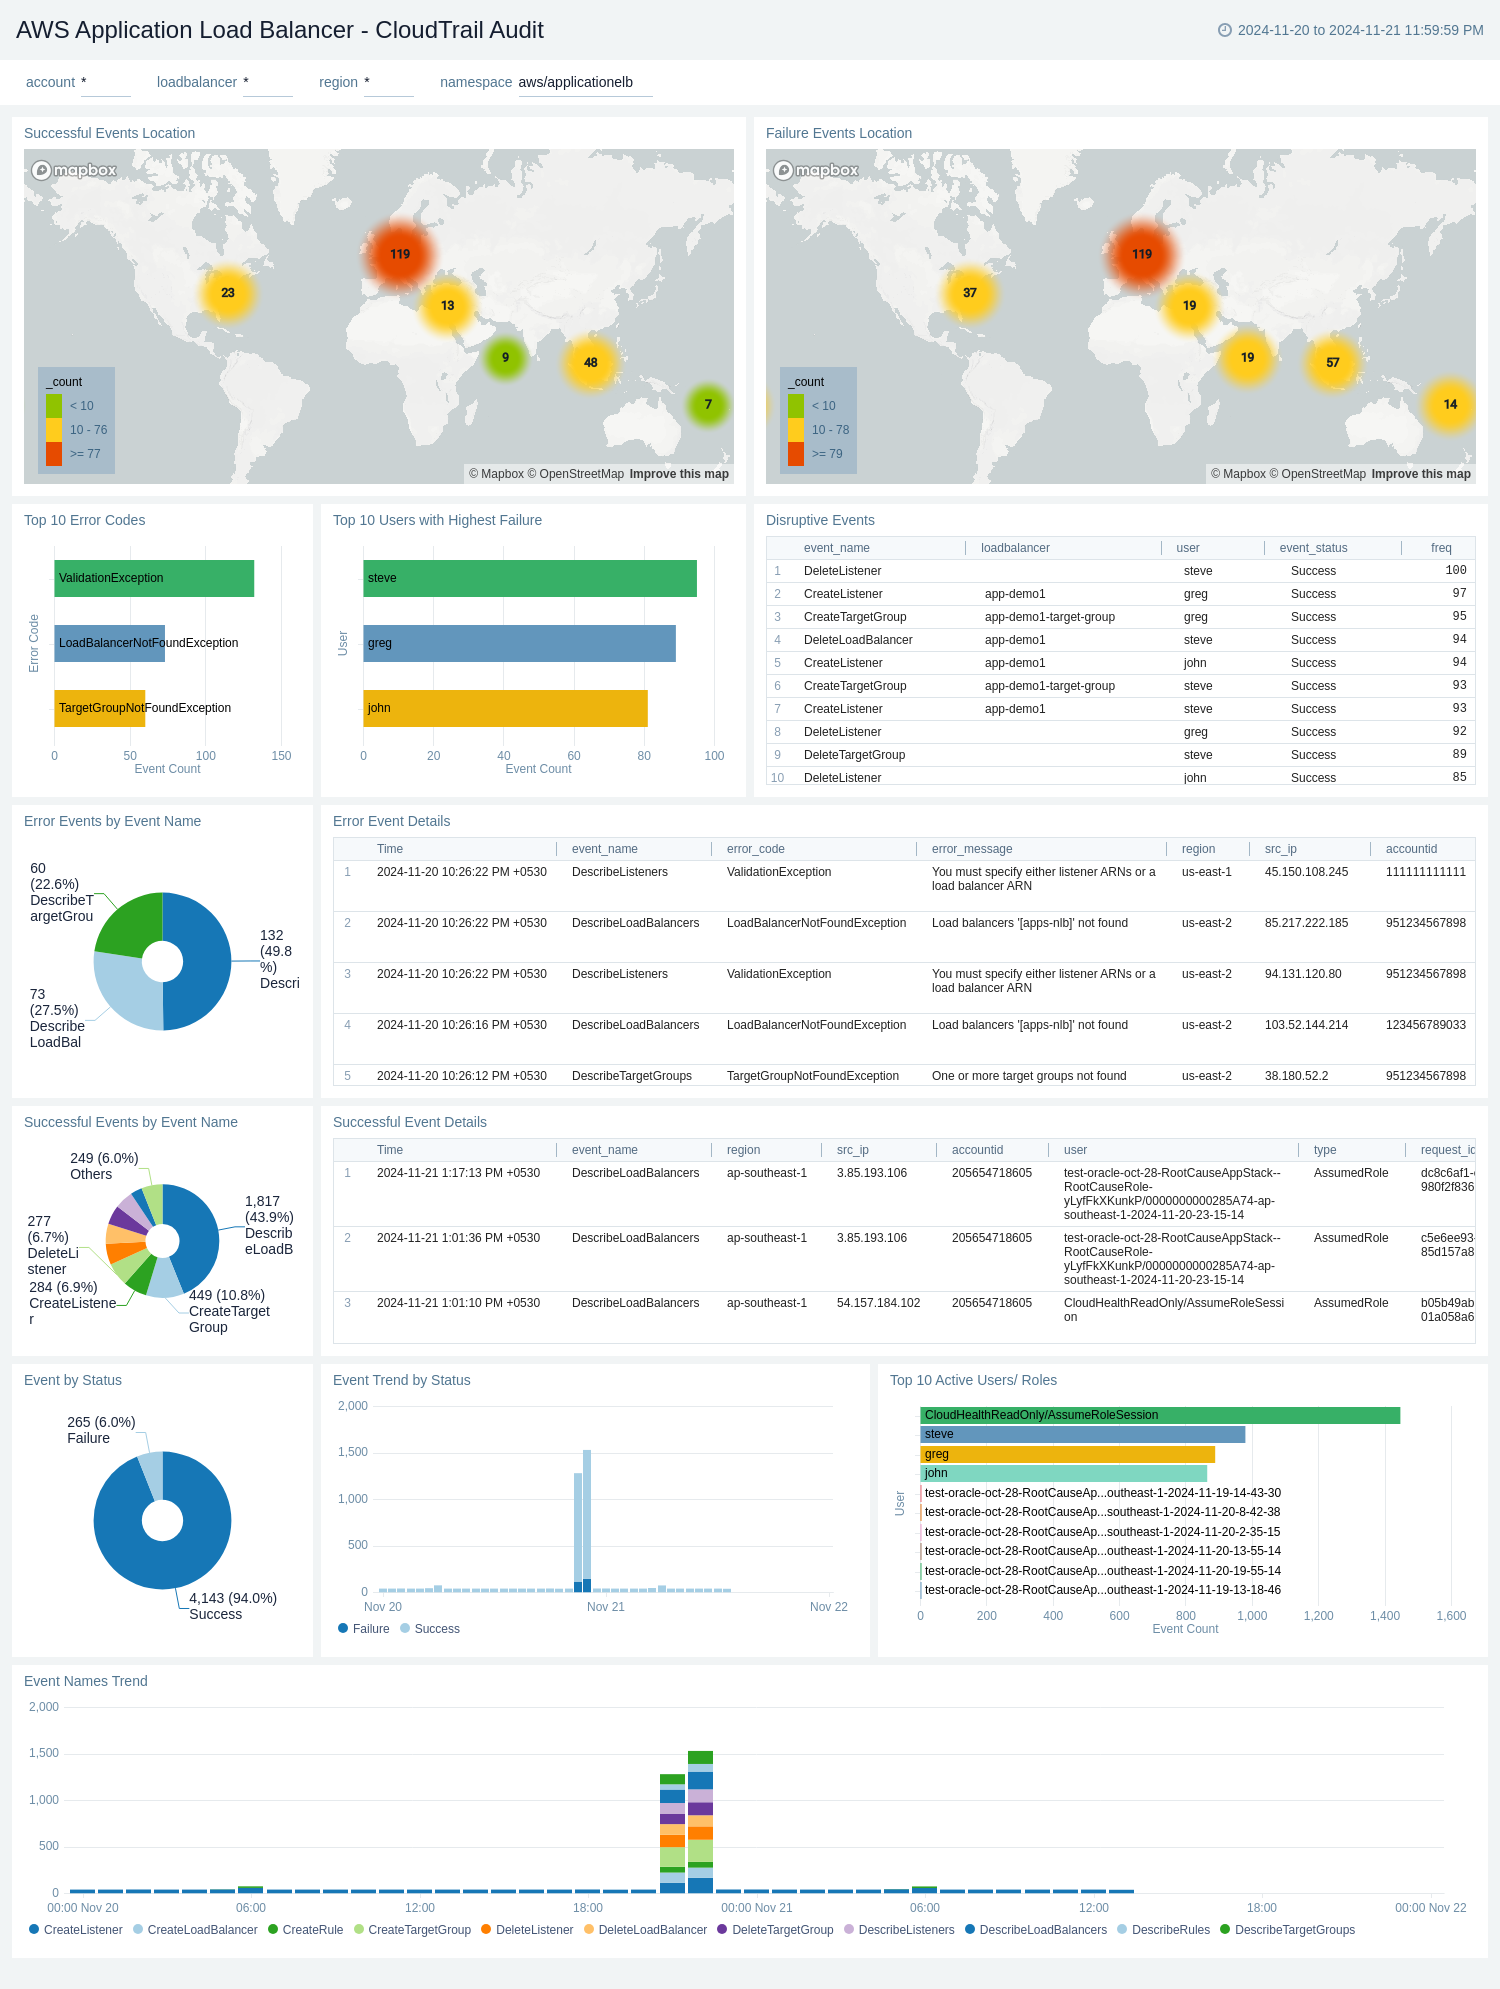
CloudTrail Audit
The AWS Application Load Balancer - CloudTrail Audit dashboard provides a comprehensive overview of AWS Application Load Balancer activities through CloudTrail audit logs. It visualizes successful and failed events globally, event trends, error details, and user activities, offering insights into load balancer performance, security, and usage patterns.
Use this dashboard to:
- Monitor the geographical distribution of successful and failed load balancer events, allowing for quick identification of regions with high activity or potential issues.
- Track the overall success rate of load balancer events and analyze trends over time, helping to identify any sudden changes or patterns in performance.
- Investigate specific error events, including their details, frequency, and associated users, enabling faster troubleshooting and resolution of issues.
- Identify the most common error types and the users experiencing the highest failure rates, facilitating targeted improvements and user support.
Create monitors for AWS Application Load Balancer app
From your App Catalog:
- From the Sumo Logic navigation, select App Catalog.
- In the Search Apps field, search for and then select your app.
- Make sure the app is installed.
- Navigate to What's Included tab and scroll down to the Monitors section.
- Click Create next to the pre-configured monitors. In the create monitors window, adjust the trigger conditions and notifications settings based on your requirements.
- Scroll down to Monitor Details.
- Under Location click on New Folder.
note
By default, monitor will be saved in the root folder. So to make the maintenance easier, create a new folder in the location of your choice.
- Enter Folder Name. Folder Description is optional.
tip
Using app version in the folder name will be helpful to determine the versioning for future updates.
- Click Create. Once the folder is created, click on Save.
AWS Application Load Balancer alerts
| Name | Description | Alert Condition | Recover Condition |
|---|---|---|---|
AWS Application Load Balancer - Access from Highly Malicious Sources | This alert fires when an application load balancer is accessed from highly malicious IP addresses within last 5 minutes. | Count > 0 | Count < = 0 |
AWS Application Load Balancer - Deletion Alert | This alert fires when an application load balancer is deleted within last 5 minutes. | Count > = 2 | Count < 2 |
AWS Application Load Balancer - High 4XX Errors | This alert fires when there are too many HTTP requests (>5%) with a response status of 4xx within an interval of 5 minutes. | Count > = 5 | Count < 5 |
AWS Application Load Balancer - High 5XX Errors | This alert fires when there are too many HTTP requests (>5%) with a response status of 5xx within an interval of 5 minutes. | Count > = 5 | Count < 5 |
AWS Application Load Balancer - High Latency | This alert fires when we detect that the average latency for a given application load balancer within a time interval of 5 minutes is greater than or equal to three seconds. | Count > = 3000 | Count < 3000 |
AWS Application Load Balancer - Targets Deregistered | This alert fires when targets are deregistered from an application load balancer within last 5 minutes. | Count > = 1 | Count < 1 |
AWS Application Load Balancer - High Unhealthy Host Count | This alert fires when we detect that the number of unhealthy hosts for a given Application load balancer within a time interval of 5 minutes is greater than or equal to one. | Count > = 1 | Count < 1 |
Upgrade/Downgrade the AWS Application Load Balancer app (Optional)
To update the app, do the following:
Next-Gen App: To install or update the app, you must be an account administrator or a user with Manage Apps, Manage Monitors, Manage Fields, Manage Metric Rules, and Manage Collectors capabilities depending upon the different content types part of the app.
- Select App Catalog.
- In the Search Apps field, search for and then select your app.
Optionally, you can identify apps that can be upgraded in the Upgrade available section. - To upgrade the app, select Upgrade from the Manage dropdown.
- If the upgrade does not have any configuration or property changes, you will be redirected to the Preview & Done section.
- If the upgrade has any configuration or property changes, you will be redirected to the Setup Data page.
- In the Configure section of your respective app, complete the following fields.
- Field Name. If you already have collectors and sources set up, select the configured metadata field name (eg _sourcecategory) or specify other custom metadata (eg: _collector) along with its metadata Field Value.
- Click Next. You will be redirected to the Preview & Done section.
Post-update
Your upgraded app will be installed in the Installed Apps folder and dashboard panels will start to fill automatically.
See our Release Notes changelog for new updates in the app.
To revert the app to a previous version, do the following:
- Select App Catalog.
- In the Search Apps field, search for and then select your app.
- To version down the app, select Revert to < previous version of your app > from the Manage dropdown.
Uninstalling the AWS Application Load Balancer app (Optional)
To uninstall the app, do the following:
- Select App Catalog.
- In the 🔎 Search Apps field, run a search for your desired app, then select it.
- Click Uninstall.