 Meet the new
 Amazon DynamoDB
Amazon DynamoDB is a fast and flexible NoSQL database service that provides consistent, single-digit millisecond latency at any scale. For more details see here.
The Sumo app for Amazon DynamoDB uses both logs and metrics to is a unified logs and metrics app that provides operational insights into your DynamoDB. The app includes Dashboards that allow you to monitor key metrics, view the throttle events, errors, and latency, and also help you plan the capacity of your DynamoDB instances.
Log and metric types
The Sumo Logic app for AWS DynamoDB uses the following logs and metrics:
Sample log messages
Sample CloudTrail Log Message
   {
   "eventVersion":"1.05",
   "userIdentity":{
      "type":"IAMUser",
      "principalId":"AIDAIBF5TU7HNYUE7V676",
      "arn":"arn:aws:iam::568388783903:user/ankit",
      "accountId":"568388783903",
      "accessKeyId":"ASIAI3Q5RU4FIZFHFJZA",
      "userName":"ankit",
      "sessionContext":{
         "attributes":{
            "mfaAuthenticated":"false",
            "creationDate":"2017-10-10T23:01:45+0000"
         }
      },
      "invokedBy":"signin.amazonaws.com"
   },
   "eventTime":"2017-10-10T23:01:45+0000",
   "eventSource":"dynamodb.amazonaws.com",
   "eventName":"DescribeTable",
   "awsRegion":"us-east-1",
   "sourceIPAddress":"38.99.50.98",
   "userAgent":"signin.amazonaws.com",
   "requestParameters":{
      "tableName":"users3"
   },
   "responseElements":null,
   "requestID":"AIFQQ1I27ASKDSAQ4L9L4DTQPVVV4KQNSO5AEMVJF66Q9ASUAAJG",
   "eventID":"f2bec08c-a56a-4f04-be92-0cac7aaabe9b",
   "eventType":"AwsApiCall",
   "apiVersion":"2012-08-10",
   "recipientAccountId":"568388783903"
   }
Sample queries
namespace=aws/dynamodb metric=SuccessfulRequestLatency Statistic=Average account=* region=* tablename=* | sum by account, region, namespace, tablename
account=dev namespace=aws/dynamodb region=us-east-1 "\"eventSource\":\"dynamodb.amazonaws.com\"" errorCode errorMessage
| json "eventName", "awsRegion", "requestParameters.tableName", "sourceIPAddress", "userIdentity.userName", "userIdentity.sessionContext.sessionIssuer.userName", "errorCode", "errorMessage" as EventName, Region, tablename, SourceIp, UserName, ContextUserName, ErrorCode, ErrorMessage nodrop
| if (isEmpty(UserName), ContextUserName, UserName) as UserName
| where (tolowercase(tablename) matches tolowercase("kinesistosumologicconnector")) or isBlank(tablename)
| where !isBlank(errorCode)
| count as Count by ErrorCode, ErrorMessage, EventName, UserName, SourceIp
| sort by Count, ErrorCode, ErrorMessage
| limit 20
Collect logs and metrics for Amazon DynamoDB
Configure Hosted Collector
When you create an AWS Source, you'll need to identify the Hosted Collector you want to use or create a new Hosted Collector. Once you create an AWS Source, associate it with a Hosted Collector. For instructions, see Configure a Hosted Collector and Source.
Collect Amazon DynamoDB CloudWatch metrics
Sumo Logic supports collecting metrics using one of the following source types:
-
Configure an AWS Kinesis Firehose for Metrics Source (recommended)
-
Configure an Amazon CloudWatch Source for Metrics
noteNamespace for Amazon DynamoDB service is AWS/DynamoDB.
Follow the steps below to add custom metadata fields with your metrics:
- Click +Add Field under Metadata. Each field consists of a name (key) and a corresponding value.
- Create a field named
accountand assign it a value that represents a friendly name or alias to your AWS account from which metrics are collected. This value will appear in the AWS Observability view, and metrics can be queried using theaccountfield.
- After adding fields, check their status indicators:
 A green check mark indicates the field exists and is enabled in the Fields table schema.
 An orange exclamation icon indicates the field does not exist or is disabled in the schema.
- You will have the option to automatically add or enable the field.
- If a field is sent but not present or enabled in the schema, it is ignored and marked as Dropped.
Collect Amazon DynamoDB CloudTrail logs
- Grant Sumo Logic access to an Amazon S3 bucket.
- Create a trail for your AWS account.
- Confirm that logs are being delivered to the Amazon S3 bucket.
Namespace for Amazon DynamoDB service is AWS/DynamoDB.
Follow the steps below to collect logs for Amazon DynamoDB:
- Configure a CloudTrail Logs Source.
- Add custom metadata fields with your logs:
- Click +Add Field under Metadata. Each field consists of a name (key) and a corresponding value.
- Create a field named
accountand assign it a value that represents a friendly name or alias to your AWS account from which logs are collected. This value will appear in the AWS Observability view, and logs can be queried using theaccountfield. - After adding fields, check their status indicators:
- A green check mark indicates the field exists and is enabled in the Fields table schema.
- An orange exclamation icon indicates the field does not exist or is disabled in the schema.
- You will have the option to automatically add or enable the field.
- If a field is sent but not present or enabled in the schema, it is ignored and marked as Dropped.
Centralized AWS CloudTrail log collection
In case you have a centralized collection of CloudTraillogs and are ingesting them from all accounts into a single Sumo Logic CloudTraillog source, create following Field Extraction Rule to map proper AWS account(s) friendly name/alias. Create it if not already present / update it as required.
Rule Name: AWS Accounts
Applied at: Ingest Time
Scope (Specific Data):
_sourceCategory=aws/observability/cloudtrail/logs
Parse Expression
Enter a parse expression to create an “account” field that maps to the alias you set for each sub-account. For example, if you used the “dev” alias for an AWS account with ID "528560886094" and the “prod” alias for an AWS account with ID "567680881046", your parse expression would look like this:
| json "recipientAccountId"
// Manually map your aws account id with the AWS account alias you setup earlier for individual child account
| "" as account
| if (recipientAccountId = "528560886094",  "dev", account) as account
| if (recipientAccountId = "567680881046",  "prod", account) as account
| fields account
Installing the Amazon DynamoDB app
Now that you have set up a collection for Amazon DynamoDB, install the Sumo Logic app to use the pre-configured dashboards that provide visibility into your environment for real-time analysis of overall usage.
To install the app, do the following:
Next-Gen App: To install or update the app, you must be an account administrator or a user with Manage Apps, Manage Monitors, Manage Fields, Manage Metric Rules, and Manage Collectors capabilities depending upon the different content types part of the app.
- Select App Catalog.
- In the 🔎 Search Apps field, run a search for your desired app, then select it.
- Click Install App.
note
Sometimes this button says Add Integration.
- Click Next in the Setup Data section.
- In the Configure section of your respective app, complete the following fields.
- Field Name. If you already have collectors and sources set up, select the configured metadata field name (eg _sourcecategory) or specify other custom metadata (eg: _collector) along with its metadata Field Value.
- Click Next. You will be redirected to the Preview & Done section.
Post-installation
Once your app is installed, it will appear in your Installed Apps folder, and dashboard panels will start to fill automatically.
Each panel slowly fills with data matching the time range query received since the panel was created. Results will not immediately be available but will be updated with full graphs and charts over time.
As part of the app installation process, the following content will be created by default along with dashboards and monitor template:
Fields
accountName / alias to the AWS account.accountidAWS account id.regionThe region to which the resource name belongs to.namespaceNamespace for Amazon DynamoDB Service is AWS/DynamoDB.tablenameDynamoDB table name.
Field Extraction Rule(s)
The FER AwsObservabilityDynamoDBCloudTrailLogsFER to extract fields region, namespace, tablename, and accountid will be created as a part of app installation.
As a best practice, do not delete or modify any fields, Field Extraction Rules (FERs), or Metric Rules created during the app installation. If you need to make updates, contact the Sumo Logic Support team.
Viewing Amazon DynamoDB dashboards
The Sumo Logic AWS Observability DynamoDB Dashboards for AWS DynamoDB provides operational insights into DynamoDB instances. Preconfigured dashboards allow you to monitor key metrics and view the throttle events, errors, and latency. They also help you plan DynamoDB instances' capacity in your environment.
We highly recommend you view these dashboards in the AWS Observability view of the AWS Observability solution.
Overview
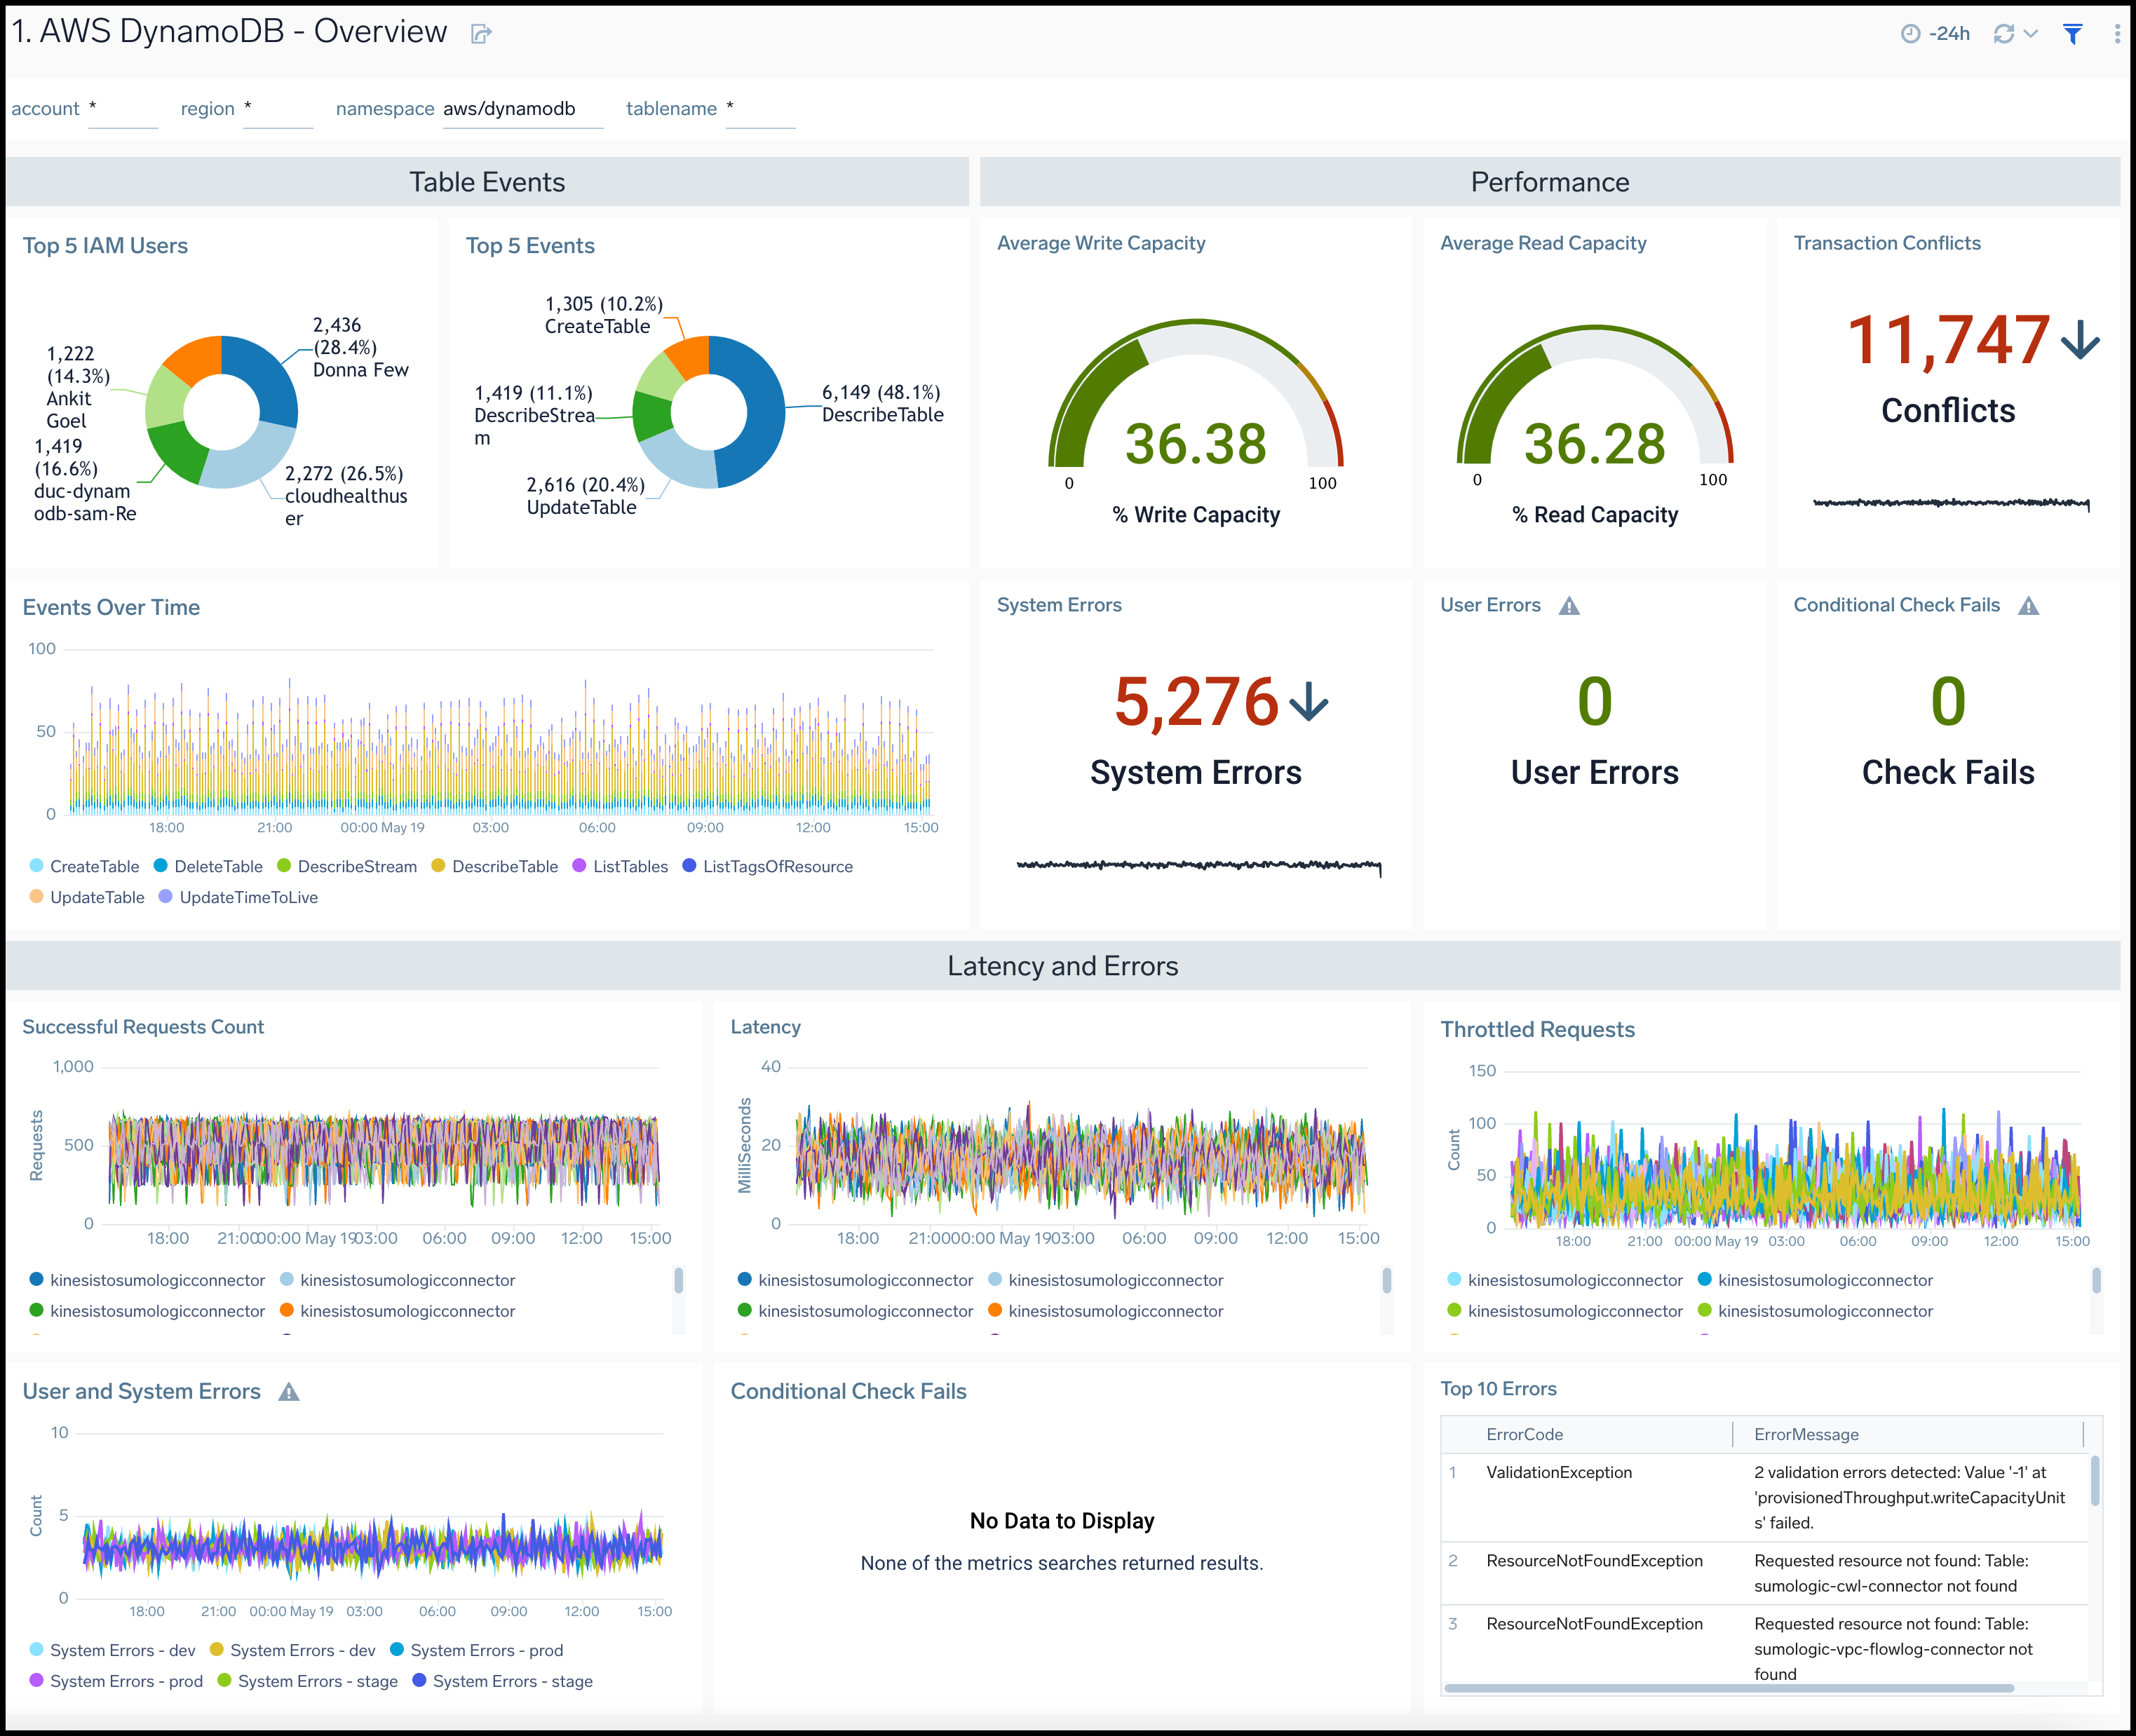
The AWS DynamoDB - Overview dashboard provides insights across your infrastructure for DynamoDB events, errors, requests, latency, and trends.
Use this dashboard to:
- Monitor average read and write capacity percentages for DynamoDB instances
- Quickly identify system errors, user errors, transaction conflicts, and conditional check fail requests for DynamoDB Monitor overall resource utilization of your DynamoDB instances
Capacity Planning
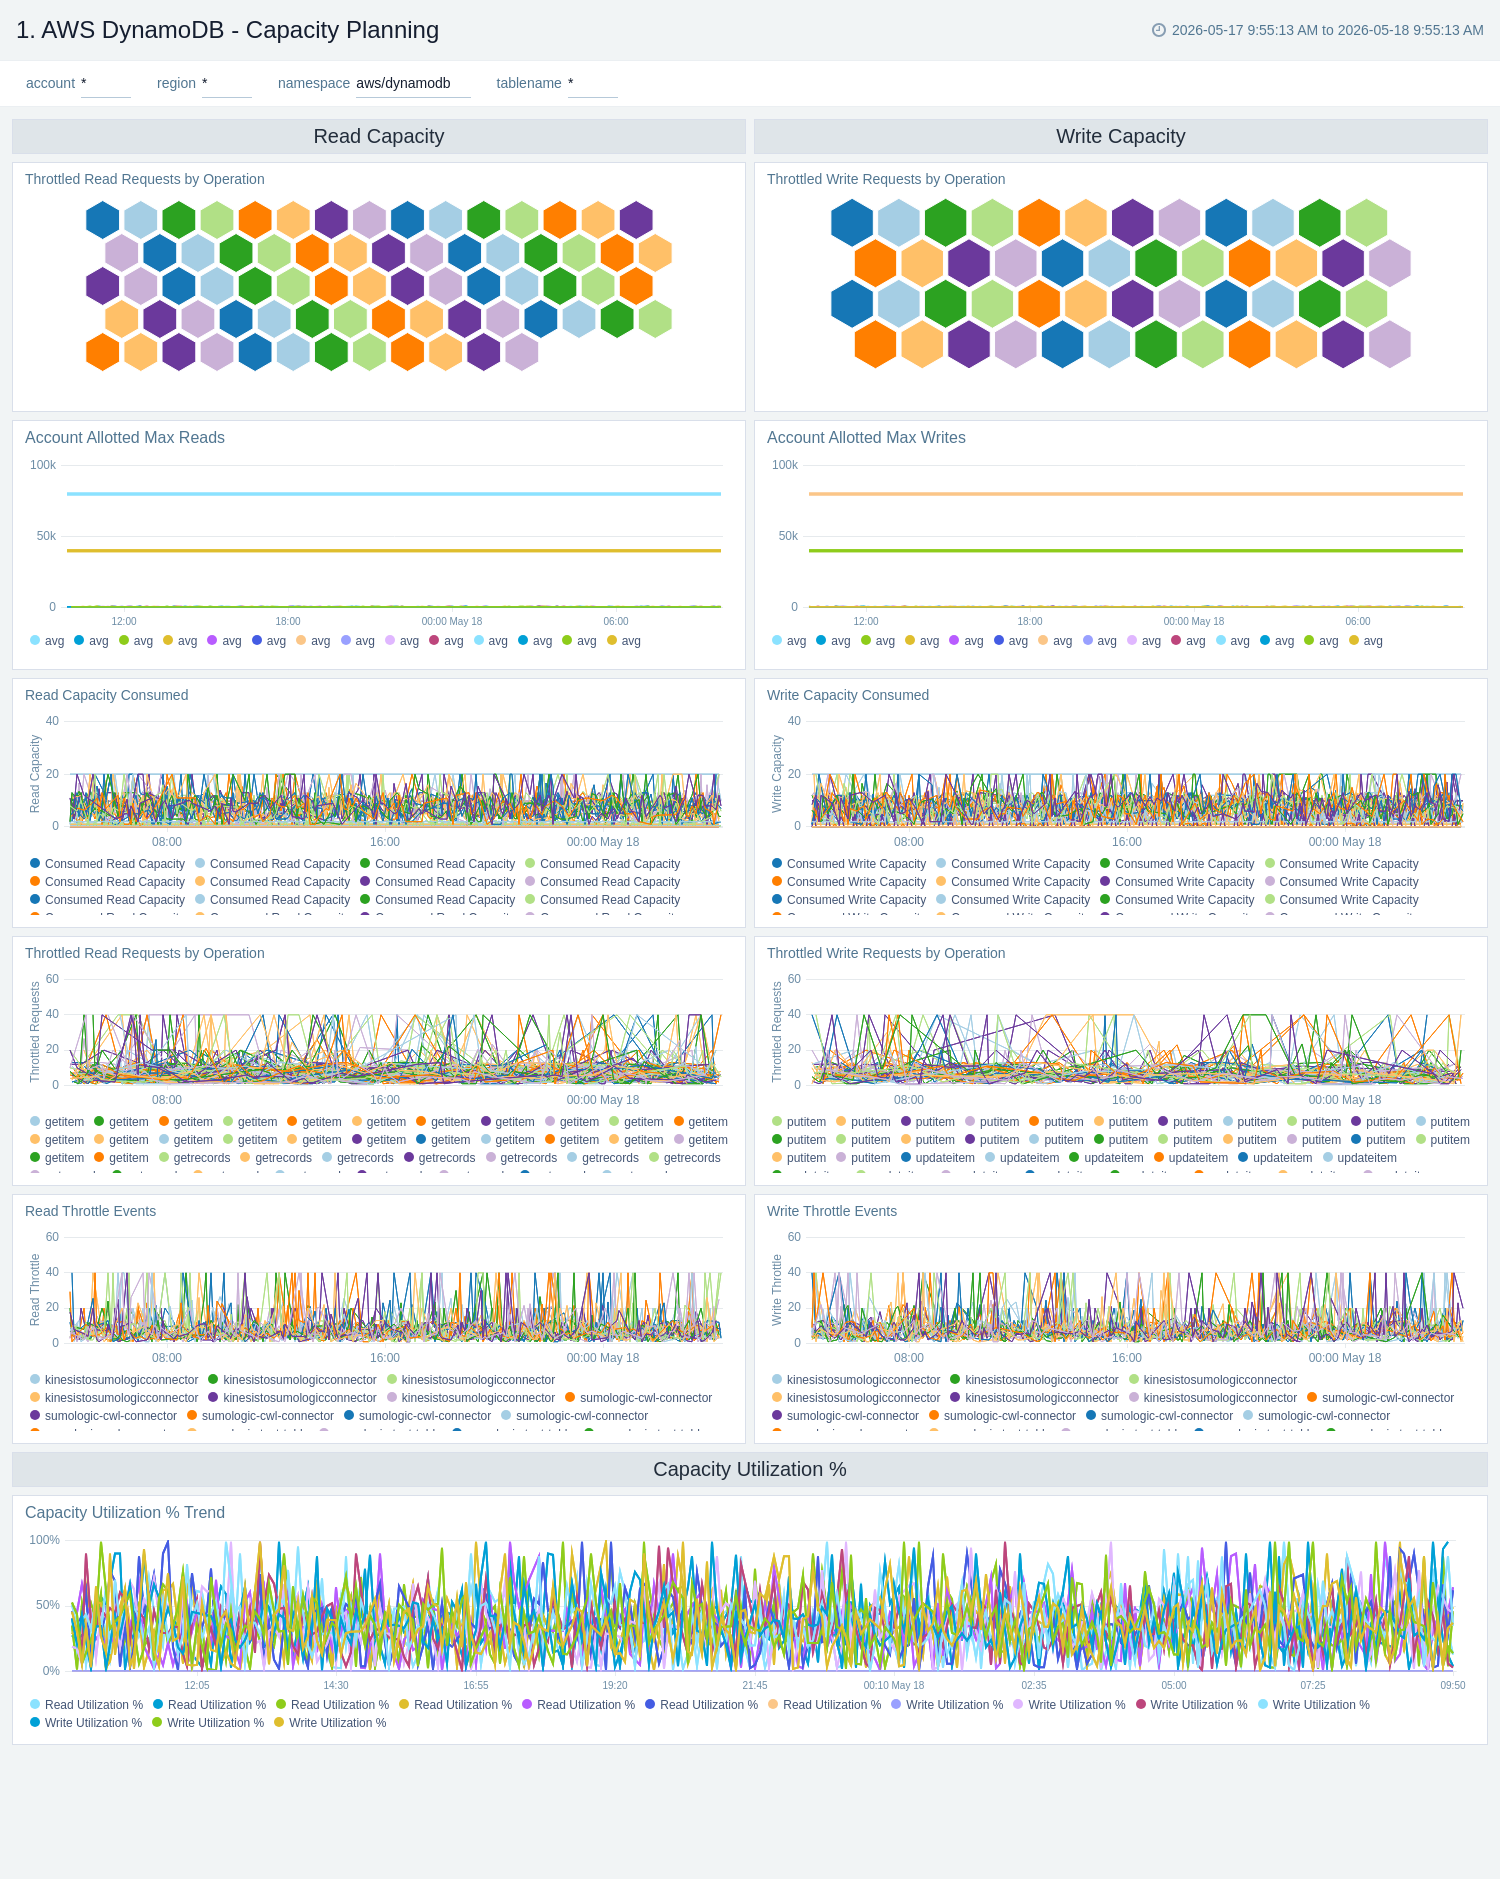
The AWS DynamoDB - Capacity Planning dashboard provides insights for DynamoDB read and writes capacity across account allotments, consumed percentages, throttle events, and requests.
Use this dashboard to:
- Monitor DynamoDB tables for throttled read and write requests, along with the type of operation.
- Monitor AWS account level maximum allocations across reading and writing capacities.
- Monitor resource utilization using trend panels for reading and write capacity, throttled read and write requests, as well as read and write throttle events for DynamoDB throughout your infrastructure.
Latency and Errors
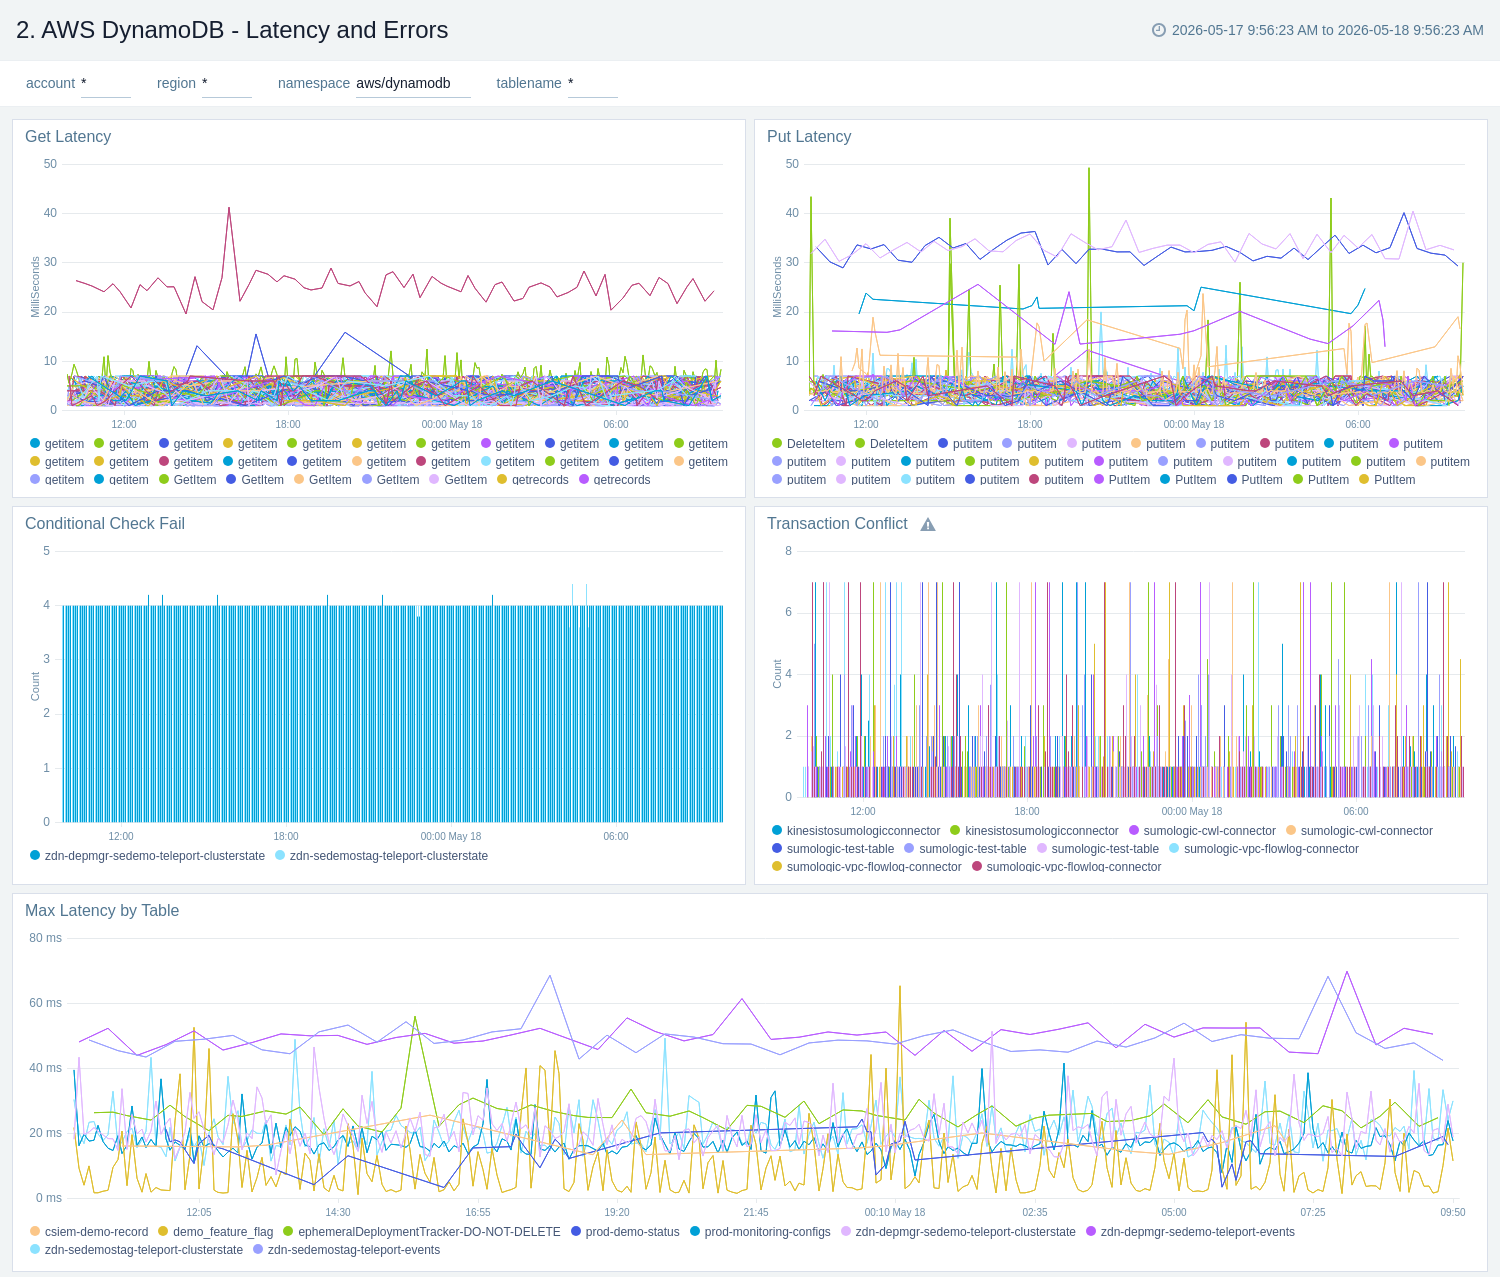
AWS DynamoDB - Latency and Errors dashboard provides insights across your infrastructure for DynamoDB errors and latency including failed requests, and latency.
Use this dashboard to:
- Identify high get and put latencies for DynamoDB tables
- Quickly identify the number of conditional checks that fail, and transaction conflicts for DynamoDB
- Monitor resource utilization using trend panels for latencies and errors for DynamoDB
Events
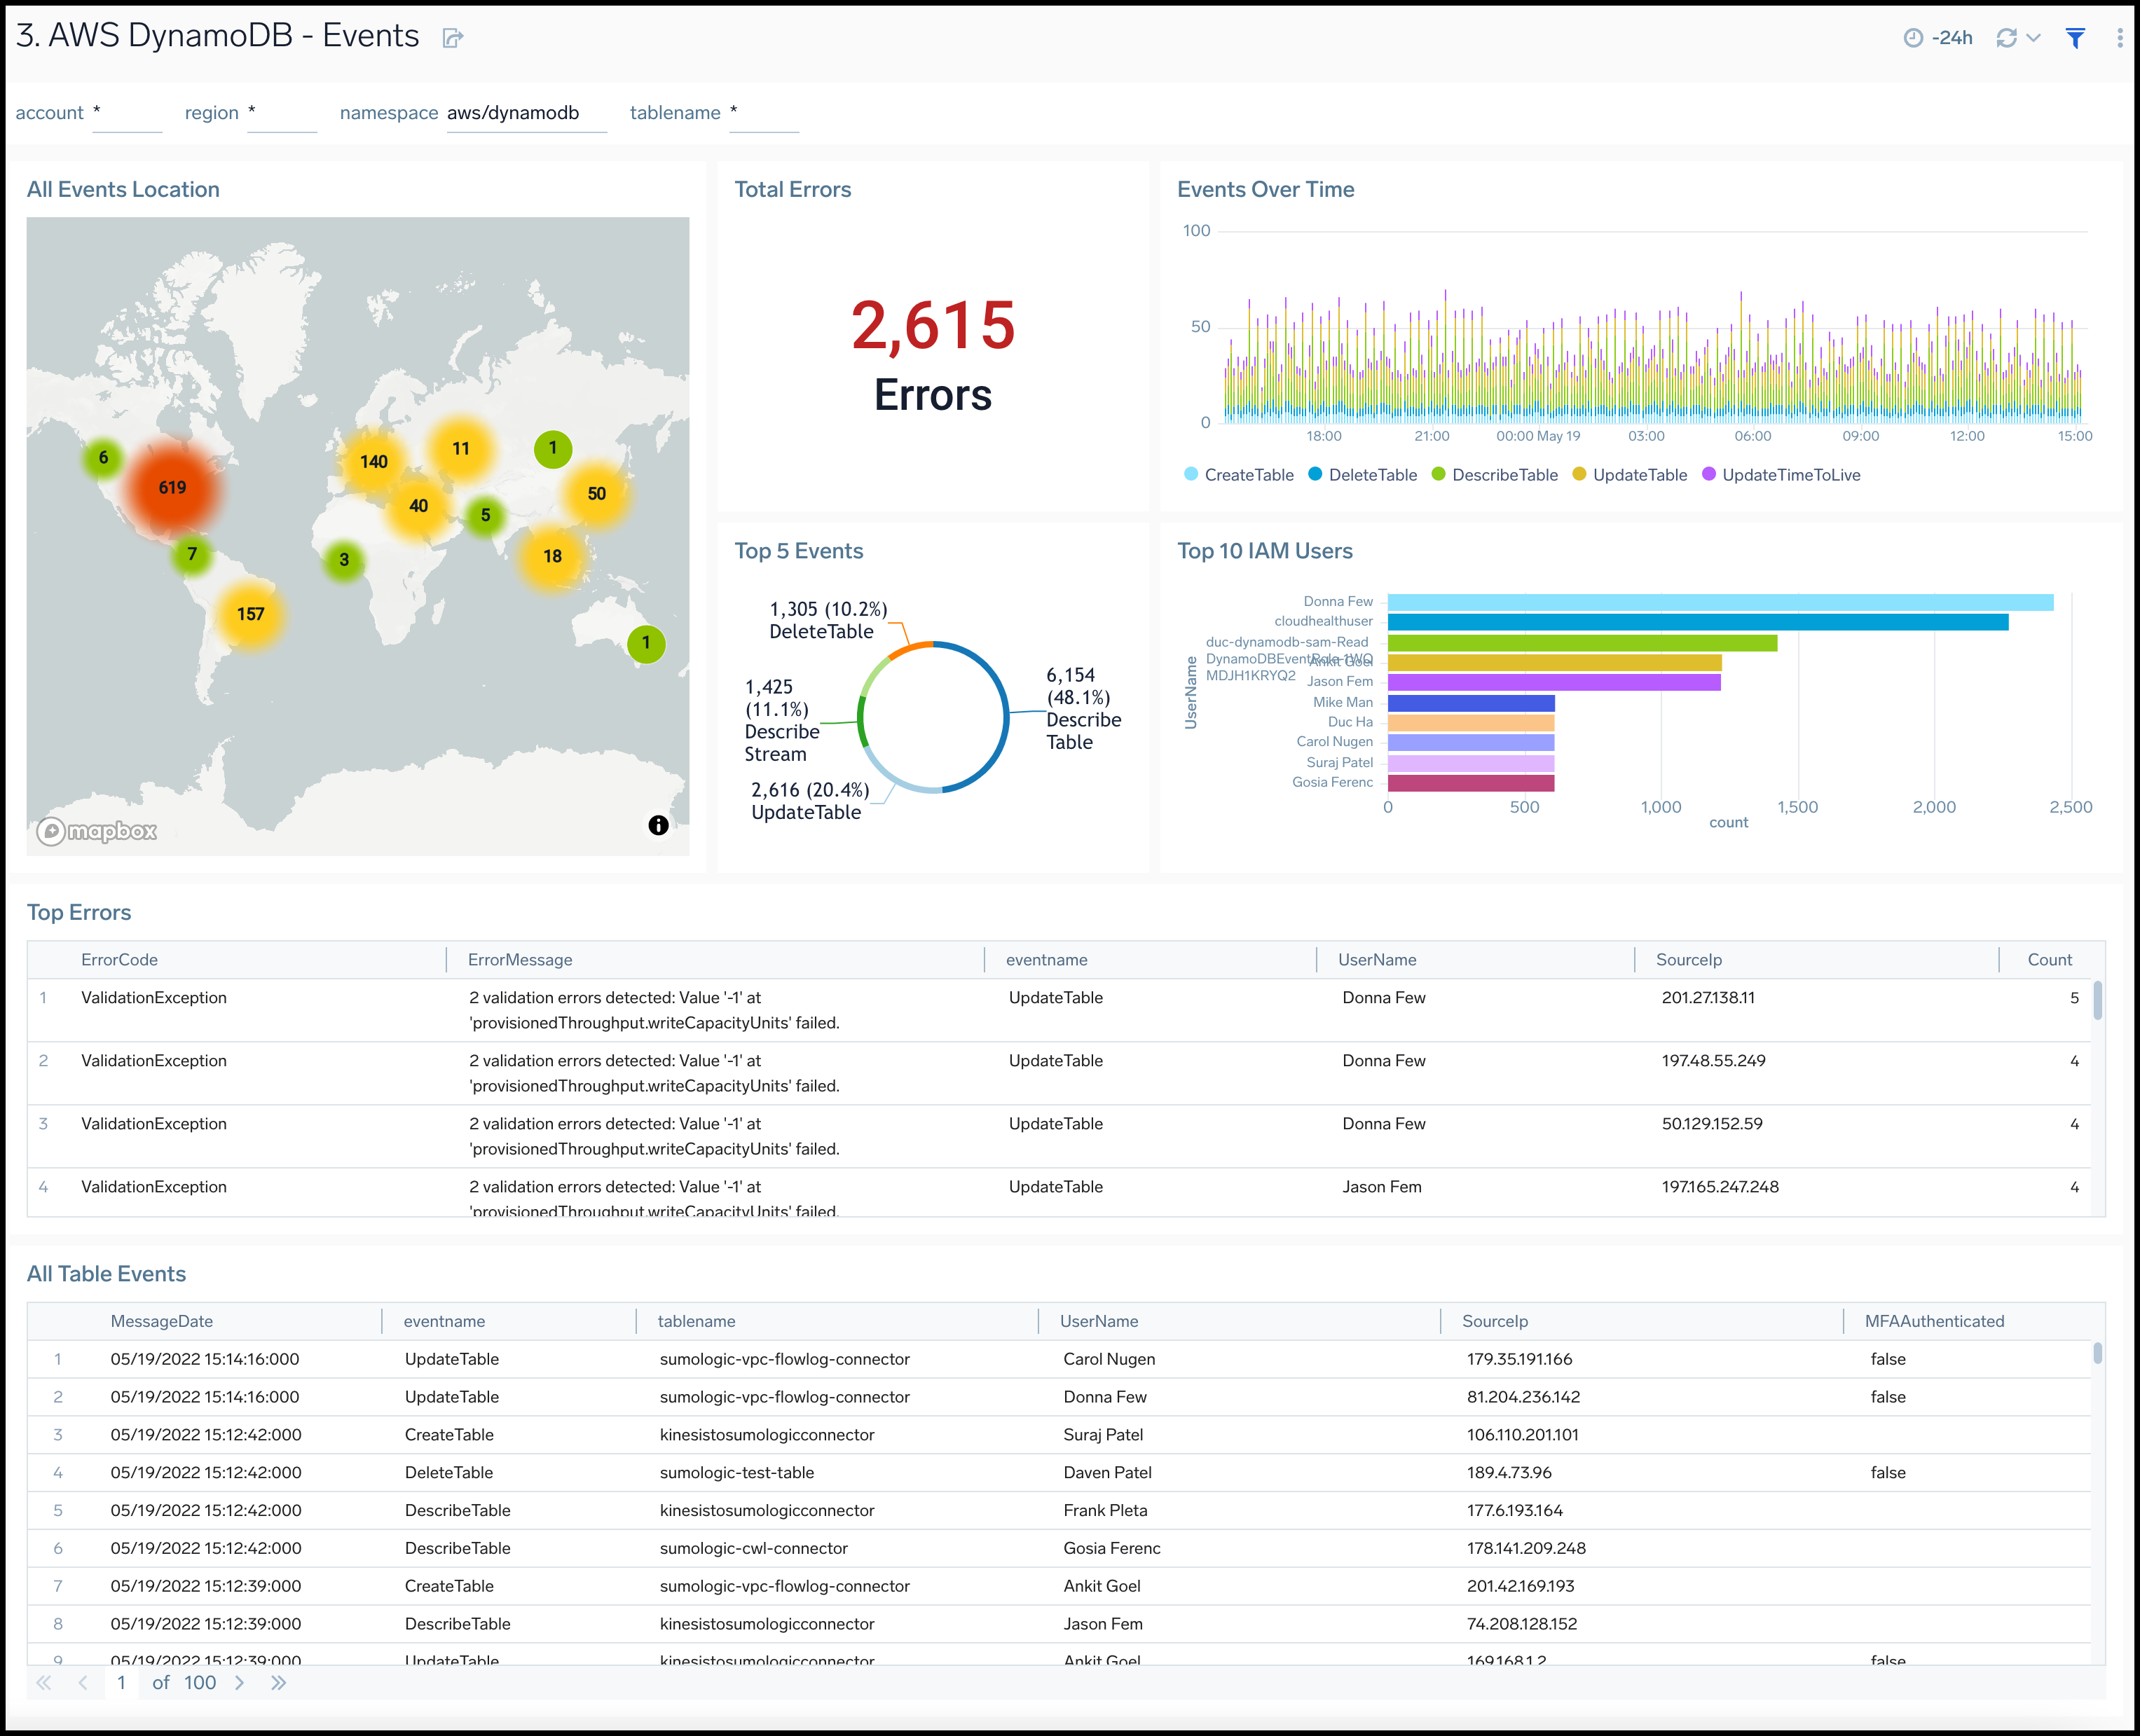
The AWS DynamoDB - Events dashboard provides insights across your infrastructure for DynamoDB events including trends, users, errors, updates, creations and deletions to tables.
Use this dashboard to:
- Monitor DynamoDB activities and ensure they are in line with expectations.
- Monitor different types of table events, such as create, update, and describe tables.
- Quickly identify the top DynamoDB related errors
Threat Intel
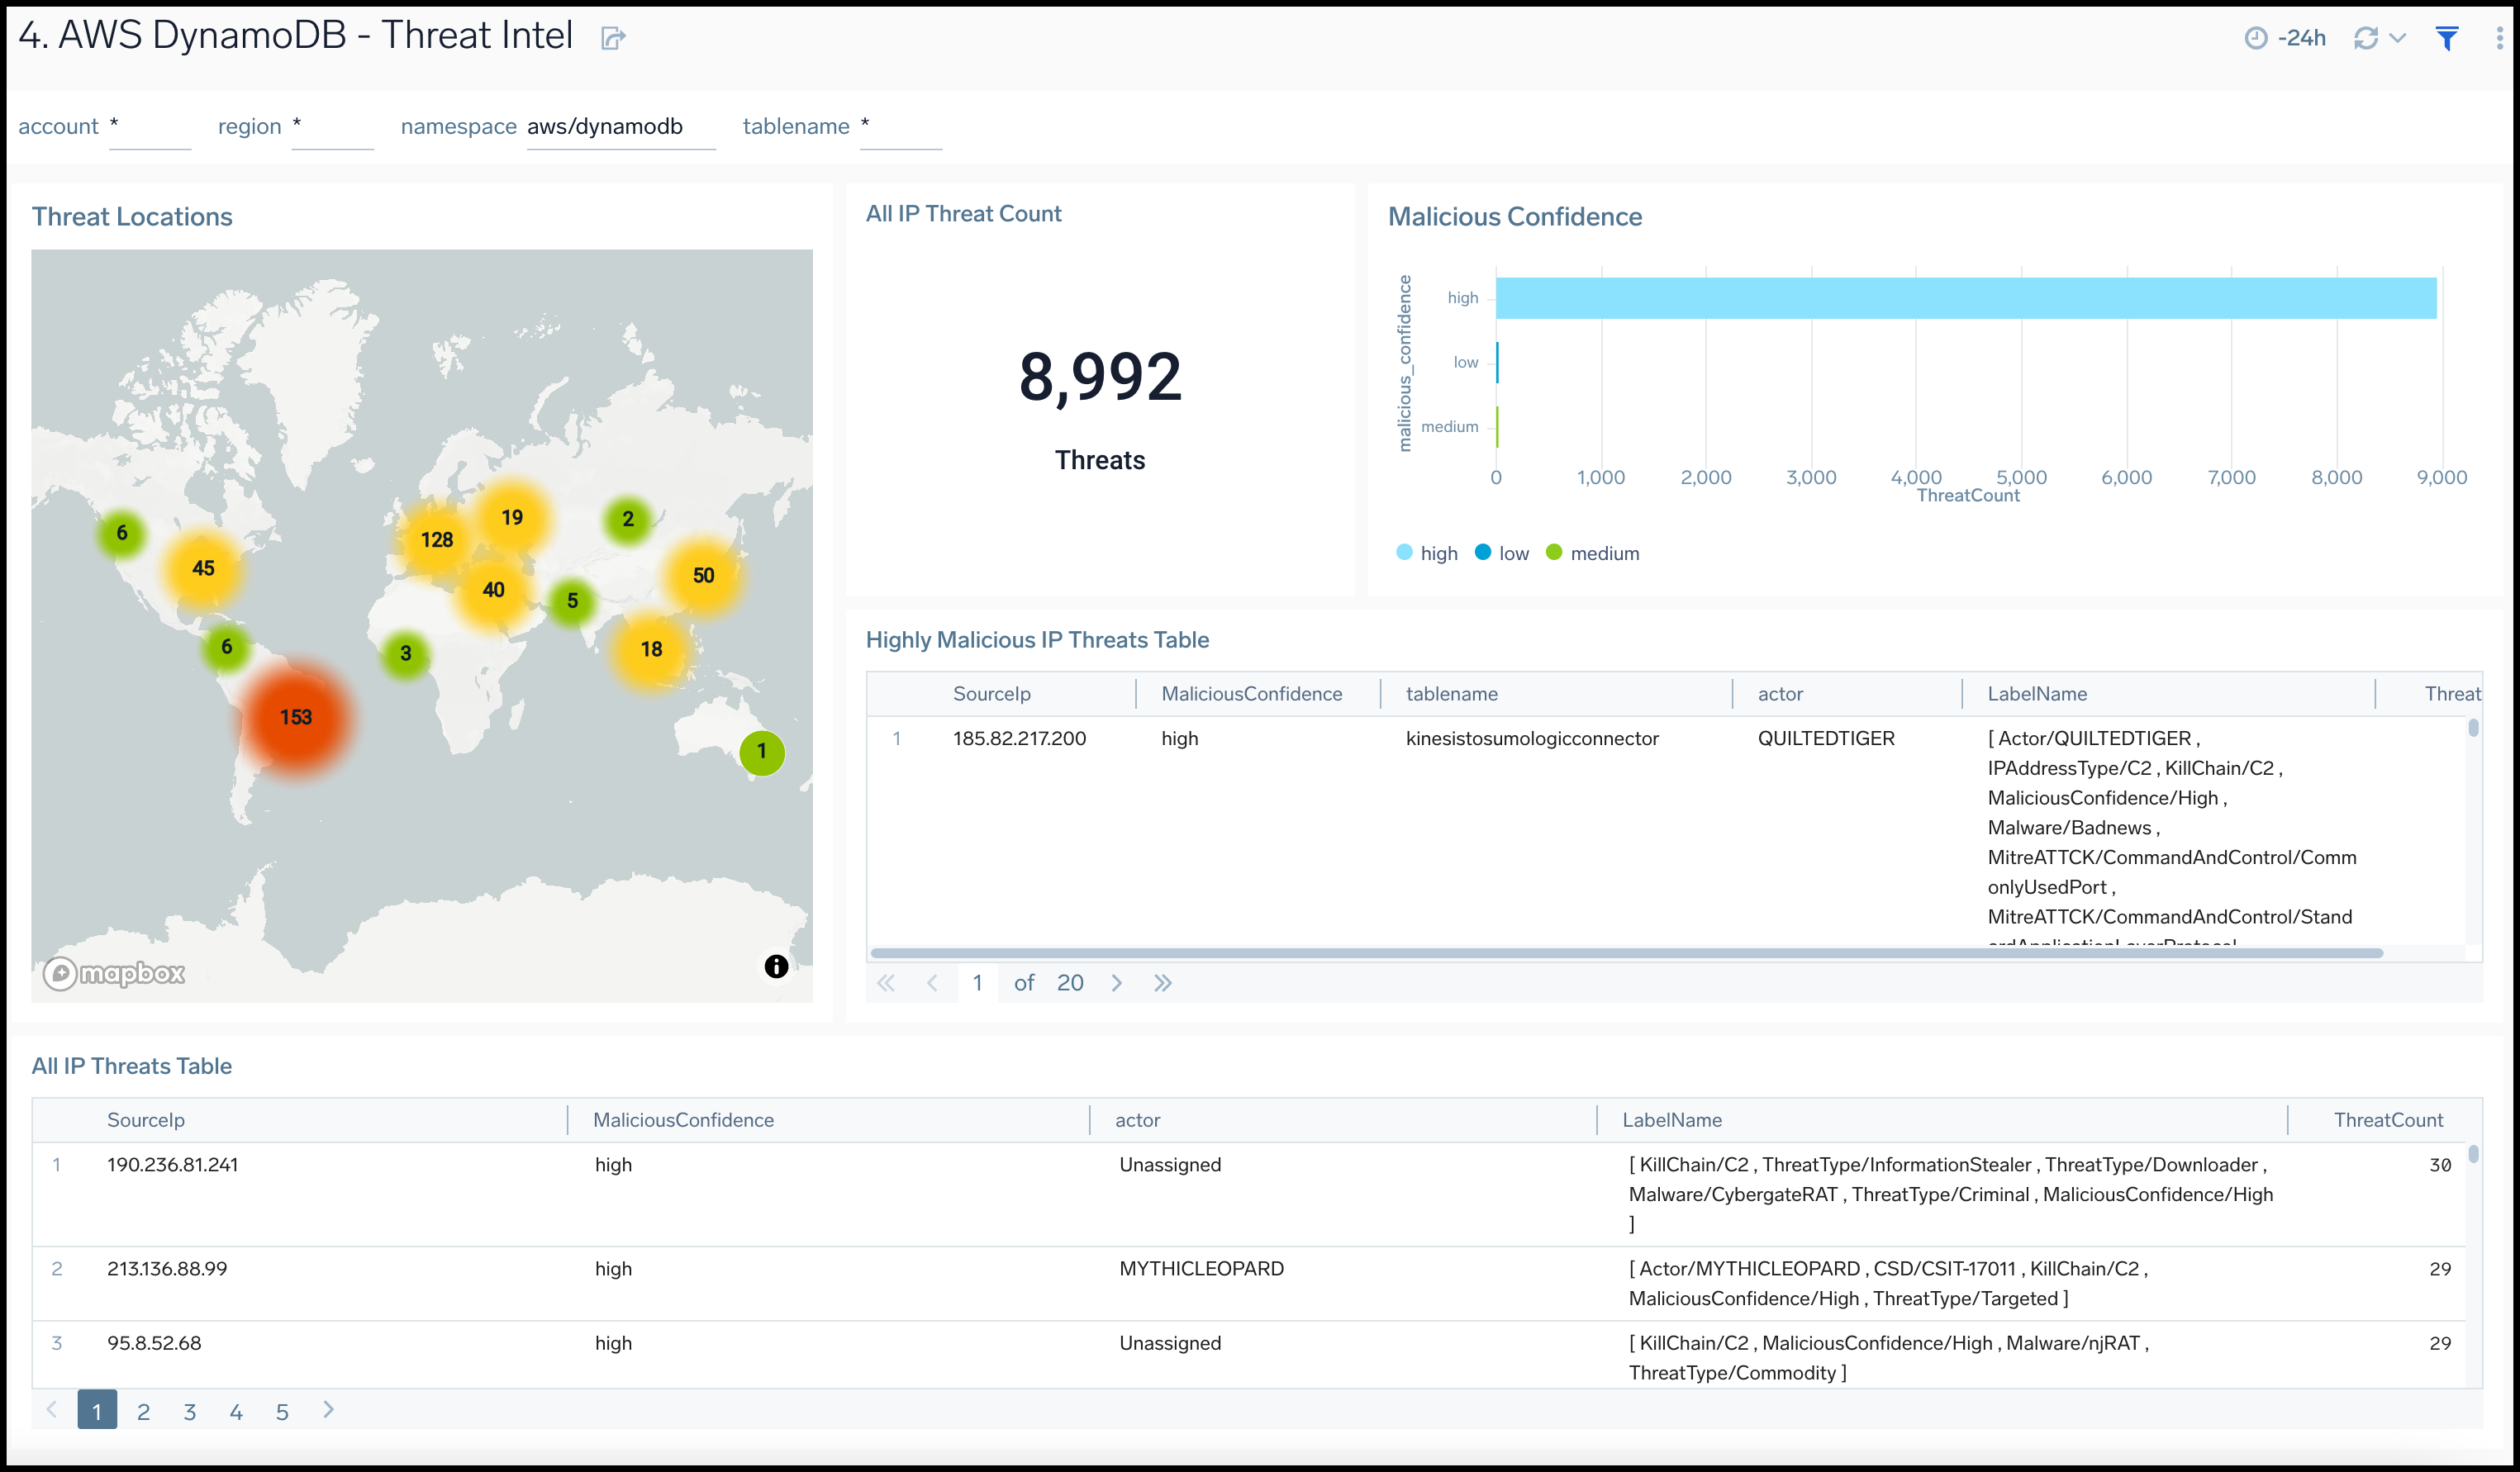
The AWS DynamoDB - Threat Intel dashboard provides insights across your infrastructure for malicious requests to DynamoDB tables.
Use this dashboard to:
- Identify malicious IPs performing operations on DynamoDB tables using Sumo Logic Threat Intel.
Create monitors for Amazon DynamoDB app
From your App Catalog:
- From the Sumo Logic navigation, select App Catalog.
- In the Search Apps field, search for and then select your app.
- Make sure the app is installed.
- Navigate to What's Included tab and scroll down to the Monitors section.
- Click Create next to the pre-configured monitors. In the create monitors window, adjust the trigger conditions and notifications settings based on your requirements.
- Scroll down to Monitor Details.
- Under Location click on New Folder.
note
By default, monitor will be saved in the root folder. So to make the maintenance easier, create a new folder in the location of your choice.
- Enter Folder Name. Folder Description is optional.
tip
Using app version in the folder name will be helpful to determine the versioning for future updates.
- Click Create. Once the folder is created, click on Save.
Amazon DynamoDB alerts
| Name | Description | Alert Condition | Recover Condition |
|---|---|---|---|
AWS DynamoDB - High Account Provisioned Read Capacity | This alert fires when we detect that the average read capacity provisioned for an account for a time interval of 5 minutes is greater than or equal to 80%. | Count > = 80 | Count < 80 |
AWS DynamoDB - High Account Provisioned Write Capacity | This alert fires when we detect that the average write capacity provisioned for an account for a time interval of 5 minutes is greater than or equal to 80%. | Count > = 80 | Count < 80 |
AWS DynamoDB - High Max Provisioned Table Read Capacity | This alert fires when we detect that the average percentage of read provisioned capacity used by the highest read provisioned table of an account for a time interval of 5 minutes is greater than or equal to 80%. | Count > = 80 | Count < 80 |
AWS DynamoDB - High Max Provisioned Table Write Capacity | This alert fires when we detect that the average percentage of write provisioned capacity used by the highest write provisioned table of an account for a time interval of 5 minutes is greater than or equal to 80%. | Count > = 80 | Count < 80 |
AWS DynamoDB - High Read Throttle | This alert fires when we detect that the total read throttle events for a DynamoDB table is high (>5) for a time interval of 5 minutes. | Count > 5 | Count < = 5 |
AWS DynamoDB - High Write Throttle | This alert fires when we detect that the total write throttle events for a DynamoDB table is high (>5) for a time interval of 5 minutes. | Count > 5 | Count < = 5 |
AWS DynamoDB - Multiple Tables deleted | This alert fires when five or more tables are deleted within 15 minutes. | Count > = 5 | Count < 5 |
AWS DynamoDB - System Errors | This alert fires when we detect system errors for a DynamoDB table is high (>10) for a time interval of 5 minutes. | Count > 10 | Count < = 10 |
AWS DynamoDB - High Request Latency | This alert fires when we detect that the average successful request latency for a DynamoDB table is high (>20ms) for a time interval of 5 minutes. High latency indicates potential issues such as hot partitions, oversized items, or degraded table performance. | Count > 20 | Count < = 20 |
Upgrade/Downgrade the Amazon DynamoDB app (Optional)
To update the app, do the following:
Next-Gen App: To install or update the app, you must be an account administrator or a user with Manage Apps, Manage Monitors, Manage Fields, Manage Metric Rules, and Manage Collectors capabilities depending upon the different content types part of the app.
- Select App Catalog.
- In the Search Apps field, search for and then select your app.
Optionally, you can identify apps that can be upgraded in the Upgrade available section. - To upgrade the app, select Upgrade from the Manage dropdown.
- If the upgrade does not have any configuration or property changes, you will be redirected to the Preview & Done section.
- If the upgrade has any configuration or property changes, you will be redirected to the Setup Data page.
- In the Configure section of your respective app, complete the following fields.
- Field Name. If you already have collectors and sources set up, select the configured metadata field name (eg _sourcecategory) or specify other custom metadata (eg: _collector) along with its metadata Field Value.
- Click Next. You will be redirected to the Preview & Done section.
Post-update
Your upgraded app will be installed in the Installed Apps folder and dashboard panels will start to fill automatically.
See our Release Notes changelog for new updates in the app.
To revert the app to a previous version, do the following:
- Select App Catalog.
- In the Search Apps field, search for and then select your app.
- To version down the app, select Revert to < previous version of your app > from the Manage dropdown.
Uninstalling the Amazon DynamoDB app (Optional)
To uninstall the app, do the following:
- Select App Catalog.
- In the 🔎 Search Apps field, run a search for your desired app, then select it.
- Click Uninstall.
Additional resources
- Use the AWS DynamoDB Automation Service Integration to automate response actions directly from Cloud SOAR playbooks.