 Meet the new
 Amazon RDS
Amazon RDS
Amazon Relational Database Service (Amazon RDS) is a managed database service, optimized to run in the cloud. The RDS Amazon Web Service (AWS) simplifies the setup, operation, and scaling of relational database instances for use in applications throughout your infrastructure.
The Sumo Logic Amazon RDS app dashboards provide visibility into the performance and operations of your Amazon Relational Database Service (RDS):
- Preconfigured dashboards allow you to monitor critical metrics of your RDS instance(s) or cluster(s), including CPU, memory, storage, network transmits and receive throughput, read and write operations, database connection count, disk queue depth, and more.
- CloudTrail Audit dashboards help you monitor activities performed on your RDS infrastructure.
- MySQL Logs dashboards help you monitor database errors, slow queries, audit SQL queries, and generic activities.
- PostgreSQL logs dashboard helps you to monitor database errors, slow queries, database security, and query execution timings.
- MSSQL Logs dashboards help you monitor error logs and basic infrastructure details.
- Oracle CloudTrail and CloudWatch Logs dashboards provide monitoring for error logs and essential infrastructure details.
Amazon RDS Proxy
To further enhance performance and availability, Amazon RDS Proxy is a fully managed, highly available proxy that improves scalability and resilience by pooling and sharing DB connections. It reduces failover time by up to 66% and supports IAM and Secrets Manager for secure access. It works with most RDS engines and requires no code changes.
The Sumo Logic Amazon RDS Proxy dashboards provide visibility into the performance of Amazon RDS Proxy, helping improve application scalability, availability, and security. They track key metrics, including connection pooling, client connections, authentication outcomes, TLS usage, and query patterns, to optimize connection management and reduce database load.
Log and metric types
The Sumo Logic app for Amazon RDS uses the following logs and metrics:
- Amazon RDS CloudTrail Logs.
- Publishing RDS CloudWatch Logs, RDS Database logs for Aurora MySQL, RDS MySQL, MariaDB.
- Publishing RDS CloudWatch logs, RDS Database logs for Aurora PostgreSQL, RDS PostgreSQL
- Publishing RDS CloudWatch logs, RDS Database logs for RDS MSSQL
- Publishing RDS CloudWatch logs, RDS Database logs for RDS Oracle
- RDS CloudWatch Instance Level Metrics, RDS CloudWatch Aurora Metrics, Amazon CloudWatch metrics for Performance Insights and Amazon RDS Proxy metrics.
Sample CloudTrail log message
Sample CloudTrail Log Message
{
   "eventVersion":"1.05",
   "userIdentity":
   {
      "type":"IAMUser",
      "principalId":"AIDABCDEFGH4QEWUABG5Q",
      "arn":"arn:aws:iam::951234567898:user/Nitin",
      "accountId":"951234567898",
      "accessKeyId":"ASIABCDEFGHFBOT4FDVK",
      "userName":"Nitin",
      "sessionContext":
      {
         "attributes":
         {
            "mfaAuthenticated":"true","
            creationDate":"2018-10-28T08:16:35Z"
         }
      },
      "invokedBy":"signin.amazonaws.com"
   },
   "eventTime":"2018-10-28T08:55:37Z",
   "eventSource":"rds.amazonaws.com",
   "eventName":"CreateDBCluster",
   "awsRegion":"us-west-1",
   "sourceIPAddress":"140.144.120.190",
   "userAgent":"signin.amazonaws.com",
   "requestParameters":
   {
      "backupRetentionPeriod":1,
      "databaseName":"NitinSampleDB",
      "dBClusterIdentifier":"auroramysql57dbcluster02-cluster",
      "dBClusterParameterGroupName":"default.aurora-mysql5.7",
      "vpcSecurityGroupIds":["sg-0123454e5b1da3aff"],
      "dBSubnetGroupName":"default-vpc-b92fc5d7",
      "engine":"aurora-mysql",
      "engineVersion":"5.7.12",
      "port":3306,
      "masterUsername":"nitin",
      "masterUserPassword":"****",
      "storageEncrypted":true,
      "enableCloudwatchLogsExports":["audit","error","general","slowquery"],
      "engineMode":"provisioned"
   },
   "responseElements":
   {
      "allocatedStorage":1,
      "availabilityZones":["us-west-1a","us-west-1b","us-west-1c"],
      "backupRetentionPeriod":1,
      "databaseName":"NitinSampleDB",
      "dBClusterIdentifier":"auroramysql57dbcluster02-cluster",
      "dBClusterParameterGroup":"default.aurora-mysql5.7",
      "dBSubnetGroup":"default-vpc-b92fc5d7",
      "status":"creating",
      "endpoint":"auroramysql57dbcluster07-cluster.cluster-cp1svq2n34sd.us-west-1.rds.amazonaws.com",
      "readerEndpoint":"auroramysql57dbcluster07-cluster.cluster-ro-cp5svq2n34sd.us-west-1.rds.amazonaws.com",
      "multiAZ":false,
      "engine":"aurora-mysql",
      "engineVersion":"5.7.12",
      "port":3306,
      "masterUsername":"nitin",
      "preferredBackupWindow":"03:25-03:55",
      "preferredMaintenanceWindow":"tue:03:58-tue:04:28",
      "readReplicaIdentifiers":[],
      "dBClusterMembers":[],
      "vpcSecurityGroups":[{"vpcSecurityGroupId":"sg-012345e5b1da3aff","status":"active"}],
      "hostedZoneId":"Z2R2ITUGPM61AM",
      "storageEncrypted":true,
      "kmsKeyId":"arn:aws:kms:us-west-1:951234567898:key/9a3d8016-4cdb-478f-a3a4-9a310fc25307",
      "dbClusterResourceId":"cluster-AVPSEUMFISOMMXXVGKL4GBUC2E",
      "dBClusterArn":"arn:aws:rds:us-west-1:951234567898:cluster:auroramysql57dbcluster02-cluster",
      "associatedRoles":[],
      "iAMDatabaseAuthenticationEnabled":false,
      "clusterCreateTime":"Oct 28, 2018 8:55:35 AM",
      "enabledCloudwatchLogsExports":["audit","error","general","slowquery"],
      "engineMode":"provisioned",
      "deletionProtection":false
   },
   "requestID":"2cbb7974-b79c-4121-aed1-5ebe8f945b72",
   "eventID":"7e554be7-0a00-4f8f-9e56-a2d54519fff9",
   "eventType":"AwsApiCall","recipientAccountId":"951234567898"
}
Sample Database CloudWatch logs
Recent Warning Events (Error Logs - MySQL)
{
   "timestamp":1682606169000,
   "message":"2023-04-27 14:36:09 14487 [Warning] Access denied for user 'dev'@'1.2.3.4' (using password: YES)",
   "logStream":"mariadb-inst-1",
   "logGroup":"/aws/rds/instance/mariadb-inst-1/error"
}
{
   "timestamp":1682935054360,
   "message":"# Time: 2023-05-01T09:57:34.360484Z\n# User@Host: rdstopmgr[rdstopmgr] @ ip-10-1-0-158 [10.1.0.158]  Id:    16\n# Query_time: 0.006554  Lock_time: 0.000000 Rows_sent: 1  Rows_examined: 1\nSET timestamp=1682935054;\nselect gtid_subtract('fb39aa1b-dd09-11ed-a14e-162ba7864699:1-642', 'fb39aa1b-dd09-11ed-a14e-162ba7864699:1-642');",
   "logStream":"rds-mysql-instance-3",
   "logGroup":"/aws/rds/cluster/rds-mysql/slowquery"
}
{
   "timestamp":1682935339000,
   "message":"20230501 10:02:19,ip-10-1-0-50,rdsadmin,localhost,7,585281,QUERY,,'select * from information_schema.rds_events_threads_waits_current where (type <> \\'BACKGROUND\\' or name = \\'thread/sql/slave_sql\\') and command <> \\'Sleep\\'',0,,",
   "logStream":"rds-dbinstance-1",
   "logGroup":"/aws/rds/instance/rds-dbinstance-1/audit"}
{
   "timestamp":1682935339000,
   "message":"20230501 10:02:19,ip-10-1-0-50,rdsadmin,localhost,7,585281,QUERY,,'select * from information_schema.rds_events_threads_waits_current where (type <> \\'BACKGROUND\\' or name = \\'thread/sql/slave_sql\\') and command <> \\'Sleep\\'',0,,",
   "logStream":"rds-dbinstance-1",
   "logGroup":"/aws/rds/instance/rds-dbinstance-1/audit"
}
{"timestamp":1705670443000,
"message":"2024-01-19 13:20:43 UTC:223.233.86.169(31944):postgresql@postgres:[3075]:LOG:  duration: 2001.036 ms  statement: SELECT * from large_table"}
{"timestamp":1705859815000,
"message":"2024-01-21 17:56:55 UTC:3.92.54.14(57164):postgresql@postgresql:[43627]:FATAL:  password authentication failed for user \"postgresql\""
}
{"timestamp":1716444593813,
  "message":"2024-05-23 06:09:53.813 Logon       Login failed for user 'john'. Reason: Password did not match that for the login provided. [CLIENT: 213.252.232.134]",
  "logStream":"mssql-database-1",
  "logGroup":"/aws/rds/instance/mssql-database-1/error"}
{"timestamp":1748608138203,
  "message":"2025-05-30T12:28:53.383Z [INFO] Database \"database-4\" at 172.31.1.99:3306 is now available for read/write access from 172.31.46.36. Version: MySQL: 8.0.41.",
  "logStream":"proxy-1747819191933-database-4",
  "logGroup":"/aws/rds/proxy/proxy-1747819191933-database-4"}
Sample queries
Namespace=aws/rds metric=DatabaseConnections statistic=average account=* region=* dbidentifier=* | avg by account, region, dbidentifier
"\"eventsource\":\"rds.amazonaws.com\"" errorCode account=dev Namespace=aws/rds region=us-east-1
| json "eventTime", "eventName", "eventSource", "awsRegion", "userAgent", "recipientAccountId", "userIdentity", "requestParameters", "responseElements", "errorCode", "errorMessage",  "requestID", "sourceIPAddress" as eventTime, event_name, event_source, Region, user_agent, accountId1, userIdentity, requestParameters, responseElements, error_code, error_message, requestID, src_ip nodrop
| where event_source = "rds.amazonaws.com" and !isEmpty(error_code)
| json field=userIdentity "accountId", "arn", "userName", "type" as accountId, arn, username, type nodrop
| parse field=arn ":assumed-role/*" as user nodrop | parse field=arn "arn:aws:iam::*:*" as accountId, user nodrop
| if (isEmpty(error_code), "Success", "Failure") as event_status
| json field=requestParameters "dBInstanceIdentifier", "resourceName", "dBClusterIdentifier" as dBInstanceIdentifier1, resourceName, dBClusterIdentifier1 nodrop
| json field=responseElements "dBInstanceIdentifier" as dBInstanceIdentifier3 nodrop | json field=responseElements "dBClusterIdentifier" as dBClusterIdentifier3 nodrop
| parse field=resourceName "arn:aws:rds:*:db:*" as f1, dBInstanceIdentifier2 nodrop | parse field=resourceName "arn:aws:rds:*:cluster:*" as f1, dBClusterIdentifier2 nodrop
| if (resourceName matches "arn:aws:rds:*:db:*", dBInstanceIdentifier2, if (!isEmpty(dBInstanceIdentifier1), dBInstanceIdentifier1, dBInstanceIdentifier3) ) as dBInstanceIdentifier
| if (resourceName matches "arn:aws:rds:*:cluster:*", dBClusterIdentifier2, if (!isEmpty(dBClusterIdentifier1), dBClusterIdentifier1, dBClusterIdentifier3) ) as dBClusterIdentifier
| count as Frequency by error_code
| top 10 error_code by Frequency, error_code asc
account=* region=* namespace=aws/rds dbidentifier=* =/aws/rds*Error Warning
| json "message" nodrop | if ( matches "{*", message, ) as message
| parse field=message "[*] *" as LogLevel, msgDetails
| where LogLevel = "Warning"
| timeslice 1s
| count as frequency by _timeslice, msgDetails
| sort by _timeslice, msgDetails asc
account=* region=* namespace=aws/rds dbidentifier=* =/aws/rds*SlowQuery "User@Host" "Query_time"
| json "message" nodrop | if ( matches "{*", message, ) as message
| parse regex field=message "(?<query_block># User@Host:[\S\s]+?SET timestamp=\d+;[\S\s]+?;)" multi
| parse regex field=query_block "# User@Host:\s*\S+?\[(?<user>\S*?)\]\s*@\s*\[(?<ip_addr>\S*?)\]\s*Id:\s*(?<Id>\d*)" nodrop
| parse regex field=query_block "# User@Host:\s*\S+?\[(?<user>\S*?)\]\s*@\s*(?<host_name>\S+)\s\[(?<ip_addr>\S*?)\]\s+Id:\s*(?<Id>\d+)"
| where user != "rdsadmin" and !isEmpty(user) and user matches "*"
| where !isEmpty(ip_addr) and ip_addr matches "*"
| parse regex field=query_block "# Query_time:\s+(?<query_time>[\d.]*)\s+Lock_time:\s+(?<lock_time>[\d.]*)\s+Rows_sent:\s+(?<rows_sent>[\d]*)\s+Rows_examined:\s+(?<rows_examined>[\d]*)" nodrop
| parse regex field=query_block "SET timestamp=(?<set_timestamp>\d*);\n(?<sql_cmd>[\s\S]*);" nodrop
| parse regex field=sql_cmd "[^a-zA-Z]*(?<sql_cmd_type>[a-zA-Z]+)\s*"
| avg(query_time) as avgTime, sum(query_time) as totalTime, min(query_time) as minTime, max(query_time) as maxTime, avg(rows_examined) as avgRowsExamined, avg(rows_sent) as avgRowsSent, avg(Lock_Time) as avgLockTime, count as frequency group by sql_cmd, user, ip_addr
| sort by avgTime | limit 100
account=* region=* dbidentifier=* namespace=aws/rds =/aws/rds*Audit CONNECT
| json "message" nodrop | if ( matches "{*", message, ) as message
| parse field=message ",*,*,*,*,*,*,*,*,*" as instance, user, host, f1, f2, action, database, f3, f4 nodrop
| where user matches "*" and host matches "*"
| where action = "CONNECT"
| count as eventCount
account=* region=* dbidentifier=* namespace=aws/rds =/aws/rds*general Connect
| json "message" nodrop | if ( matches "{*", message, ) as message
| parse regex field=message "\s*\d+\s+(?<cmdType>\S+)\s*(?<command>.*)"
| where cmdType = "Connect"
| parse field=command "*@* on using *" as user, host, connectionType nodrop
| parse field=command "*@* on * using *" as user, host, database, connectionType nodrop
| parse field=command "Out\t*@*:*" as user, host, port nodrop
| parse field=message "Access denied for user '*'@'*' (using *: *)" as user, host, autenticationType, flag nodrop
| if (message matches "*Access denied*", "Fail", "Success") as connectionStatus
| count as count by user
| sort by count, user asc | limit 20
account=* region=* namespace=aws/rds =/aws/rds*postgresql dbidentifier=* duration
| json "message" nodrop | if ( matches "{*", message, ) as message
| parse field=message "* * *:*(*):*@*:[*]:*:*" as date,time,time_zone,host,thread_id,user,database,processid,severity,msg
| parse regex field=msg "duration: (?<execution_time_ms>[\S]+) ms (?<query>.+)"
| where database matches "{{database}}" and user matches "{{user}}" and host matches "{{host}}"
| number (execution_time_ms)
| where execution_time_ms > {{slow_query_latency_ms}}
| count
account=* region=* namespace=aws/rds =/aws/rds*postgresql dbidentifier=* "authentication failed"
| json "message" nodrop | if ( matches "{*", message, ) as message
| parse field=message "* * *:*(*):*@*:[*]:*:*" as date,time,time_zone,host,thread_id,user,database,processid,severity,msg
| where user matches "{{user}}" and database matches "{{database}}" and host matches "{{host}}"
| where msg matches "*authentication failed*"
| count as %"Count"
account=* region=* namespace=aws/rds dbidentifier=* =/aws/rds/*Error Logon Login failed for user
| json "message" nodrop | if ( matches "{*", message, ) as message
| parse field=message "* Logon Login failed for user '*'. Reason: * [CLIENT: *]" as time, user, reason, client_ip
| where user != "rdsadmin" and !isEmpty(user) and user matches "*"
| where !isEmpty(client_ip) and client_ip matches "*"
| timeslice 1s
| count as frequency by _timeslice, user, dbidentifier, reason, client_ip
| sort by _timeslice
account=* region=* namespace=aws/rds "\"eventSource\":\"rds.amazonaws.com\"" !errorCode
| json "eventTime", "eventName", "eventSource", "awsRegion", "userAgent", "recipientAccountId", "userIdentity", "requestParameters", "responseElements", "errorCode", "errorMessage",  "requestID", "sourceIPAddress" as eventTime, event_name, event_source, Region, user_agent, accountId1, userIdentity, requestParameters, responseElements, error_code, error_message, requestID, src_ip nodrop
| where event_source = "rds.amazonaws.com"
| json "requestParameters.engine", "responseElements.engine" as engine1, engine2 nodrop
| if (!isEmpty(engine1), engine1, engine2) as engine
| where !isEmpty(engine) and engine contains "oracle"
| json field=userIdentity "accountId", "arn", "userName", "type" as accountId, arn, username, type nodrop
| parse field=arn ":assumed-role/*" as user nodrop | parse field=arn "arn:aws:iam::*:*" as accountId, user nodrop
| json field=requestParameters "dBInstanceIdentifier", "resourceName", "dBClusterIdentifier" as dBInstanceIdentifier1, resourceName, dBClusterIdentifier1 nodrop
| json field=responseElements "dBInstanceIdentifier" as dBInstanceIdentifier3 nodrop
| parse field=resourceName "arn:aws:rds:*:db:*" as f1, dBInstanceIdentifier2 nodrop
| if (resourceName matches "arn:aws:rds:*:db:*", dBInstanceIdentifier2, if (!isEmpty(dBInstanceIdentifier1), dBInstanceIdentifier1, dBInstanceIdentifier3) ) as dBInstanceIdentifier
| where !isEmpty(dBInstanceIdentifier)
| count as freq by engine, dBInstanceIdentifier
| sort by dBInstanceIdentifier, engine asc
| fields -freq
account=* region=* namespace=aws/rds dbidentifier=* =/aws/rds/*alert ORA-*
| json "message" nodrop | if ( matches "{*", message, ) as message
| parse regex field=message "(?<oraerr>ORA-\d{5}): (?<oramsg>.*)" multi
| timeslice 1s
| count as eventCount by oraerr, _timeslice
| transpose row _timeslice column oraerr
account=* region=* namespace=aws/rds proxyname=* =/aws/rds/proxy/* "Database" and "is now available for read/write access"
| json "message" nodrop | if ( matches "{*", message, ) as message
| parse regex field=message "\"(?<dbidentifier>[^\"]+)\" at (?<db_host>\d{1,3}(?:\.\d{1,3}){3}):(?<db_port>\d+) is now available for read/write access from (?<client_ip>\d{1,3}(?:\.\d{1,3}){3})(?:\. Version: (?<db_version>.+))?" nodrop
| sort by desc
| dedup proxyname, dbidentifier, db_host, db_port, db_version
| count as count by , proxyname, dbidentifier, db_host, db_port, db_version
| formatDate(, "yyyy/MM/dd HH:mm:ss Z") as time
| fields -
| fields time, proxyname, dbidentifier, db_host, db_port, db_version
Collecting logs and metrics for Amazon RDS
Configure Hosted Collector
When you create an AWS Source, you'll need to identify the Hosted Collector you want to use or create a new Hosted Collector. Once you create an AWS Source, associate it with a Hosted Collector. For instructions, see Configure a Hosted Collector and Source.
Collect Amazon RDS CloudWatch metrics
Sumo Logic supports collecting metrics using one of the following source types:
-
Configure an AWS Kinesis Firehose for Metrics Source (recommended)
-
Configure an Amazon CloudWatch Source for Metrics
noteNamespace for Amazon RDS service is AWS/RDS.
Follow the steps below to add custom metadata fields with your metrics:
- Click +Add Field under Metadata. Each field consists of a name (key) and a corresponding value.
- Create a field named
accountand assign it a value that represents a friendly name or alias to your AWS account from which metrics are collected. This value will appear in the AWS Observability view, and metrics can be queried using theaccountfield.
- After adding fields, check their status indicators:
 A green check mark indicates the field exists and is enabled in the Fields table schema.
 An orange exclamation icon indicates the field does not exist or is disabled in the schema.
- You will have the option to automatically add or enable the field.
- If a field is sent but not present or enabled in the schema, it is ignored and marked as Dropped.
Collect Amazon RDS CloudTrail logs
Prerequisites
- Grant Sumo Logic access to an Amazon S3 bucket.
- Create a trail for your AWS account.
- Confirm that logs are being delivered to the Amazon S3 bucket.
Namespace for Amazon RDS service is AWS/RDS.
Follow the steps below to collect logs for Amazon RDS:
- Configure a CloudTrail Logs Source.
- Add custom metadata fields with your logs:
- Click +Add Field under Metadata. Each field consists of a name (key) and a corresponding value.
- Create a field named
accountand assign it a value that represents a friendly name or alias to your AWS account from which logs are collected. This value will appear in the AWS Observability view, and logs can be queried using theaccountfield. - After adding fields, check their status indicators:
- A green check mark indicates the field exists and is enabled in the Fields table schema.
- An orange exclamation icon indicates the field does not exist or is disabled in the schema.
- You will have the option to automatically add or enable the field.
- If a field is sent but not present or enabled in the schema, it is ignored and marked as Dropped.
Collect Amazon RDS CloudWatch logs
Prerequisites
Esure you enable the following parameters before collecting the Amazon RDS CloudWatch Logs.
-
MySQL
- Amazon RDS MySQL supports publishing the following MySQL logs to CloudWatch:
- Error (enabled by default)
- SlowQuery
- Audit
- General
- You can enable the following additional parameters at DB Parameter group for better slow query and general log monitoring:
log_slow_admin_statementslog_slow_slave_statementslog_replica_updateslog_queries_not_using_indexeslog_output to FILEgeneral_log(to enable, set value to1)
- You can configure DB Cluster Parameter group to enable audit logs:
server_audit_loggingserver_audit_logs_uploadserver_audit_events
- Amazon RDS MySQL supports publishing the following MySQL logs to CloudWatch:
-
PostgreSQL
- Amazon RDS PostgreSQL supports publishing the following PostgreSQL logs to CloudWatch:
- postgresql.log
- You can enable the following additional parameters at DB parameter group or DB Cluster Parameter group for slow query, connection, and query execution timing related logs.
log_connectionslog_durationlog_min_duration_statementto a value (in milliseconds) over which statements will be logged for any query taking more time than the given value.
noteWe recommend not setting
log_statementto any value other than none (default value), since it will slow query logs and ingestion will increase significantly. - Amazon RDS PostgreSQL supports publishing the following PostgreSQL logs to CloudWatch:
-
MSSQL
- Amazon RDS MSSQL supports publishing the following MSSQL logs to CloudWatch:
- Agent
- Error
- Amazon RDS MSSQL supports publishing the following MSSQL logs to CloudWatch:
-
Oracle
- Amazon RDS Oracle supports publishing the following Oracle logs to CloudWatch:
- Alert logs
- Audit files
- Listener logs
- Amazon RDS Oracle supports publishing the following Oracle logs to CloudWatch:
-
Proxy
- Amazon RDS Proxy supports publishing the following Proxy logs to CloudWatch:
- Enhanced logs
noteThe log group for an AWS RDS Proxy is created automatically. You do not need to create it manually. When you create an RDS Proxy, AWS automatically creates a CloudWatch Log Group to store logs related to the proxy’s activity.
- Amazon RDS Proxy supports publishing the following Proxy logs to CloudWatch:
Sumo Logic supports collecting logs from Amazon CloudWatch using one of the following methods:
- AWS Kinesis Firehose for Logs. Configure an AWS Kinesis Firehose for Logs Source (Recommended)
- Lambda Log Forwarder. There are two ways to set up the Lambda Log Forwarder:
- With CloudFormation. Configure the collection of Amazon CloudWatch logs using Sumo Logic-provided CloudFormation template, as described in Amazon CloudWatch Logs.
- Without CloudFormation. Configure the collection of Amazon CloudWatch Logs using a Lambda function, as described in Collect Amazon CloudWatch Logs using a Lambda Function.
Follow the steps below to add custom fields when configuring the CloudWatch log source:
- Click +Add Field under Metadata. Each field consists of a name (key) and a corresponding value.
- Create a field named
accountand assign it a value that represents a friendly name or alias to your AWS account from which metrics are collected. This value will appear in the AWS Observability view, and logs can be queried using theaccountfield.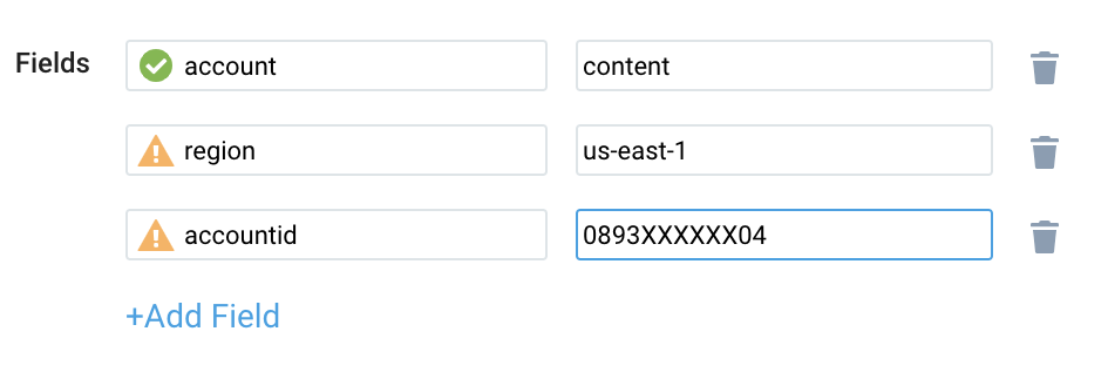
- Add a
regionfield and assign it the value of the respective AWS region where the Lambda function exists. - Add an
accountIdfield and assign it the value of the respective AWS account ID being used. - After adding fields, check their status indicators:
- A green check mark indicates the field exists and is enabled in the Fields table schema.
- An orange exclamation icon indicates the field does not exist or is disabled in the schema.
- You will have the option to automatically add or enable the field.
- If a field is sent but not present or enabled in the schema, it is ignored and marked as Dropped.
Centralized AWS CloudTrail log collection
In case you have a centralized collection of CloudTrail logs and are ingesting them from all accounts into a single Sumo Logic CloudTrail log source, create the following Field Extraction Rule to map a proper AWS account(s) friendly name/alias. Create it if not already present / update it as required.
Rule Name: AWS Accounts
Applied at: Ingest Time
Scope (Specific Data): _sourceCategory=aws/observability/cloudtrail/logs
Parse Expression
Enter a parse expression to create an “account” field that maps to the alias you set for each sub-account. For example, if you used the “dev” alias for an AWS account with ID "528560886094" and the “prod” alias for an AWS account with ID "567680881046", your parse expression would look like:
| json "recipientAccountId"
// Manually map your AWS account ID with the AWS account alias you set up earlier for the individual child account
| "" as account
| if (recipientAccountId = "528560886094",  "dev", account) as account
| if (recipientAccountId = "567680881046",  "prod", account) as account
| fields account
Installing the RDS app
Now that you have set up a collection for Amazon RDS, install the Sumo Logic app to use the pre-configured dashboards that provide visibility into your environment for real-time analysis of overall usage.
To install the app, do the following:
Next-Gen App: To install or update the app, you must be an account administrator or a user with Manage Apps, Manage Monitors, Manage Fields, Manage Metric Rules, and Manage Collectors capabilities depending upon the different content types part of the app.
- Select App Catalog.
- In the 🔎 Search Apps field, run a search for your desired app, then select it.
- Click Install App.
note
Sometimes this button says Add Integration.
- Click Next in the Setup Data section.
- In the Configure section of your respective app, complete the following fields.
- Field Name. If you already have collectors and sources set up, select the configured metadata field name (eg _sourcecategory) or specify other custom metadata (eg: _collector) along with its metadata Field Value.
- Click Next. You will be redirected to the Preview & Done section.
Post-installation
Once your app is installed, it will appear in your Installed Apps folder, and dashboard panels will start to fill automatically.
Each panel slowly fills with data matching the time range query received since the panel was created. Results will not immediately be available but will be updated with full graphs and charts over time.
As part of the app installation process, the following content will be created by default along with dashboards and monitor template:
Fields
accountName / alias to the AWS account.accountidAWS account id.regionThe region to which the resource name belongs to.namespaceNamespace for Amazon RDS service is aws/rds.dbidentifierThe RDS database instance identifier.dBInstanceIdentifierThe identifier of the RDS DB instance.dBClusterIdentifierThe identifier of the RDS DB cluster.proxynameThe name of the RDS Proxy.
Field Extraction Rule(s)
The FER AwsObservabilityRDSCloudTrailLogsFER to extract fields region, namespace, dBInstanceIdentifier, dBClusterIdentifier, dbidentifier, proxyname, and accountid will be created as a part of app installation.
The FER AwsObservabilityRDSCloudWatchLogsFER to extract fields namespace, dbidentifier, and proxyname will be created as a part of app installation.
Metric Rules
The Metric Rules AwsObservabilityRDSClusterMetricsRule and AwsObservabilityRDSInstanceMetricsRule for the aws/rds namespace will be created as a part of app installation.
As a best practice, do not delete or modify any fields, Field Extraction Rules (FERs), or Metric Rules created during the app installation. If you need to make updates, contact the Sumo Logic Support team.
Viewing the RDS dashboards
We highly recommend you view these dashboards in the AWS Observability view of the AWS Observability solution.
Overview
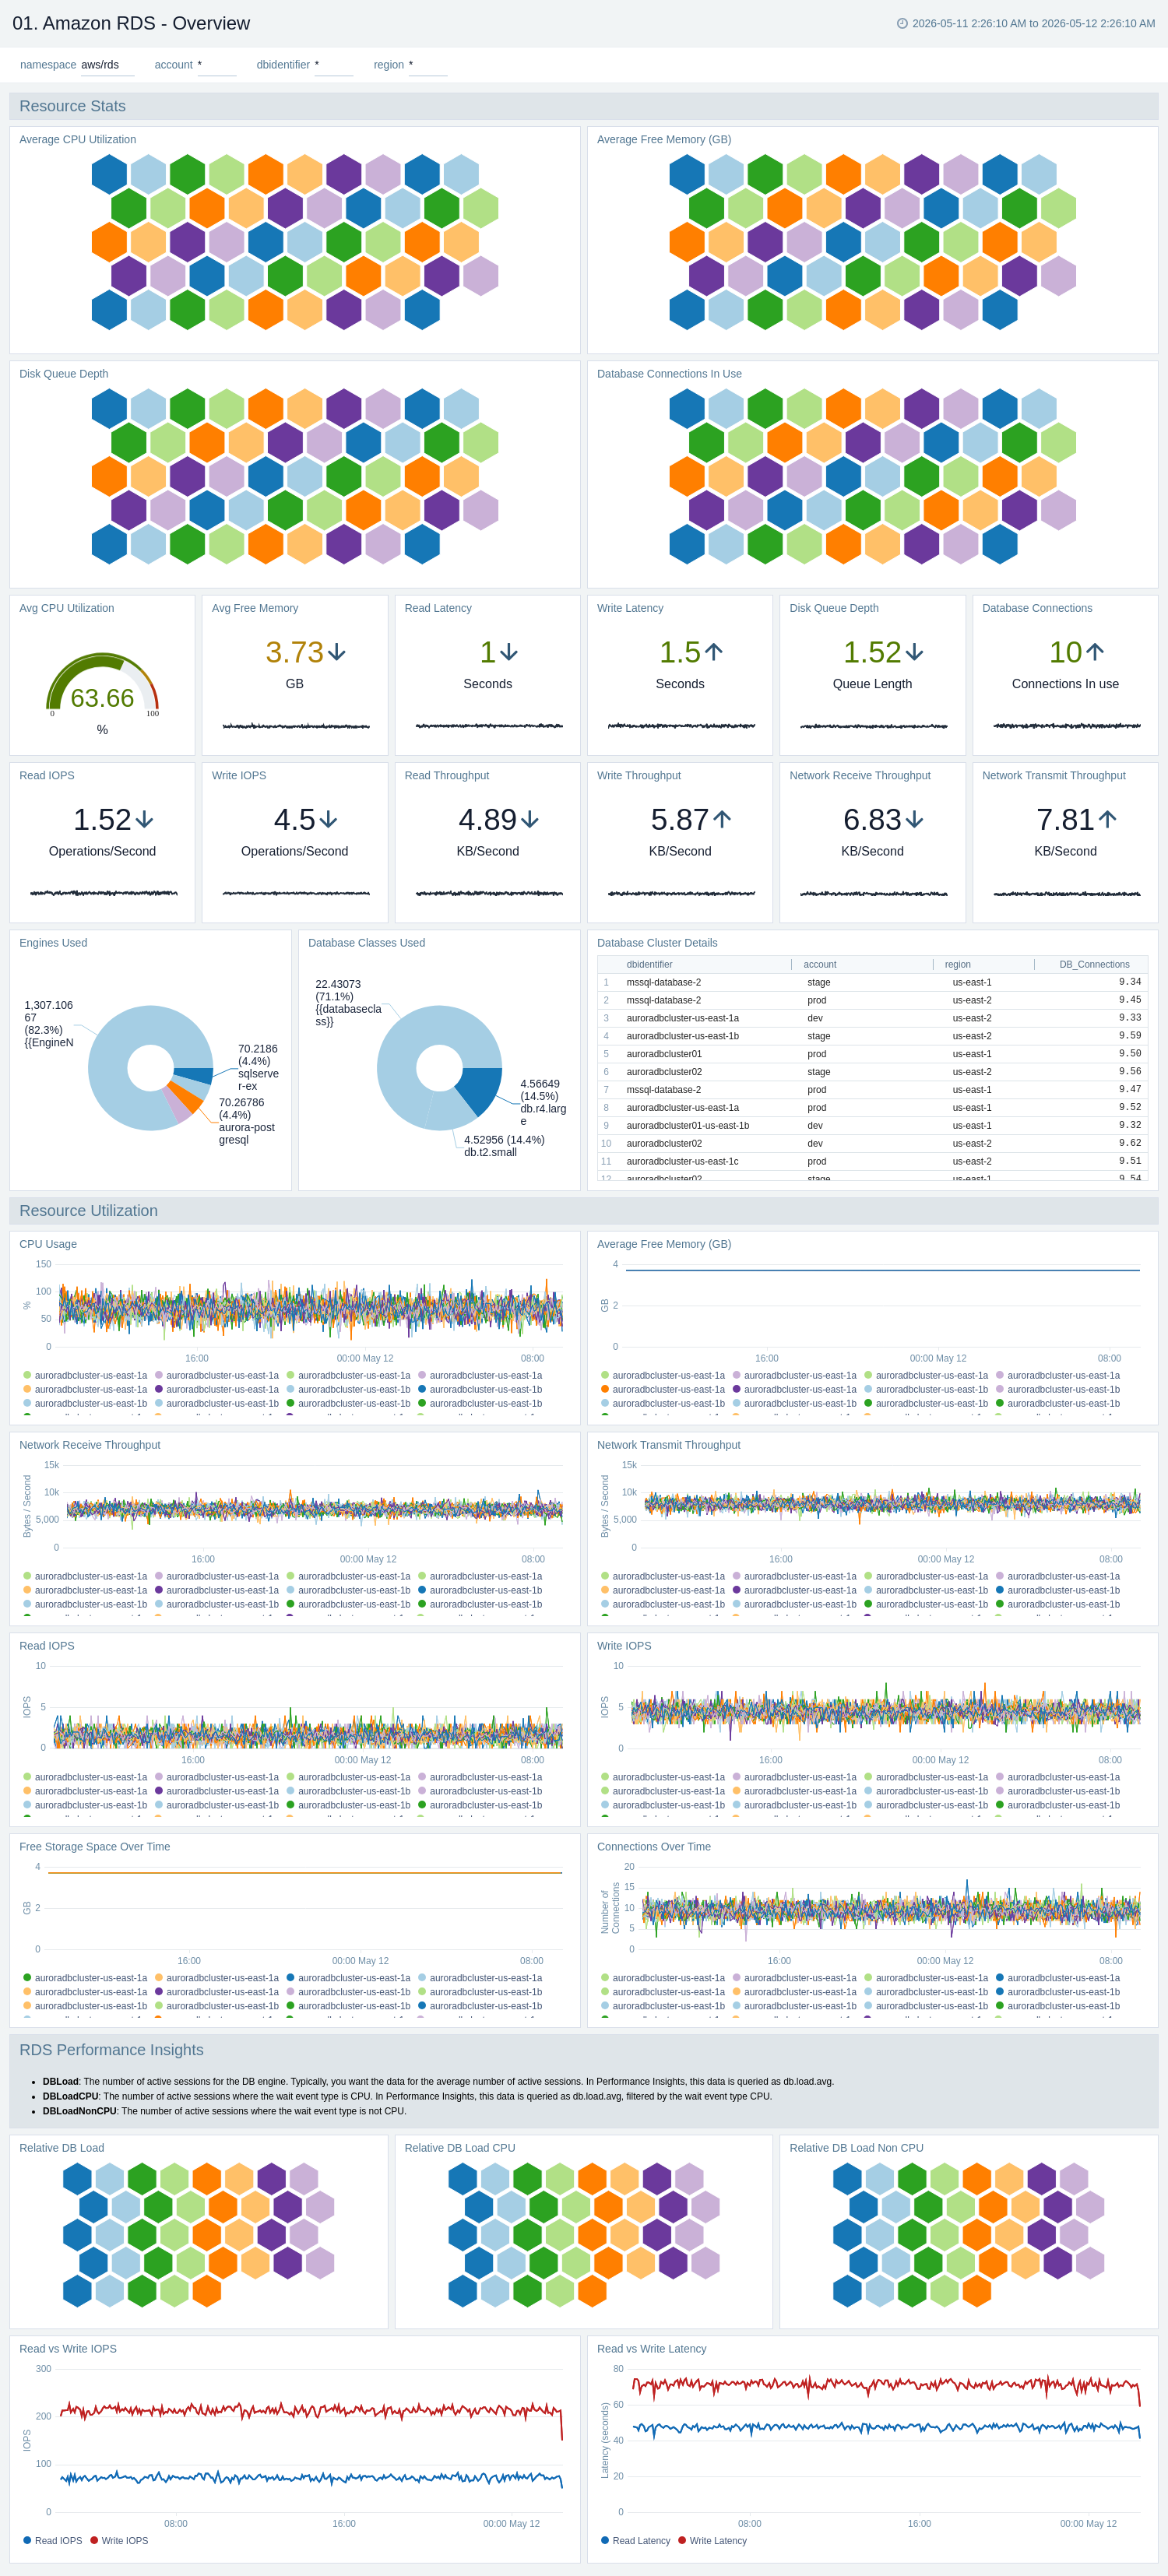
The Amazon RDS - Overview dashboard provides insights into RDS resource statistics and utilization throughout your infrastructure, including CPU, memory, latency, storage, and network throughput.
Use this dashboard to:
- Get a high-level overview of your Amazon RDS infrastructure.
- Quickly identify problems in resource utilization.
- Monitor database performance insights such as relative CPU load, non-CPU load, and overall database load.
CloudTrail Audit Events
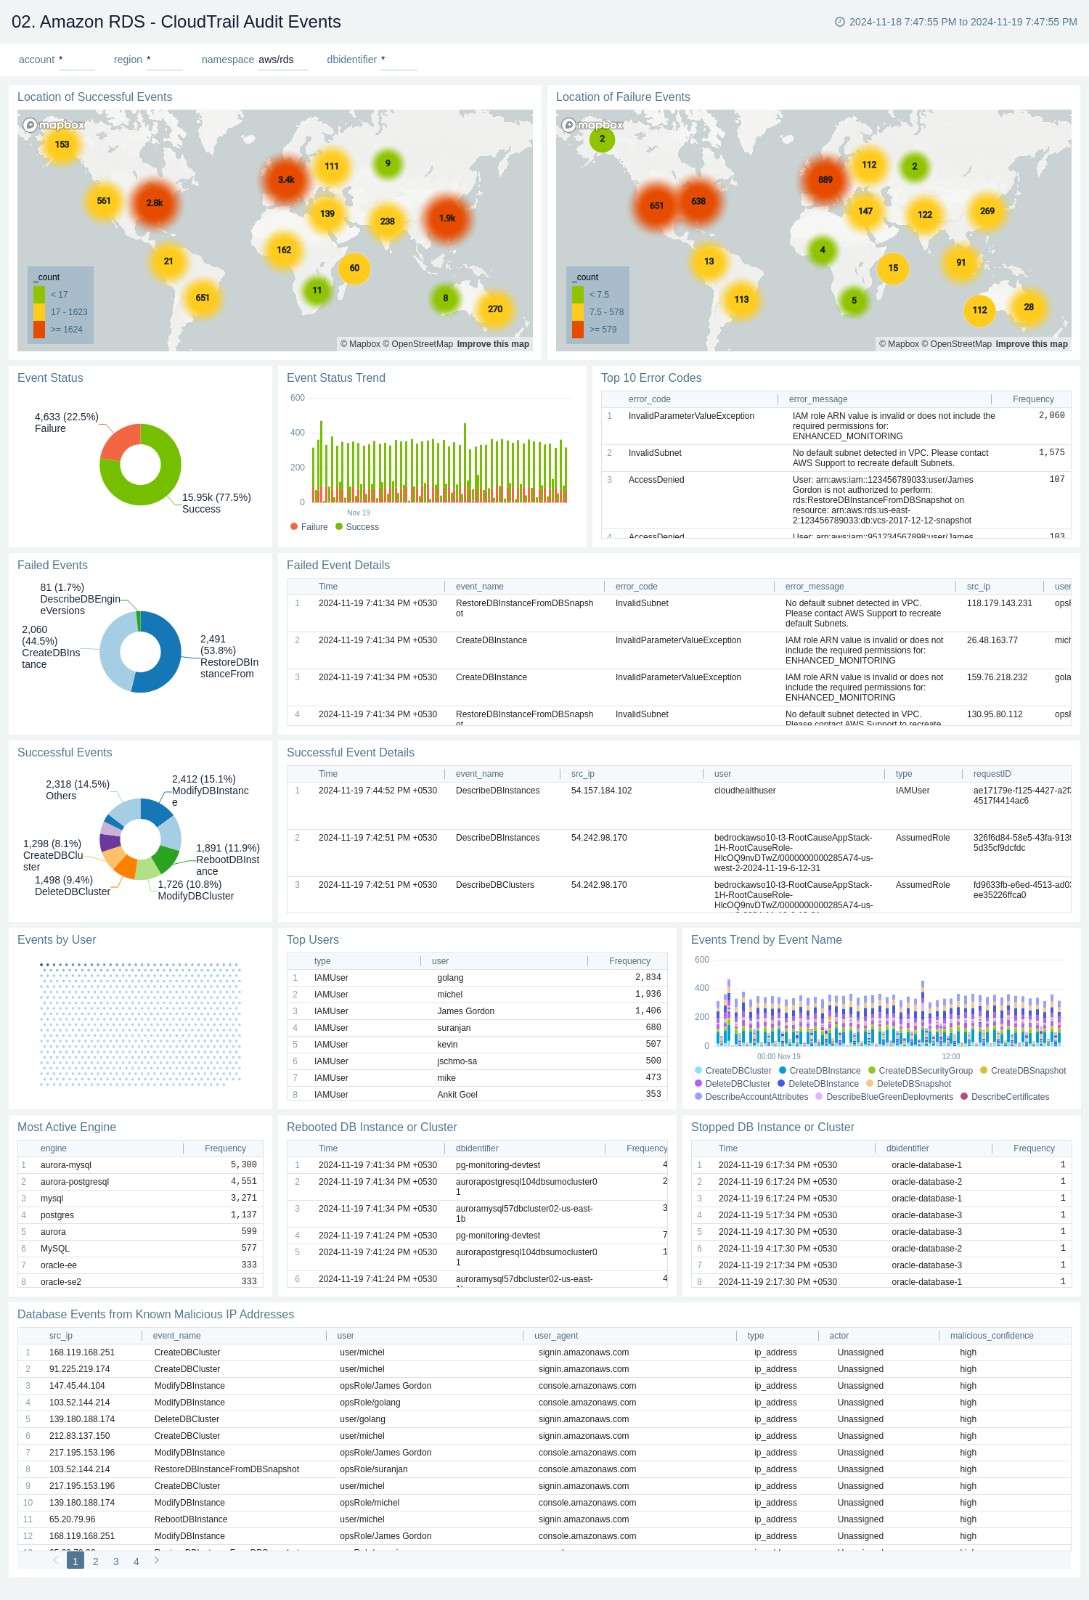
The Amazon RDS - CloudTrail Audit Events dashboard provides insights into audit events of your database instances and clusters.
Use this dashboard to:
- Monitor Amazon RDS-related audit logs using CloudTrail Events.
- Monitor locations of successful and failed Amazon RDS user activity events.
- Monitor the most active users working on RDS infrastructure, database engines used in the infrastructure, and various events invoked on RDS clusters.
- Monitor requests from malicious IP addresses using Sumo Logic’s Threat Intel.
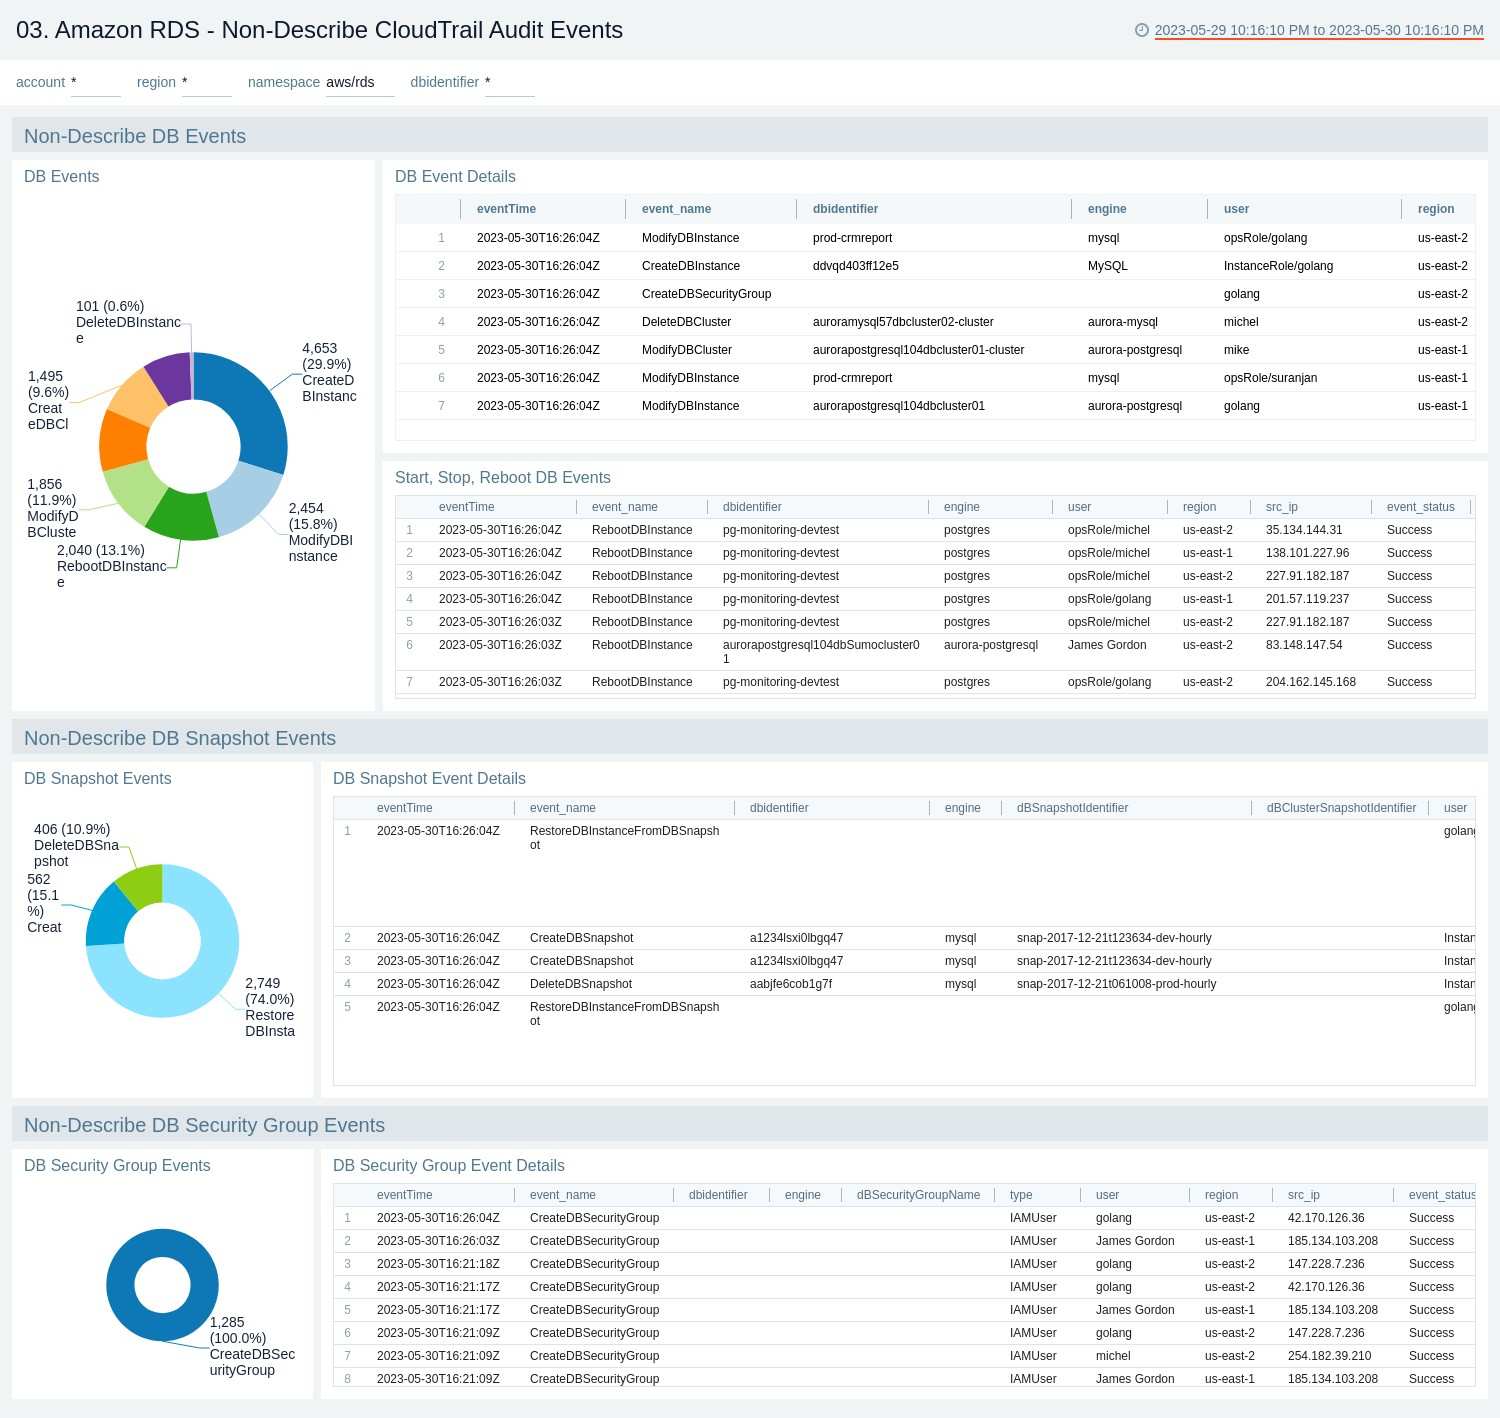
Non-Describe CloudTrail Audit Events
The Amazon RDS - Non-Describe CloudTrail Audit Events dashboard provides statistical and detailed insights into Non-Describe DB Instance, Snapshot, Cluster, and Security group events.
Use this dashboard to:
- Monitor Amazon RDS-related non-describe audit logs using CloudTrail Events.
- Monitor and track create, delete, update, start, stop, and reboot types of events on RDS instances and clusters.
- Monitor and track snapshot-related events performed on RDS instances.
- Monitor and track changes to security groups associated with your RDS infrastructure.
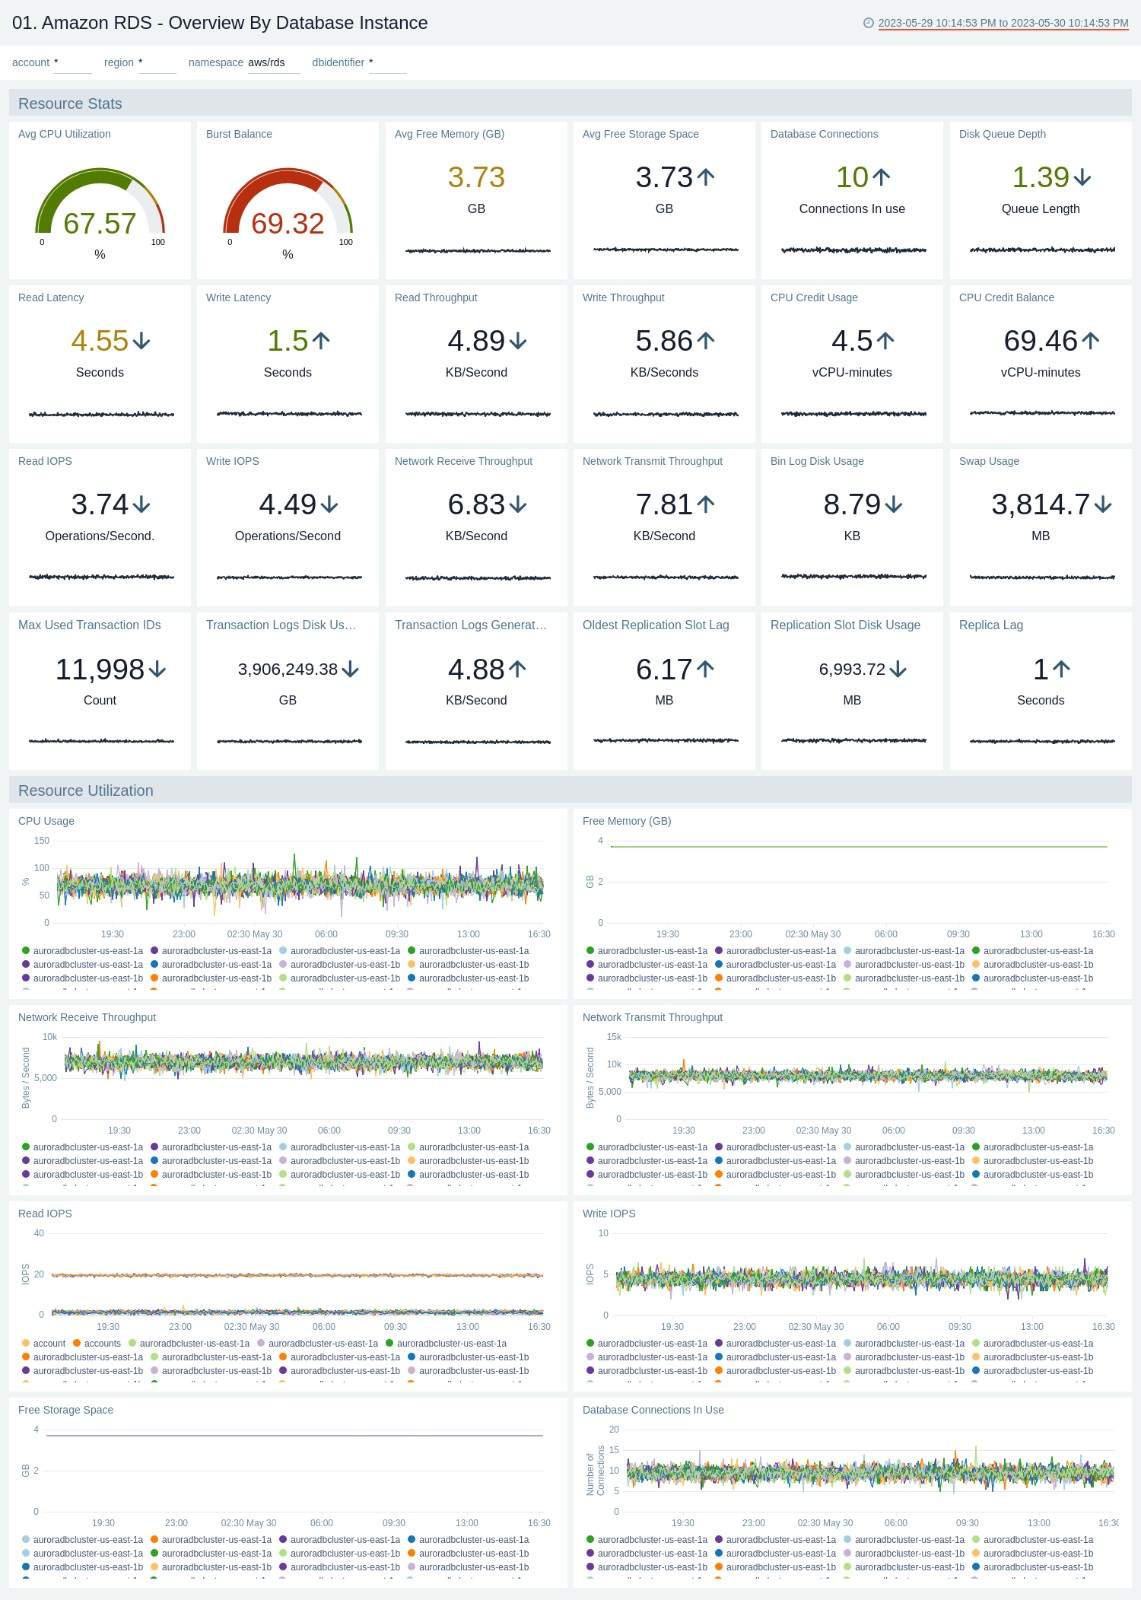
Overview By Database Instance
The Amazon RDS - Overview By Database Instance dashboard provides insights into resource statistics and utilization per database instance throughout your infrastructure. Panels display data for CPU, memory, latency, storage, and network throughput per database instance.
Use this dashboard to:
- Quickly identify performance or resource utilization issues in your RDS clusters.
- Monitor resource utilization with trend panels for CPU usage, available memory, network receive and transmit throughput, read and write IOPS, available free storage, and database connections across your Amazon RDS clusters and database instances.
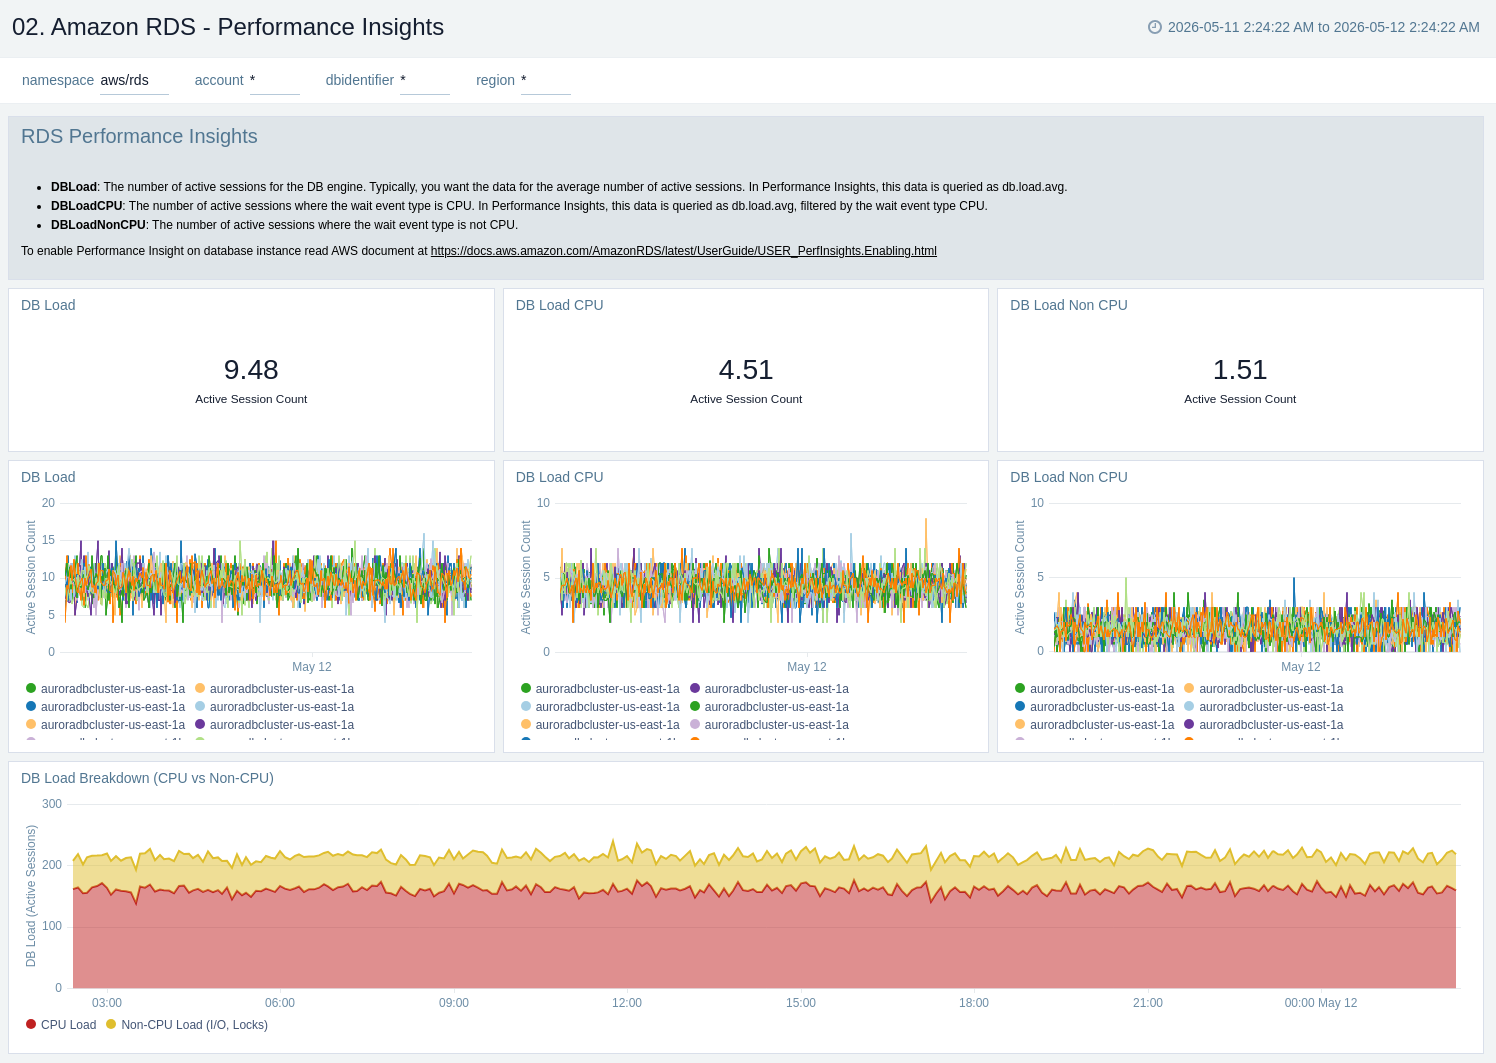
Performance Insights
The Amazon RDS - Performance Insights dashboard provides intuitive performance data from throughout your RDS infrastructure across CPU load, non-CPU load, active sessions, and performance trends.
Use this dashboard to:
- Monitor Amazon RDS DB instance loads to analyze and troubleshoot database performance.
- Identify when the CPU is overloaded, so you can throttle connections to the instance, tune SQL queries with a high CPU load, or consider a larger instance class to remedy the situation.
- Identify high and consistent instances of any wait state (Non-CPU Load) that indicate potential bottlenecks or resource contention issues that need to be resolved, which can be an issue even when the load doesn't exceed maximum CPU.
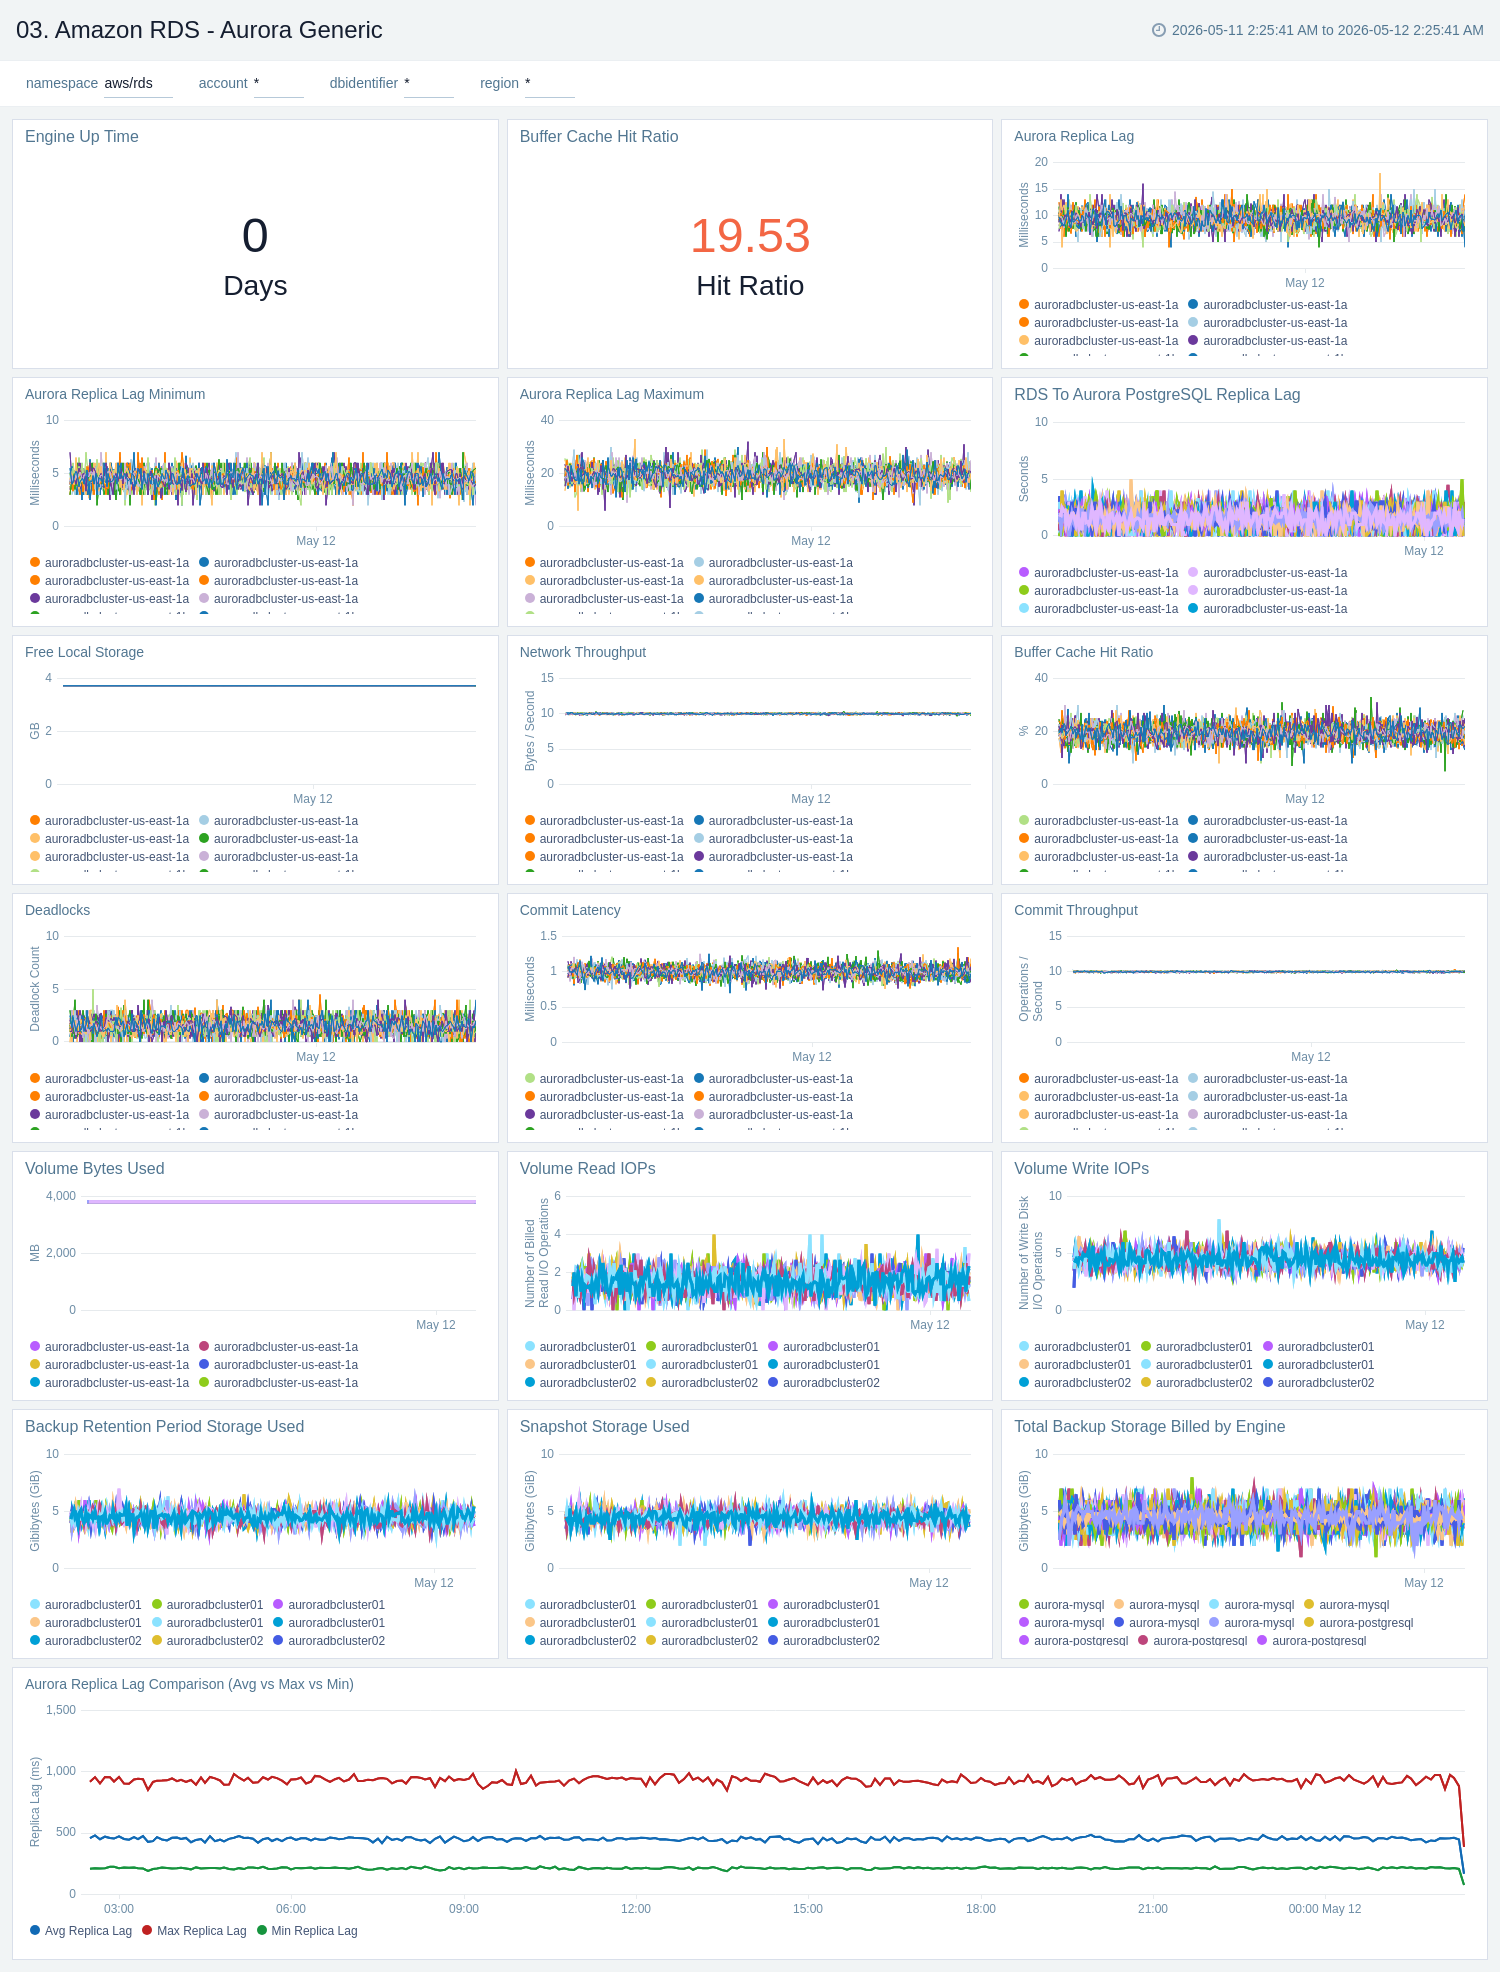
03. Amazon RDS Aurora Generic
The Amazon RDS - Aurora Generic dashboard provides generic AWS Aurora performance statistics across your infrastructure for uptime, replica lag, latency, network throughput, volume, and storage.
Use this dashboard to:
- Monitor common health and performance metrics of your RDS Amazon Aurora MySQL/PostgreSQL cluster.
- Monitor the lag when replicating updates from a primary instance.
- Monitor the uptime of a database instance.
- Monitor the amount of storage used to ensure monitoring costs.
- Monitor the percentage of requests that are served by the buffer cache to identify potential performance optimizations.
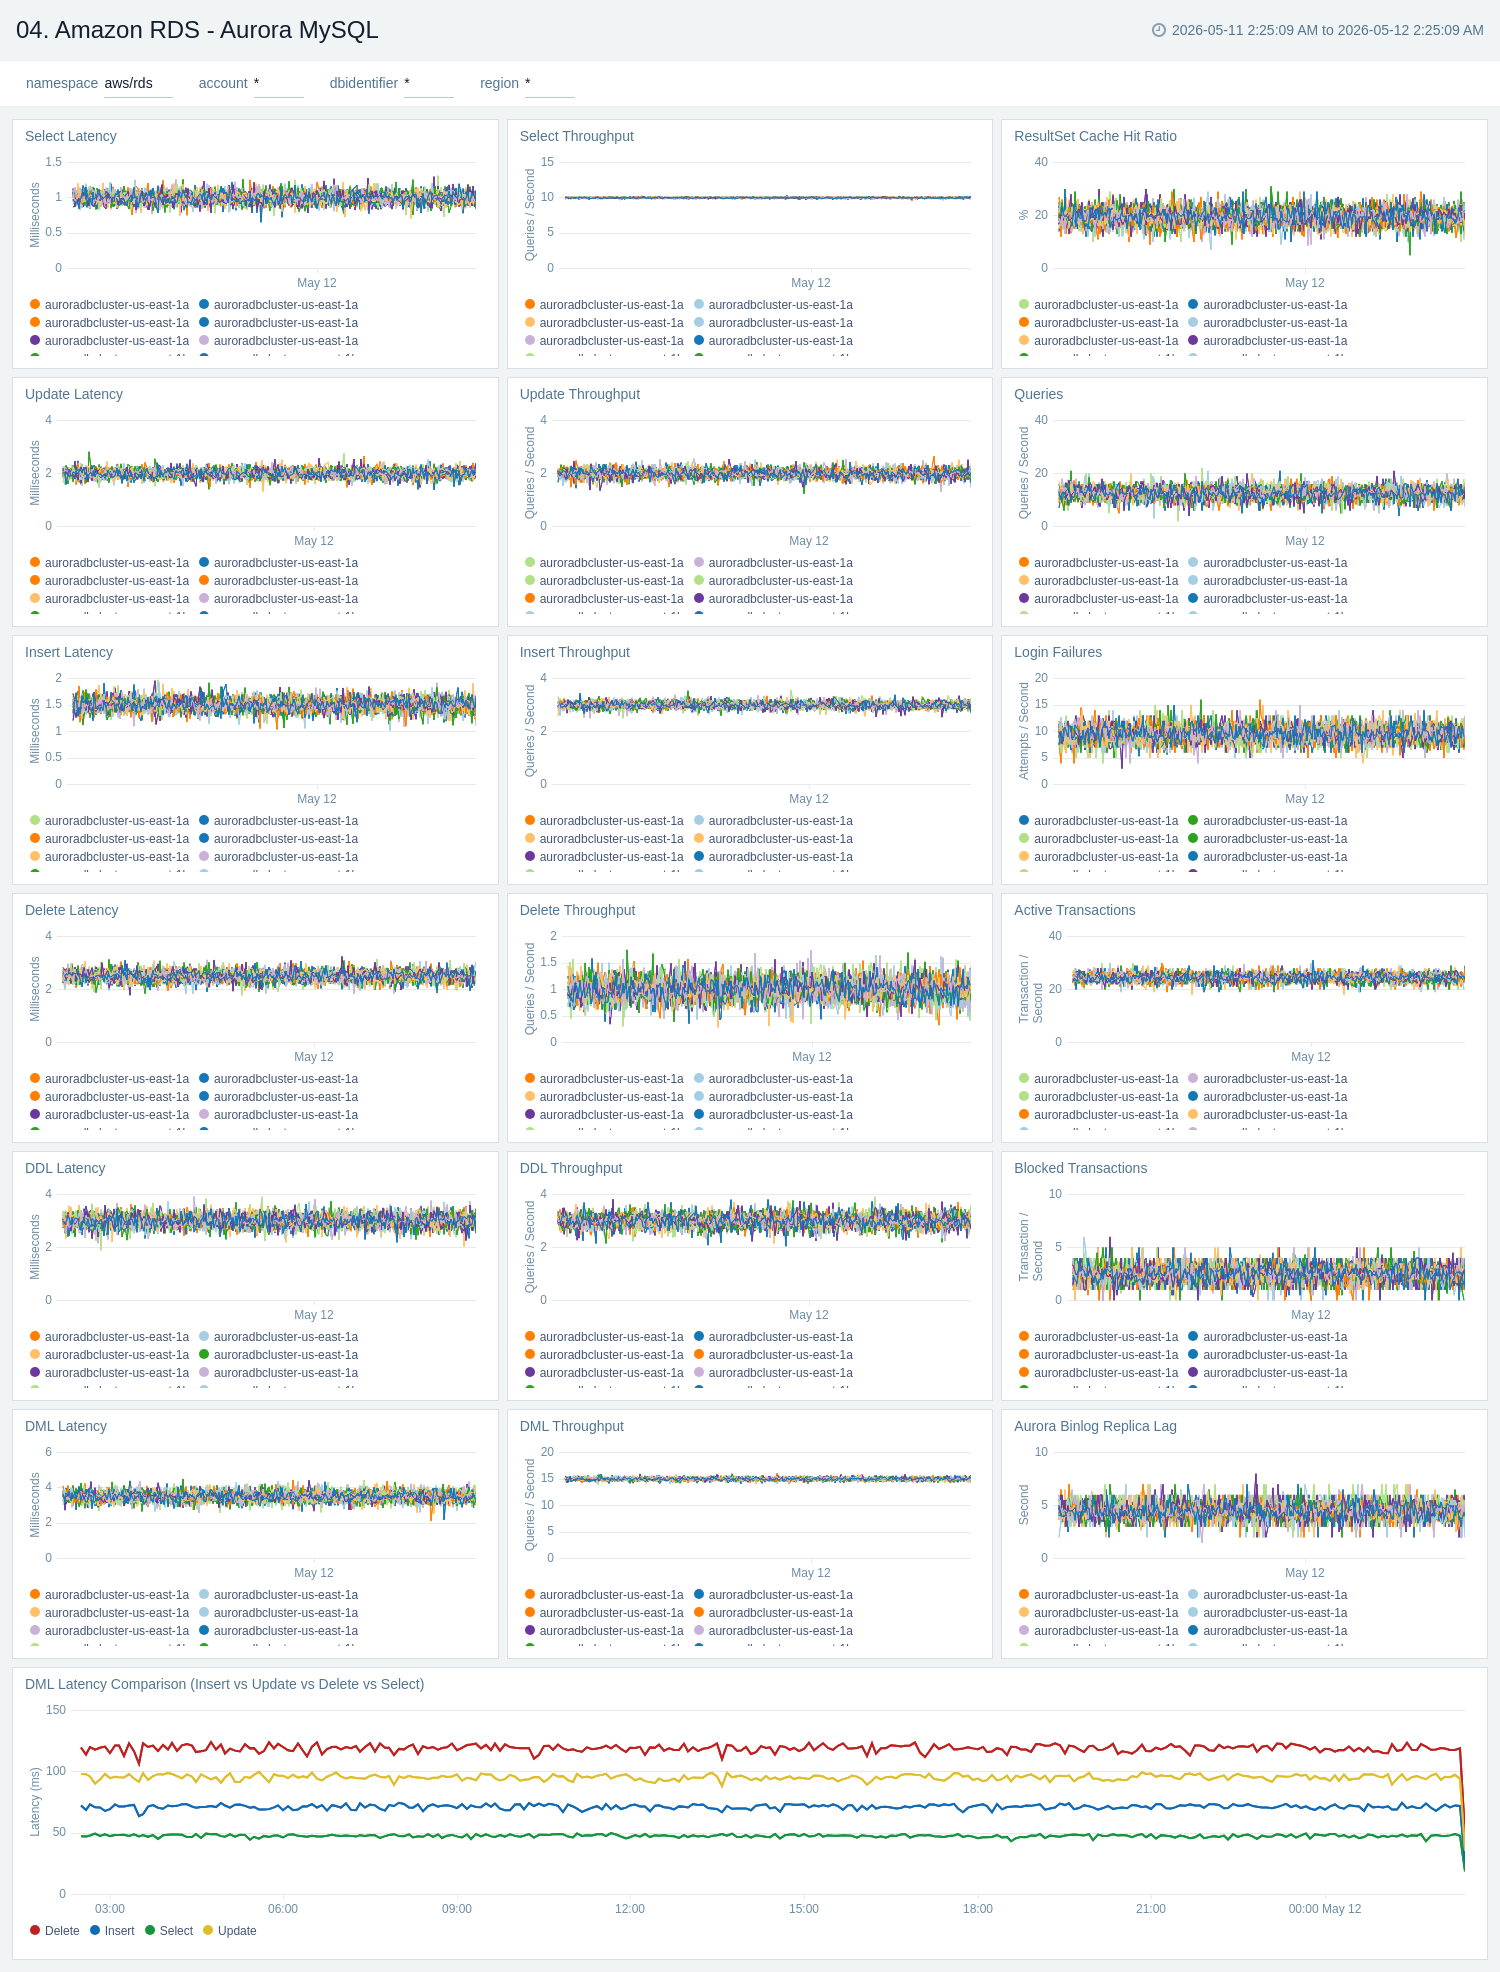
Aurora MySQL
The Amazon RDS - Aurora MySQL dashboard provides intuitive Aurora MySQL performance data from across your infrastructure for latency, throughput, active and blocked transactions, queries, login failures, and replica lag.
Use this dashboard to:
- Monitor the health and performance of your RDS Amazon Aurora MySQL instances and cluster.
- Monitor the throughput and latency associated with various types of queries executed on an Aurora MySQL instance.
- Monitor active transactions, blocked transactions, and the rate of queries being executed.
- Monitor replica lag between Aurora DB clusters that are replicating across different AWS Regions.
- Monitor the number of login failures to the database for security monitoring.
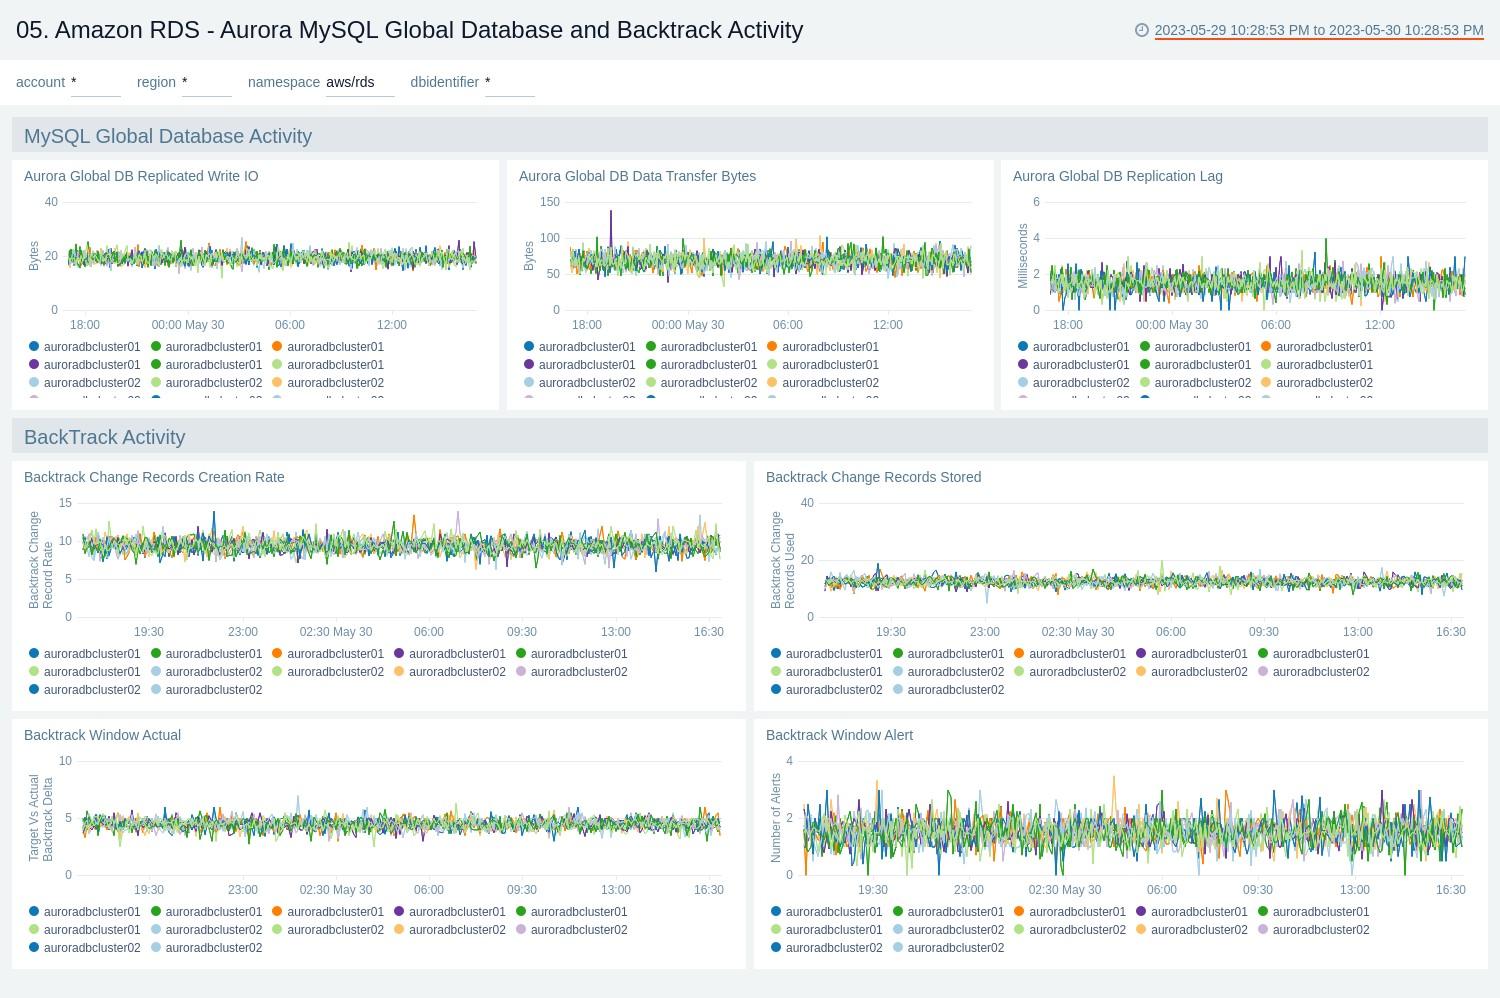
Aurora MySQL Global Database and BackTrack Activity
The Amazon RDS - Aurora MySQL Global Database and BackTrack Activity dashboard provides insights into Aurora MySQL performance data from across your infrastructure for Global Database activity and Backtrack activity.
Use this dashboard to:
- Monitor Backtrack and Amazon Aurora Global database activity.
- Monitor BackTrack change records and the backtrack window of your RDS Amazon Aurora MySQL cluster.
- Monitor the amount of lag (in milliseconds) when replicating updates from the primary AWS Region for your Aurora Global database.
- Monitor the amount of redo log data that is transferred from the master AWS region to secondary AWS regions.
- Monitor the number of write I/O operations replicated from the primary AWS region to the cluster volume in a secondary AWS region in an Aurora Global Database. The billing calculations for the primary AWS region in a global database use AuroraGlobalDBReplicatedWriteIO to account for cross-region replication within the global database.
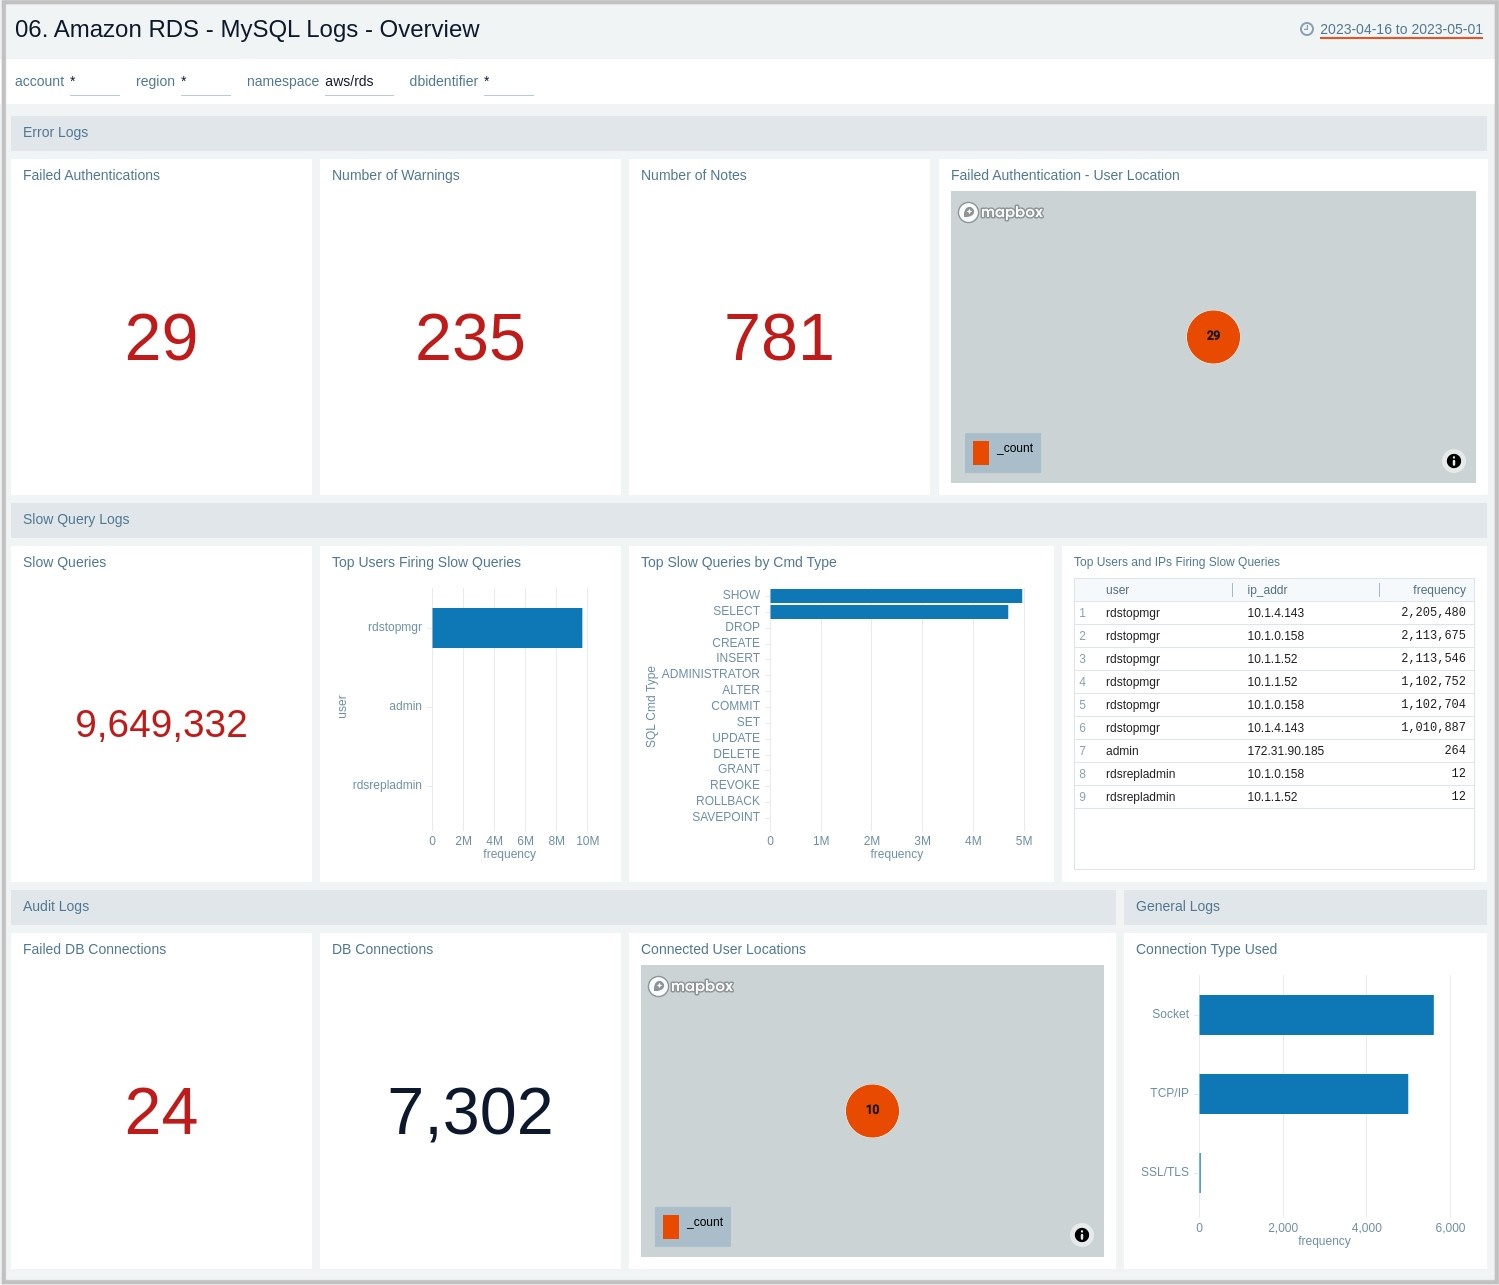
MySQL Logs - Overview
The Amazon RDS - MySQL Logs - Overview dashboard provides a high-level analysis of database activity with details on authentication, connections, users, and slow query events using RDS CloudWatch logs.
Use this dashboard to:
- Identify Authentication Failures.
- Get the number of slow queries, associated users, and client hosts firing them.
- Get the number of failed and successful DB connections.
- Get a quick breakdown of the protocol used for database connections.
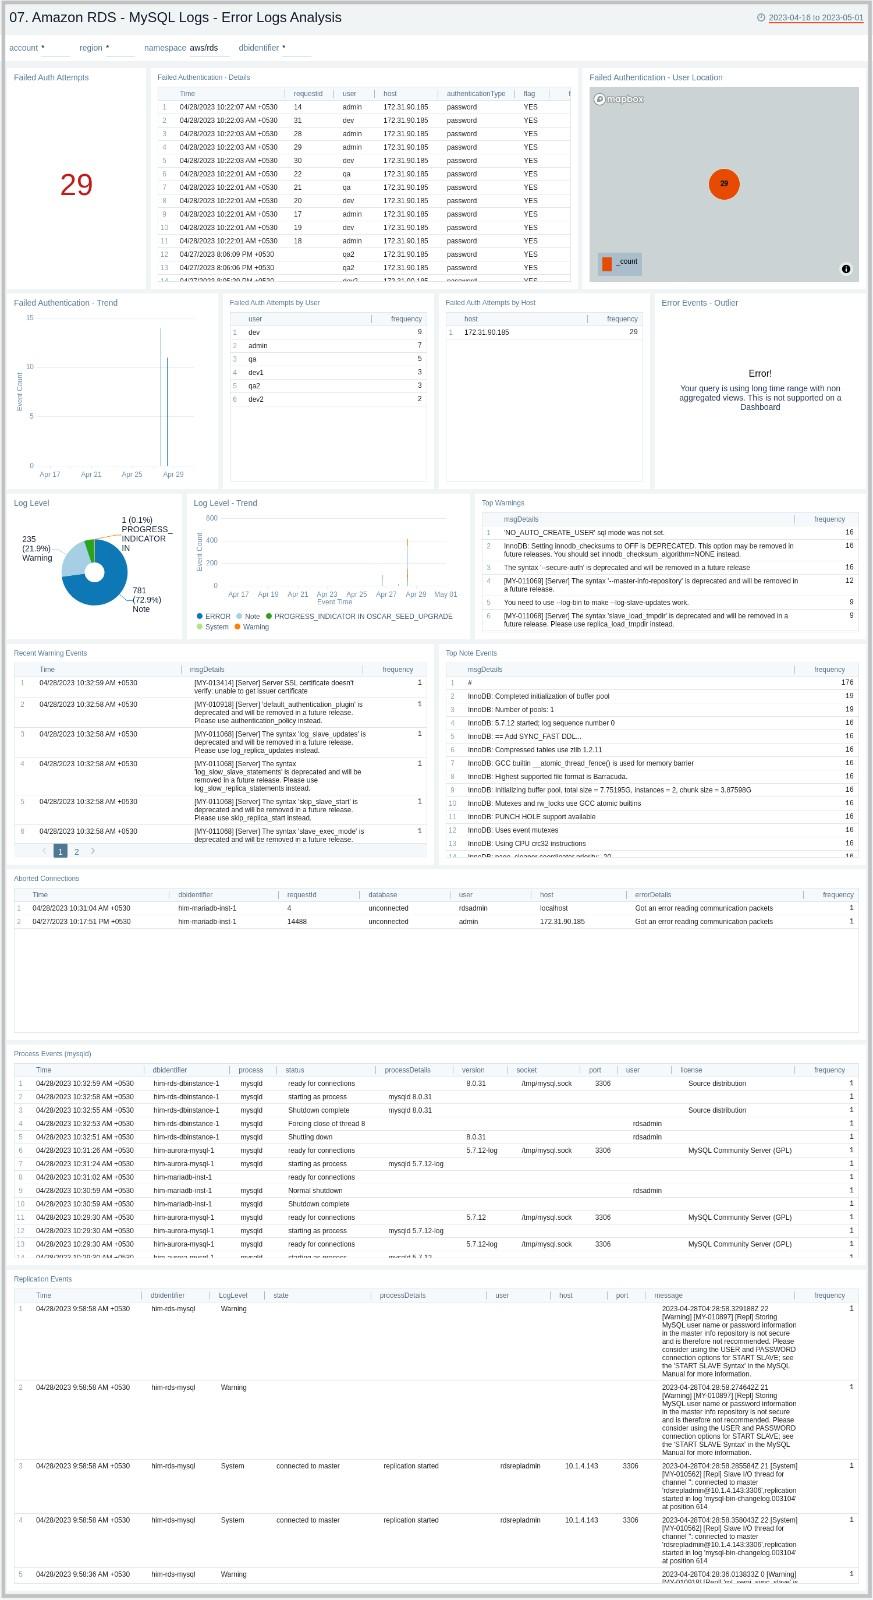
MySQL Logs - Error Logs Analysis
The Amazon RDS - MySQL Logs - Error Logs Analysis dashboard provides details for error logs, including failed authentications, error outliers, top and recent warnings, log levels, and aborted connections. This dashboard relies on MySQL error logs, which are by default enabled for Amazon MySQL. To view the data on the panels, you need to first ingest MySQL logs into Sumo Logic.
Use this dashboard to:
- Track diagnostic messages like Errors, Warnings, and Notes to decide the next step.
- Identify outliers for diagnostic events logged and see if there is an anomaly.
- Identify the authentication failures along with the reason for the user, client host, and client location that are used to connect. It also helps identify connection abort events.
- Monitor database instances starting up and being ready for connection events.
- Monitor MySQL RDS Cluster replication events.
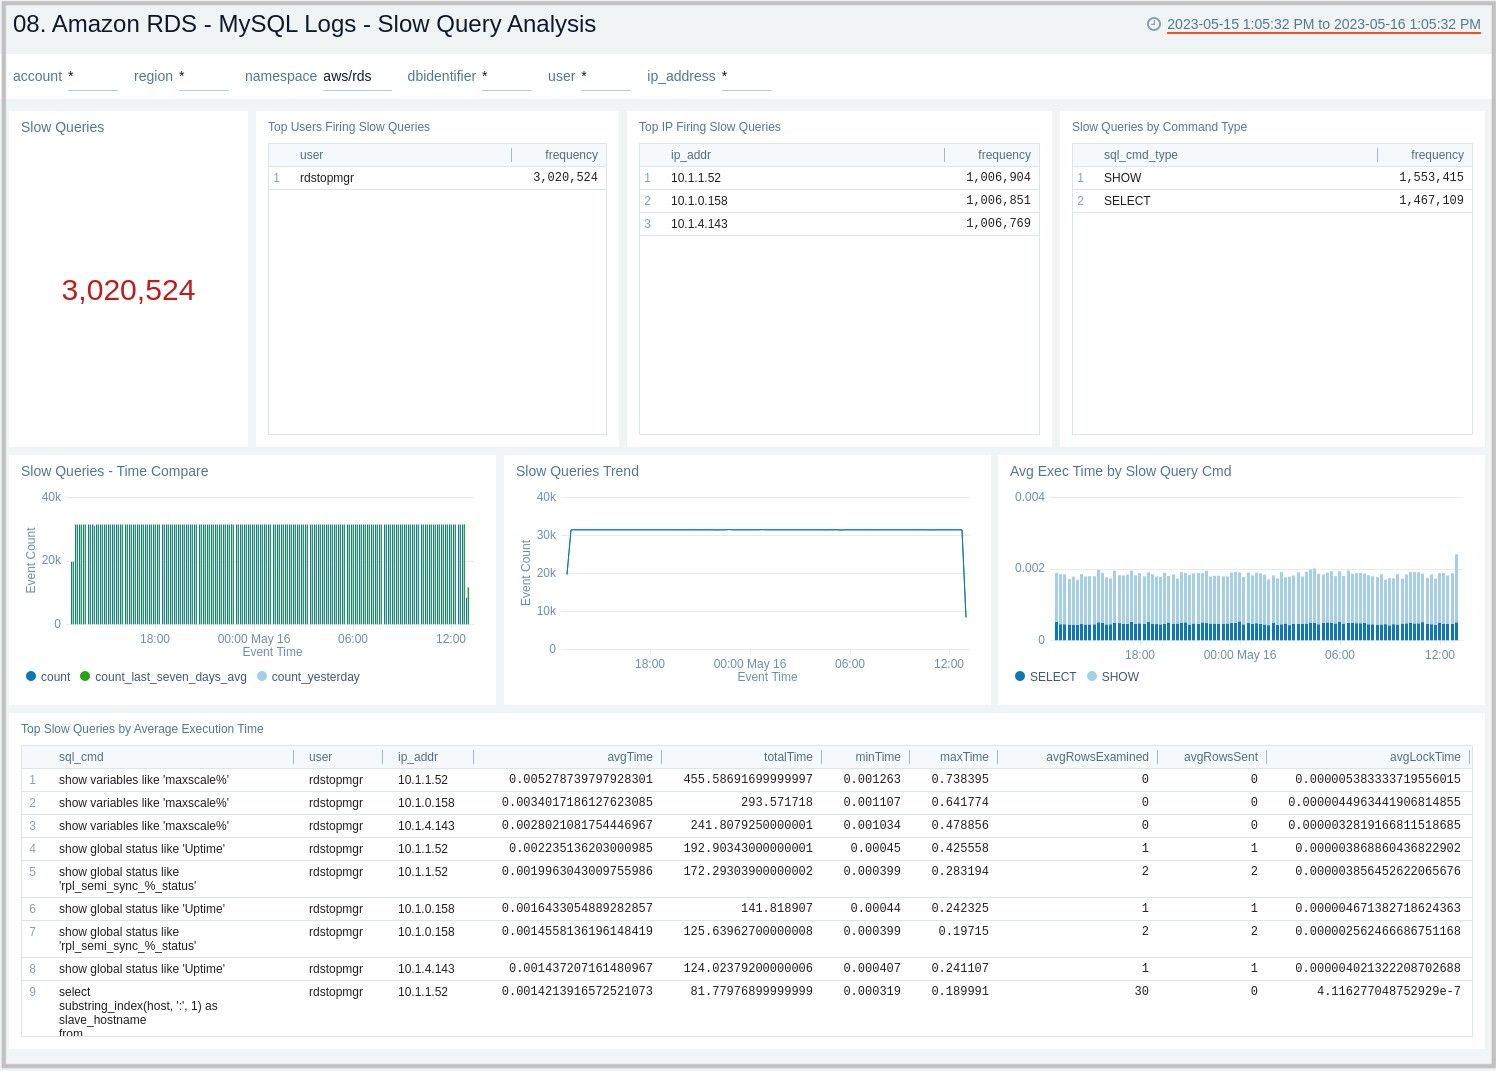
MySQL Logs - Slow Query Analysis
The Amazon RDS - MySQL Logs - Slow Query Analysis dashboard provides details on slow queries, including the number of slow queries, trends, execution times, time comparisons, command types, users, and IP addresses. This dashboard relies on Slow Query Logs, which need to be enabled and ingested into Sumo Logic.
Use this dashboard to:
- Identify queries taking more time than what is configured in the DB Parameter Group.
- Identify queries that are being used to search on non-indexed columns, thus impacting the performance of your application.
- Identify candidate queries to improve the frequency of execution, the time it takes to execute, locking time, and other factors of interest.
- Identify users responsible for firing slow queries from a given client IP address, along with the type of command involved.
- Check if SQL SELECT type queries can be shifted to read replicas for better performance.
- Monitor trends of slow queries and compare them with history to check if something different is happening or might have happened to decide the next step.
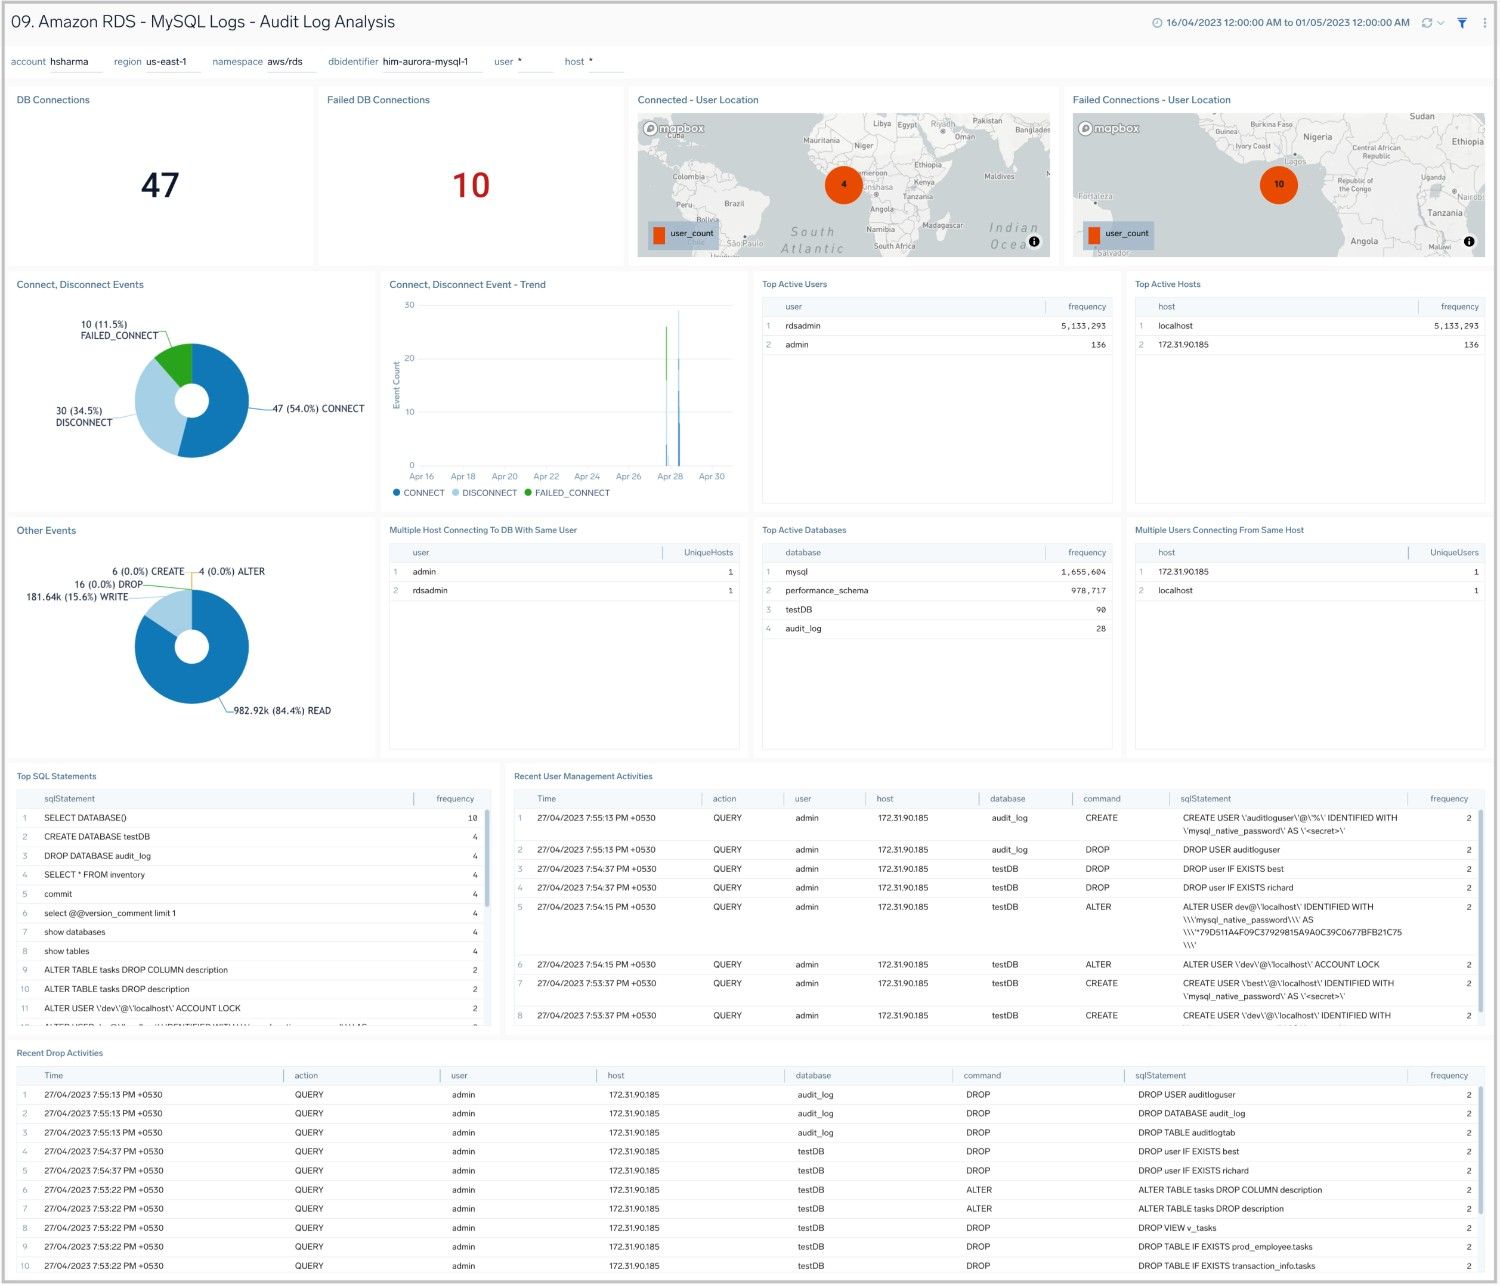
MySQL Logs - Audit Logs Analysis
The Amazon RDS - MySQL Logs - Audit Logs Analysis dashboard provides an analysis of audit logs, including successful, failed DB connections, most active users, clients, and databases, along with various SQL commands being executed on the RDS instances and clusters. This dashboard works on audit logs, which need to be turned on and enabled to be uploaded to the Amazon CloudWatch. These logs are specifically enabled to audit activities of interest from an audit and compliance perspective.
Use this dashboard to:
- Identify successful and failed connections to the database with details about the user, client IP address, and location.
- Identify if multiple hosts are connecting to the DB with the same user name.
- Identify if multiple users are connecting to the DB from the same host.
- Identify the most active users, client hosts, and databases.
- Get a high-level overview of SQL statements/commands being executed.
- Identify typical user management activities being performed.
- Quickly identify objects that are dropped.
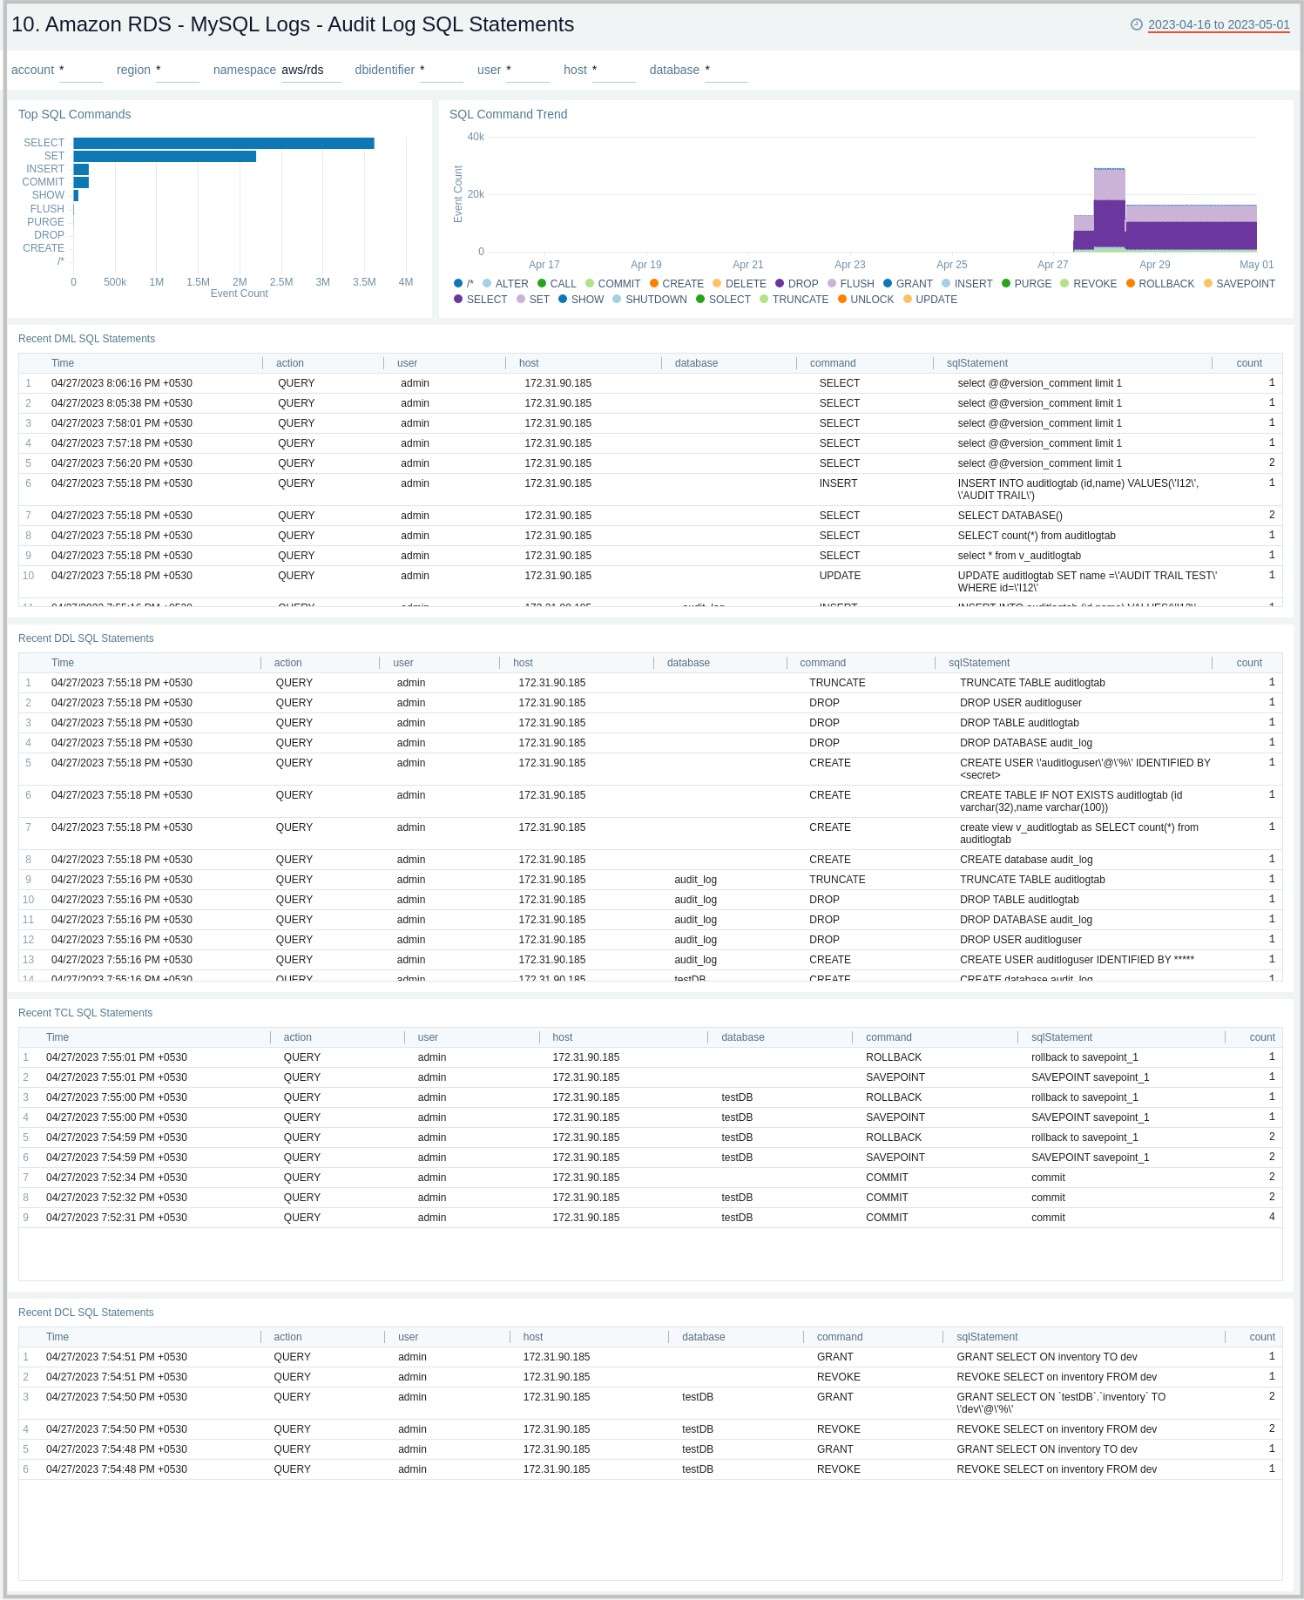
MySQL Logs - Audit Log SQL Statements
The Amazon RDS - MySQL Logs - Audit Log SQL Statement dashboard provides an analysis of audit logs, including types of top SQL commands being executed on the RDS instances and clusters. This dashboard works on audit logs, which need to be enabled and enabled to be uploaded to Amazon CloudWatch. These logs are specifically enabled to audit activities of interest from an audit and compliance perspective.
Use this dashboard to:
- Identify the top SQL statements and commands being executed, along with trends.
- Get details on various SQL statements/commands (DML, DDL, DCL, TCL) being executed.
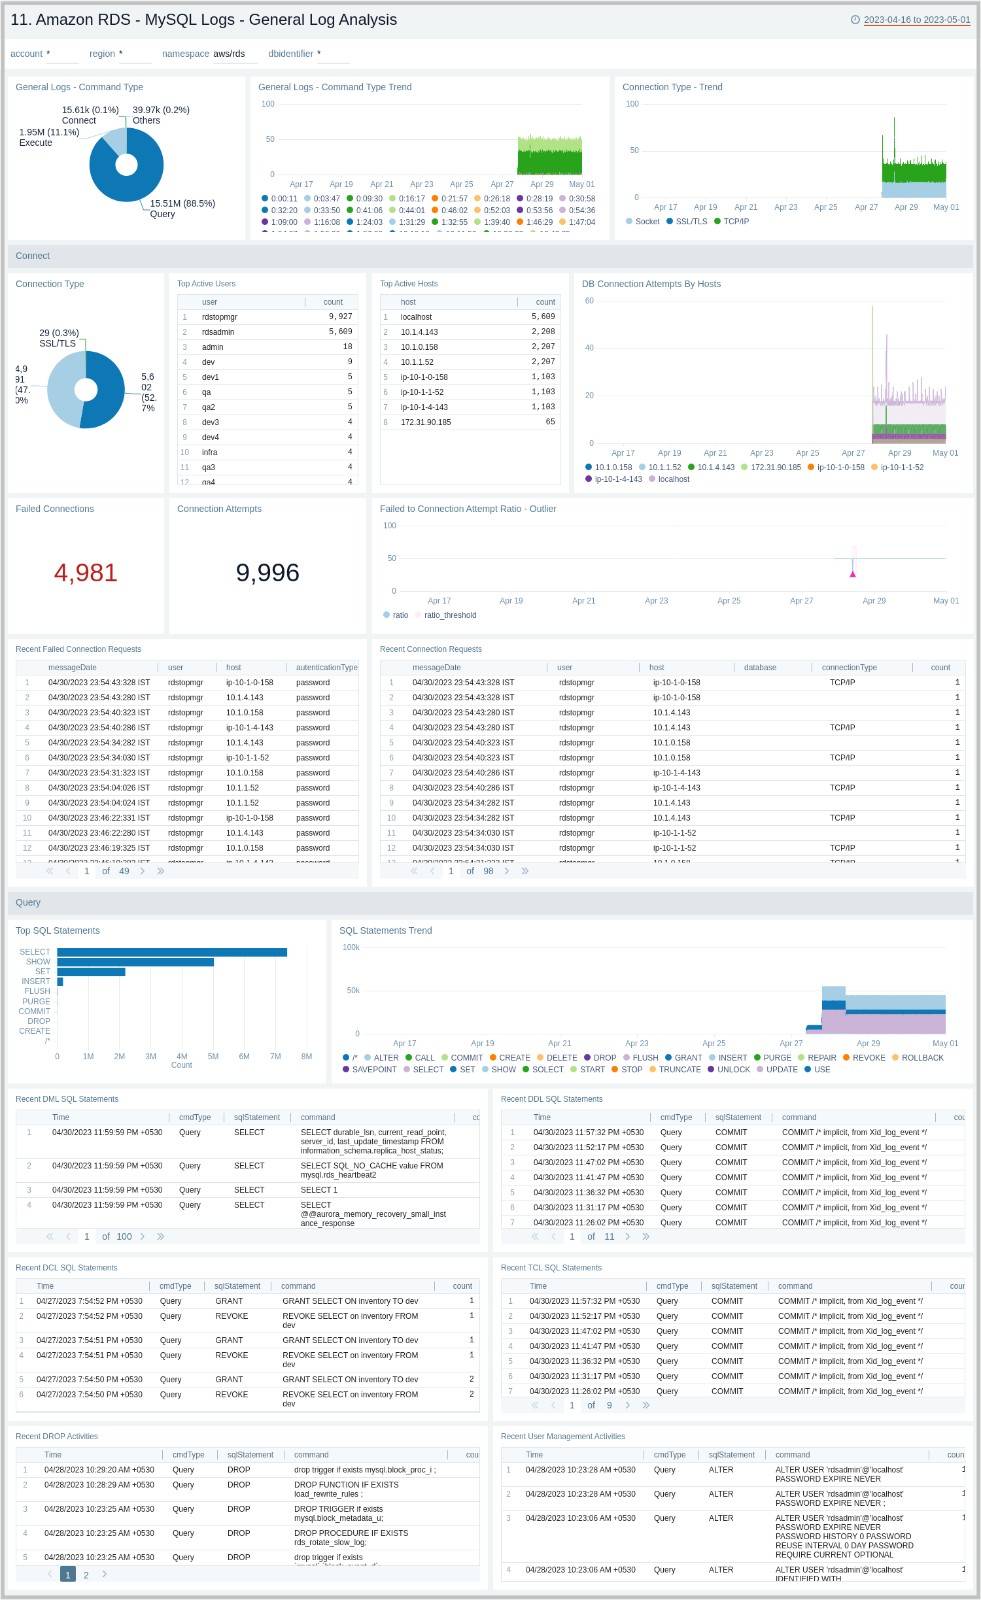
MySQL Logs - General Log Analysis
The Amazon RDS - MySQL Logs - Generic Log Analysis dashboard provides details for general logs, including command types and trends, user activity and management, host activity, connections, and SQL statements. This dashboard works on General Query logs, which need to be enabled and ingested into Sumo Logic.
Use this dashboard to:
- Identify successful or failed client connection attempts along with the type of connection.
- Identify user and client hosts being used to connect, but are facing authentication failures, along with the reason. Monitor failed attempts to total attempts and track anomalies.
- Monitor why certain things are failing by checking what exactly the client sent to the server to execute.
- Monitor the type of SQL statements/queries (DML, DDL, DCL, TCL, and others) being sent by the client to execute.
PostgreSQL Logs - Overview
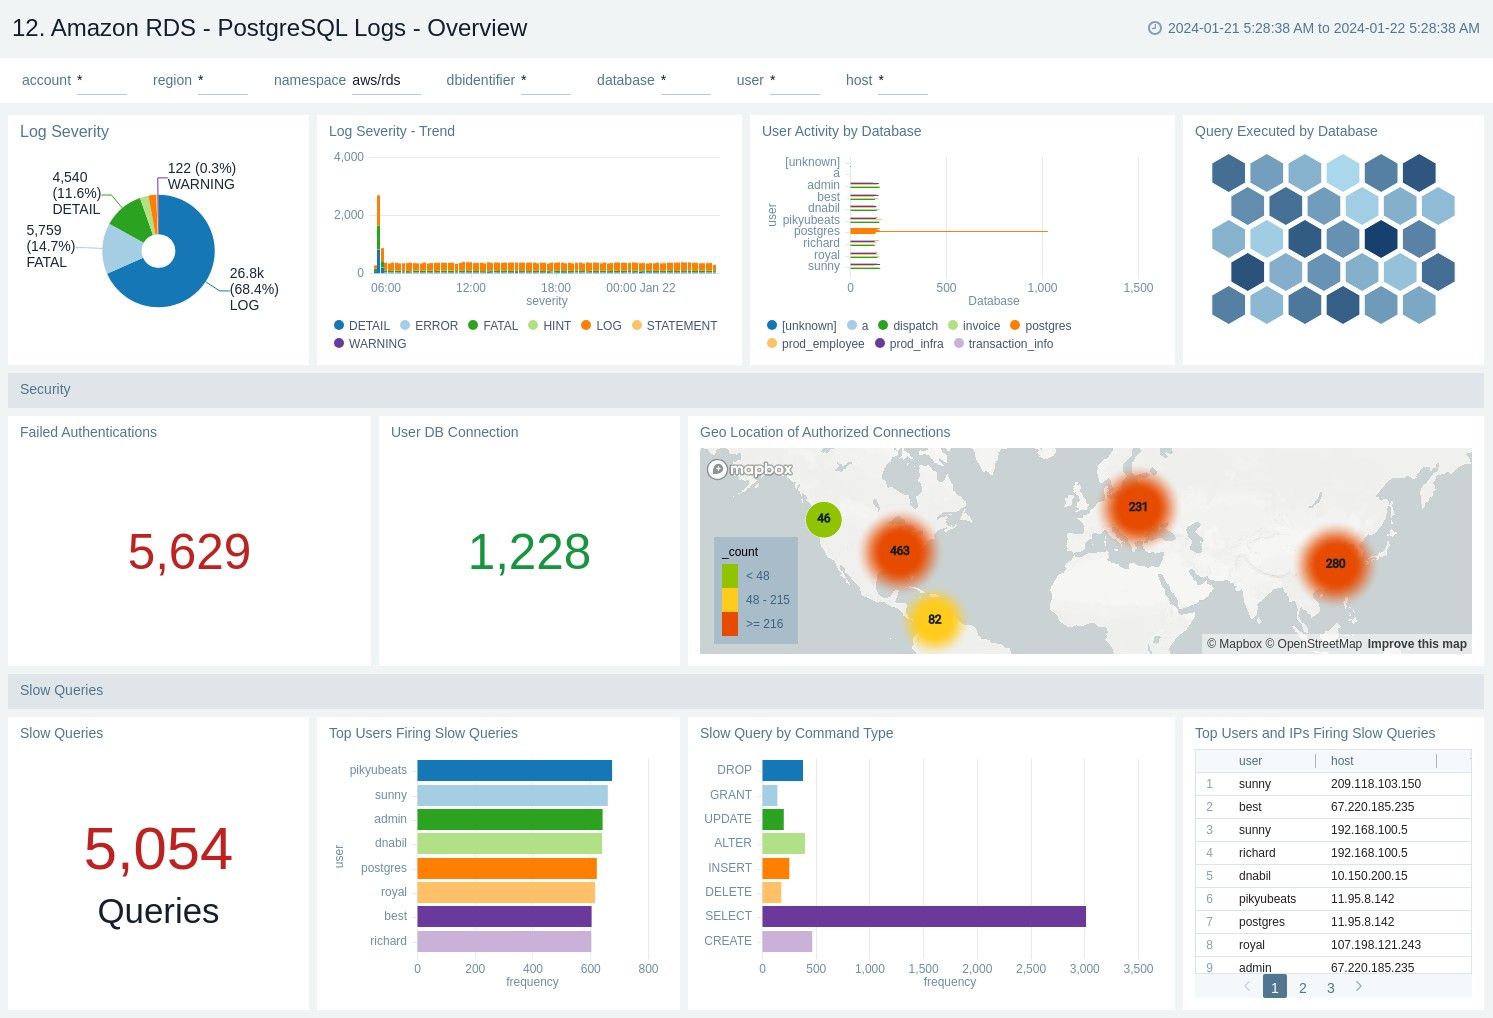
The Amazon RDS - PostgreSQL Logs - Overview dashboard provides a high-level analysis of database activity with details on errors, slow logs, and authentication using RDS CloudWatch logs.
Use this dashboard to:
- Identify successful or failed authentication count and geo location.
- Obtain log severity distribution and trend.
- Obtain user activity and query execution by the database.
- Obtain the slow queries count and distribution based on user, command type, and host.
PostgreSQL Logs - Errors
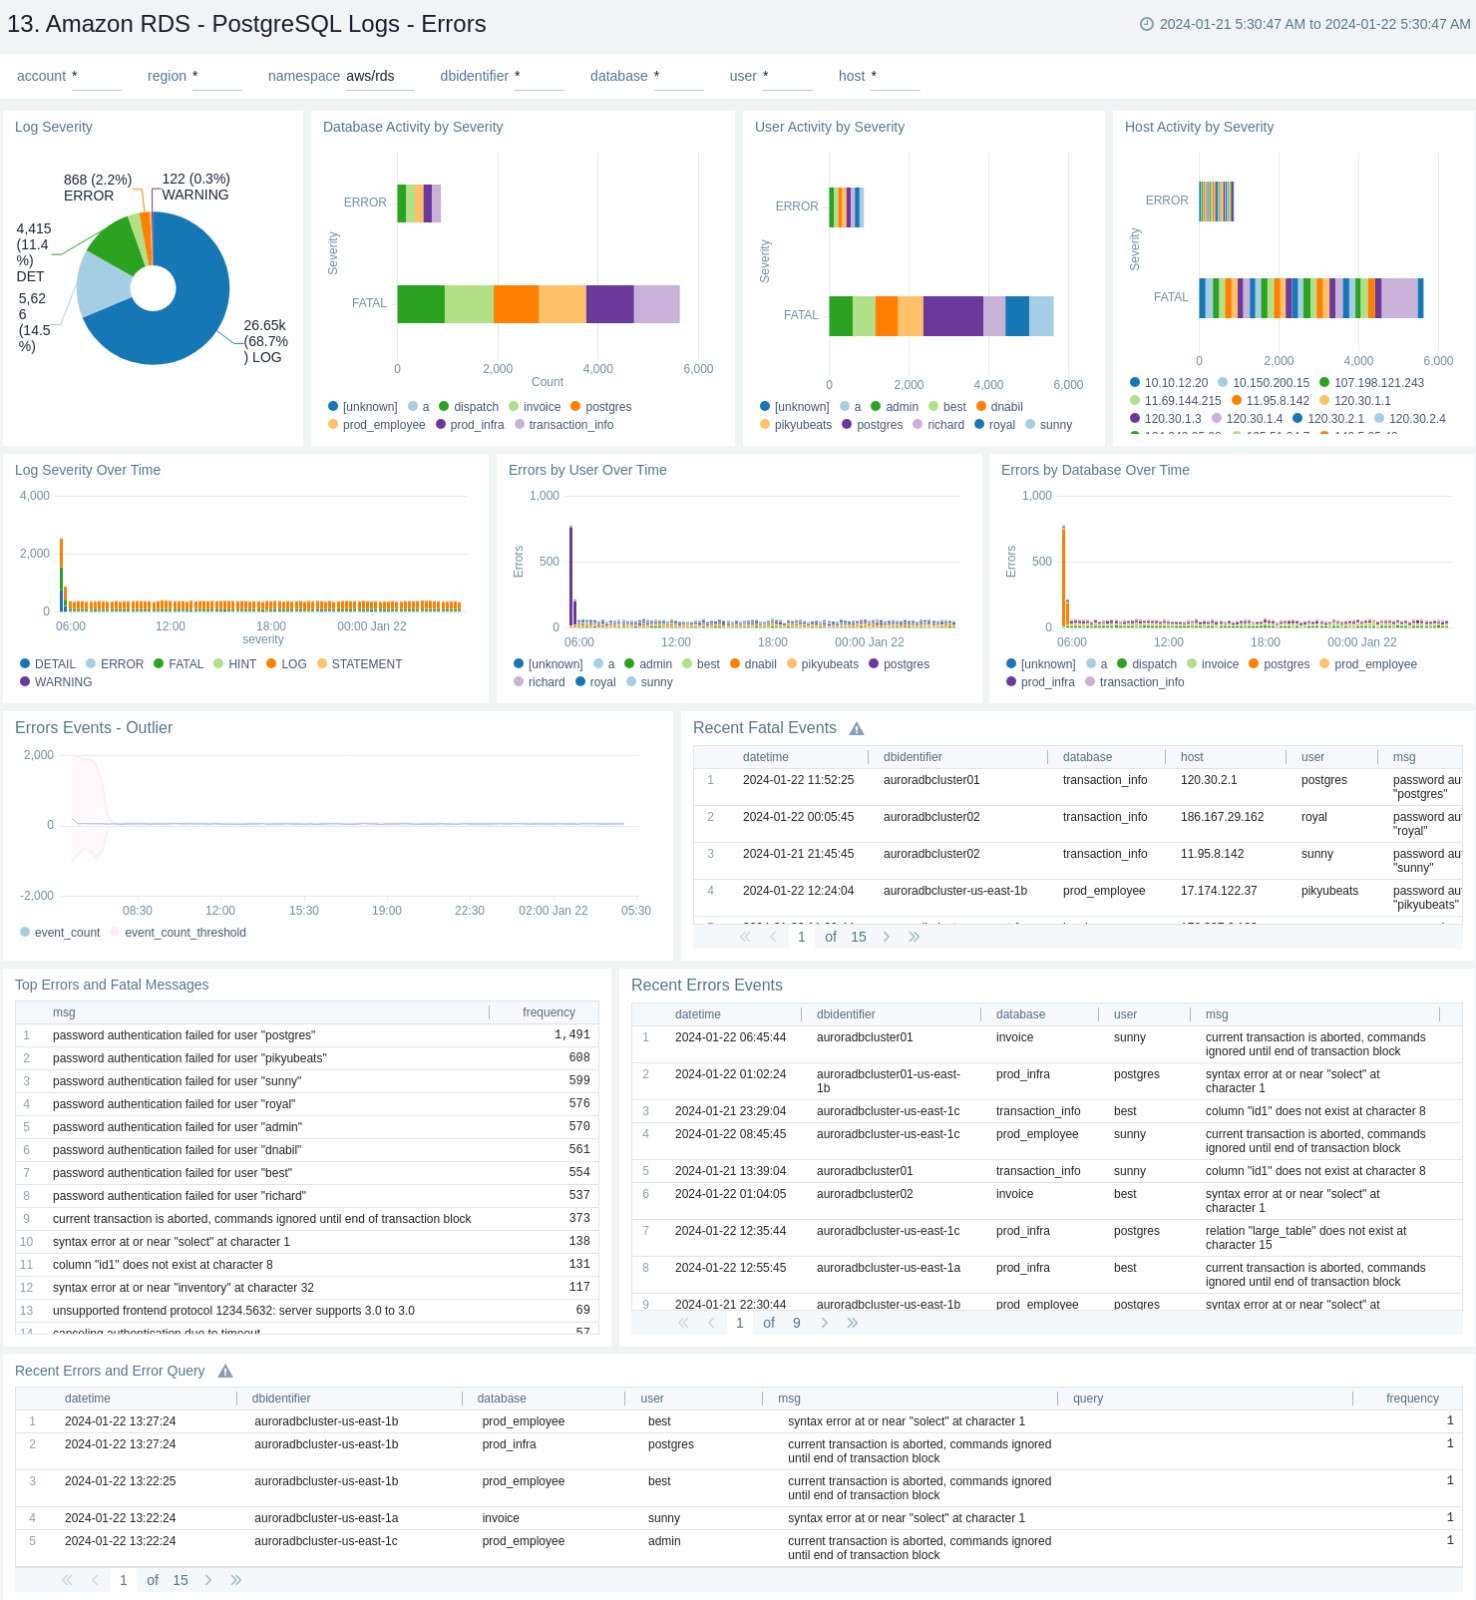
The Amazon RDS - PostgreSQL Logs - Errors dashboard provides details on errors occurring on your PostgreSQL instance by keeping track of log severity using postgresql.log.
Use this dashboard to:
- Obtain PostgreSQL log severity distribution along with error log distribution by database, user, and host.
- Identify PostgreSQL log severity over time by user, host, along with error event (fatal/error log level) outlier.
- Obtain recent and top fatal and error events.
- Obtain recent queries running into error with the error message.
PostgreSQL Logs - Slow Query Overview
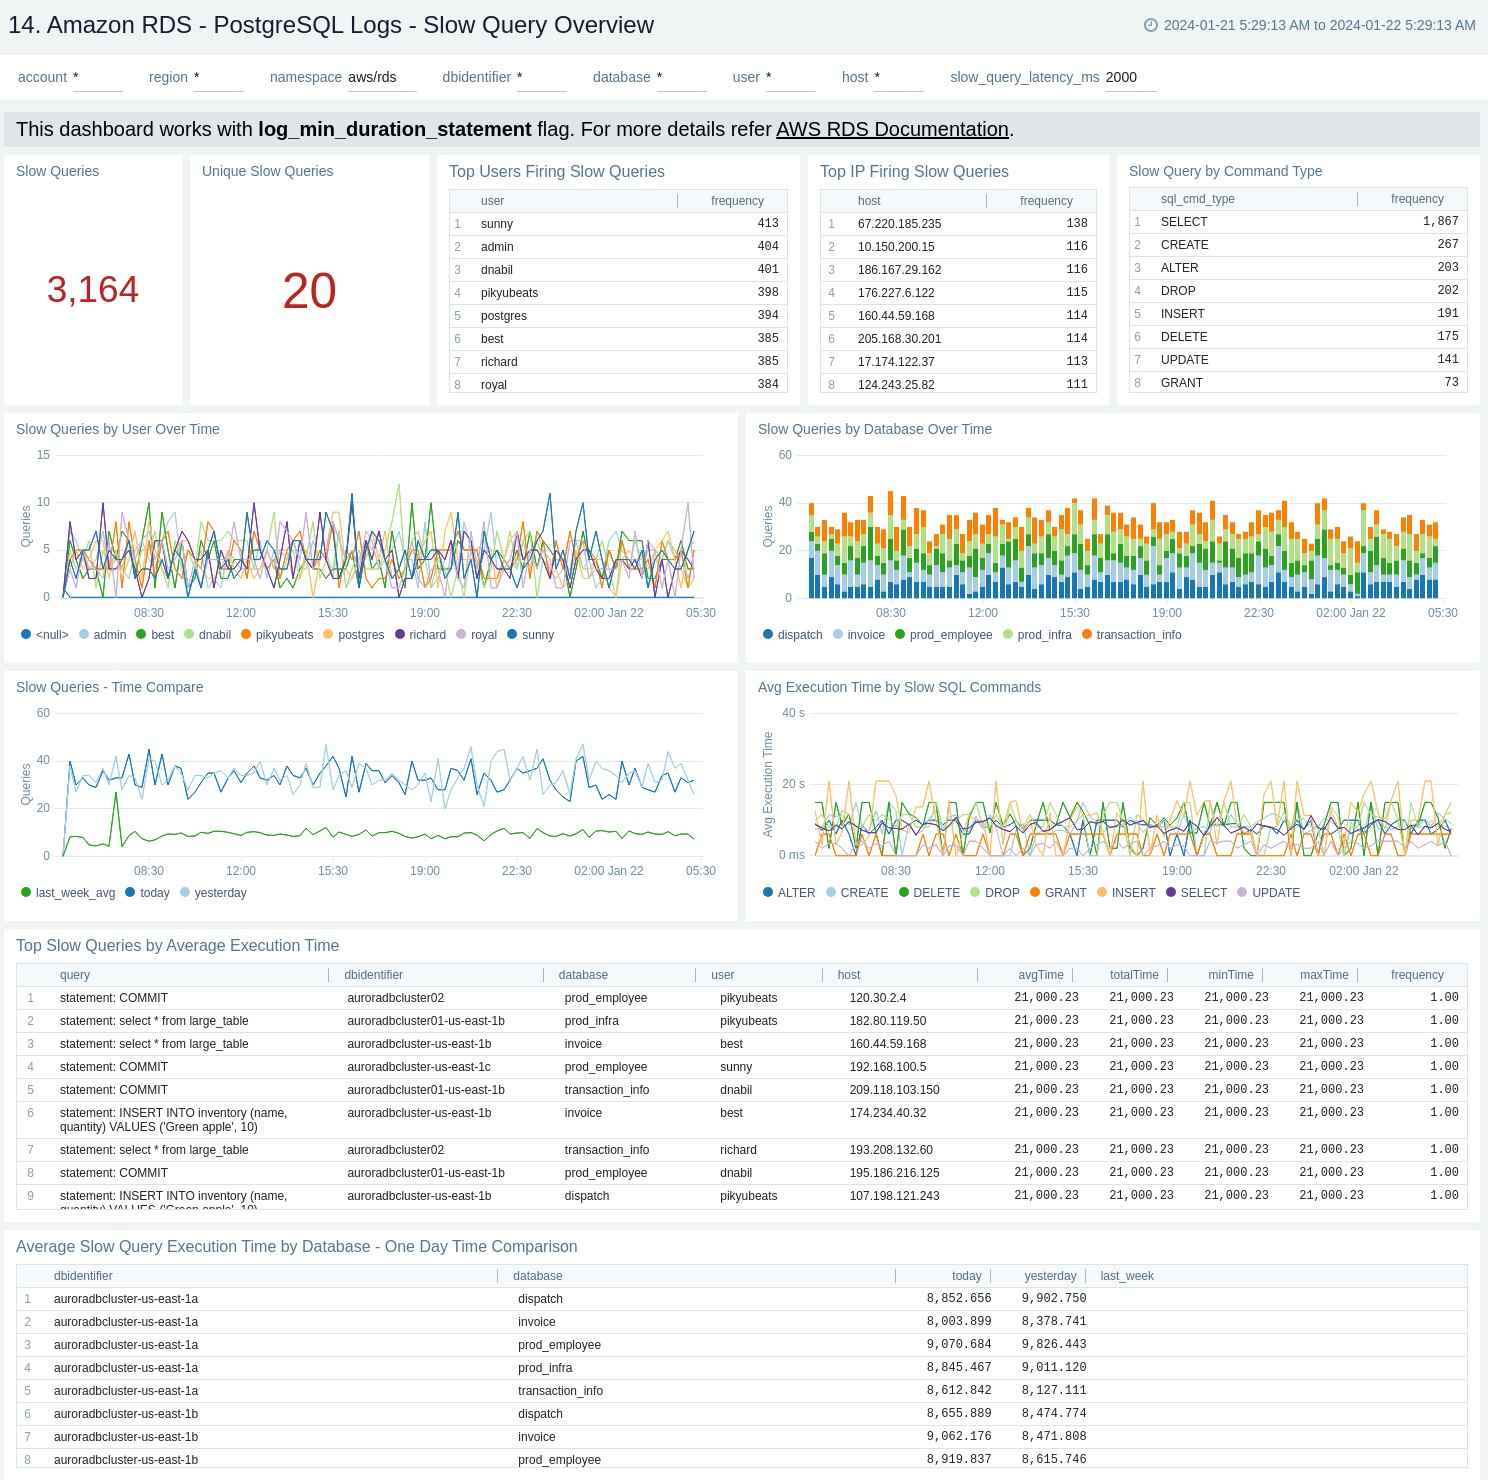
The Amazon RDS - PostgreSQL Logs - Slow Query Overview dashboard provides an overview of the slow query logs. AWS RDS will report slow logs with statements taking more thanthe threshold value given through log_min_duration_statement. This dashboard can be filtered with different values for query execution time through slow_query_latency_ms.
Use this dashboard to:
- Obtain the count of slow queries and unique slow queries.
- Identify the number of slow queries by user, host, and command type, along with slow queries over time by user and database.
- Monitor average execution time by SQL command.
- Obtain unique slow queries along with execution time, analysing minimum, maximum, average, and many more.
- Obtain the time comparison between the number of slow queries and their execution time over 1 day or 1 week.
PostgreSQL Logs - Slow Query Details
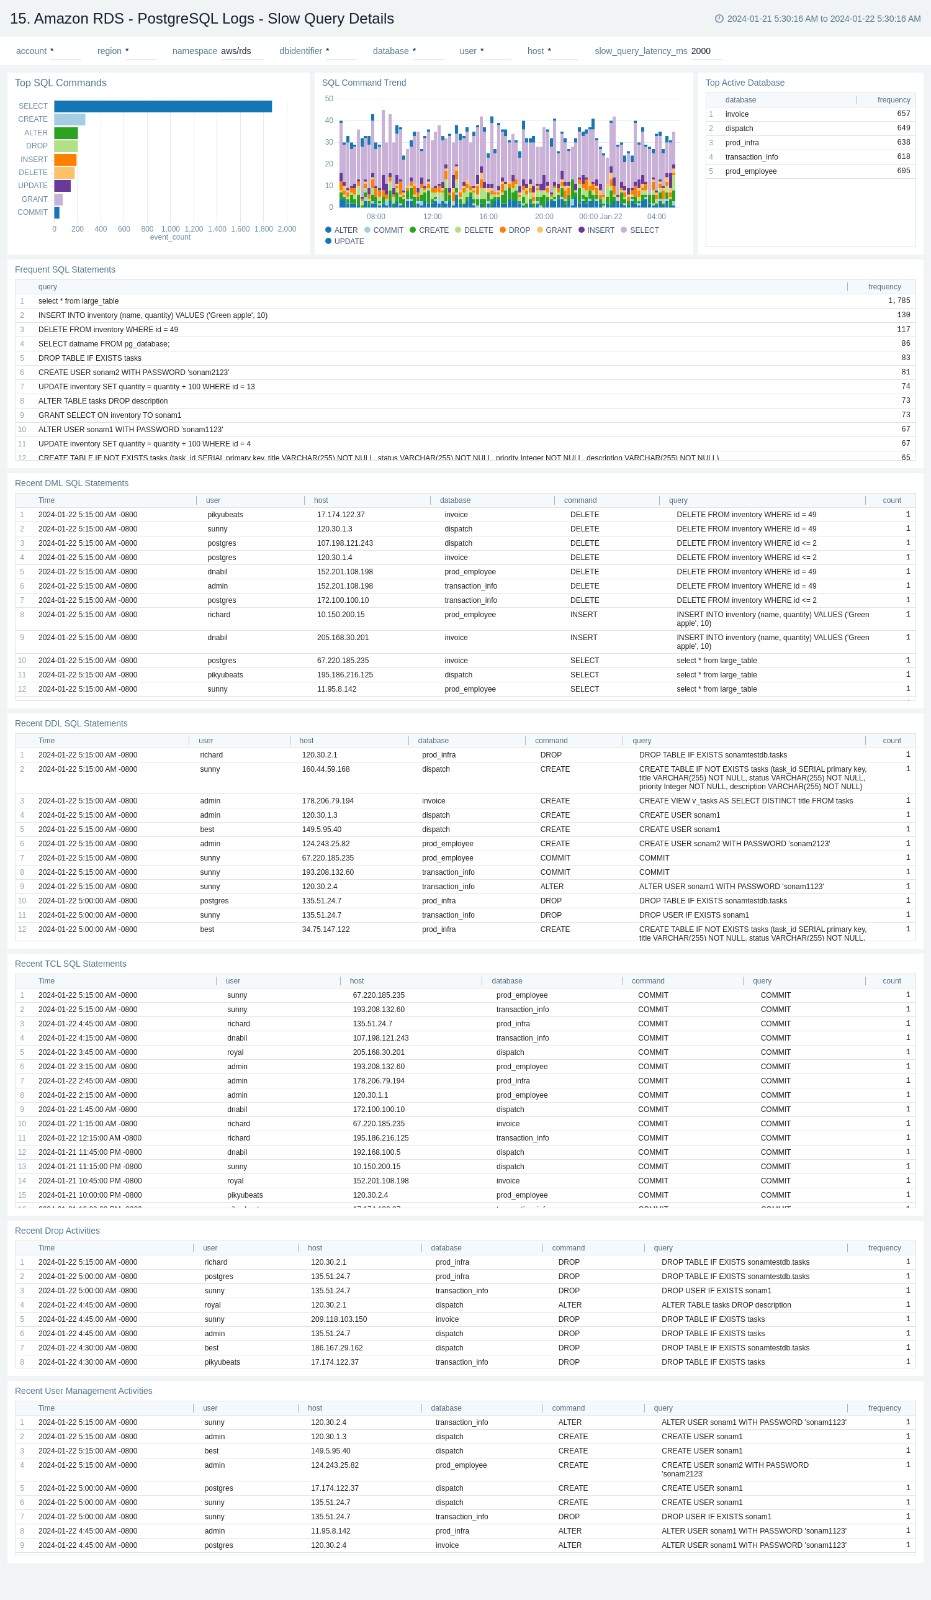
The Amazon RDS - PostgreSQL Logs - Slow Query Details dashboard provides details on slow log queries. Also, this dashboard displays the distribution of slow queries along with parameters like database and query type.
Use this dashboard to:
- Monitor the distribution of the number of slow queries by the command type and database.
- Obtain the frequently fired slow queries.
- Monitor the recent DML, DDL, and TCL statements that lead to slow queries.
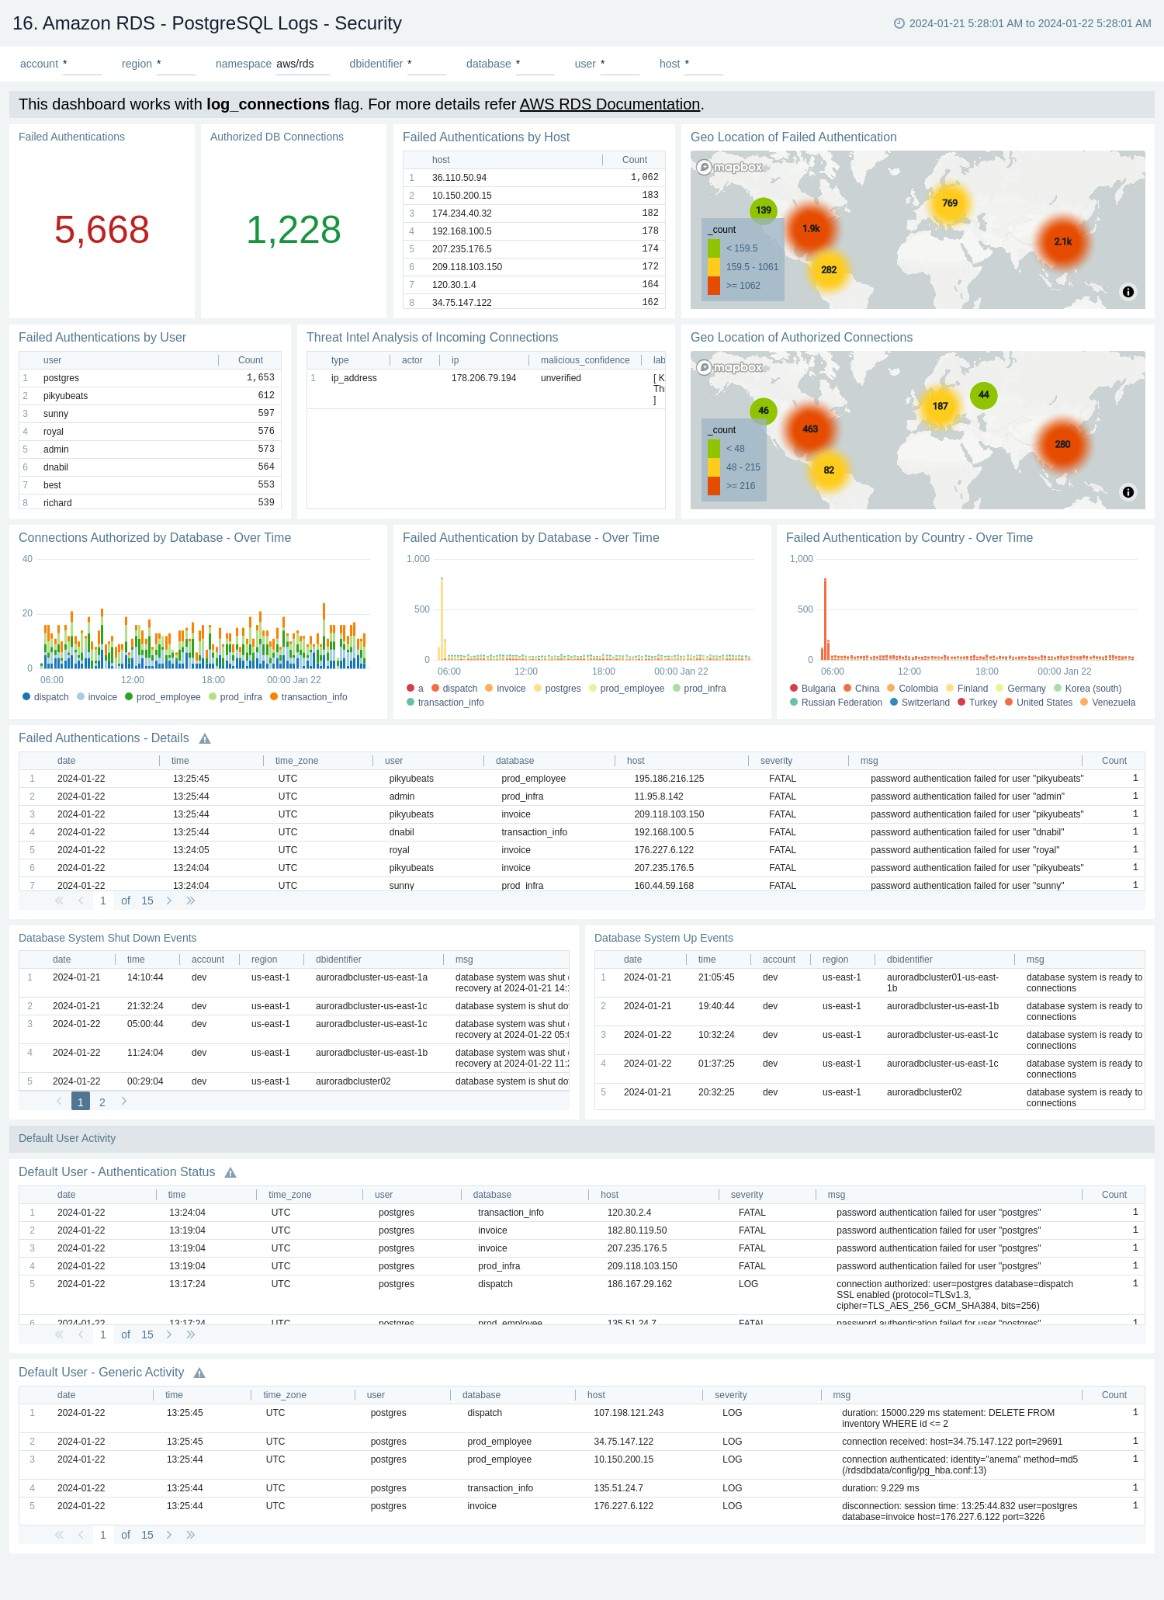
PostgreSQL Logs - Security
The Amazon RDS - PostgreSQL Logs - Security dashboard provides details with respect to login failures and threat intel, along with activity by the default user.
Use this dashboard to:
- Obtain failed and successful authentication count and geo location.
- Monitor failed authentication details by user, host, and database over time.
- Monitor database shutdown and system up events.
- Identify the default user's authentication and generic activities.
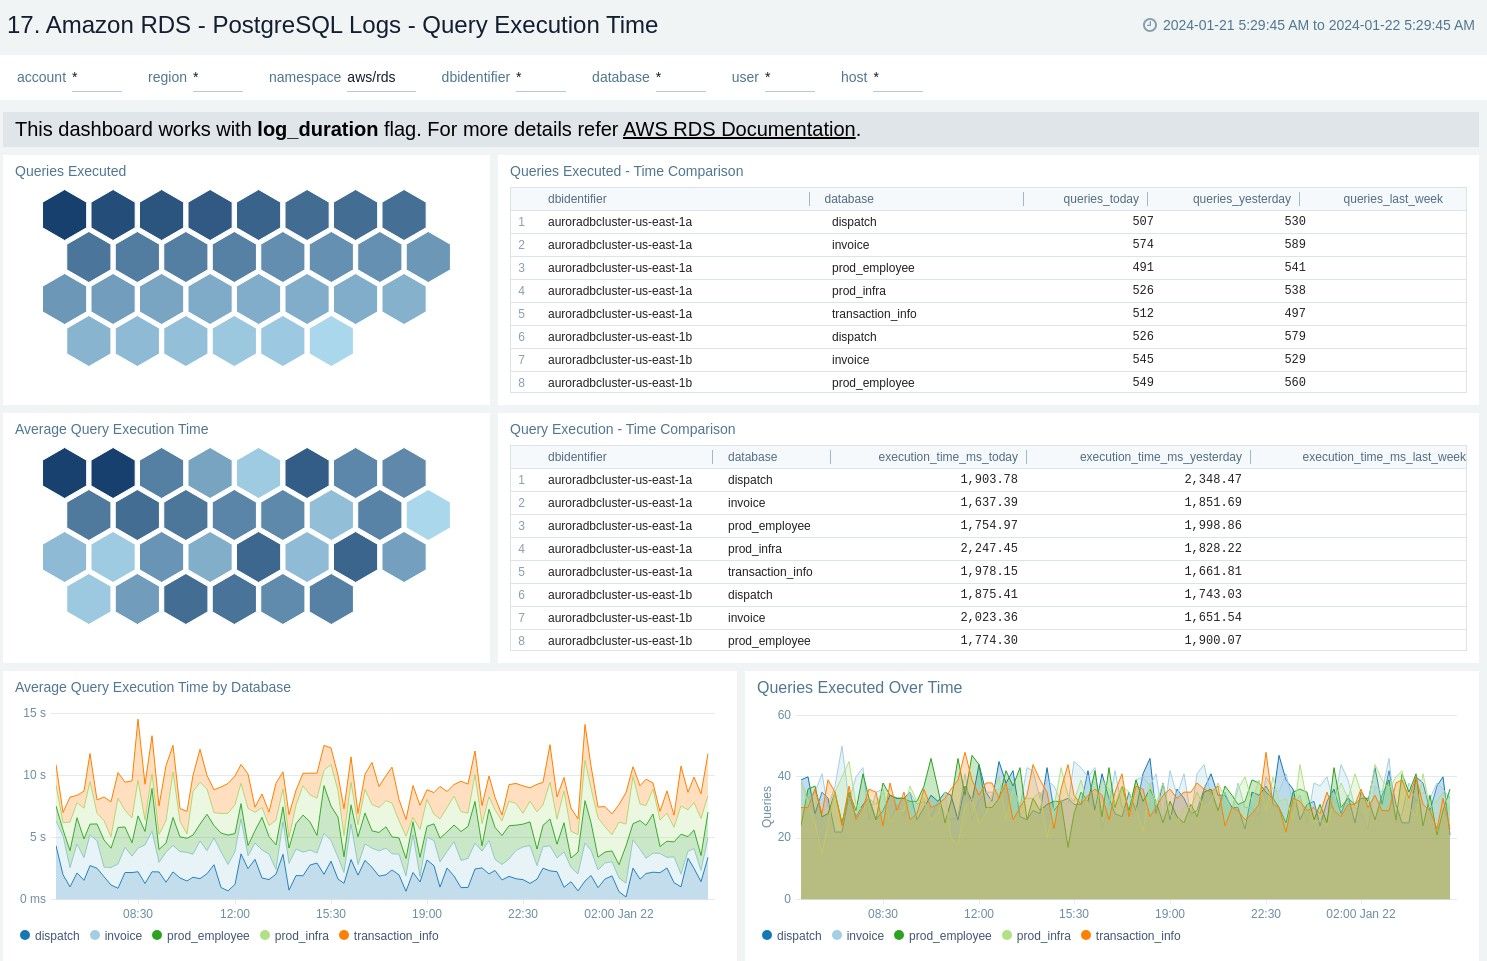
PostgreSQL Logs - Query Execution Time
The Amazon RDS - PostgreSQL Logs - Query Execution Time dashboard provides details around the time it's taking to execute queries on your PostgreSQL instance.
Use this dashboard to:
- Obtain the number of queries executed and average query execution time by database.
- Monitor time comparison for the number of queries executed and query execution time.
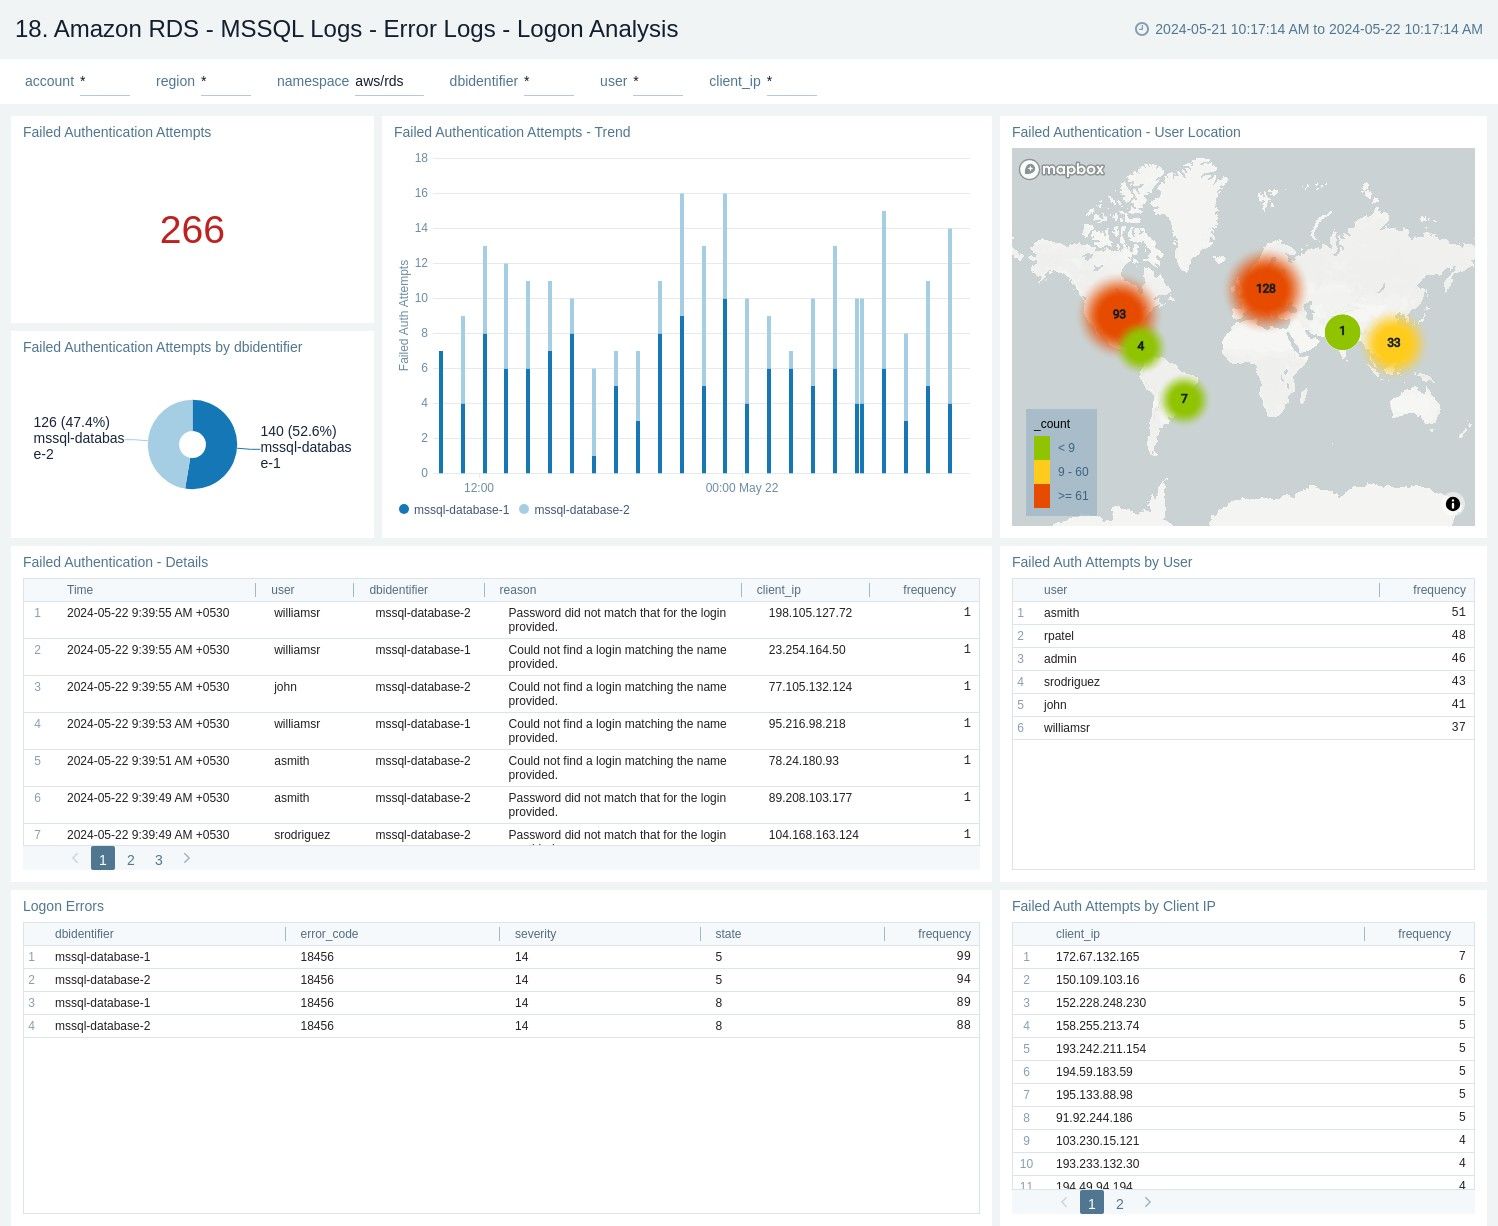
MSSQL Logs - Error Logs - Logon Analysis
The Amazon RDS - MSSQL Logs - Error Logs - Logon Analysis dashboard provides information about the error logs, including failed authentications and logon errors. This dashboard relies on MSSQL error logs, which need to be enabled for the Amazon MSSQL. You need to first ingest MSSQL logs into Sumo Logic to view data on the dashboard panels.
Use this dashboard to:
- Identify the authentication failures along with the reason for the user and client location that are used to connect.
- Detect logon errors, including error codes, severity levels, and states.
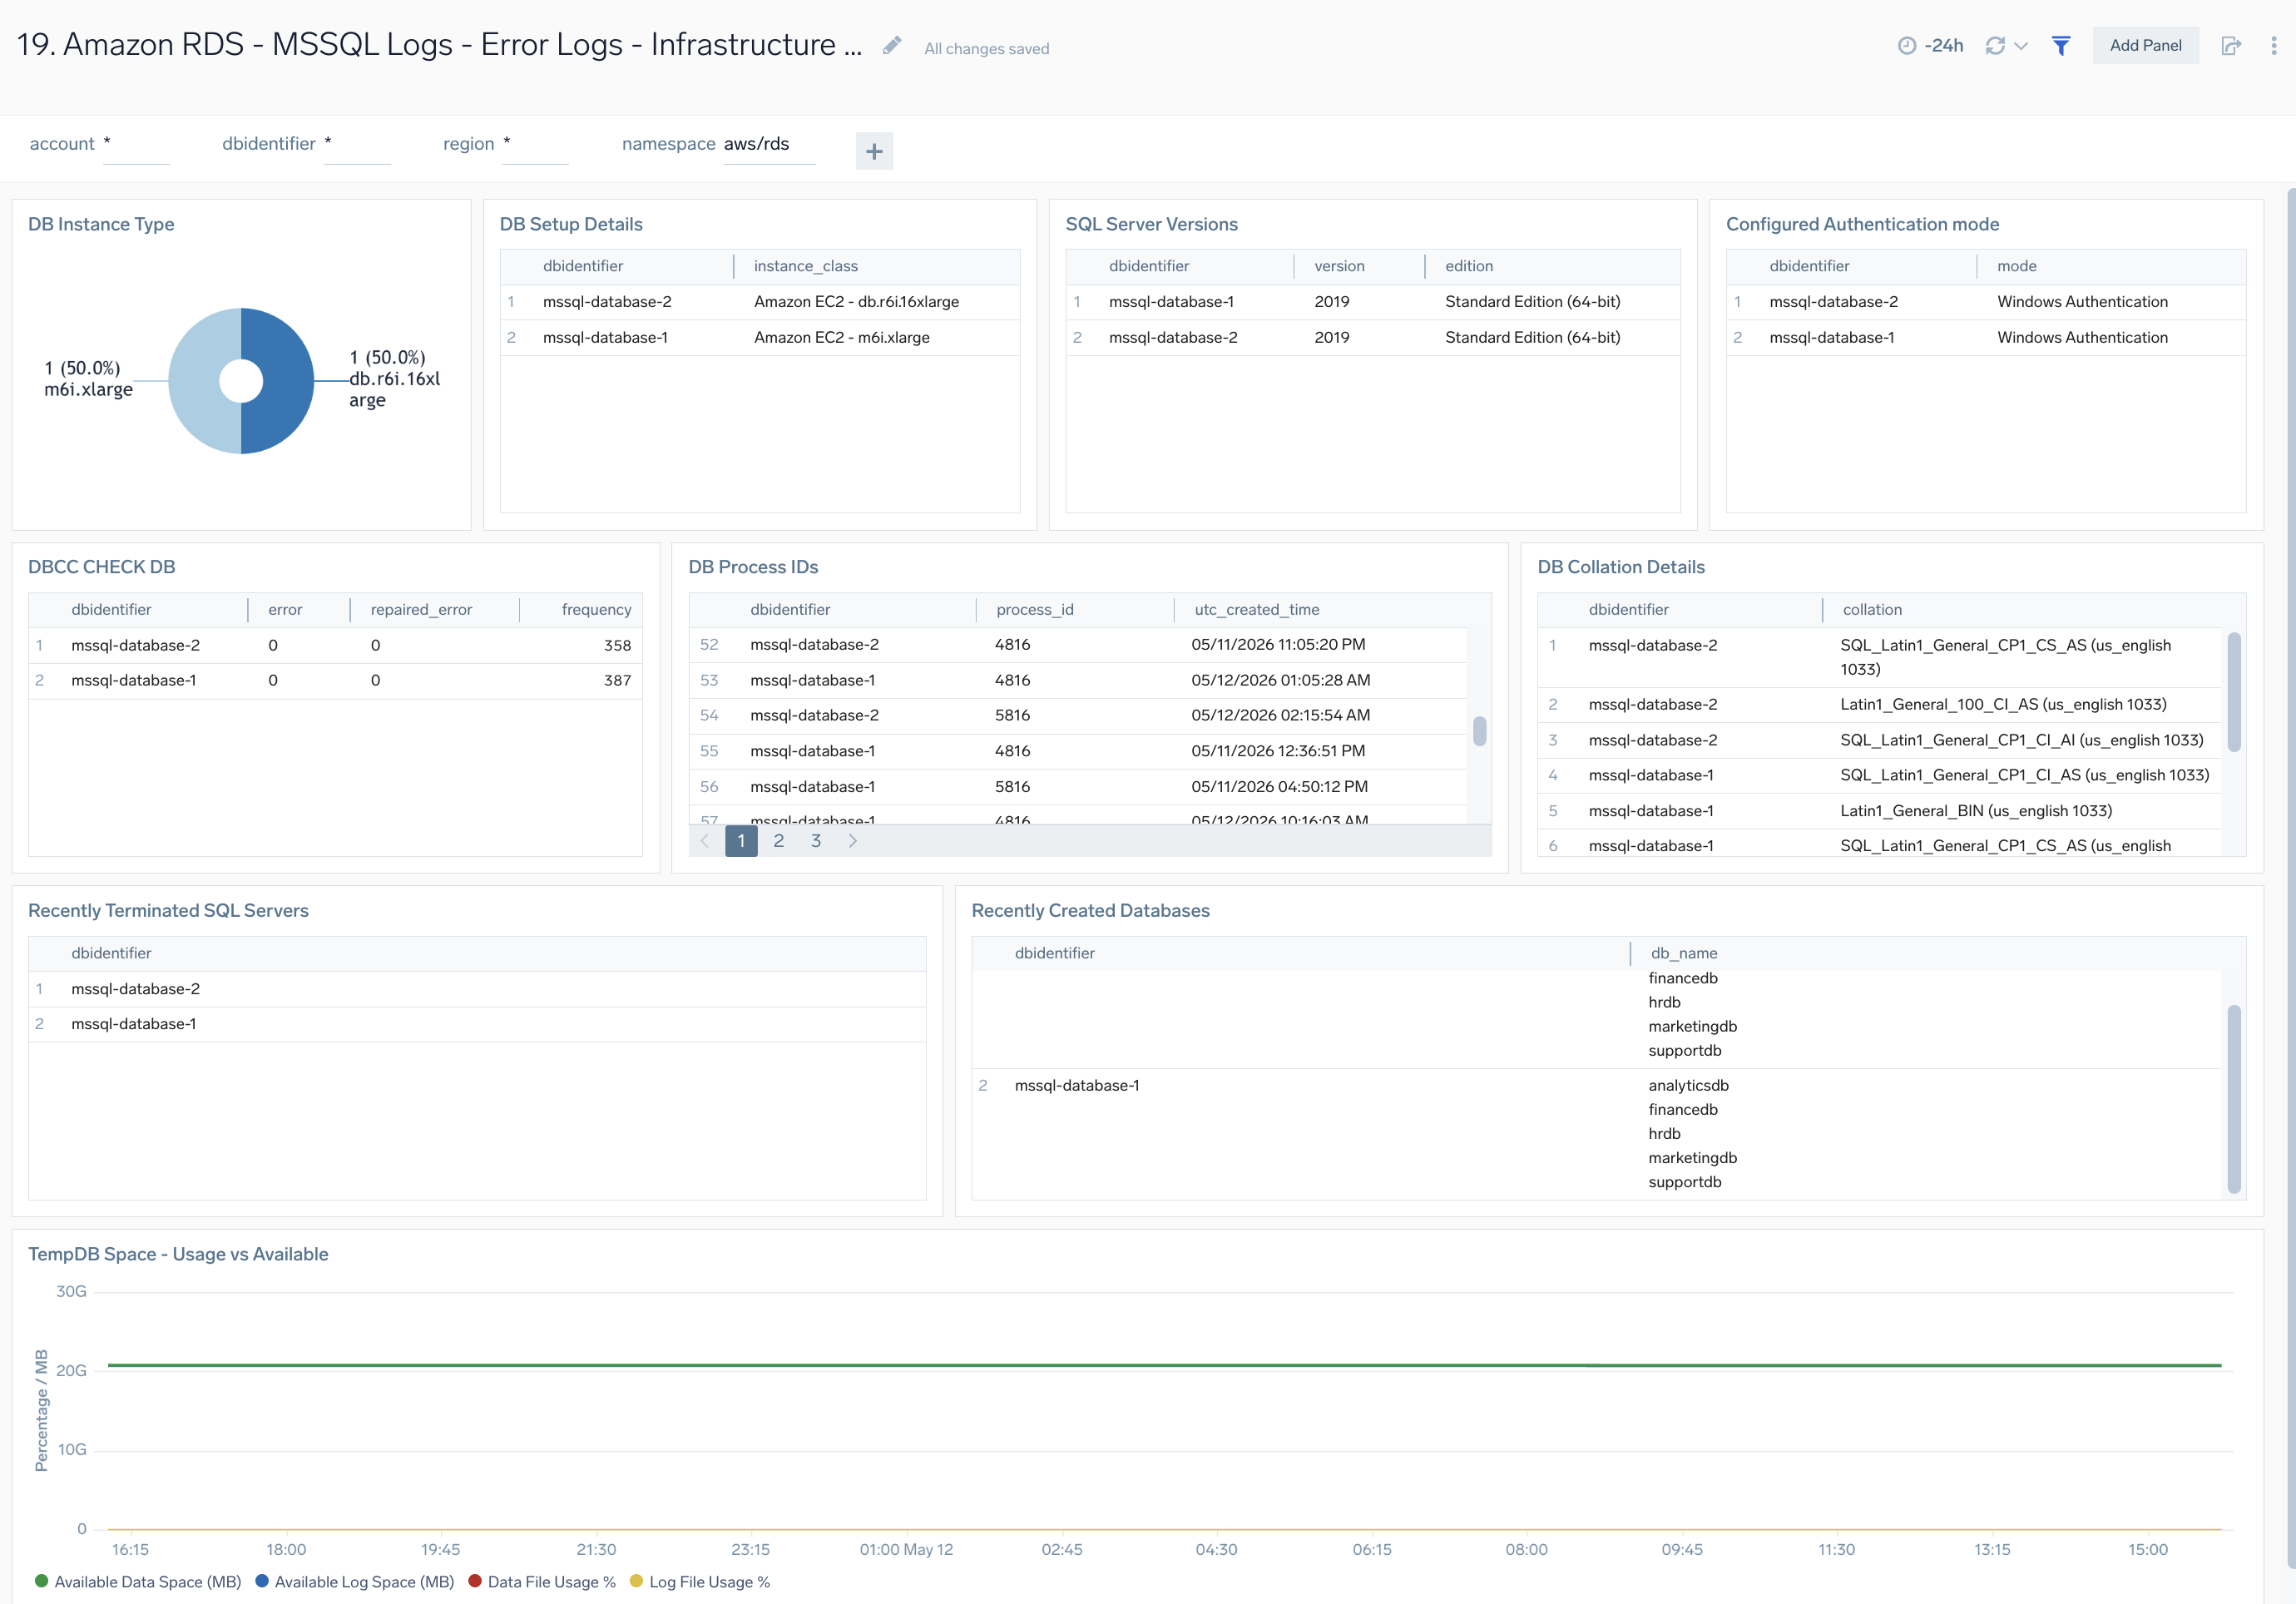
MSSQL Logs - Error Logs - Infrastructure Overview
The Amazon RDS - MSSQL Logs - Error Logs - Infrastructure Overview dashboard provides information about the hardware, authentication mode, collation, process, recent termination of SQL server, and recent creation of databases. This dashboard relies on MSSQL error logs, which need to be enabled and ingested into Sumo Logic.
Use this dashboard to:
- Get a high-level overview of your MSSQL infrastructure, like instance type and version.
- Get configuration details such as authentication mode, collation settings, and process details.
- Monitors
DBCC CHECKDBchecks. - Track recent terminations of SQL Server instances and monitor the creation of new databases.
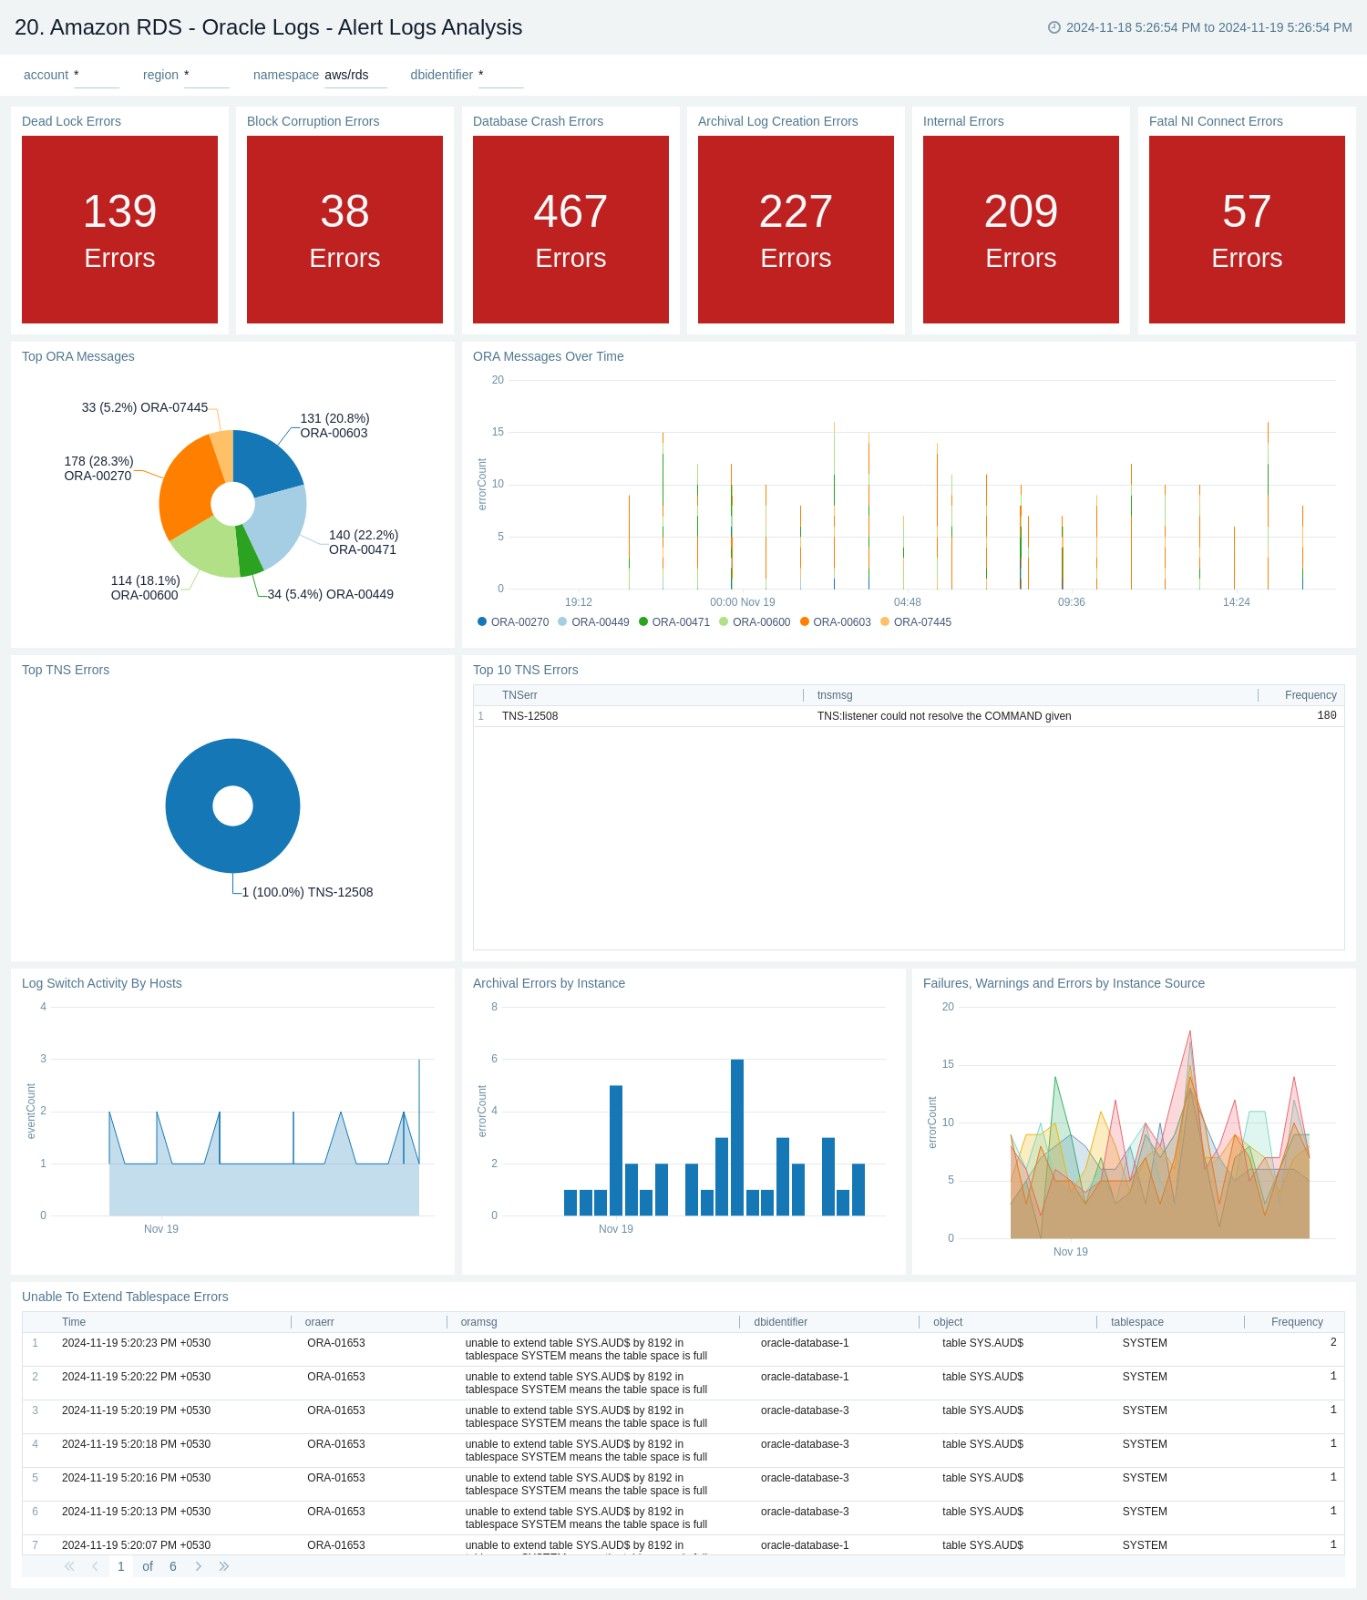
Oracle Logs - Alert Logs Analysis
The Amazon RDS - Oracle Logs - Alert Logs Analysis dashboard provides details on Oracle errors, including counts of various error types, ORA messages, Oracle instance states, and other data derived from the Oracle Alert log.
Use this dashboard to:
- Monitor Amazon Oracle RDS errors through CloudWatch Events.
- Monitor ORA and TNS message events.
- Monitor log switch activities, archival errors, tablespace extension issues, failures, warnings, and errors occurring on the Oracle RDS instance.
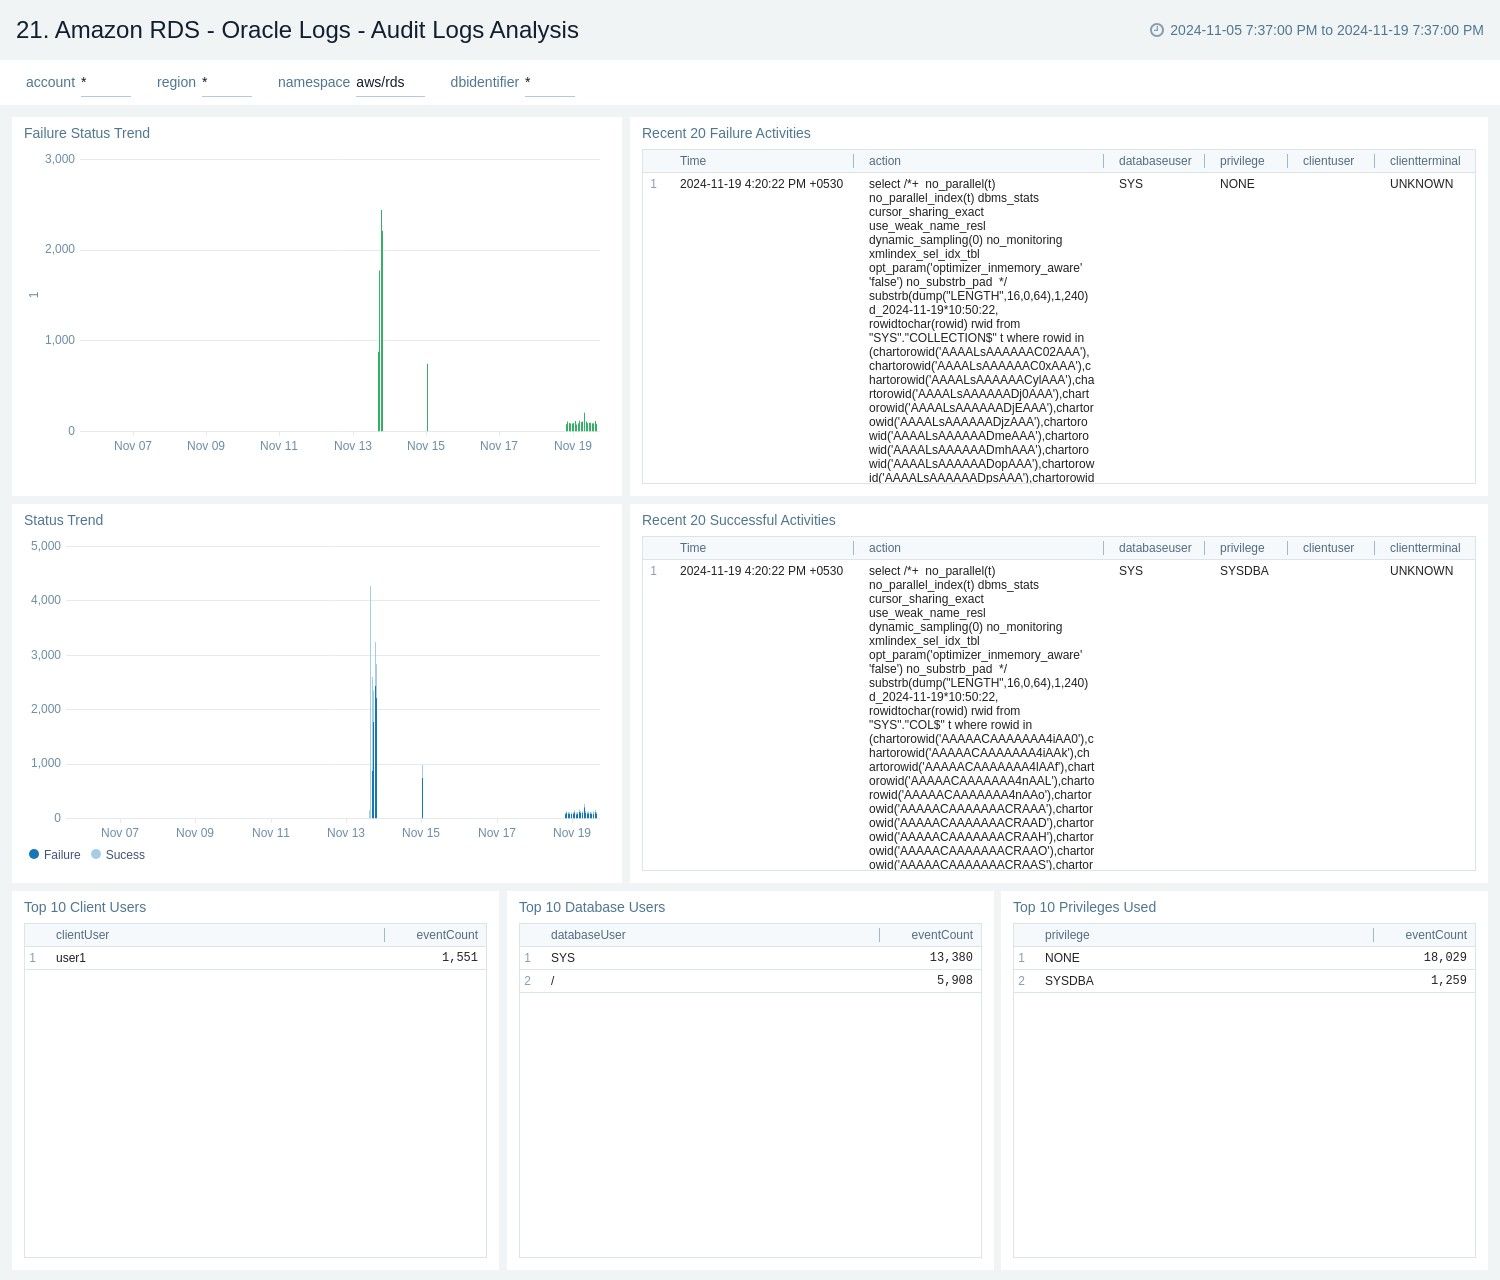
Oracle Logs - Audit Logs Analysis
The Amazon RDS - Oracle Logs - Audit Logs Analysis dashboard provides details on syslog audit trail, including successful and failed activities, and top usage by client, database user, and privileges used.
Use this dashboard to:
- Monitor successful and failed Amazon Oracle RDS events.
- Monitor top usage by client, database user, and privileges on the Oracle RDS instance.
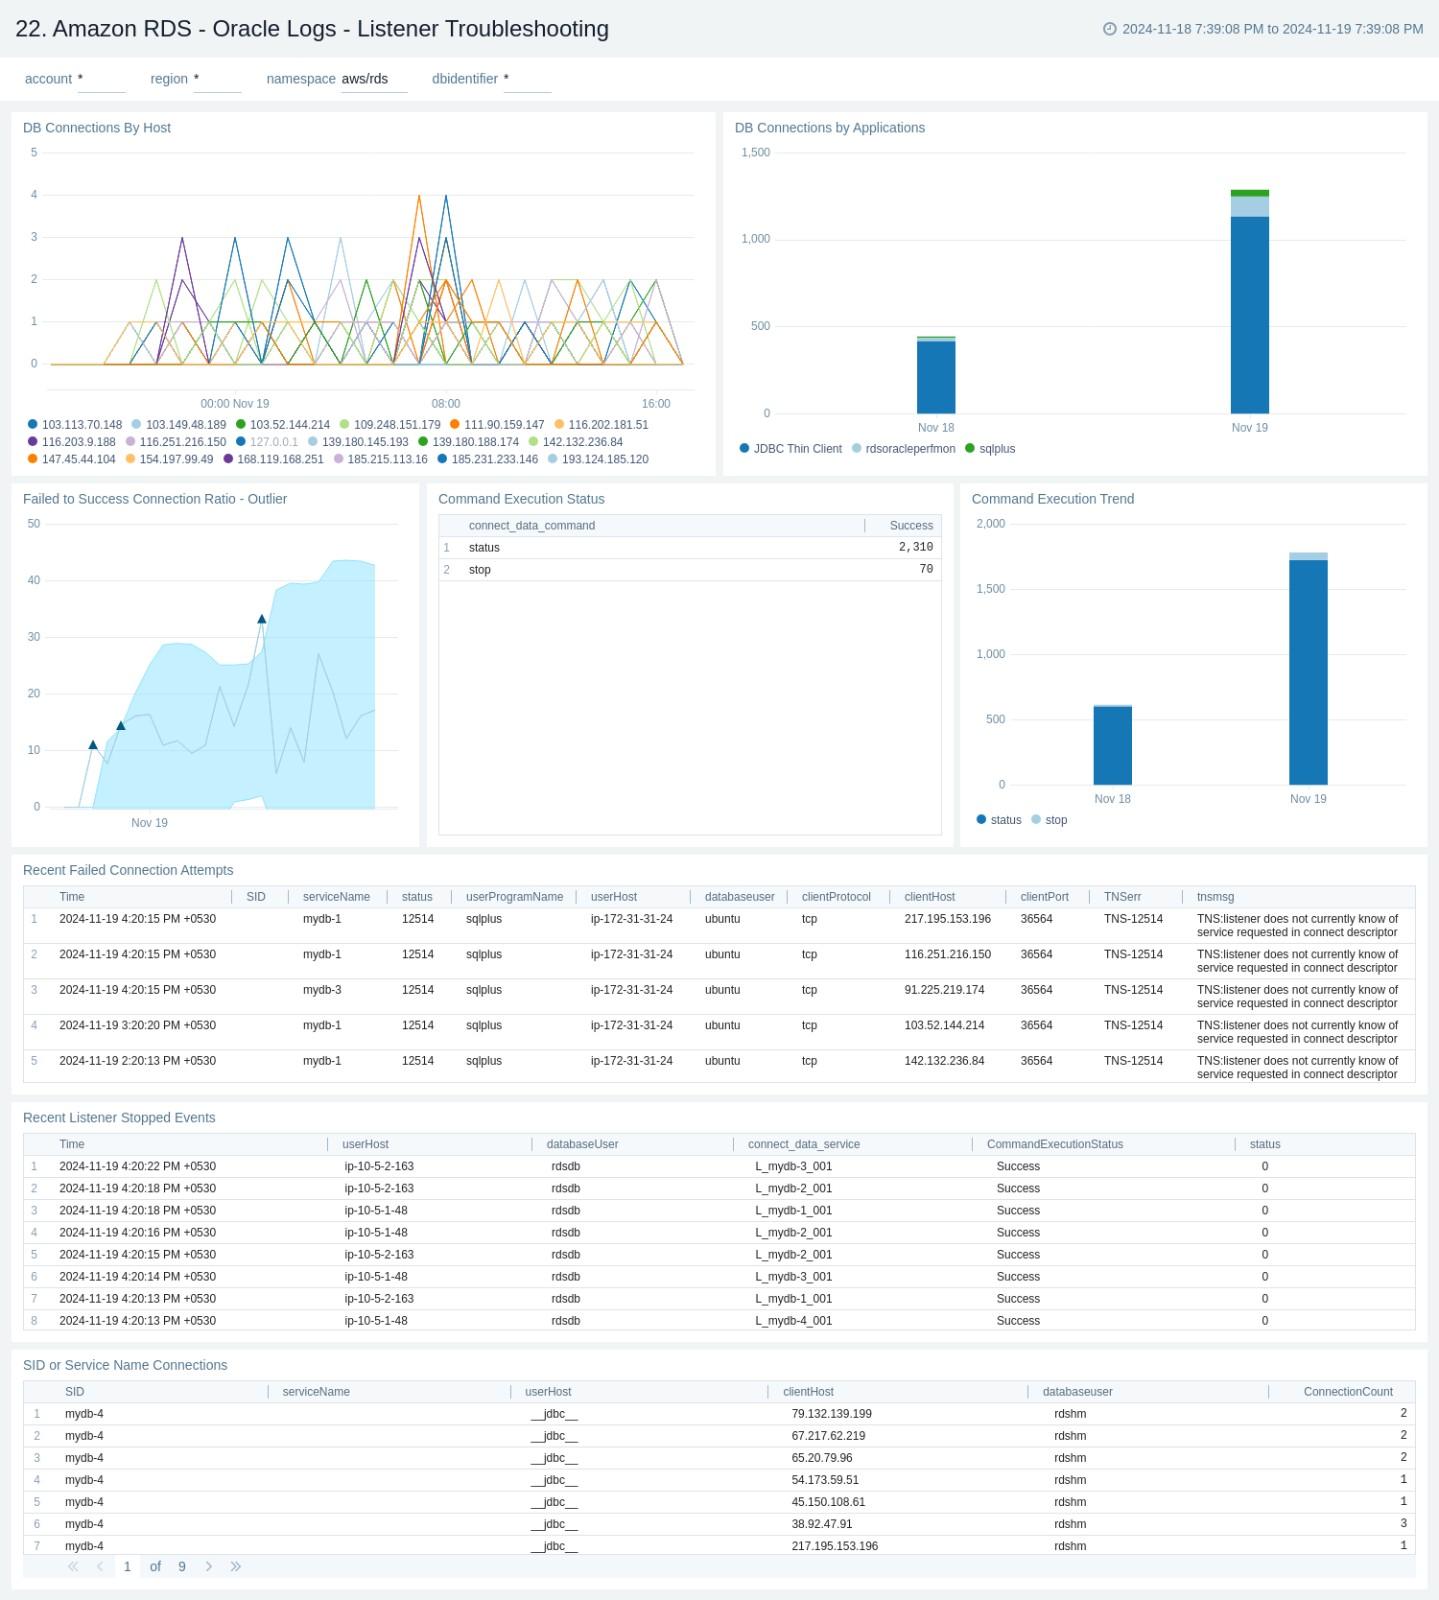
Oracle Logs - Listener Troubleshooting
The Amazon RDS - Oracle Logs - Listener Troubleshooting dashboard provides insights into Oracle listener process activity, including database connections by host and application, connection failures, command execution statuses and trends, and additional data from the Oracle Listener log.
Use this dashboard to:
- Monitor listener process activity on the Oracle RDS instance.
- Monitor database connections by host and application, track connection failures, analyze command execution statuses and trends, and gather insights from the Oracle Listener log.
Viewing the RDS Proxy dashboards
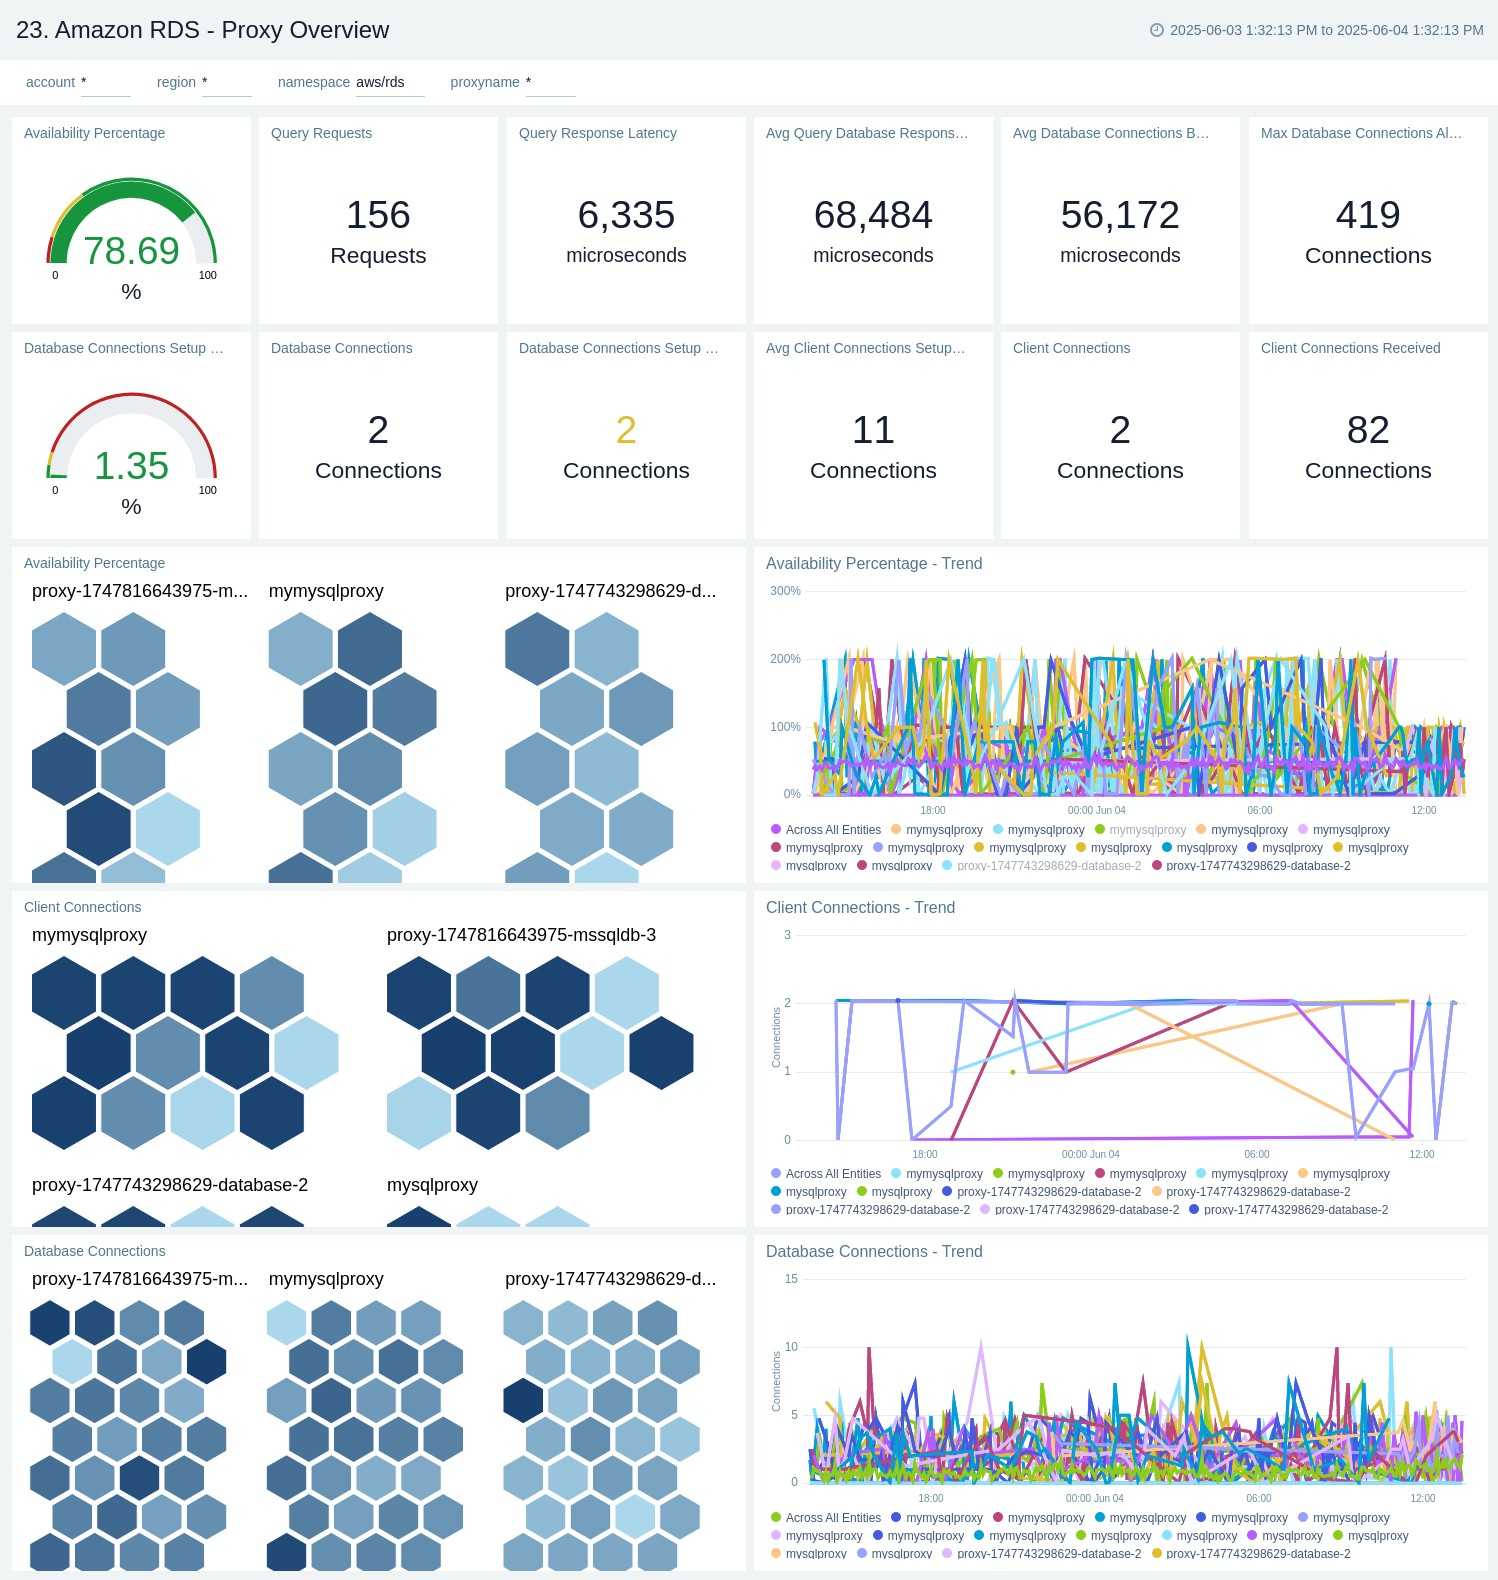
Proxy - Overview
The Amazon RDS Proxy Overview dashboard provides insights into proxy availability, client and database connections, and connection pool limits to help optimize database connectivity and performance.
Use this dashboard to:
- Monitor RDS Proxy availability and connection pool usage.
- Track client and database connection metrics, including connection limits, Latency, and usage trends, to optimize performance and troubleshoot connectivity issues.
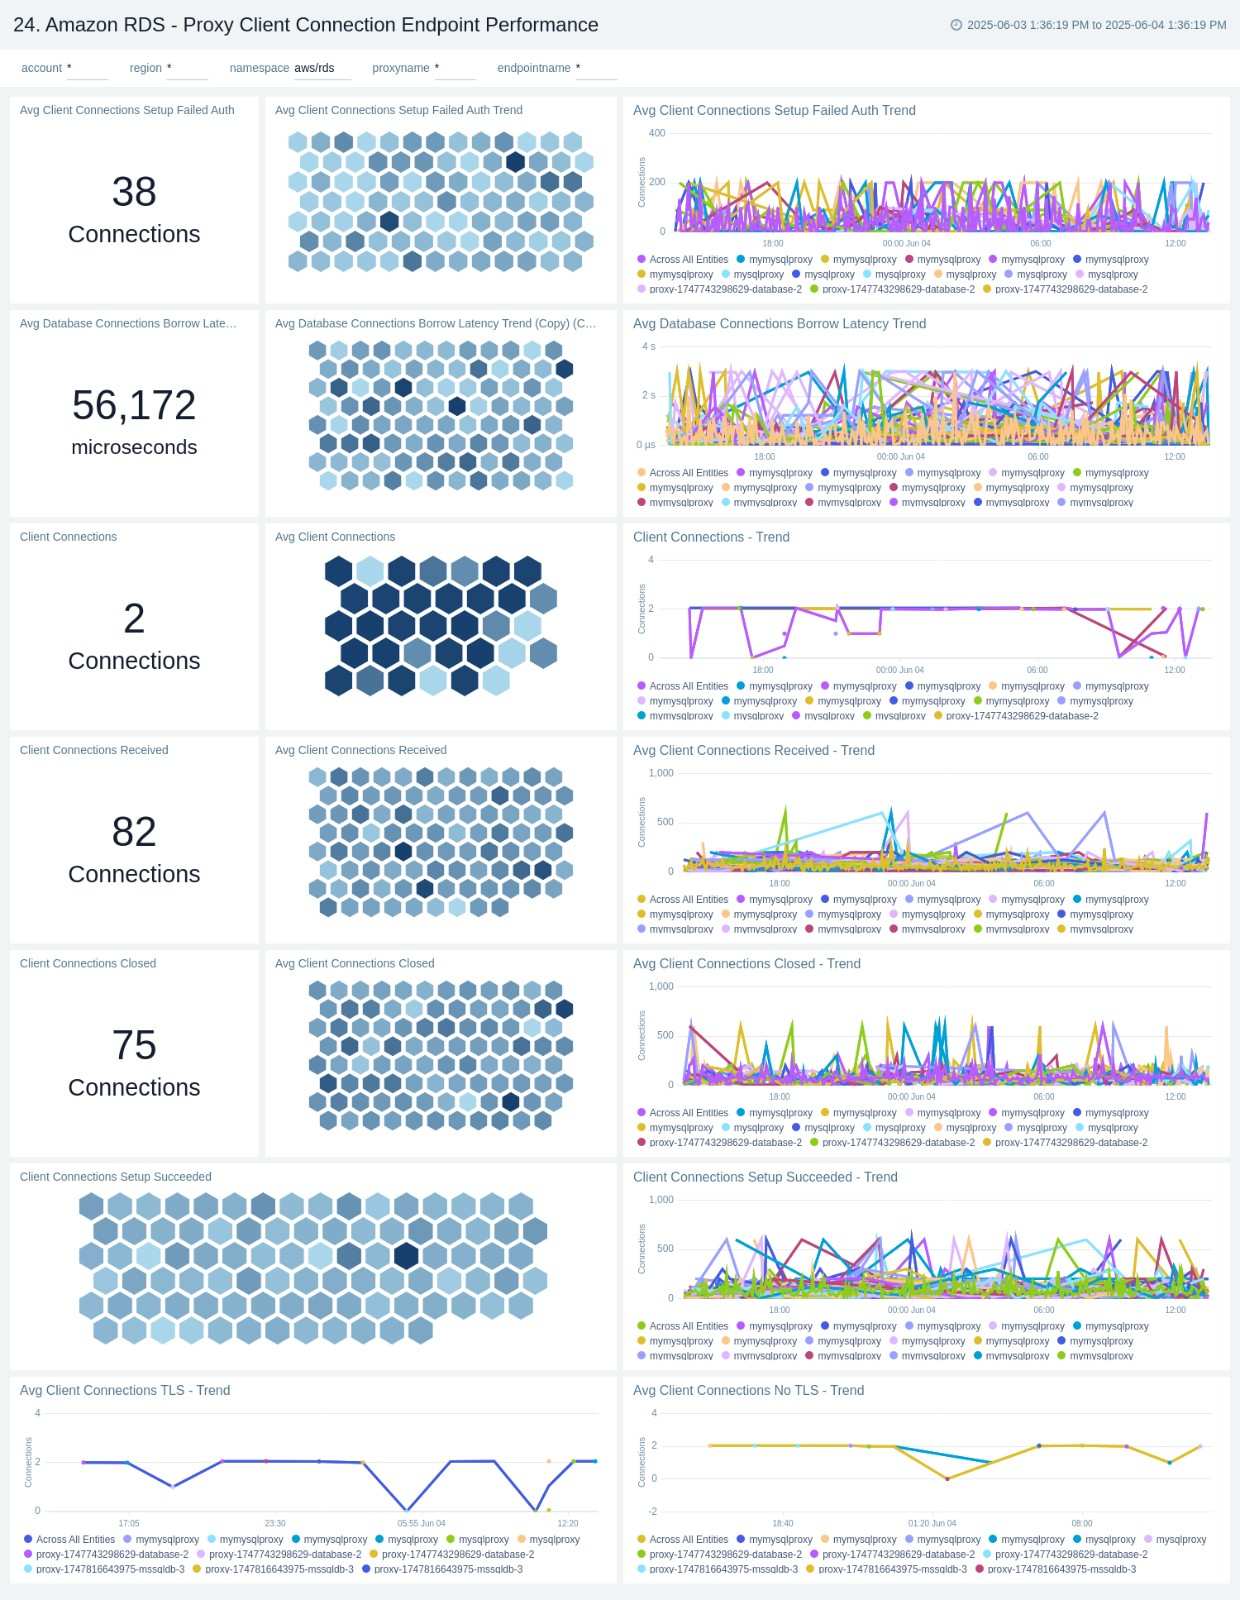
Proxy - Client Connection Endpoint Performance
The Amazon RDS - Proxy Client Connection Endpoint Performance dashboard provides insights into client connections, TLS usage, authentication success/failure, and connection latencies, helping you monitor and optimize proxy-managed database interactions.
Use this dashboard to:
- Monitor client connection patterns to the RDS Proxy.
- Track TLS encryption usage and authentication success or failure events.
- Analyze connection setup latency and performance trends.
- Gain insights into how applications interact with the database via the proxy to identify potential bottlenecks or security issues.
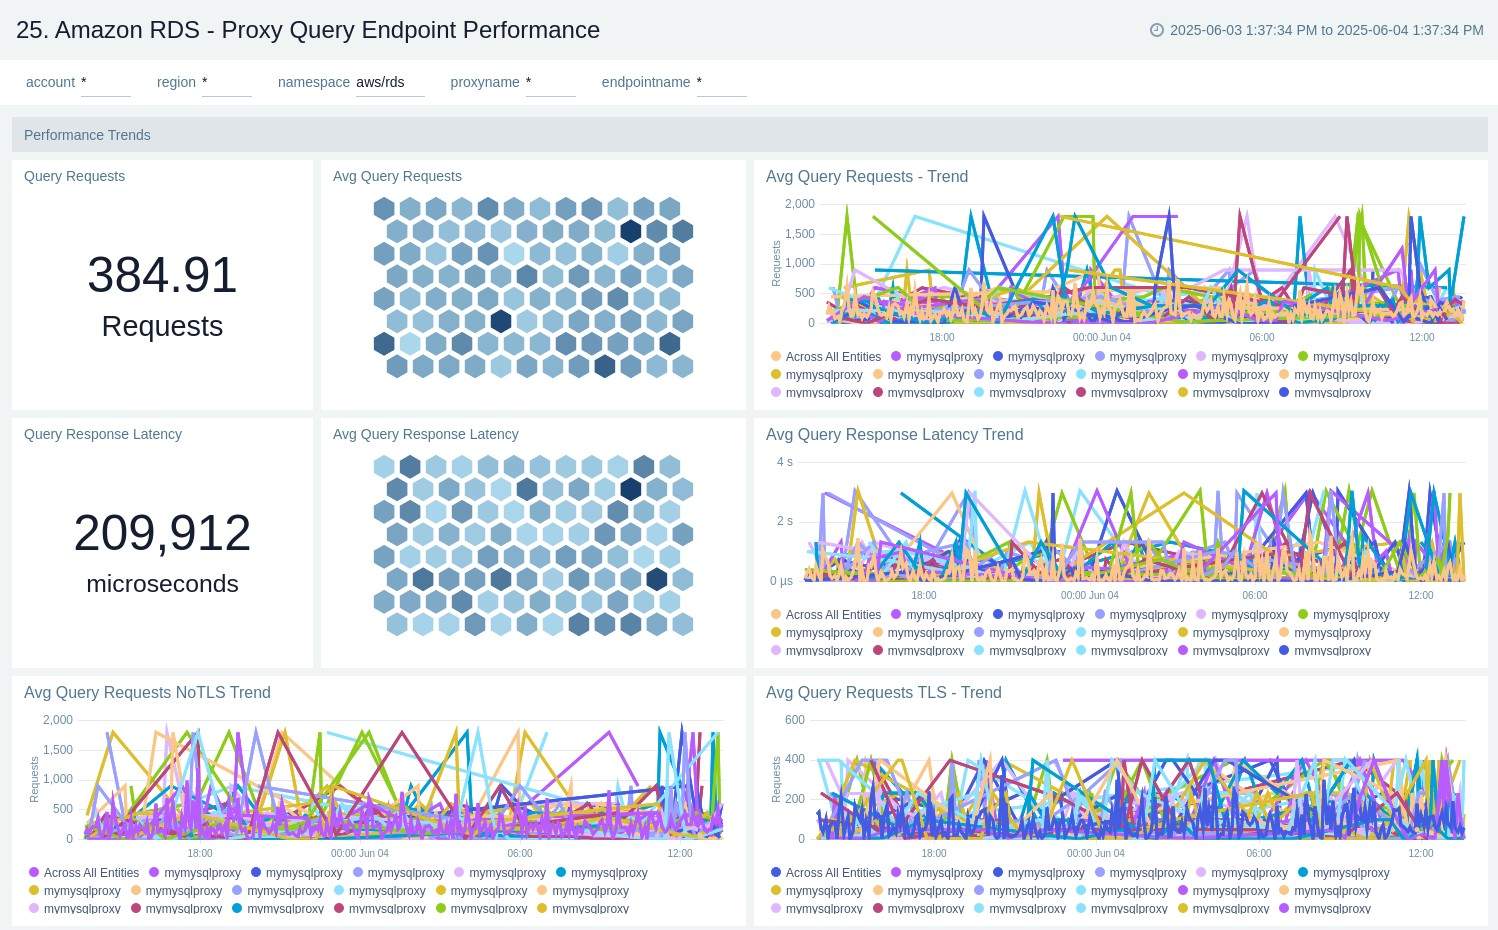
Proxy - Query Endpoint Performance
The Amazon RDS Proxy Query Endpoint Performance dashboard tracks query TLS usage and response latency to help monitor and optimise the performance.
Use this dashboard to:
- Monitor query traffic routed through the RDS Proxy query endpoint.
- Track TLS usage to ensure secure database interactions.
- Analyze query response latency to identify performance issues.
- Optimize database performance by evaluating proxy-handled query behavior.
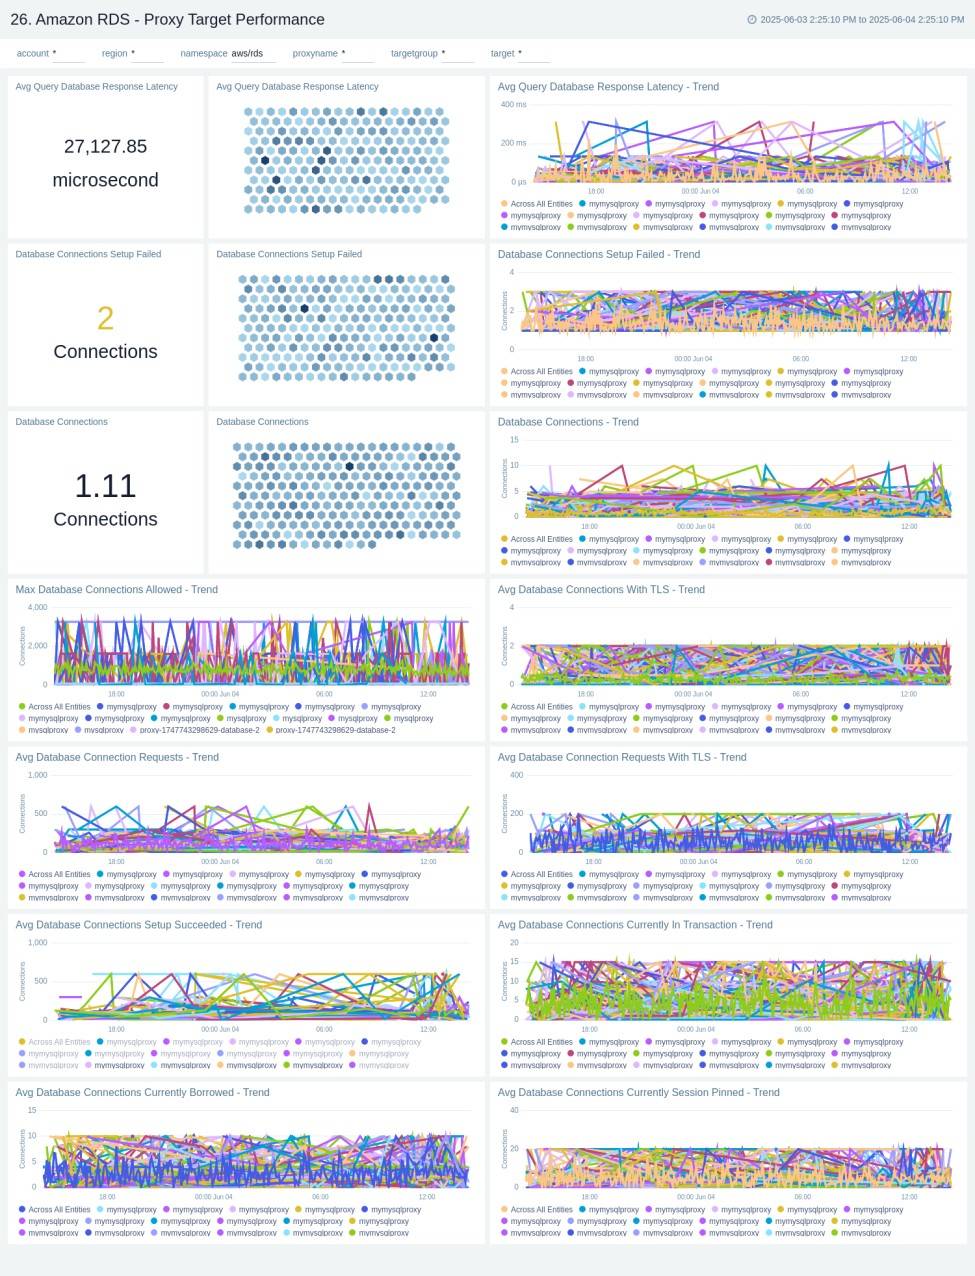
Proxy - Target Performance
The Amazon RDS - Proxy Target Performance dashboard offers insights into target-level metrics such as backend database connection utilization, response latency, TLS usage, and connection setup success rates. It enables monitoring of connection health and transaction patterns at the target level, helping to optimize the performance and reliability of interactions between the RDS Proxy and its database targets.
Use this dashboard to:
- Monitor backend database connections through the RDS Proxy.
- Track response latency, TLS usage, and connection setup success/failure rates.
- Analyze transaction behavior and connection health.
- Optimize performance and ensure reliable proxy-to-database interactions.
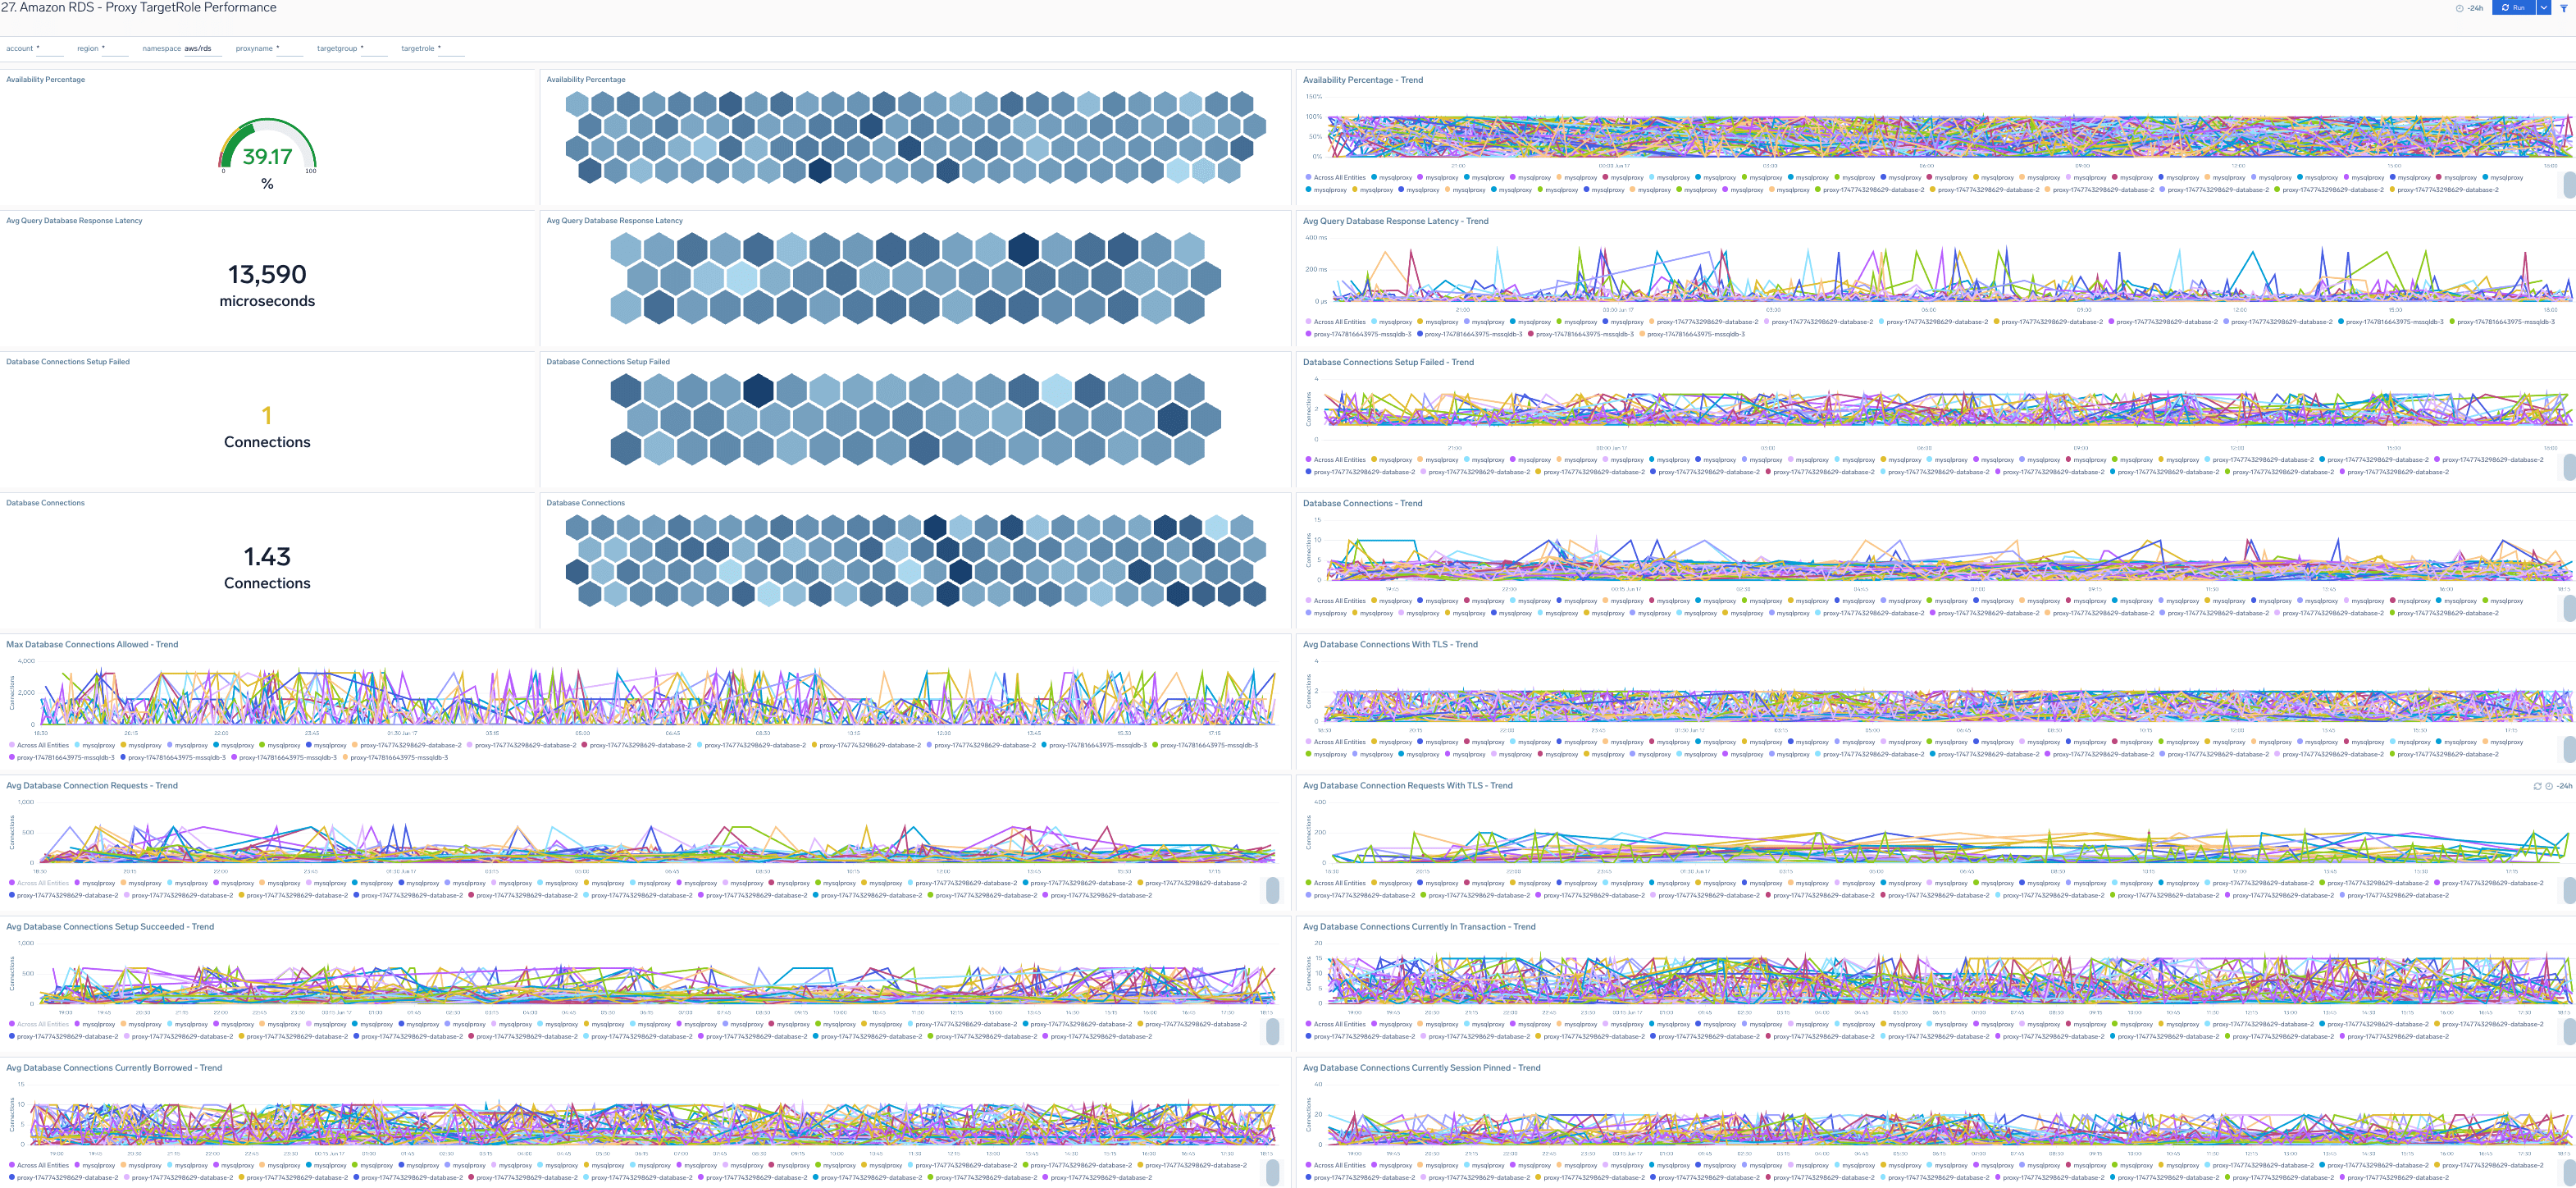
Proxy - TargetRole Performance
The Amazon RDS - Proxy TargetRole Performance dashboard provides detailed visibility into backend database connection usage, response latency, TLS adoption, and connection setup success rates, segmented by targetRole, such as "READ_ONLY" and "READWRITE". It helps monitor the health, availability, and transaction behavior of each target role, enabling performance optimization based on role-specific traffic patterns. Use this dashboard to:
- Monitor backend database connections through the RDS Proxy.
- Track response latency, TLS usage, and connection setup success/failure rates.
- Analyze transaction behavior and connection health.
- Optimize performance and ensure reliable proxy-to-database interactions.
Proxy - Audit
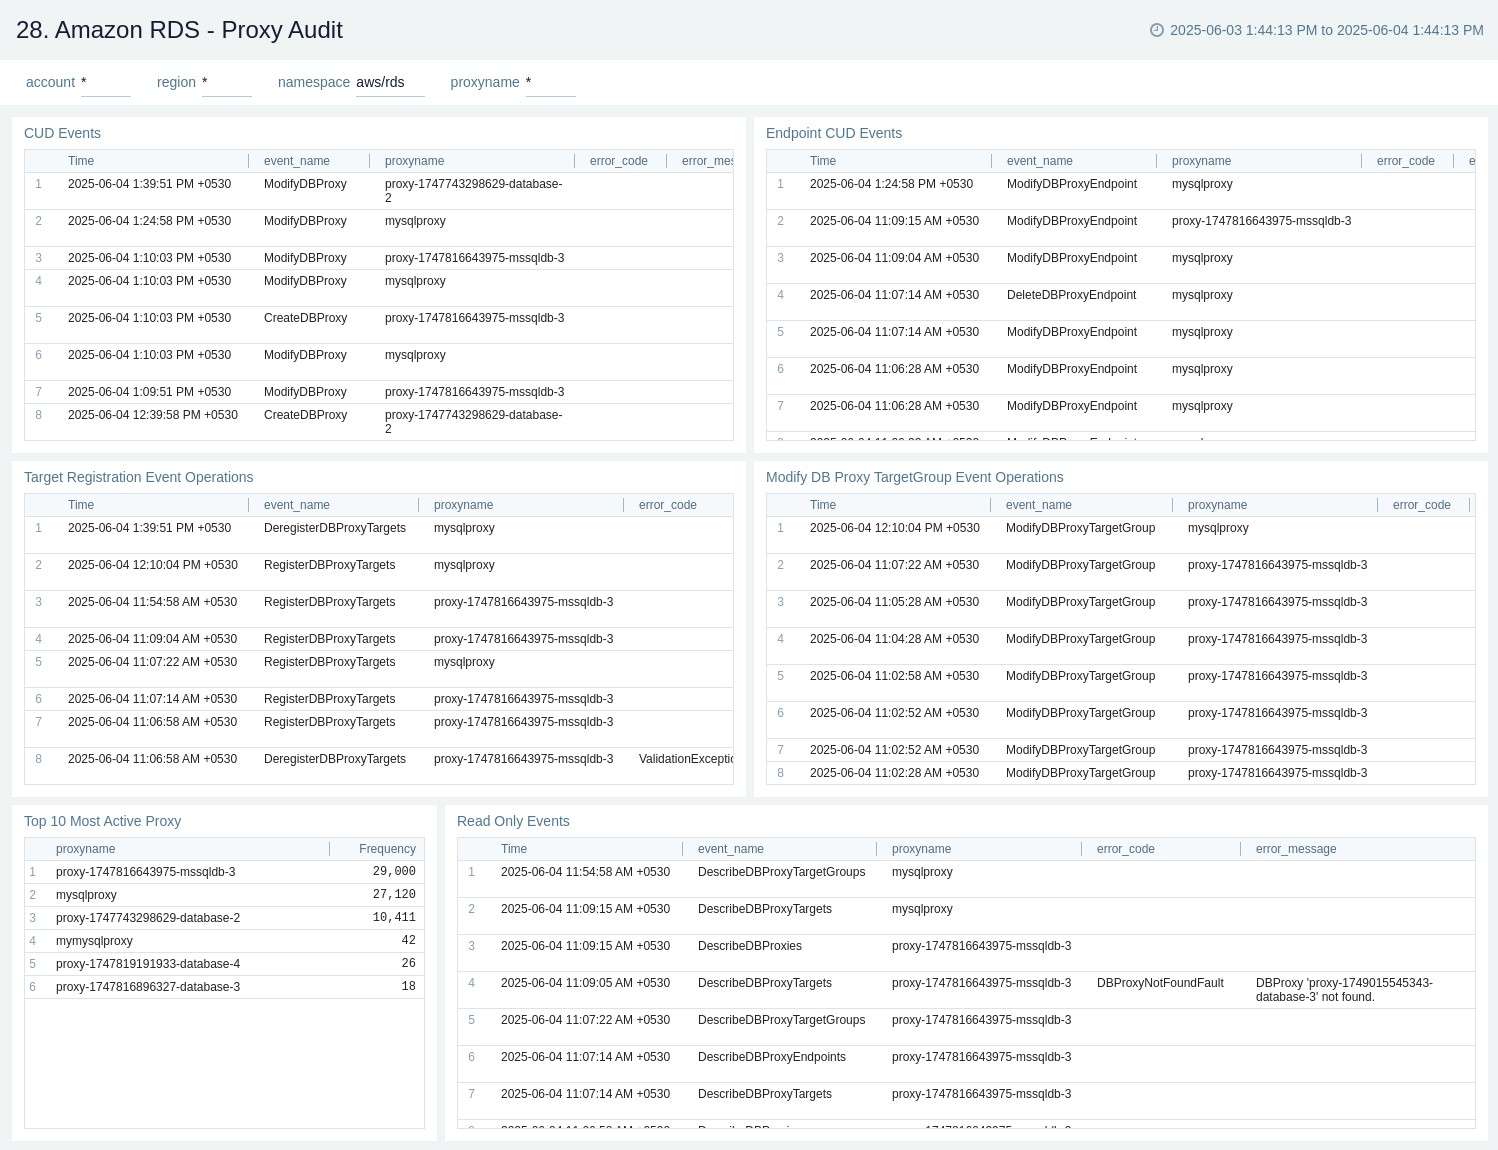
The Amazon RDS - Proxy Audit dashboard tracks CUD operations, read-only events, and the most active proxies, helping you monitor changes and user activity.
Use this dashboard to:
- Track Create, Update, and Delete (CUD) operations on RDS Proxy/Proxy Endpoint.
- Monitor read-only events and user activity.
- Identify the most active proxies.
- Gain visibility into changes and audit trail for proxy-managed database interactions.
Proxy - Log Analysis
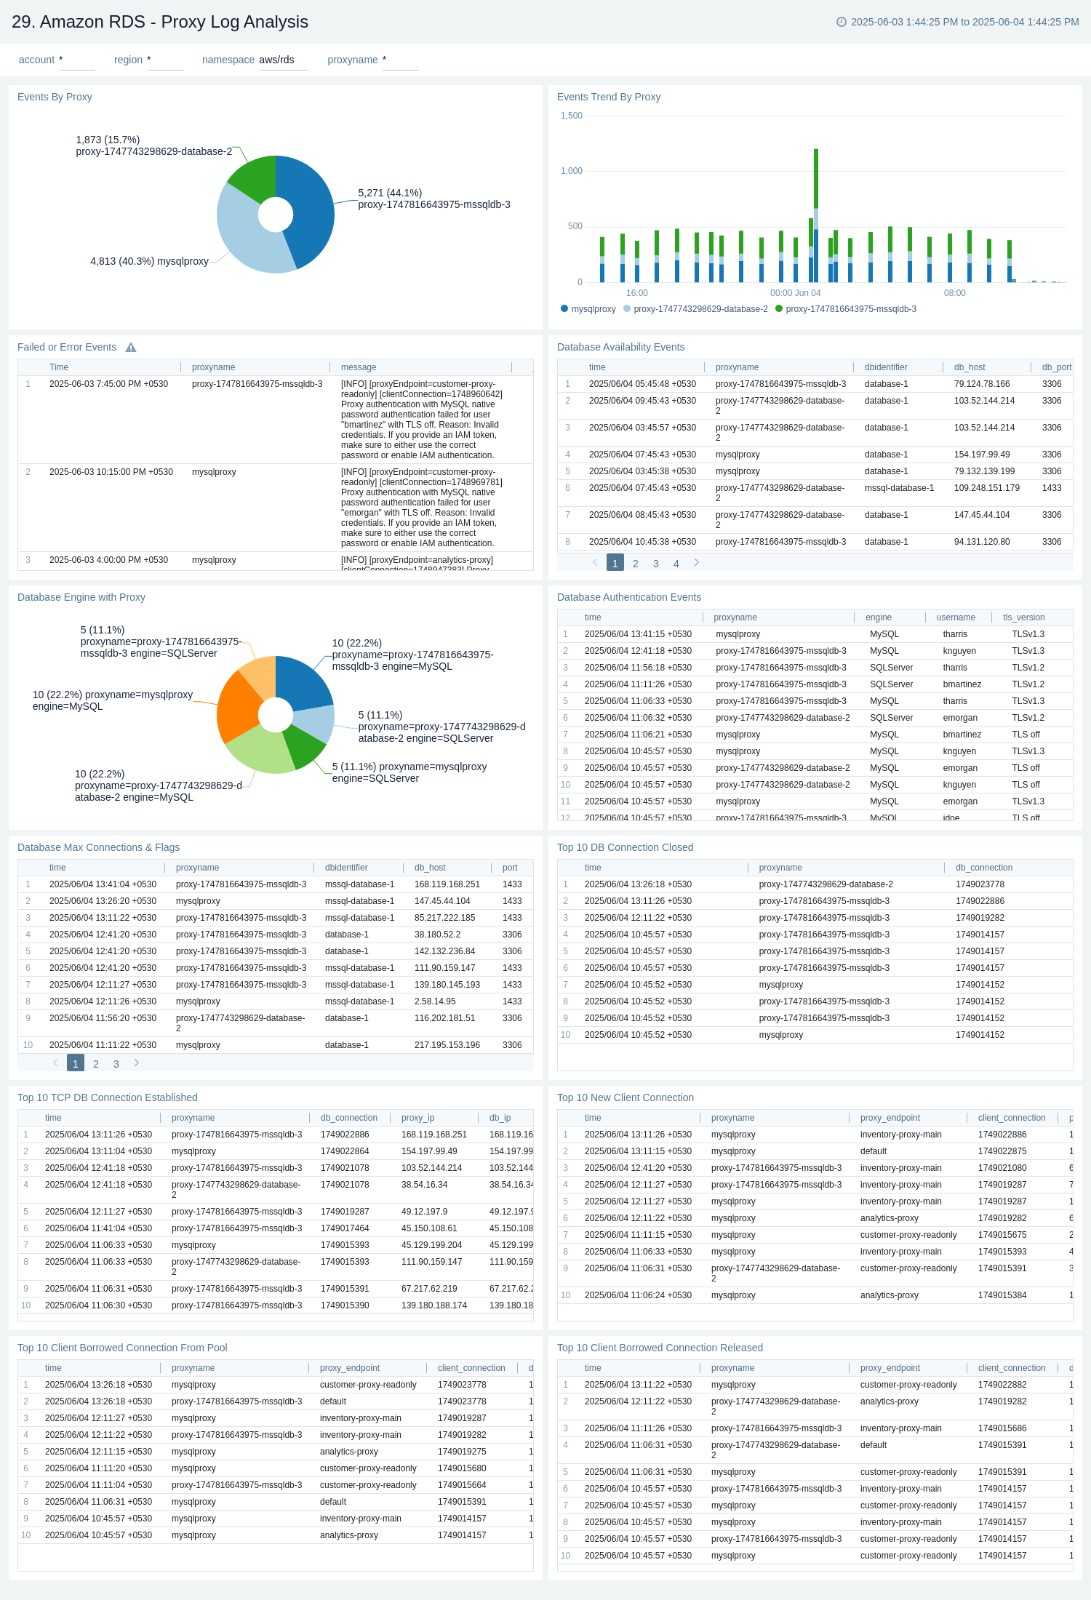
The Amazon RDS - Proxy Log Analysis dashboard provides insights into connection activity trends, including top database connection events, client connection pool usage, and event distribution by proxy. It also highlights failed or error events, database availability, and authentication events to help you monitor and troubleshoot proxy operations effectively.
Use this dashboard to:
- Analyze trends in connection activity and client pool usage.
- Monitor top database connection events and event distribution by proxy.
- Identify authentication issues, failures, and database availability problems.
- Troubleshoot proxy operations effectively using log insights.
Create monitors for Amazon RDS app
From your App Catalog:
- From the Sumo Logic navigation, select App Catalog.
- In the Search Apps field, search for and then select your app.
- Make sure the app is installed.
- Navigate to What's Included tab and scroll down to the Monitors section.
- Click Create next to the pre-configured monitors. In the create monitors window, adjust the trigger conditions and notifications settings based on your requirements.
- Scroll down to Monitor Details.
- Under Location click on New Folder.
note
By default, monitor will be saved in the root folder. So to make the maintenance easier, create a new folder in the location of your choice.
- Enter Folder Name. Folder Description is optional.
tip
Using app version in the folder name will be helpful to determine the versioning for future updates.
- Click Create. Once the folder is created, click on Save.
Amazon RDS alerts
These alerts are available for the Amazon RDS app.
| Alert Name | Alert Description and Conditions | Alert Condition | Recover Condition |
|---|---|---|---|
Amazon RDS - High CPU Utilization | This alert fires when we detect that the average CPU utilization for a database is high (>=85%) for an interval of 5 minutes. | Percentage >= 85% | Percentage < 85% |
Amazon RDS - High Disk Queue Depth | This alert fires when the average disk queue depth for a database is high (>=5) for an interval of 5 minutes. Higher this value, higher will be the number of outstanding I/Os (read/write requests) waiting to access the disk, which will impact the performance of your application. | Count >= 5 | Count < 5 |
Amazon RDS - High Read Latency | This alert fires when the average read latency of a database within a 5 minutes time interval is high (>=5 seconds). High read latency will affect the performance of your application. | Seconds >= 5 | Seconds < 5 |
Amazon RDS - High Write Latency | This alert fires when the average write latency of a database within a 5 minute interval is high (>=5 seconds). High write latencies will affect the performance of your application. | Seconds >= 5 | Seconds < 5 |
Amazon RDS - Low Aurora Buffer Cache Hit Ratio | This alert fires when the average RDS Aurora buffer cache hit ratio within a 5 minute interval is low (<= 50%). This indicates that a lower percentage of requests were served by the buffer cache, which could further indicate a degradation in application performance. | Percentage <= 50% | Percentage > 50% |
Amazon RDS - Low Burst Balance | This alert fires when we observe a low burst balance (<= 50%) for a given database. A low burst balance indicates you won't be able to scale up as fast for burstable database workloads on gp2 volumes. | Percentage <= 50% | Percentage > 50% |
Amazon RDS - Low Free Storage | This alert fires when the average free storage space of a RDS instance is low (< 512MB) for an interval of 15 minutes. | MB < 512 | MB >= 512 |
Amazon RDS - Low Freeable Memory | This alert fires when the average Freeable memory of an RDS instance is < 128 MB for an interval of 15 minutes. If this value is lower you may need to scale up to a larger instance class. | MB <= 128 | MB > 128 |
Amazon RDS MSSQL - Authentication failures from the same client IP on multiple databases | This alert fires when we detect a specific client IP attempting authentication failures on more than or equal to 10 databases over a 15 minute time-period. | Count >= 1 | Count < 1 |
Amazon RDS MSSQL - Database observing authentication failures from multiple client IPs | This alert fires when we detect more than or equal to 10 client IPs attempting authentication failures on the database over a 15-minute period. | Count >= 1 | Count < 1 |
Amazon RDS MySQL - Excessive Slow Query Detected | This alert fires when we detect the average time to execute a query is more than 5 seconds over last 10 minutes. | Count >= 1 | Count < 1 |
Amazon RDS MySQL - High Authentication Failure | This alert fires when we detect more than 10 authentication failures over a 5 minute time-period. | Count > 10 | Count <= 10 |
Amazon RDS - Oracle Logs - DB Crash | This alert fires when we detect greater than or equal to 1 Oracle DB crash over a 5 minute time-period. | Count >= 1 | Count < 1 |
Amazon RDS - Oracle Logs - Failed Connection Attempts | This alert fires when we detect greater than or equal to 25 failed connection attempts over a 5 minute time-period. | Count >= 25 | Count < 25 |
Amazon RDS PostgreSQL - Excessive Slow Query Detected | This alert fires when we detect the average time to execute a query is more than 5 seconds over a 10 minutes. | Count > 0 | Count <= 0 |
Amazon RDS PostgreSQL - High Authentication Failure | This alert fires when we detect more than 10 authentication failures in Postgres logs over a 5 minute time-period. | Count > 10 | Count <= 10 |
Amazon RDS PostgreSQL - High Errors | This alert fires when we detect high number (>10) of error/fatal logs in Postgres logs over a 5 minutes time period. | Count > 10 | Count <= 10 |
Amazon RDS PostgreSQL - Statement Timeouts | This alert fires when we detect Postgres logs show statement timeouts. | Count > 0 | Count <= 0 |
Amazon RDS - Unencrypted RDS resources created | This alert fires when an CreateDBCluster or CreateDBInstance CloudTrail event is detected where StorageEncrypted is not set to true, indicating an unencrypted RDS resource was created. | Count >= 1 | Count < 1 |
Upgrade/Downgrade the Amazon RDS app (Optional)
To update the app, do the following:
Next-Gen App: To install or update the app, you must be an account administrator or a user with Manage Apps, Manage Monitors, Manage Fields, Manage Metric Rules, and Manage Collectors capabilities depending upon the different content types part of the app.
- Select App Catalog.
- In the Search Apps field, search for and then select your app.
Optionally, you can identify apps that can be upgraded in the Upgrade available section. - To upgrade the app, select Upgrade from the Manage dropdown.
- If the upgrade does not have any configuration or property changes, you will be redirected to the Preview & Done section.
- If the upgrade has any configuration or property changes, you will be redirected to the Setup Data page.
- In the Configure section of your respective app, complete the following fields.
- Field Name. If you already have collectors and sources set up, select the configured metadata field name (eg _sourcecategory) or specify other custom metadata (eg: _collector) along with its metadata Field Value.
- Click Next. You will be redirected to the Preview & Done section.
Post-update
Your upgraded app will be installed in the Installed Apps folder and dashboard panels will start to fill automatically.
See our Release Notes changelog for new updates in the app.
To revert the app to a previous version, do the following:
- Select App Catalog.
- In the Search Apps field, search for and then select your app.
- To version down the app, select Revert to < previous version of your app > from the Manage dropdown.
Uninstalling the Amazon RDS app (Optional)
To uninstall the app, do the following:
- Select App Catalog.
- In the 🔎 Search Apps field, run a search for your desired app, then select it.
- Click Uninstall.