 Meet the new
Kubernetes
The Sumo Logic app for Kubernetes provides visibility into worker nodes and their application logs and helps you manage the master-node control plane, including the API server, etcd, kube-system, and worker nodes. With Sumo Logic Kubernetes, you can monitor and troubleshoot container health, replication, load balancing, pod state, and hardware resource allocation. Falco monitors and detects abnormal activity across containers, applications, hosts, and networks.
The Kubernetes app is a next-gen app. When you install it, it creates dashboards, monitors, and the fields the app needs.
Along with the Kubernetes app, the AKS Control Plane, GKE Control Plane, EKS Control Plane, or Kubernetes Control Plane apps provide dedicated dashboards for control plane components, including the API server, scheduler, and controller manager.
Kubernetes automates the deployment, management, scaling, networking, and availability of container-based applications. Kubernetes container orchestration lets you deploy and manage multi-container applications at scale.
For an end-to-end solution for deploying, managing, monitoring, and administering your Kubernetes environment, see the Kubernetes Solution pages.
Supported versions
The Sumo Logic Kubernetes app is compatible with the latest version of Sumo Logic Kubernetes Collection Helm Chart. A list of supported platforms can be found here.
Log and metric types
The Sumo Logic app for Kubernetes uses logs and metrics.
Log sources
- Application logs
- Kubernetes events
Metrics sources
- Node-exporter Metrics - System-level statistics about bare-metal nodes or virtual machines and generates metrics.
- Kube-state-metrics - Metrics about the state of Kubernetes logical objects, including node status, node capacity (CPU and memory), number of desired/available/unavailable/updated replicas per deployment, pod status (e.g., waiting, running, ready), and containers.
- Container (cAdvisor), CoreDNS, and Kubernetes API server metrics.
For more information, see this page. Metrics are collected using the Sumo Logic Distribution for OpenTelemetry Collector, which also enriches them with metadata.
Sample log messages
{"timestamp":1561534865020,"log":"E0626 07:41:05.020255       1
manager.go:101] Error in scraping containers from kubelet:192.168.190.54:10255:
failed to get all container stats from Kubelet URL \"http://192.168.190.54:10255/stats/container/\":
Post http://192.168.190.54:10255/stats/container/: dial tcp 192.168.190.54:10255:
getsockopt: connection refused"}
Sample queries
cluster = * and namespace = * and pod = * and container = *
| json field= "log" as message
| fields - message | count container | top 10 container by _count
Collecting Metrics and Logs for the Kubernetes app
This section explains how to collect logs and metrics for the Sumo Logic Kubernetes app.
Your logs and metrics must include the metadata fields the app dashboards use. The app creates these fields when you install it.
Refer to the Deployment Guide in our sumologic-kubernetes-collection GitHub repository for detailed instructions on how to collect Kubernetes logs, metrics, and events; enrich them with deployment, pod, and service-level metadata; and send them to Sumo Logic.
The Deployment Guide covers advanced configurations, best practices, performance, troubleshooting, and upgrades for our latest and previous versions of supported software.
Installing the Kubernetes app
Now that you have set up the collection for the Kubernetes app, install the Sumo Logic app for Kubernetes to use the pre-configured Kubernetes dashboards that provide visibility into your Kubernetes environment.
The Kubernetes app has no Field Name configuration step. Helm chart collection must already be set up before you install the app, as described in Collecting logs and metrics for the Kubernetes app.
To install the app, do the following:
Next-Gen App: To install or update the app, you must be an account administrator or a user with Manage Apps, Manage Monitors, Manage Fields, Manage Metric Rules, and Manage Collectors capabilities depending upon the different content types part of the app.
- Select App Catalog.
- In the 🔎 Search Apps field, run a search for your desired app, then select it.
- Click Install App.
note
Sometimes this button says Add Integration.
- Click Next in the Setup Data section.
- In the Configure section of your respective app, complete the following fields.
- Field Name. If you already have collectors and sources set up, select the configured metadata field name (eg _sourcecategory) or specify other custom metadata (eg: _collector) along with its metadata Field Value.
- Click Next. You will be redirected to the Preview & Done section.
Post-installation
Once your app is installed, it will appear in your Installed Apps folder, and dashboard panels will start to fill automatically.
Each panel slowly fills with data matching the time range query received since the panel was created. Results will not immediately be available but will be updated with full graphs and charts over time.
Post-installation options
After you install the app, the app page provides these options:
- Explore Dashboards. Opens the Kubernetes Explore hierarchy. You can also click Open Dashboards in Library to view the app dashboards in the library.
- Manage dropdown:
- Add Another Cluster. Walks you through the Add Repo and Install Helm chart steps for an additional cluster. Monitors are packaged with the app, so you don't need to install a separate monitor. See Create monitors for the Kubernetes app.
- Uninstall. See Uninstalling the Kubernetes app.
- Upgrade and Revert, when available. See Upgrade/Downgrade the Kubernetes app.
Delete the content of the previous version (Classic App)
Installing the next-gen app does not remove the dashboards from the previous Classic version of the Kubernetes app. The next-gen app content is installed in the Installed Apps folder of your Library. If you installed the Classic app, its dashboards remain in other Library folders.
After you confirm that the new app's dashboards work for your clusters, you can delete the dashboards outside the Installed Apps folder.
Deleting dashboards is permanent. Before you delete them, make sure no one in your org still relies on them, and copy any customizations you want to keep.
Fields
As part of the app installation process, the following fields will be created by default:
clustercontainerdeploymenthostnamespacenodepodservice
For information on fields, see the Fields help page.
As a best practice, do not delete or modify any fields, Field Extraction Rules (FERs), or Metric Rules created during the app installation. If you need to make updates, contact the Sumo Logic Support team.
Viewing Kubernetes dashboards
All dashboards have a set of filters that you can apply to the entire dashboard. Use these filters to drill down and examine the data to a granular level.
- You can change the time range for a dashboard or panel by selecting a predefined interval from a drop-down list, choosing a recently used time range, or specifying custom dates and times. Learn more.
- You can use template variables to drill down and examine the data on a granular level. For more information, see Filtering Dashboards with Template Variables.
- Most Next-Gen apps allow you to provide the scope at the installation time and are comprised of a key (
_sourceCategoryby default) and a default value for this key. Based on your input, the app dashboards will be parameterized with a dashboard variable, allowing you to change the dataset queried by all panels. This eliminates the need to create multiple copies of the same dashboard with different queries.
Cluster Explorer
The Kubernetes - Cluster Explorer dashboard provides a high-level view of cluster service health, along with details on each service's resource usage.
Use this dashboard to:
- Navigate the cluster topology
- Review the memory and CPU usage by cluster and service components.

Cluster
The Kubernetes - Cluster dashboard provides a detailed view of the cluster health, along with details on all the components and resources.
Use this dashboard to:
- Monitor overall cluster health.
- Get insight into the state and resource usage of cluster components and use this information to fine-tune your Kubernetes cluster.
- Get quick insights into the state of the related entities.

Cluster - Overview
The Kubernetes - Cluster - Overview dashboard provides a high-level view of the cluster health, along with details on all the components and resources.
Use this dashboard to:
- Get quick insights into the health of the cluster.
- View top resource-intensive components and use this information to fine-tune your cluster.

Node
The Kubernetes - Node dashboard provides detailed information on the health and performance of the cluster nodes.
Use this dashboard to:
- Monitor node health.
- Review node pressure conditions.
- Get insight into how resources are being used across nodes and fine-tune node configurations accordingly.
- Investigate potential issues with nodes.

Node - Overview
The Kubernetes - Node - Overview dashboard provides high-level information on cluster node health and performance.
Use this dashboard to:
- Get quick insights into the health of the node.
- View top resource-intensive components and use this information to fine-tune your node.

Namespace
The Kubernetes - Namespace dashboard provides a high-level view of cluster namespace health, along with details on the resources in use.
Use this dashboard to:
- Monitor namespace health.
- Get insight into the components of a namespace and how resources are being used across namespaces, and fine-tune configurations accordingly.
- Investigate potential issues.

Pod
The Kubernetes - Pod dashboard provides a high-level view of cluster pod health and resource utilization details.
Use this dashboard to:
- Monitor pod health.
- Track the restart rate by container.
- Get insight into the components of a pod and how resources are being used across namespaces, and fine-tune configurations accordingly.
- Investigate potential issues.

Container
The Kubernetes - Container dashboard provides a high-level view of cluster container health and details on resource utilization.
Use this dashboard to:
- Monitor container health.
- Get insight into container resource utilization, including CPU throttling, and fine-tune configurations accordingly.
- Determine if containers are stuck in CrashLoopBackOff, Terminated, or Waiting states and make necessary adjustments.
- Investigate containers that are over-utilizing resources.

DaemonSets - Overview
The Kubernetes - DaemonSets - Overview dashboard provides a high-level view of DaemonSet health.
Use this dashboard to:
- Monitor the health of DaemonSets.
- Identify whether the required replica level is achieved or not.
- View logs and errors, and investigate potential issues.

StatefulSets - Overview
The Kubernetes - StatefulSets - Overview dashboard provides a high-level view of StatefulSet health.
Use this dashboard to:
- Monitor the health of StatefulSets.
- Identify whether the required replica level is achieved or not.
- View logs and errors and investigate potential issues.

Deployment - Overview
The Kubernetes - Deployment - Overview dashboard provides high-level insights into the health and performance of your Kubernetes deployments.
Use this dashboard to:
- Monitor the health of deployments in your Kubernetes environment.
- Identify whether the required replica level has been achieved or not.
- View logs and errors and investigate potential issues.

Collection Health Check
The Kubernetes - Collection Health Check dashboard displays collection status from OTel components in the Kubernetes cluster.
Use this dashboard to:
- Monitor the health of OpenTelemetry-based collection in your Kubernetes environment.
- Get insight into resource utilization and fine-tune configurations accordingly.
- View logs and errors and investigate potential issues.

Deployment
The Kubernetes - Deployment dashboard provides detailed insights into the health and performance of your Kubernetes deployments.
Use this dashboard to:
- Monitor the health of deployments in your Kubernetes environment.
- Identify whether the required replica level has been achieved or not.
- View logs and errors and investigate potential issues.

Events
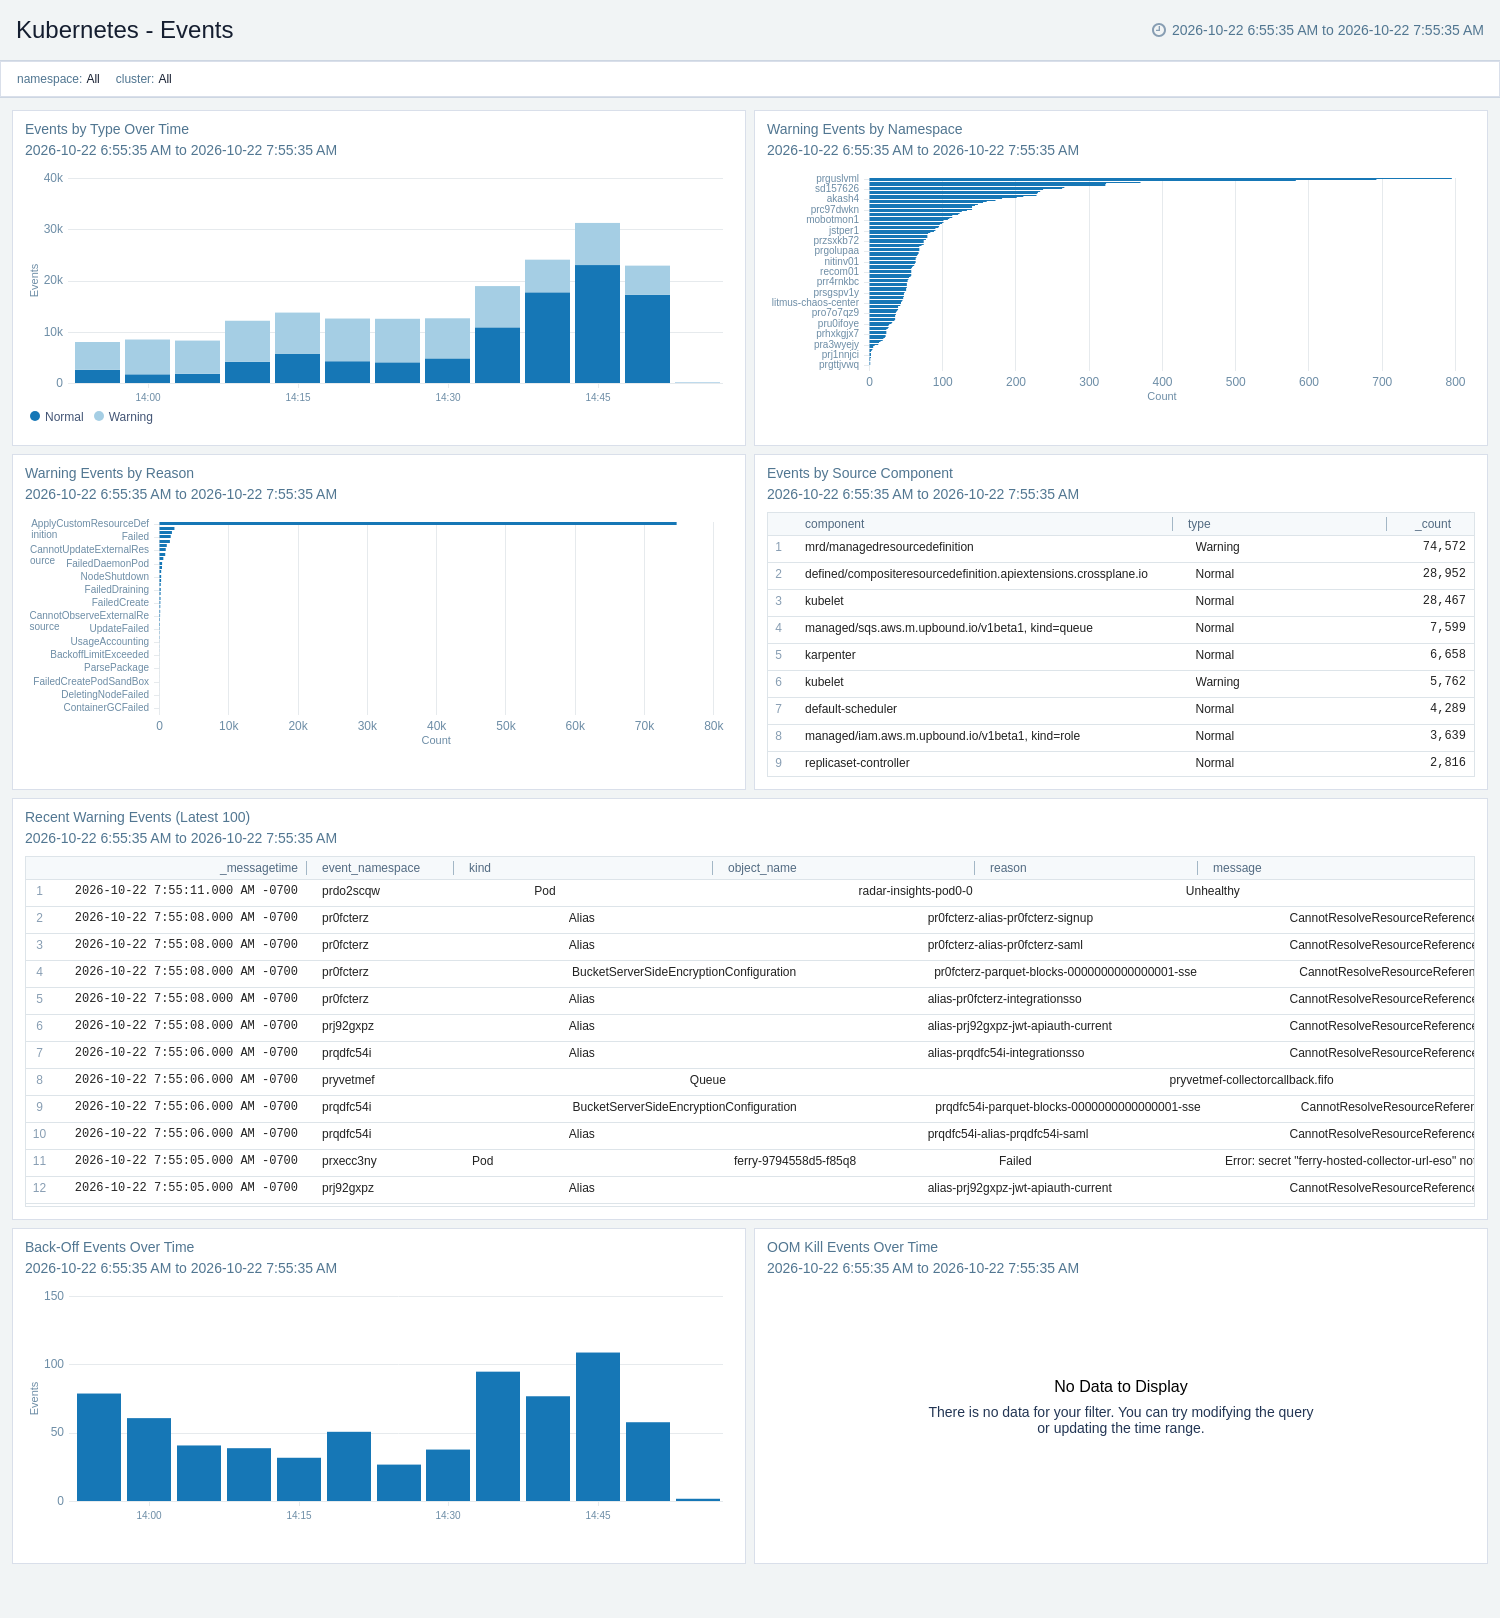
The Kubernetes - Events dashboard provides visibility into cluster events, warning conditions, and pod lifecycle activities using Kubernetes event logs.
Use this dashboard to:
- Review events by type over time, and by source component.
- Investigate warning events by namespace and by reason, and review the latest warning events.
- Track Back-Off and OOM Kill events over time.
Security Overview
This dashboard relies on Falco. If the dashboard is not populated, enable Falco by setting the flag falco.enabled to "true" in values.yaml, as described here.
The Kubernetes - Security Overview dashboard provides high-level details of anomalous container, application, host, and network activity.
Use this dashboard to:
- Identify and investigate anomalous activity.

Security Rules Triggered
This dashboard relies on Falco. If the dashboard is not populated, enable Falco by setting the flag falco.enabled to "true" in values.yaml. For details, please see the Sumo Logic Kubernetes Collection Helm Chart documentation.
The Kubernetes - Security Rules Triggered dashboard provides detailed information on anomalous activity and the OOB Falco rules triggered by activity on your infrastructure.
Use this dashboard to:
- Review detailed information on anomalous activity.
- Review whether the OOB Falco security events are triggered and identify the root cause.

Service
The Kubernetes - Service dashboard provides a high-level view of cluster service health, along with details on the resources services use.
Use this dashboard to:
- Review detailed information on services.
- Identify components by service.
- Determine any errors and warnings by service.

CoreDNS
CoreDNS is a DNS server that can replace kube-dns in a Kubernetes cluster.
The Kubernetes - CoreDNS dashboard provides insights into CoreDNS status, including cache details and resource usage.
Use this dashboard to:
- Track the total number of requests.
- Review Cache statistics.
- Monitor CoreDNS's resource usage and spikes.

HPA
The Horizontal Pod Autoscaler automatically scales the number of Pods in a replication controller, deployment, replica set, or stateful set based on observed CPU utilization.
The Kubernetes - HPA dashboard provides a high-level view of the Horizontal Pod Autoscaler's health.
Use this dashboard to:
- Identify whether the required replica level has been achieved or not.
- View logs and errors and investigate potential issues.

Create monitors for the Kubernetes app
From your App Catalog:
- From the Sumo Logic navigation, select App Catalog.
- In the Search Apps field, search for and then select your app.
- Make sure the app is installed.
- Navigate to What's Included tab and scroll down to the Monitors section.
- Click Create next to the pre-configured monitors. In the create monitors window, adjust the trigger conditions and notifications settings based on your requirements.
- Scroll down to Monitor Details.
- Under Location click on New Folder.
note
By default, monitor will be saved in the root folder. So to make the maintenance easier, create a new folder in the location of your choice.
- Enter Folder Name. Folder Description is optional.
tip
Using app version in the folder name will be helpful to determine the versioning for future updates.
- Click Create. Once the folder is created, click on Save.
Kubernetes alerts
The app includes the following monitors. New monitors include Node Disk Pressure, Node Memory Pressure, Deployment Replica Mismatch, Node Filesystem Running Full, and API Server Error Rate High.
| Name | Description | Trigger Type (Critical / Warning / MissingData) | Alert Condition | Recovery Condition |
|---|---|---|---|---|
Kubernetes - Kube Node Not Ready | This alert is fired when a Kubernetes node is not in a ready state. | Critical/MissingData | <=0 | >0 |
Kubernetes - DaemonSet Not Scheduled | This alert is fired when DaemonSet pods are not scheduled. | Warning | >0 | <=0 |
Kubernetes - etcd Insufficient Members | This alert is fired when the etcd cluster has insufficient members. | Critical | >0 | <=0 |
Kubernetes - Pod Crash Looping | This alert is fired when a pod is crash-looping. | Warning | >0 | <=0 |
Kubernetes - Multiple Terminated Pods (Errored Out) | This alert is fired when pods have been terminated due to errors. | Critical | >5 | <=5 |
Kubernetes - Multiple Terminated Pods (OOM Killed) | This alert is fired when pods have been OOM Killed. | Critical | >5 | <=5 |
Kubernetes - Container Waiting | This alert is fired when a pod container has been in a waiting state (for example ImagePullBackOff or CrashLoopBackOff) for more than 5 minutes. | Warning | >0 | <=0 |
Kubernetes - Kubelet Down | This alert is fired when Kubelet disappears from Prometheus target discovery. | Critical/MissingData | <=0 | >0 |
Kubernetes - Kube API Down | This alert is fired when KubeAPI disappears from Prometheus target discovery. | Critical/MissingData | <=0 | >0 |
Kubernetes - Node CPU Utilization High | This alert is fired when Node CPU utilization is high. | Critical/Warning | Critical: >0.9, Warning: >0.75 | Critical: <=0.9, Warning: <=0.75 |
Kubernetes - Prometheus Remote Storage Failures | This alert is fired when Prometheus fails to send samples to remote storage. | Critical | >1 | <=1 |
Kubernetes - Kube Controller Manager Down | This alert is fired when KubeControllerManager disappears from Prometheus target discovery. | Critical/MissingData | <=0 | >0 |
Kubernetes - DaemonSet Misscheduled | This alert is fired when DaemonSet pods are mis-scheduled (running on nodes they should not be on). | Warning | >0 | <=0 |
Kubernetes - Kube Scheduler Down | This alert is fired when Kube Scheduler disappears from Prometheus target discovery. | Critical/MissingData | <=0 | >0 |
Kubernetes - StatefulSet Generation Mismatch | This alert is fired when the observed StatefulSet generation differs from the metadata generation, indicating a possible rollback. | Warning | >0 | <=0 |
Kubernetes - Multiple Terminated Pods (Deadline Exceeded) | This alert is fired when pods have been terminated due to deadline exceeded. | Critical | >5 | <=5 |
Kubernetes - Multiple Terminated Pods (Container Cannot Run) | This alert is fired when pods have been terminated because the container cannot run. | Critical | >5 | <=5 |
Kubernetes - Multiple Containers OOM Killed | This alert is fired when multiple containers are OOM Killed. | Warning | >=5 | <5 |
Kubernetes - HPA Maxed Out | This alert is fired when HPA is running at maximum replicas. | Warning | <=0 | >0 |
Kubernetes - Node Disk Pressure | This alert fires when a Kubernetes node reports DiskPressure condition, indicating the node is running low on disk space. | Warning | >0 | <=0 |
Kubernetes - Node Memory Pressure | This alert fires when a Kubernetes node reports MemoryPressure condition, indicating the node is running low on memory. | Warning | >0 | <=0 |
Kubernetes - Deployment Replica Mismatch | This alert fires when the number of available replicas for a deployment is less than the desired replica count. | Warning | >0 | <=0 |
Kubernetes - Node Filesystem Running Full | This alert fires when a node's filesystem is predicted to run out of space. Critical at less than 5% free, Warning at less than 10% free. | Critical/Warning | Critical: <5, Warning: <10 | Critical: >=5, Warning: >=10 |
Kubernetes - API Server Error Rate High | This alert fires when the Kubernetes API server error rate (5xx responses) exceeds 5% of total requests. Critical at>10%, Warning at>5%. | Critical/Warning | Critical: >10, Warning: >5 | Critical: <=10, Warning: <=5 |
Upgrade/Downgrade the Kubernetes app (Optional)
To update the app, do the following:
Next-Gen App: To install or update the app, you must be an account administrator or a user with Manage Apps, Manage Monitors, Manage Fields, Manage Metric Rules, and Manage Collectors capabilities depending upon the different content types part of the app.
- Select App Catalog.
- In the Search Apps field, search for and then select your app.
Optionally, you can identify apps that can be upgraded in the Upgrade available section. - To upgrade the app, select Upgrade from the Manage dropdown.
- If the upgrade does not have any configuration or property changes, you will be redirected to the Preview & Done section.
- If the upgrade has any configuration or property changes, you will be redirected to the Setup Data page.
- In the Configure section of your respective app, complete the following fields.
- Field Name. If you already have collectors and sources set up, select the configured metadata field name (eg _sourcecategory) or specify other custom metadata (eg: _collector) along with its metadata Field Value.
- Click Next. You will be redirected to the Preview & Done section.
Post-update
Your upgraded app will be installed in the Installed Apps folder and dashboard panels will start to fill automatically.
See our Release Notes changelog for new updates in the app.
To revert the app to a previous version, do the following:
- Select App Catalog.
- In the Search Apps field, search for and then select your app.
- To version down the app, select Revert to < previous version of your app > from the Manage dropdown.
Uninstalling the Kubernetes app (Optional)
To uninstall the app, do the following:
- Select App Catalog.
- In the 🔎 Search Apps field, run a search for Kubernetes, then select it.
- Click Manage, and then select Uninstall.
FAQ
What does the Sumo Logic Kubernetes app monitor?
It monitors worker node and application health across your Kubernetes cluster, including container health, replication, load balancing, pod state, and hardware resource allocation, plus cluster events and anomalous activity detected by Falco.
What data sources does the Kubernetes app use?
It uses application logs and Kubernetes events, plus Node Exporter, kube-state-metrics, cAdvisor, CoreDNS, and API server metrics, collected using the Sumo Logic Distribution for the OpenTelemetry Collector.
Do I need a separate app for the Kubernetes control plane?
The Kubernetes app includes monitors for control plane components such as the API server, scheduler, and controller manager. For dedicated control plane dashboards, use the AKS Control Plane, GKE Control Plane, EKS Control Plane, or Kubernetes Control Plane app alongside it.
Which Helm chart version does the Kubernetes app require?
The app supports the latest version of the Sumo Logic Kubernetes Collection Helm Chart. Check the support matrix in the GitHub repository for the exact supported platforms and versions.
Can the Kubernetes app detect security issues?
Yes. The Security Overview and Security Rules Triggered dashboards rely on Falco to show anomalous container, application, host, and network activity, and which out-of-the-box Falco rules were triggered.
What new fields appear in Hosted Kubernetes Collectors after v5.0.0?
You will see the following new fields in the Hosted Kubernetes Collectors after upgrading or installing v5.0.0 of the Sumo Logic Kubernetes Collection.
sumo.cluster.name: <cluster_name> (Shows the cluster name set during the Helm chart installation)
sumo.helm.release: <helm_version> (Shows the Helm chart version used to install Sumo Logic Kubernetes Collection)
sumo.hostedcollector.subtype: K8S

These fields are required to support the Kubernetes Collection page. Removing them prevents you from viewing content on that page. These new fields are static and do not impact the user's storage/ingest budget. Because the new fields are static, they also don't affect the cardinality of the metric time series.
These fields are required to support the new Kubernetes Collection page. If users remove these fields, they will not be able to view content on the new Kubernetes Collection page (upcoming feature).
Does Sumo Logic offer cloud-native log management for Kubernetes?
Yes. Sumo Logic is a cloud-native platform, and the Kubernetes app collects and visualizes your cluster's application logs and metrics using the Sumo Logic Kubernetes Collection Helm chart, with no logging infrastructure for you to run. The security dashboards use Falco to show anomalous activity, so your security operations team can use the same data.