Docker - OpenTelemetry Collector

The Sumo Logic app for Docker is a unified logs and metrics app that enables you to monitor Docker deployments. The app provides preconfigured dashboards that include information about container state and resource usage, including information on CPU, memory, block I/O, and network.
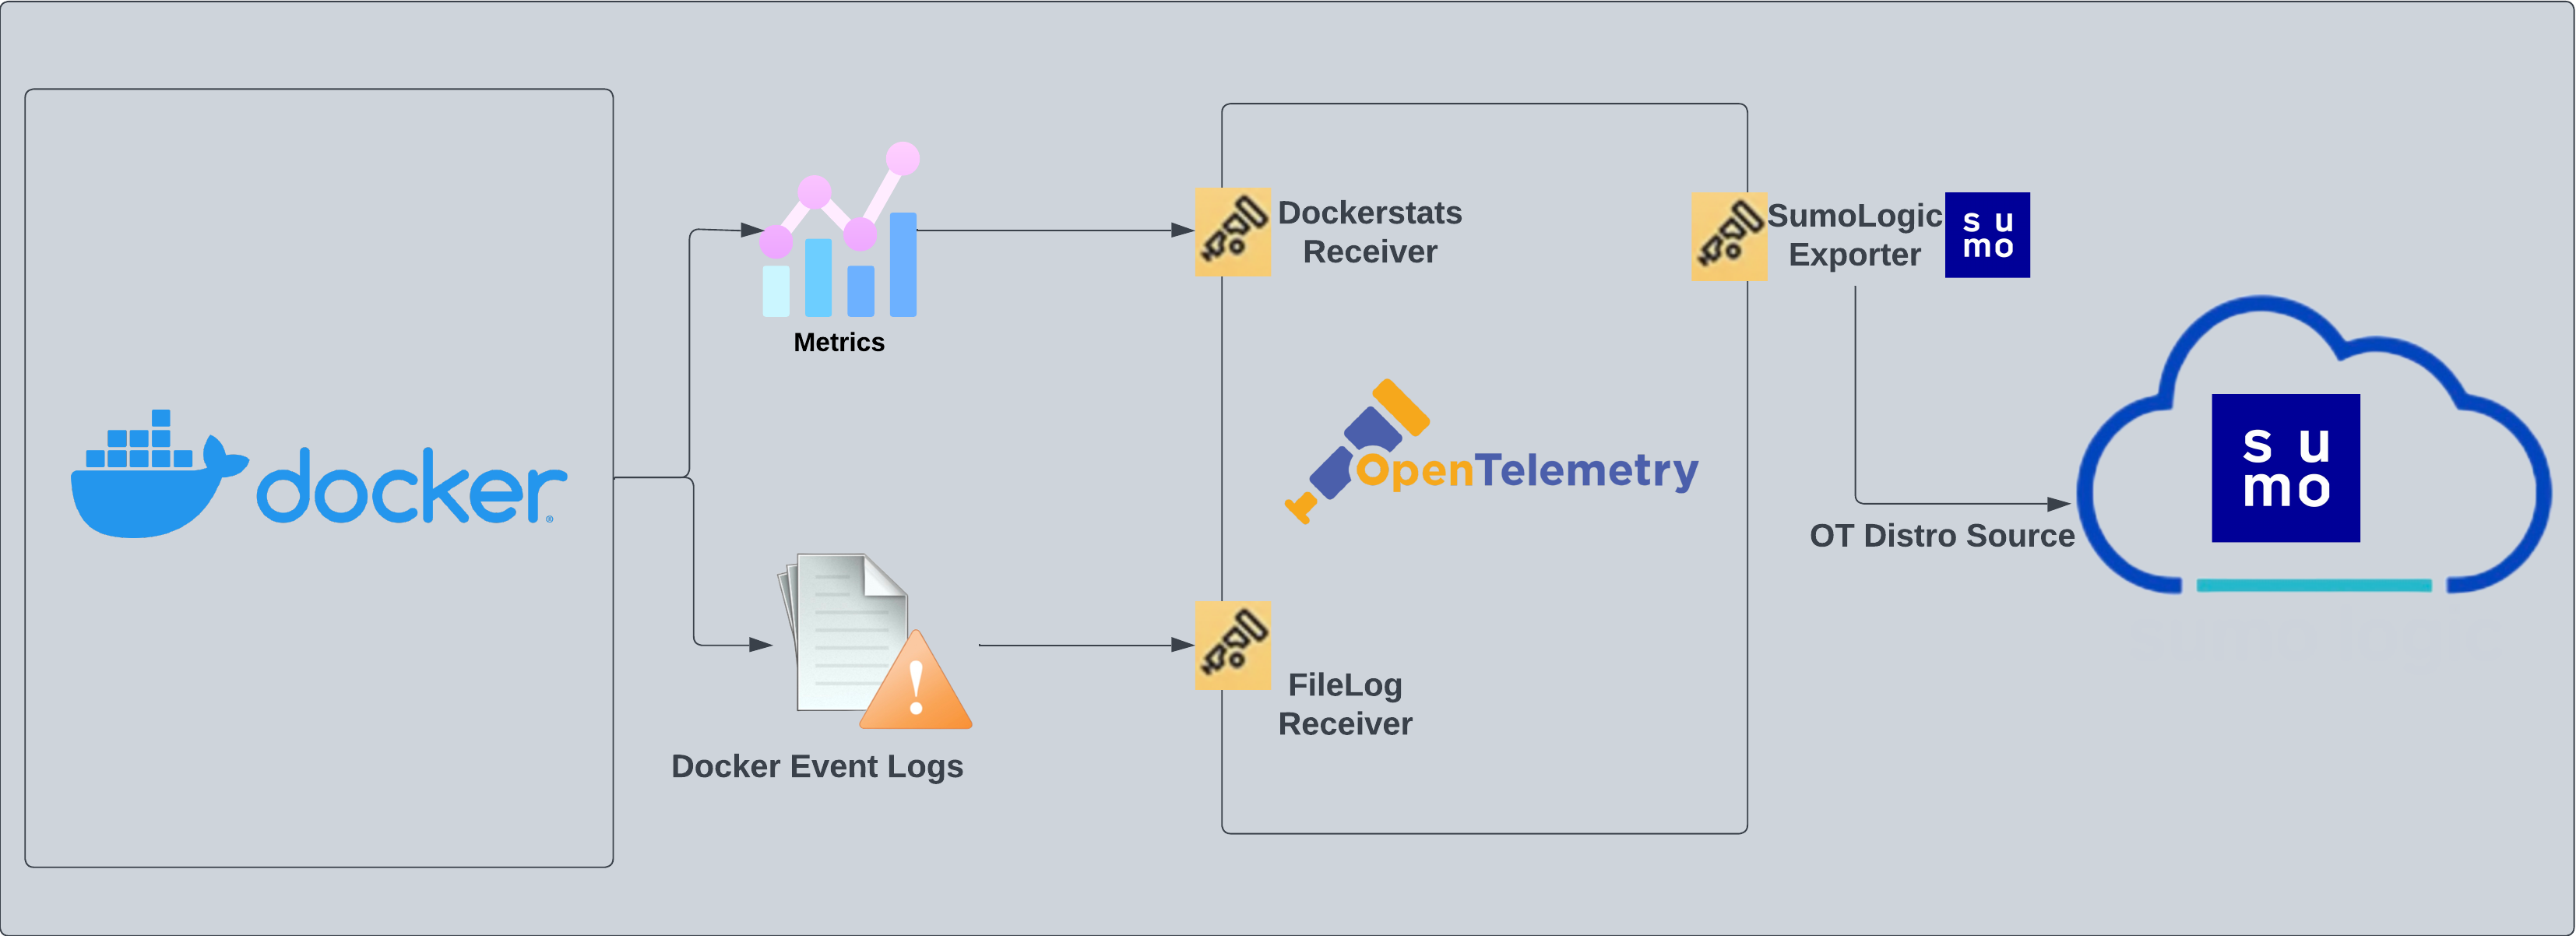
The Sumo Logic OpenTelemetry collector will run on the same host as Docker and collects Docker metric and container event logs.
- Docker metrics are collected using the Dockerstats receiver and sent to Sumo Logic through the Sumo Logic OpenTelemetry Exporter.
- Docker container event logs are sent to Sumo Logic through OpenTelemetry filelog receiver.
The Sumo Logic app for Docker supports Docker version 23.0.2.
This app includes built-in monitors. For details on creating custom monitors, refer to Create monitors for Docker app.
Fields creation in Sumo Logic for Docker
Following are the tags which will be created as part of the Docker app installation, if not already present.
sumo.datasource. Has a fixed value of docker.
Prerequisites
This section provides instructions for configuring metrics and log collection for the Sumo Logic app for Docker.
Metric collection
Metrics are collected through the Docker Stats Receiver of OpenTelemetry. This requires Docker API version 1.22+ and only Linux is supported.
Log collection
To collect the Docker container event logs, the following command needs to be executed on the host machine and needs to be kept running, for monitoring all the Docker container-related events. The following command also needs a JSON file path where these container events can be dumped.
docker events -f 'type=container' --format '{{json .}}' > <PATH_TO_JSON> & disown
Path to this JSON file will be required in the next step, where events are sent to Sumo Logic through a filelog receiver and seen as part of the Docker - Overview dashboard. Also, you can add additional parameters to this command to send events for specific containers. Learn more.
Collection configuration and app installation
Follow these steps to set up and deploy the source template to collect data in Sumo Logic from a remotely managed OpenTelemetry collector.
Step 1: Set up remotely managed OpenTelemetry collector
If you want to configure your source locally, you can do so by downloading the YAML file. For details, see Configure OpenTelemetry collectors locally.
In this step, we'll install remotely managed OpenTelemetry collector and add a uniquely identifiable tag to these collectors.
- Classic UI. In the main Sumo Logic menu, Select App Catalog.
New UI. In the Sumo Logic main menu select App Catalog. - In the 🔎 Search Apps field, run a search for your desired OpenTelemetry app, then select it. For example, Apache - OpenTelemetry.
- Click the Manage dropdown and then select Add Collection.
- On the Set Up Collector page, select Add a New Collector and then click Next.
If you want to use an existing OpenTelemetry Collector, you can skip this step by selecting the Use an existing Collector option.
- Select the platform where you want to install the Sumo Logic OpenTelemetry Collector. For example, Linux.
This will generate a command that you can execute in the machine environment you need to monitor. Once executed, it will install the Sumo Logic OpenTelemetry Collector.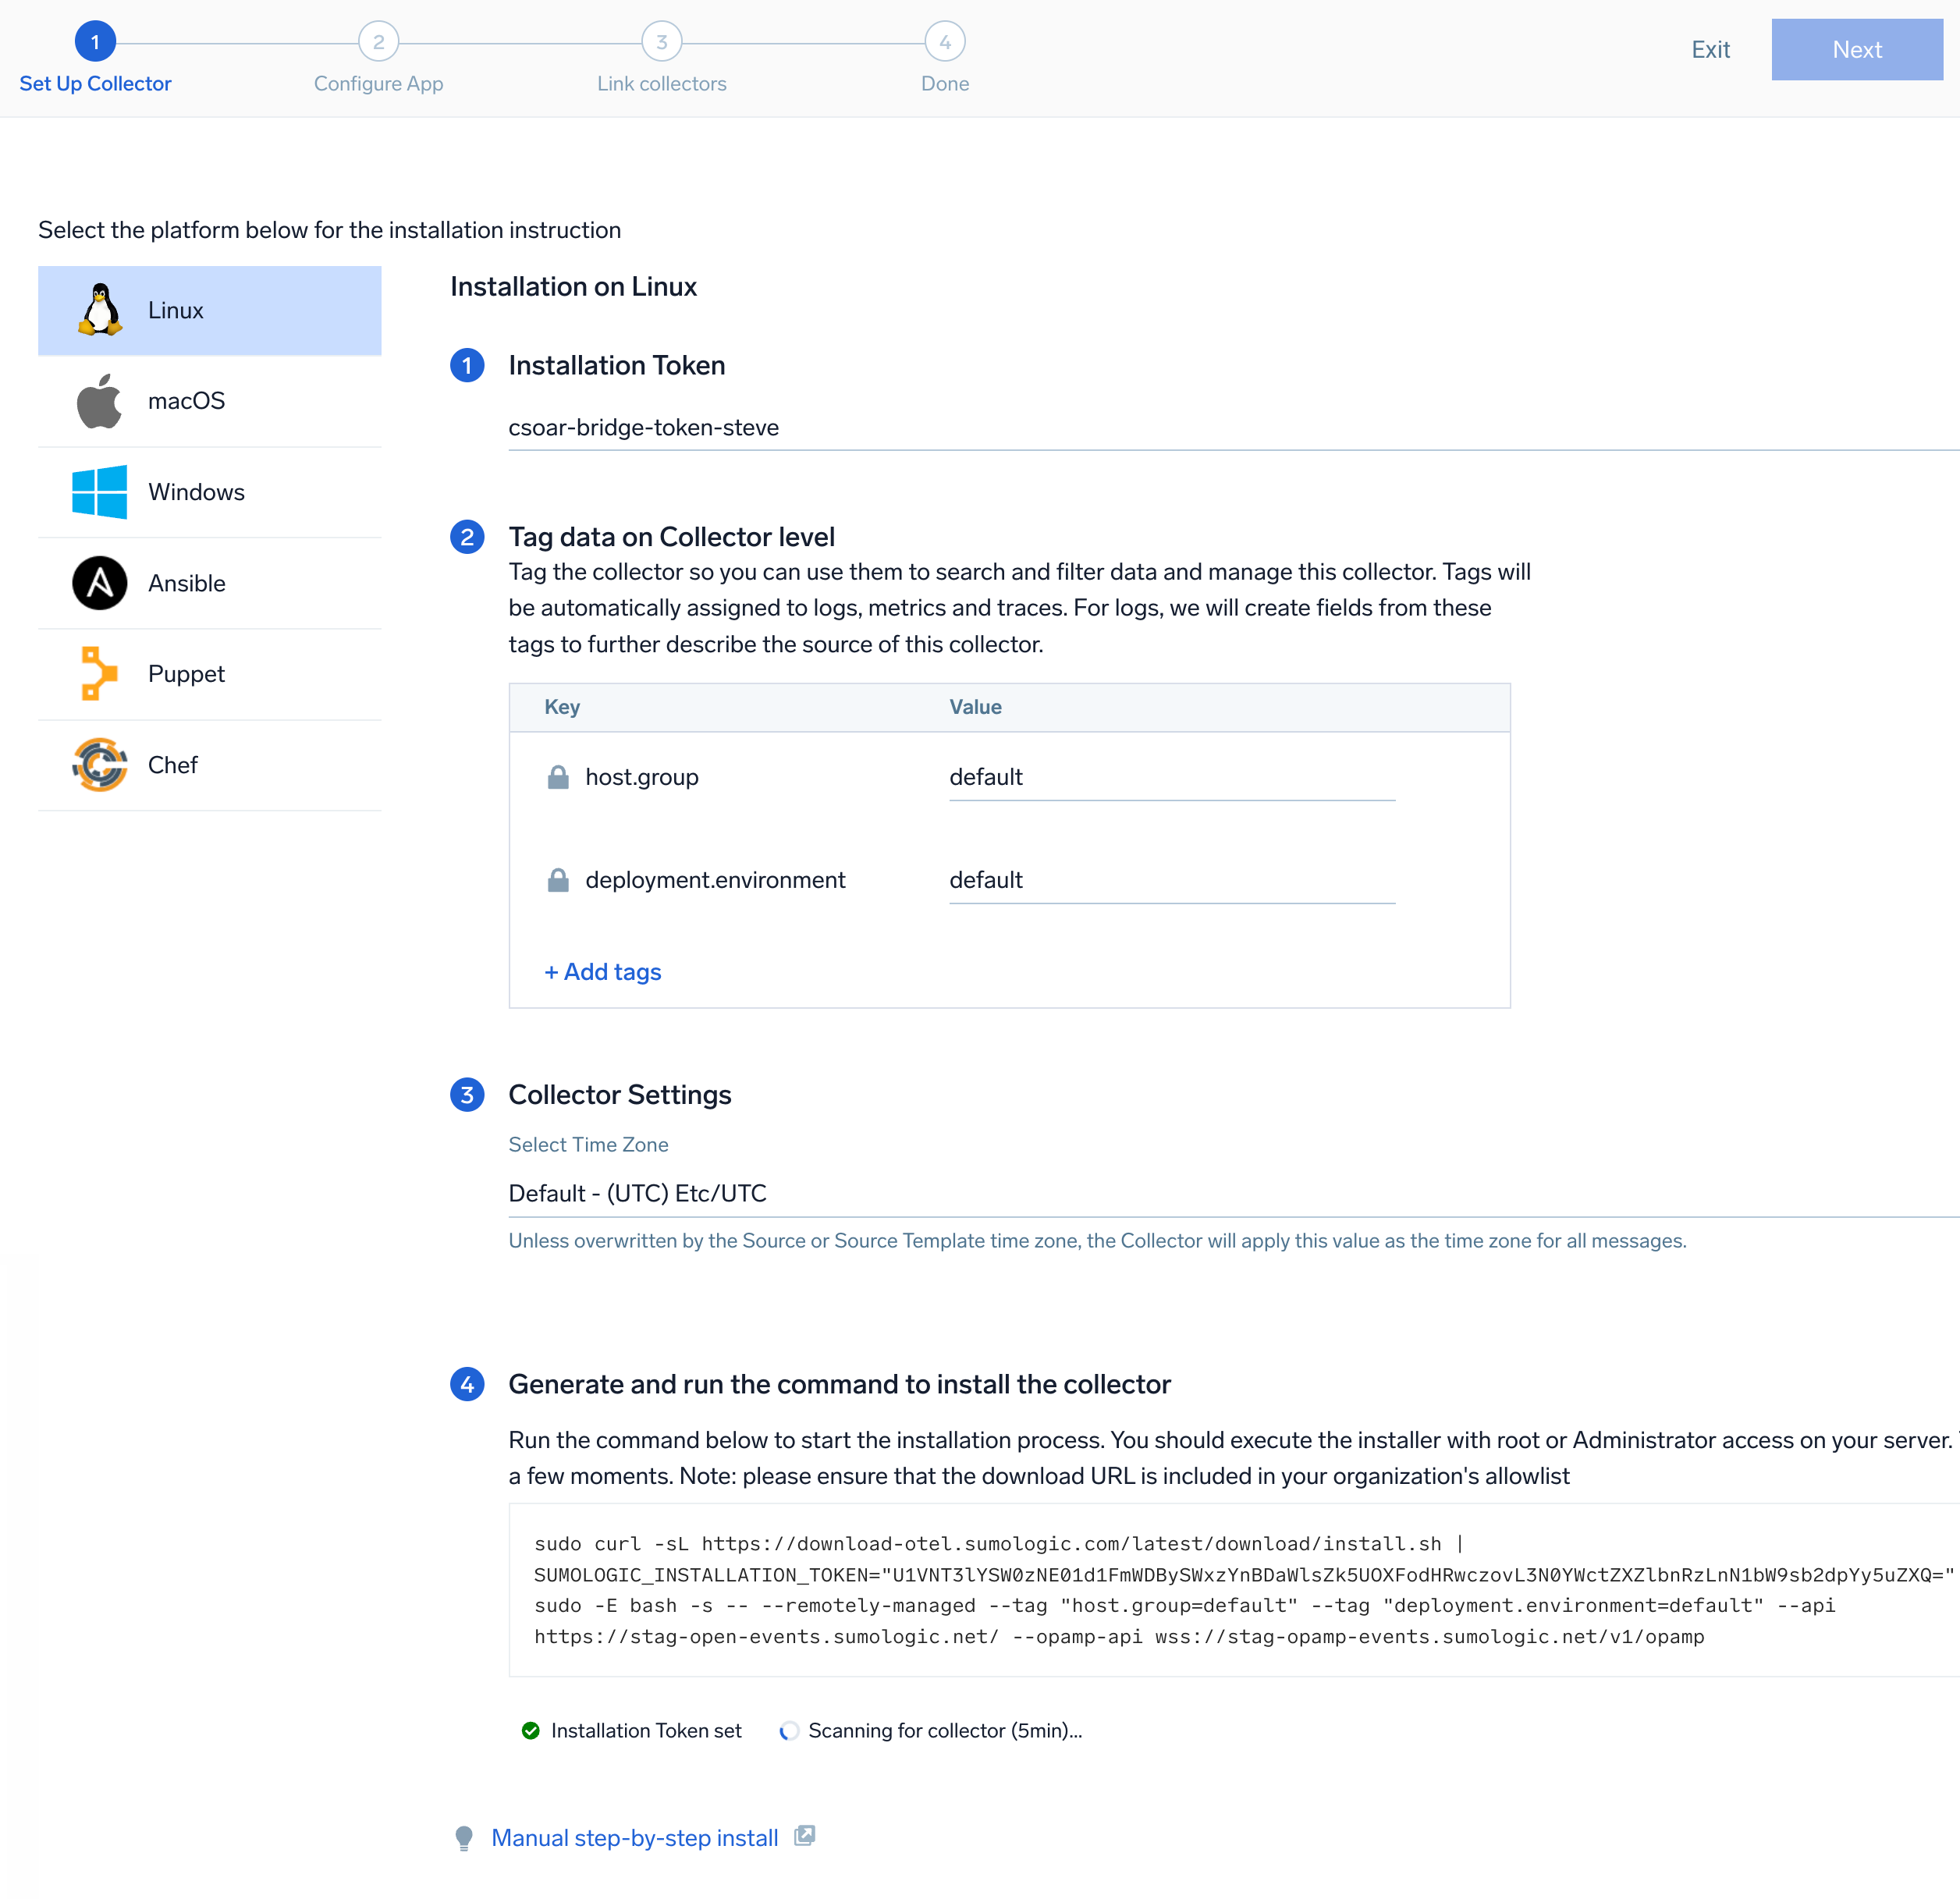 The installation commands now include a
 --remotely-managedflag. When this flag is used, a remotely managed collector is installed automatically instead of a locally managed one. If you prefer to use a locally managed collector, simply remove the flag from the installation command.
Step 2: Configure the source template
In this step, you will configure the YAML required for Docker Collection. Below are the inputs required for configuration:
- Name. Name of the source template.
- Description. Description for the source template.
- Docker Event log location. Enter the path of the JSON file generated through the command in the prerequisite section.
- Endpoint. Address to reach the desired Docker daemon (default:
unix:///var/run/docker.sock). - Excluded Image List. A list of strings, regexes, or globs whose referent container image names will not be among the queried containers for scrapping metrics. Learn more about excluded_images.
- Fields/Metadata. You can provide any customer fields to be tagged with the data collected. By default, Sumo Logic tags
_sourceCategorywith the value otel/docker.
Timestamp Parsing. You can configure timestamp parsing for logs ingested using this source template. For more information, see Timestamps, Time Zones, Time Ranges, and Date Formats for the OpenTelemetry Collector.
Processing Rules. You can add processing rules for logs/metrics collected. To learn more, refer to Processing Rules.
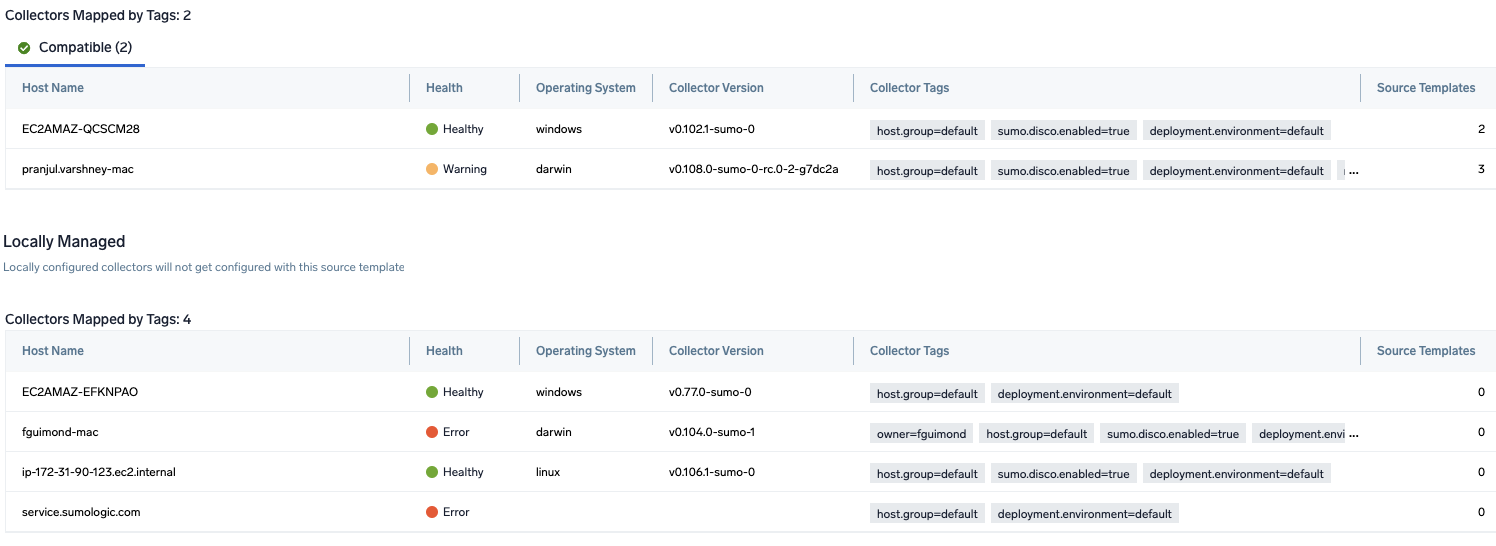
Step 3: Push the source template to the desired remotely managed collectors
A new source template will always be created with the latest version of the source template.
Follow the below steps to create a data collection configuration to gather the required logs and link them to all the collectors with the help of collector tags.
- Complete the source template form with the name and file path for your logs (for example, error logs or access logs), then click Next.
- Under Link Collectors, you will have the option to link the collectors using the collector name or by adding tags to find the group of collectors (for example,
application = Apache).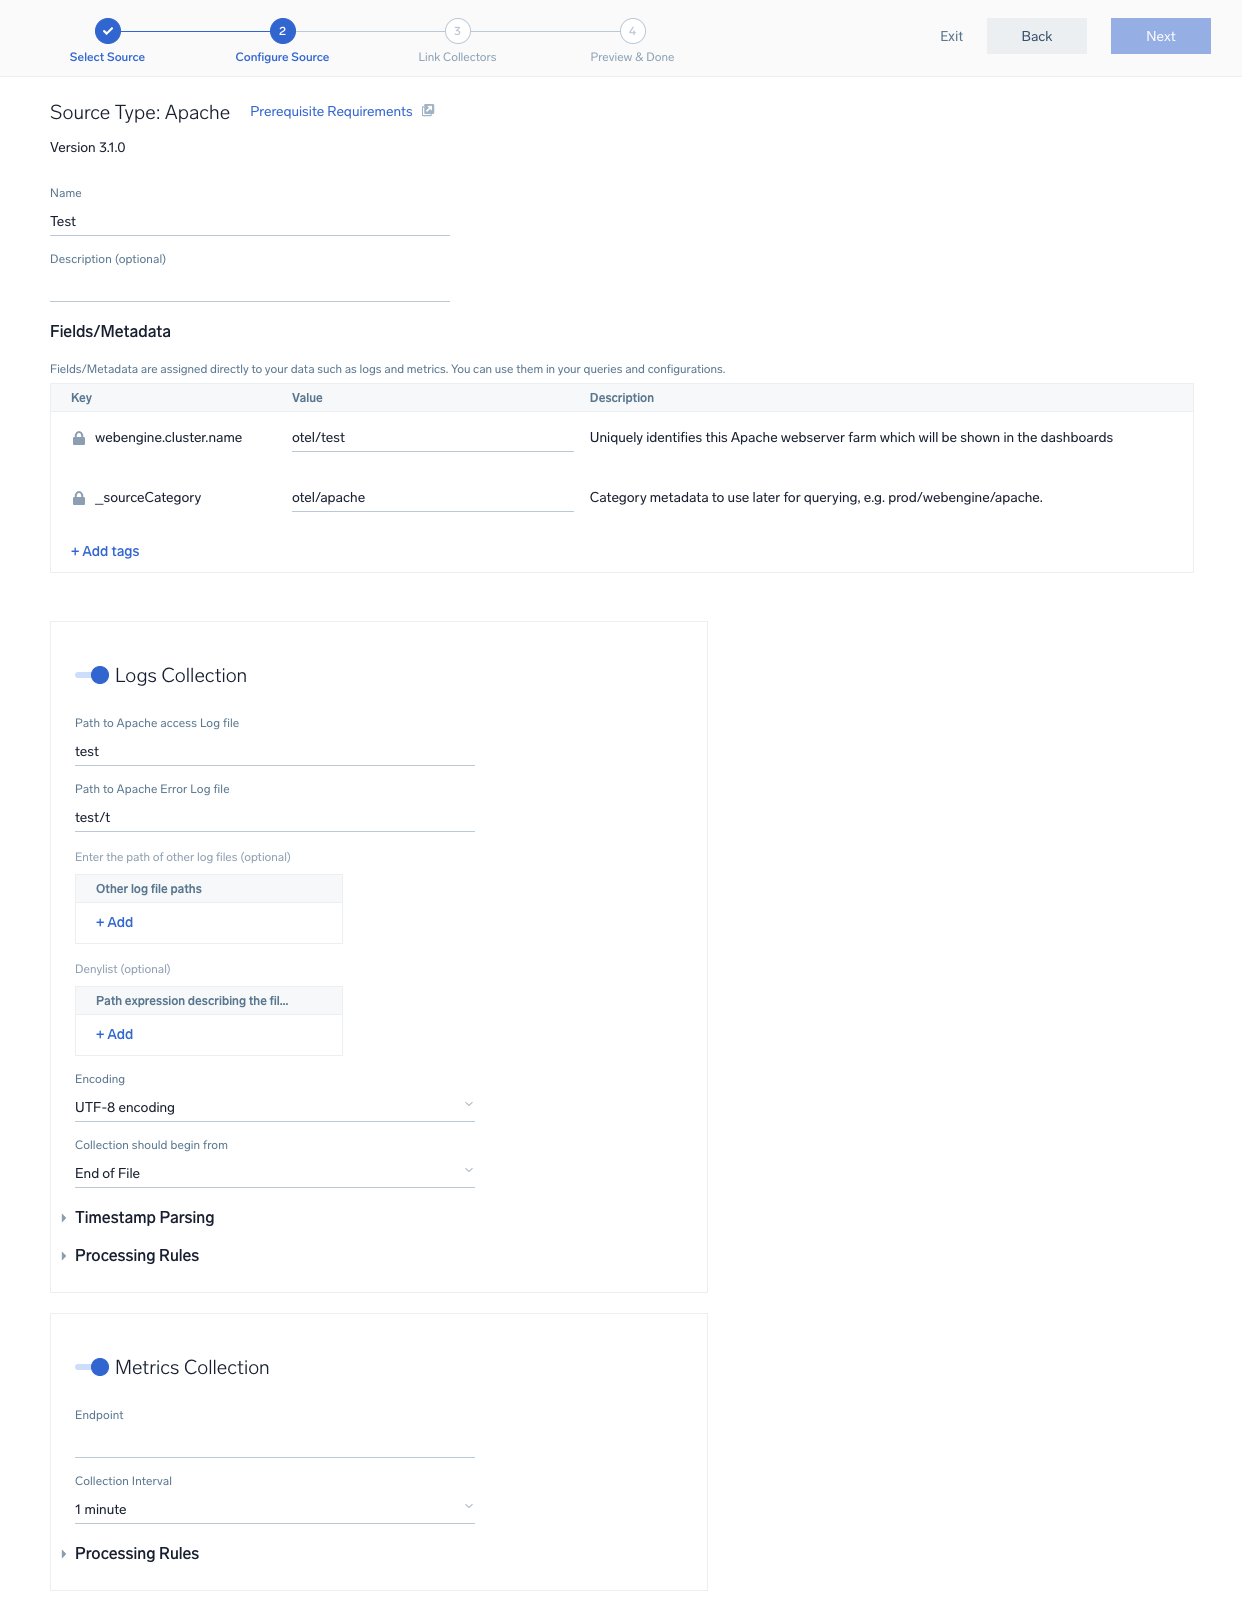
- Preview and confirm the collectors that will be linked (fetched automatically) to the newly created source template.
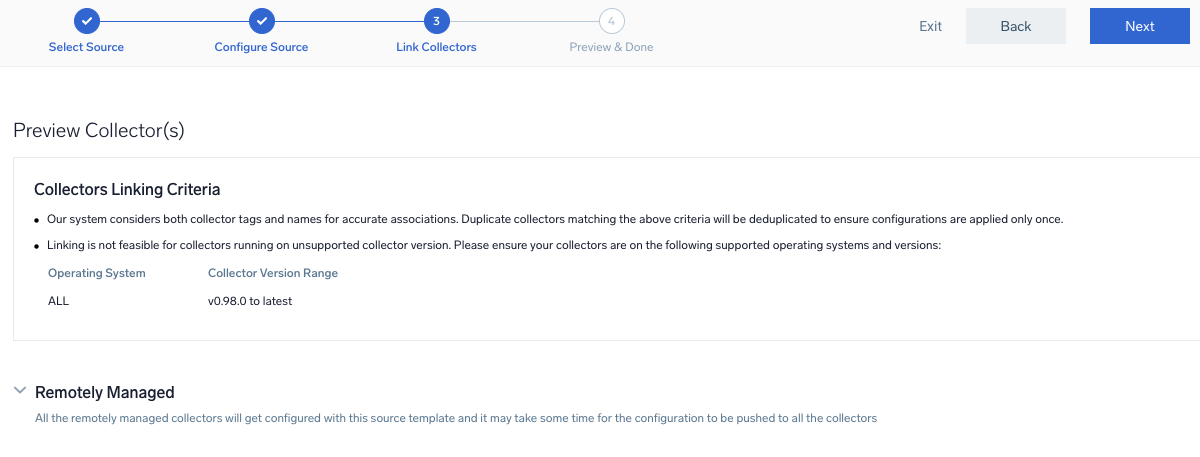
- Click Next to complete the source template creation. In the background, the system will apply the configuration to all the linked collectors and will start collecting the respective telemetry data from the remote host (in the example, it would start collecting Apache error logs).
- Click the Log Search or Metrics Search icons to search for and analyze your data collected for this source template.
Sample log message
{
  "status":"start",
  "id":"51f87a02dbcebbfe85bd3f9edb092132b6ac8ee873d541cdc059c70e17e52835",
  "from":"hello-world",
  "Type":"container",
  "Action":"start",
  "Actor":
  {
    "ID":"51f87a02dbcebbfe85bd3f9edb092132b6ac8ee873d541cdc059c70e17e52835",
    "Attributes":
    {
      "image":"hello-world",
      "name":"agitated_ardinghelli"
    }
  },
  "scope":"local",
  "time":"1683892564",
  "timeNano":"timestamp_2"
}
Sample metrics
{
  "queryId":"A",
  "_source":"docker-otel",
  "_metricId":"ijgj8tTQV9UGOJWs2k_aew",
  "container.hostname":"6ebcc74fe914",
  "_sourceName":"Http Input",
  "host.id":"ea5f7c340247429887f632c6b6fa6c53",
  "os.type":"linux",
  "sumo.datasource":"docker",
  "container.runtime":"docker",
  "container.name":"docker-apache",
  "_sourceCategory":"Labs/docker-otel",
  "deployment.environment":"dockerEnvtest1",
  "_contentType":"Carbon2",
  "host.name":"ip-172-31-20-114.ec2.internal",
  "metric":"container.cpu.percent",
  "_collectorId":"000000000D7C5F4F",
  "container.image.name":"httpd",
  "_sourceId":"0000000048C9E05B",
  "unit":"1",
  "container.id":"6ebcc74fe914fbe88fcf93c289921d675fd7d57e4c835fc0e72ef067583500ea",
  "_collector":"Labs - docker-otel",
  "max":30,
  "min":10,
  "avg":20.36,
  "sum":570.1,
  "latest":20,
  "count":28
}
Sample queries
Log query
This sample log query is from the Docker Events Over Time panel in the Docker - Overview dashboard.
sumo.datasource=docker
| json field= "status" as state
| json field= "Type" as type
| json field= "Actor.Attributes.image" as image
| json field= "Actor.Attributes.name" as name
| timeslice 1h
| where image matches "{{container.image.name}}" AND state matches "{{state}}" AND name matches "{{container.name}}"
|count by _timeslice, state
| transpose row _timeslice column state
| fillmissing timeslice(1h)
Metrics query
This sample metrics query is from the Top 5 Containers by CPU Usage panel in the Docker - Overview dashboard.
sumo.datasource=docker container.image.name={{container.image.name}} container.name={{container.name}}  metric=container.cpu.usage.total
| avg by container.name
| topk(5,avg)
Viewing Docker dashboards
All dashboards have a set of filters that you can apply to the entire dashboard. Use these filters to drill down and examine the data to a granular level.
- You can change the time range for a dashboard or panel by selecting a predefined interval from a drop-down list, choosing a recently used time range, or specifying custom dates and times. Learn more.
- You can use template variables to drill down and examine the data on a granular level. For more information, see Filtering Dashboards with Template Variables.
Overview
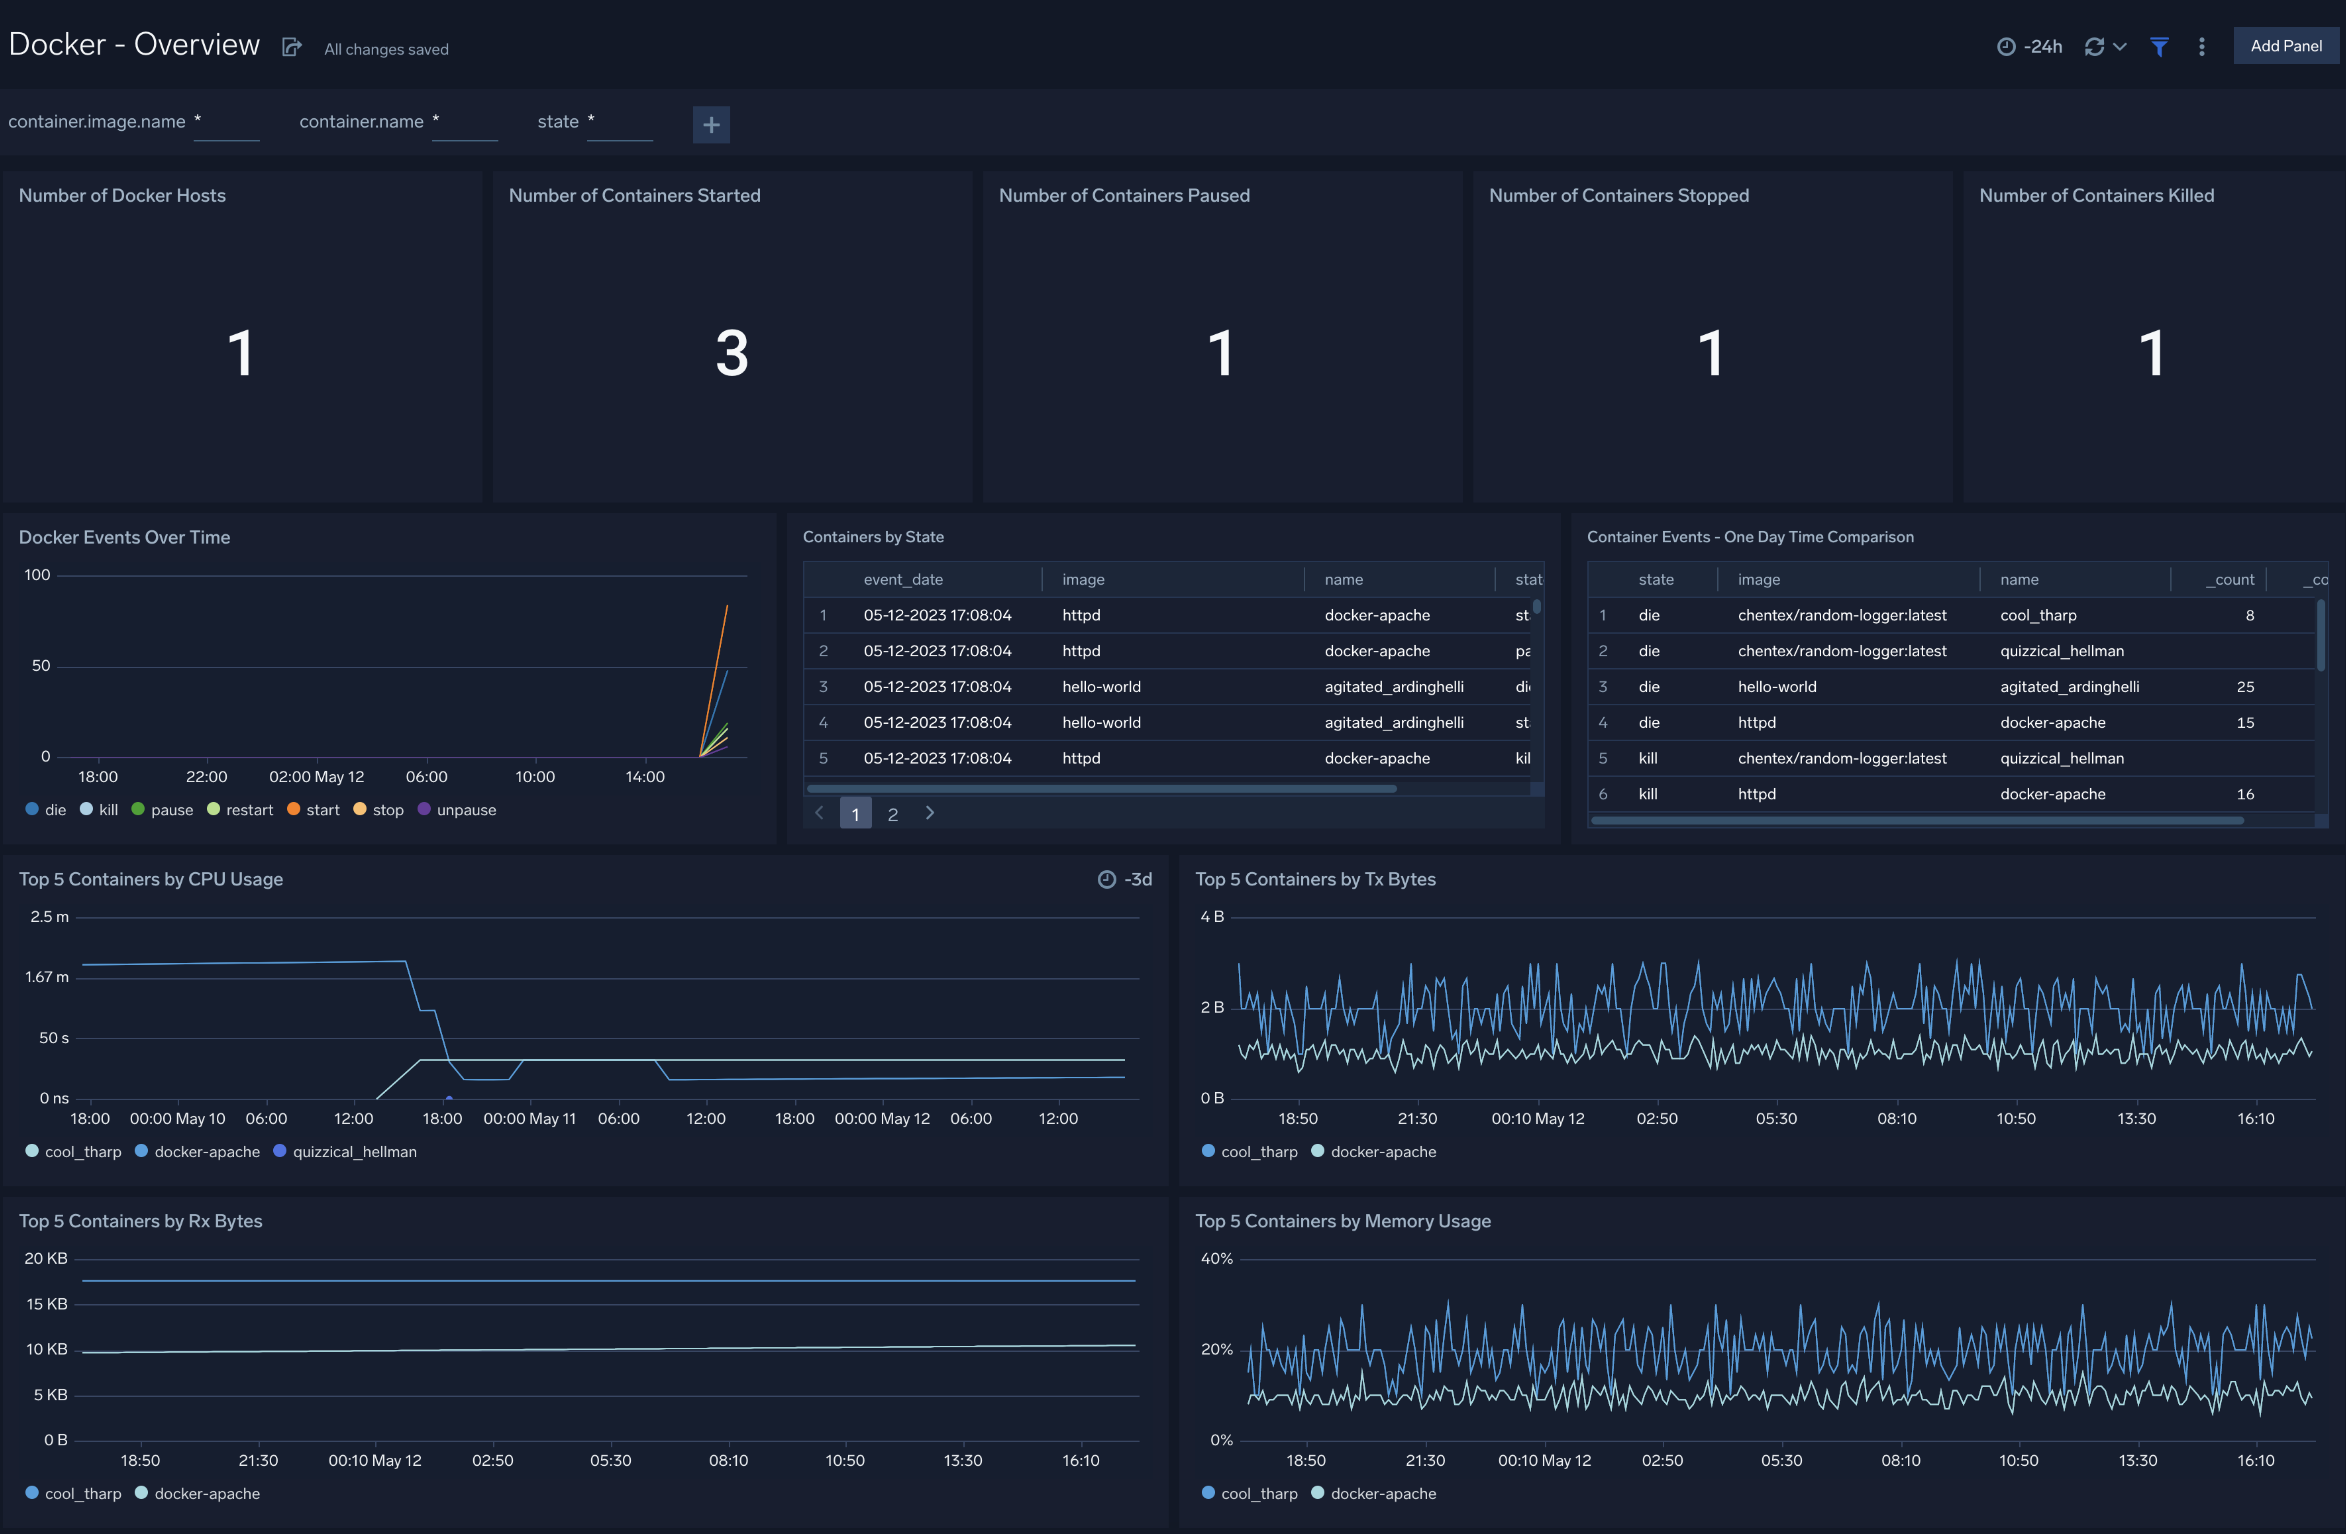
- Number of Docker Hosts. The total number of Docker hosts monitored.
- Number of Containers Started. The total number of containers started.
- Number of Containers Paused. The total number of containers paused.
- Number of Containers Stopped. The total number of containers stopped.
- Number of Containers Killed. The total number of containers killed.
- Docker Events Over Time. Count of specific Docker container events (such as pause, stop, die, restart, start, kill, unpause) per time slice.
- Containers by State. A table that lists container events that occurred, time the event occurred, the container image, the container name, and the event type.
- Container Events - One Day Time Comparison. A table that lists the count of a particular event (such as pause, stop, die, restart, start, kill, unpause) for an image/container combination over the last 24 hours and compares it with the previous 24 hours time range.
- Top 5 Containers by CPU Usage. CPU usage by the five containers that have used the most CPU.
- Top 5 Containers by Tx Bytes. Bytes transmitted by the top five containers that have transmitted the most bytes.
- Top 5 Containers by Rx Bytes. Bytes received by the five containers that have received the most bytes.
- Top 5 Containers by Memory Usage. Memory usage by the top five containers that used the most memory.
CPU Usage
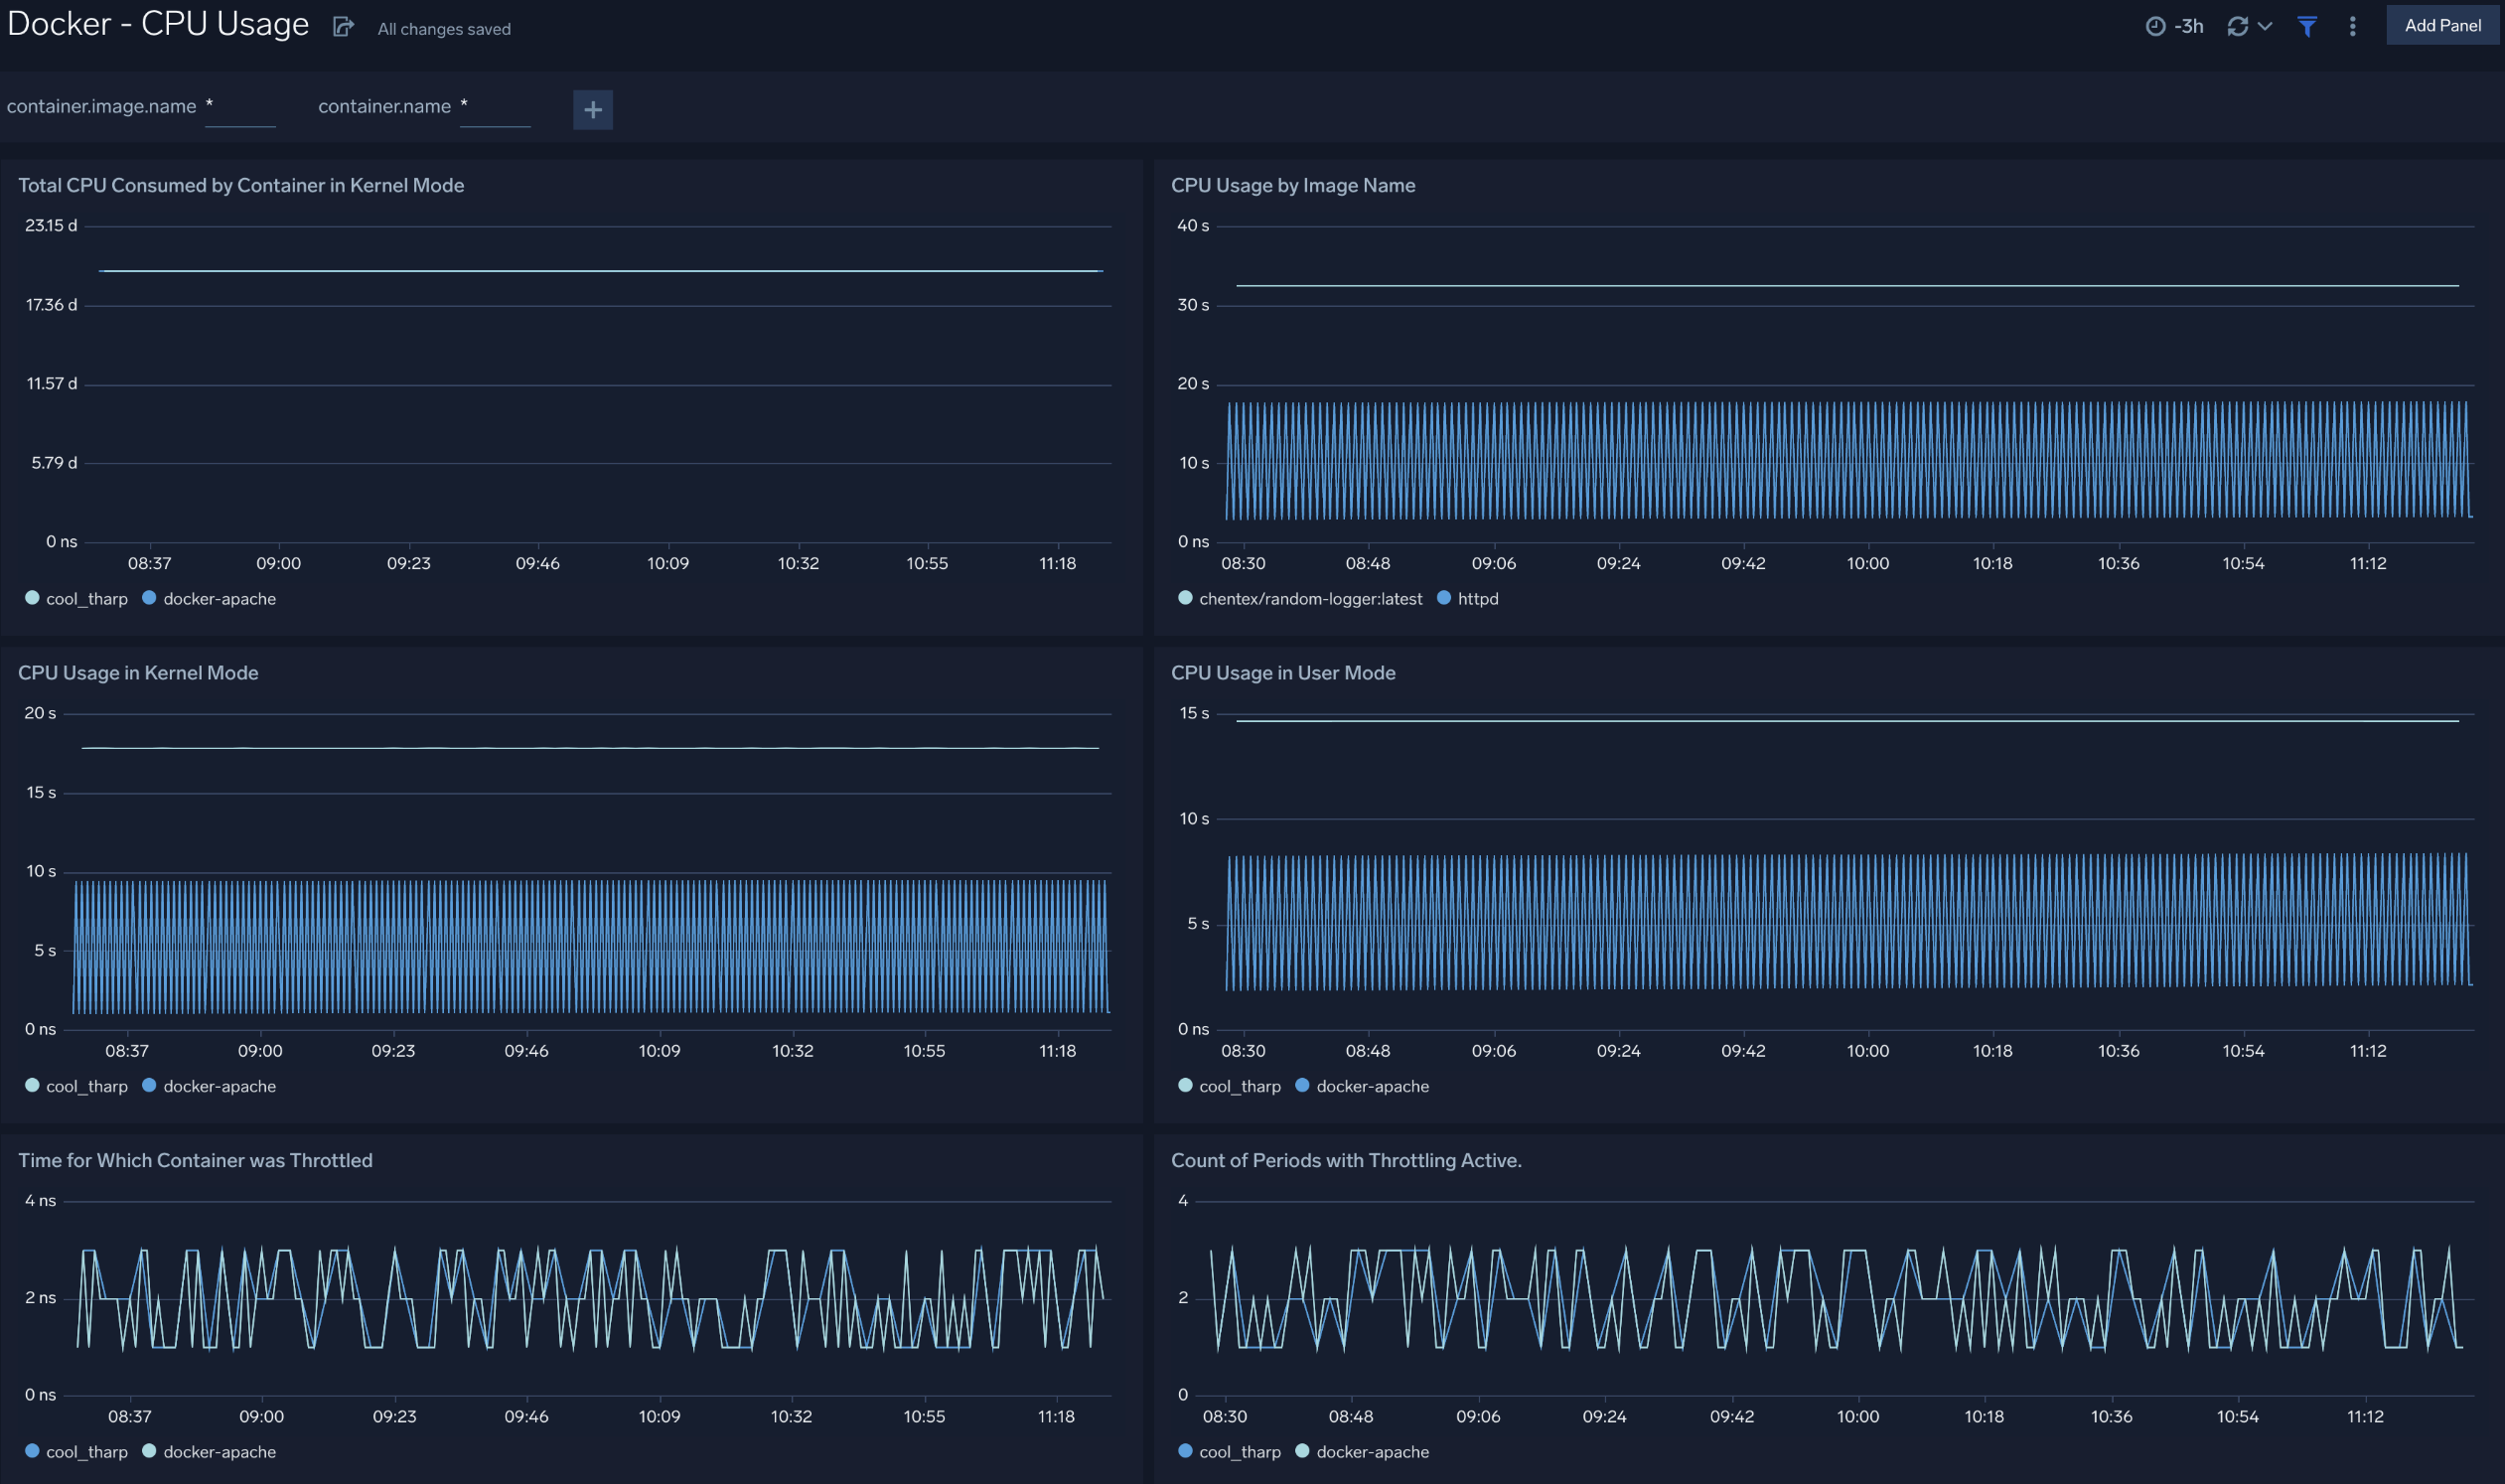
- Total CPU Consumed by Container in Kernel Mode. Total CPU consumed in kernel mode by each container.
- CPU Usage by Image Name. CPU consumed by container image name per timeslice.
- CPU Usage in Kernel Mode. CPU consumed in kernel mode by each container per timeslice.
- CPU Usage in User Mode. CPU consumed in user mode by each container per timeslice.
- Time for Which Container was Throttled. Duration for which each container's CPU was throttleds.
- Count of Periods with Throttling Active. A chart that shows how many times each container's CPU was throttled.
Memory Usage
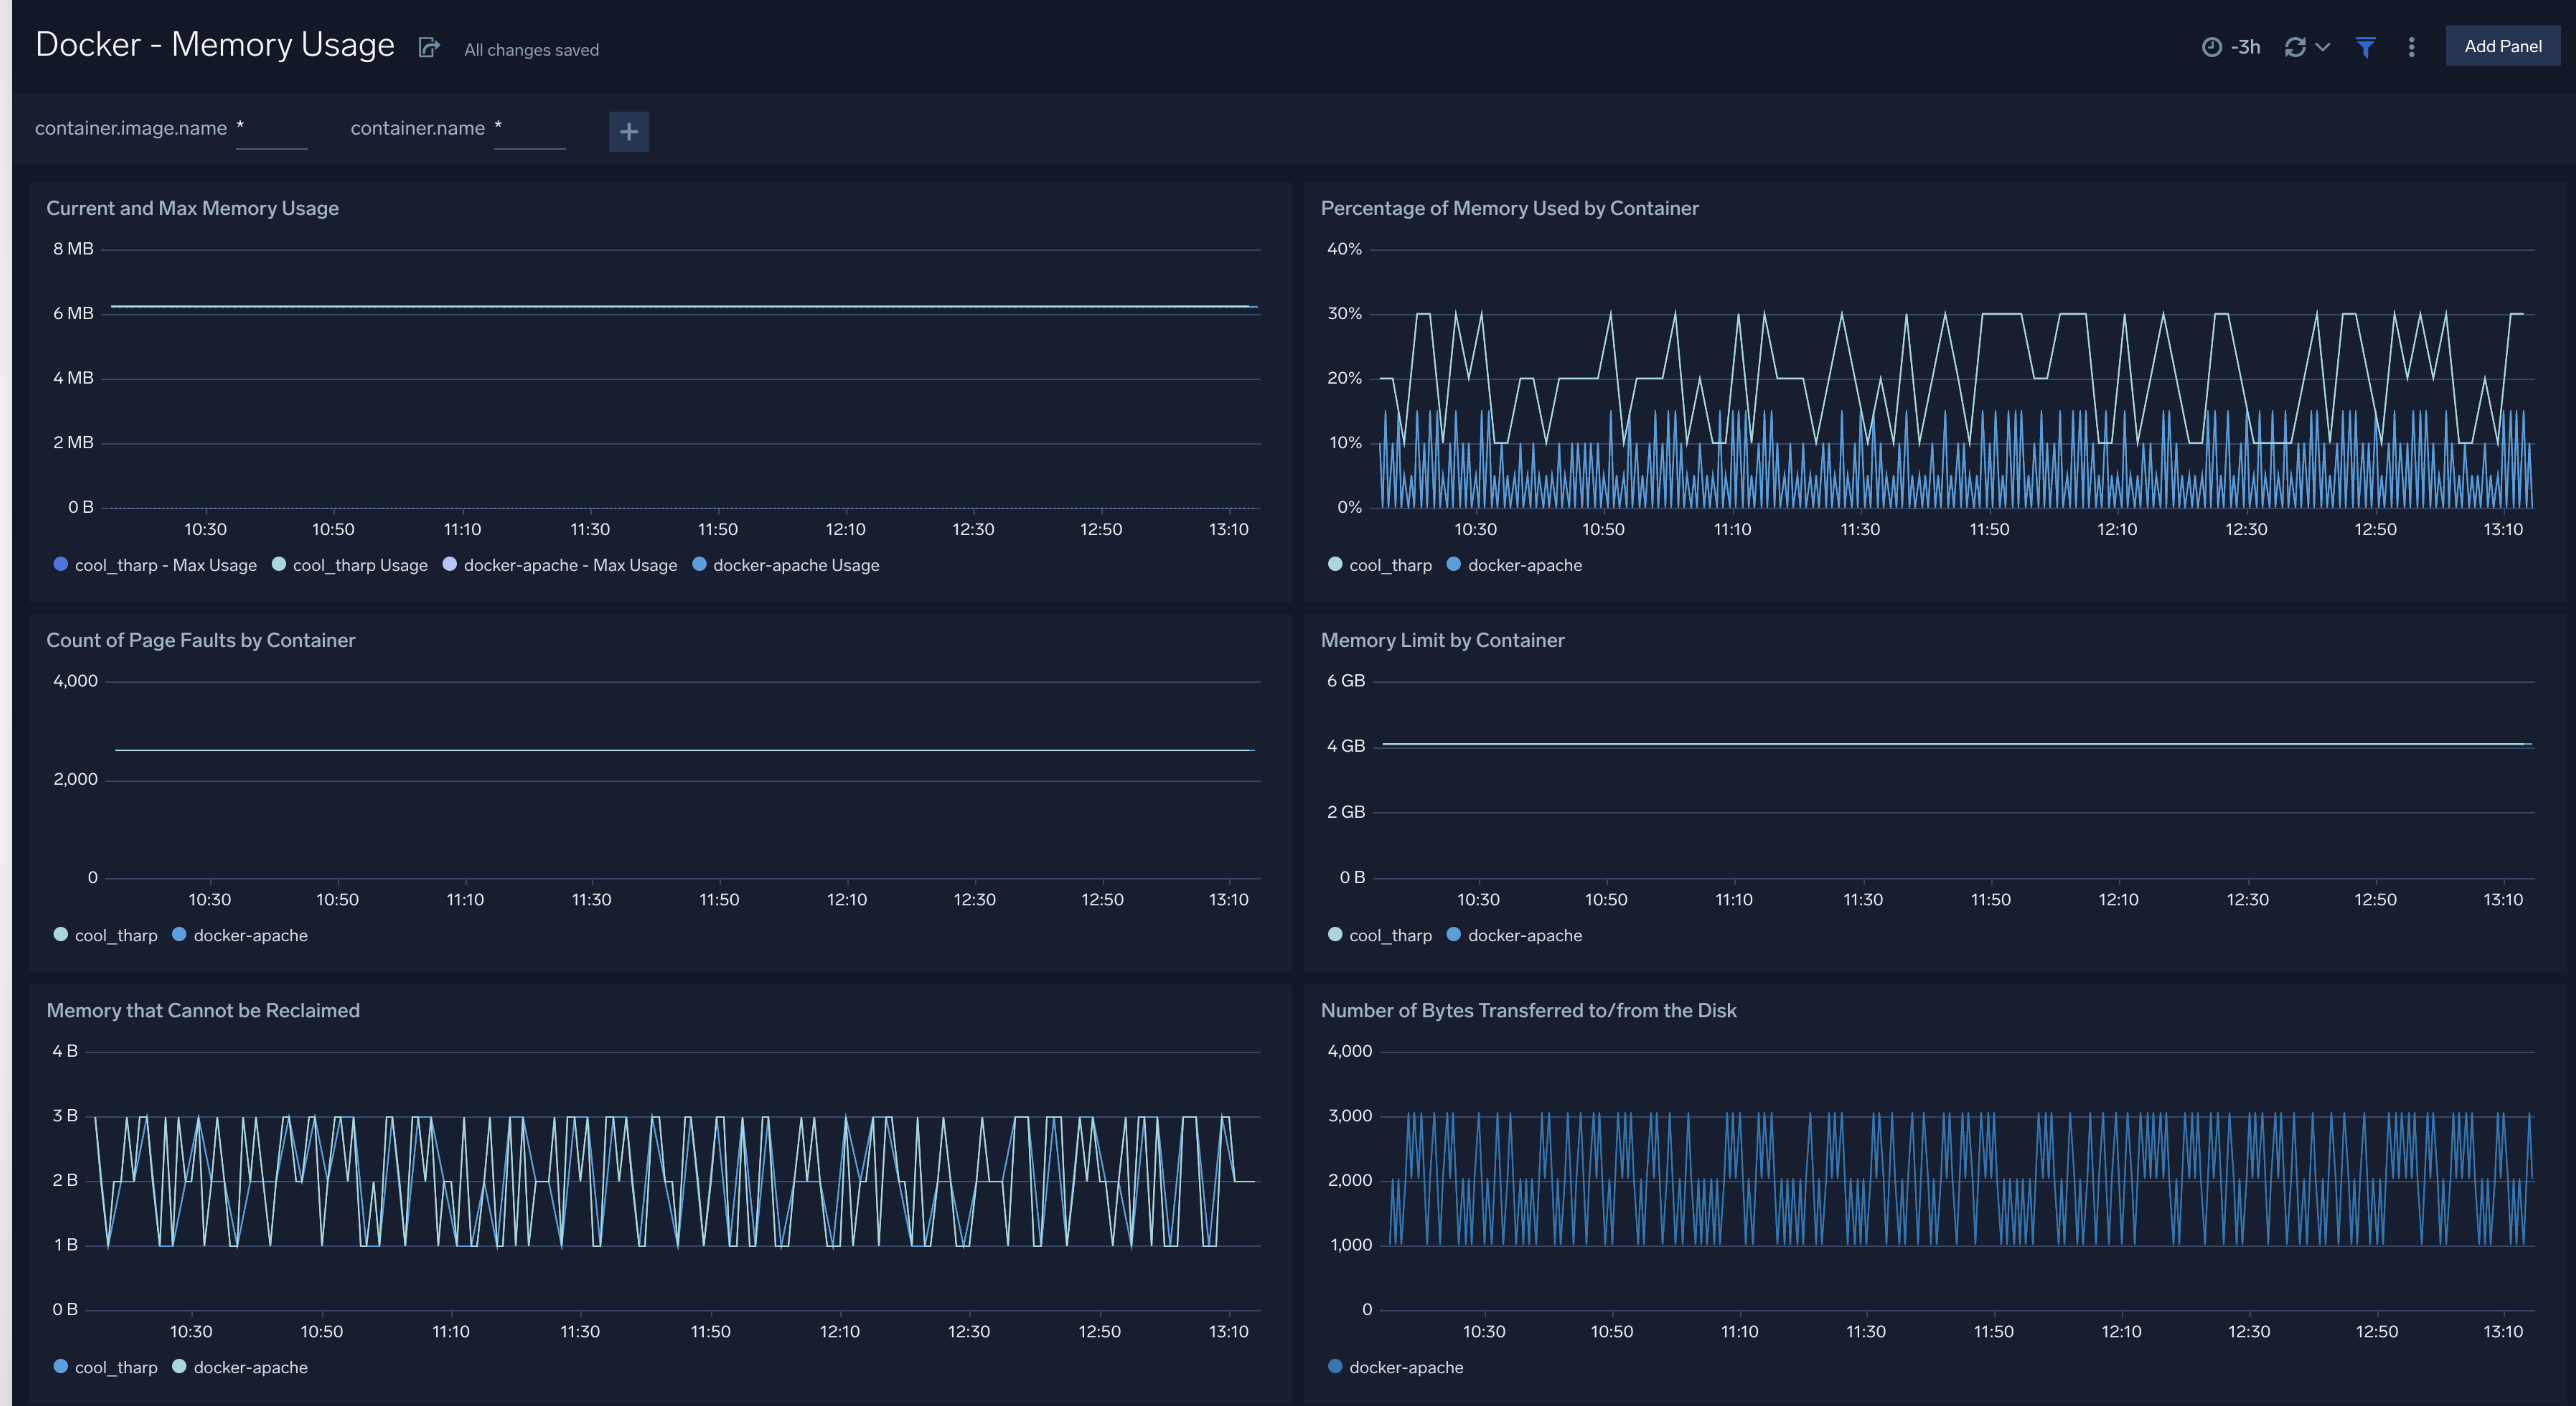
- Number of Times Container Hit Memory Limit. Number of times that each container reached its memory limit.
- Memory Limit by Container. Memory limit for each container.
- Percentage of Memory Used by Container. Percentage of memory used by each container.
- Current and Max Memory Usage. Current and maximum memory used by each container.
- Count of Page Faults by Container. Number of page faults for each container.
- Memory that Cannot be Reclaimed. Amount of memory that cannot be reclaimed for each container.
- Number of Bytes Transferred to/from the Disk. Number of bytes transferred to and from disk by each container
Network Usage
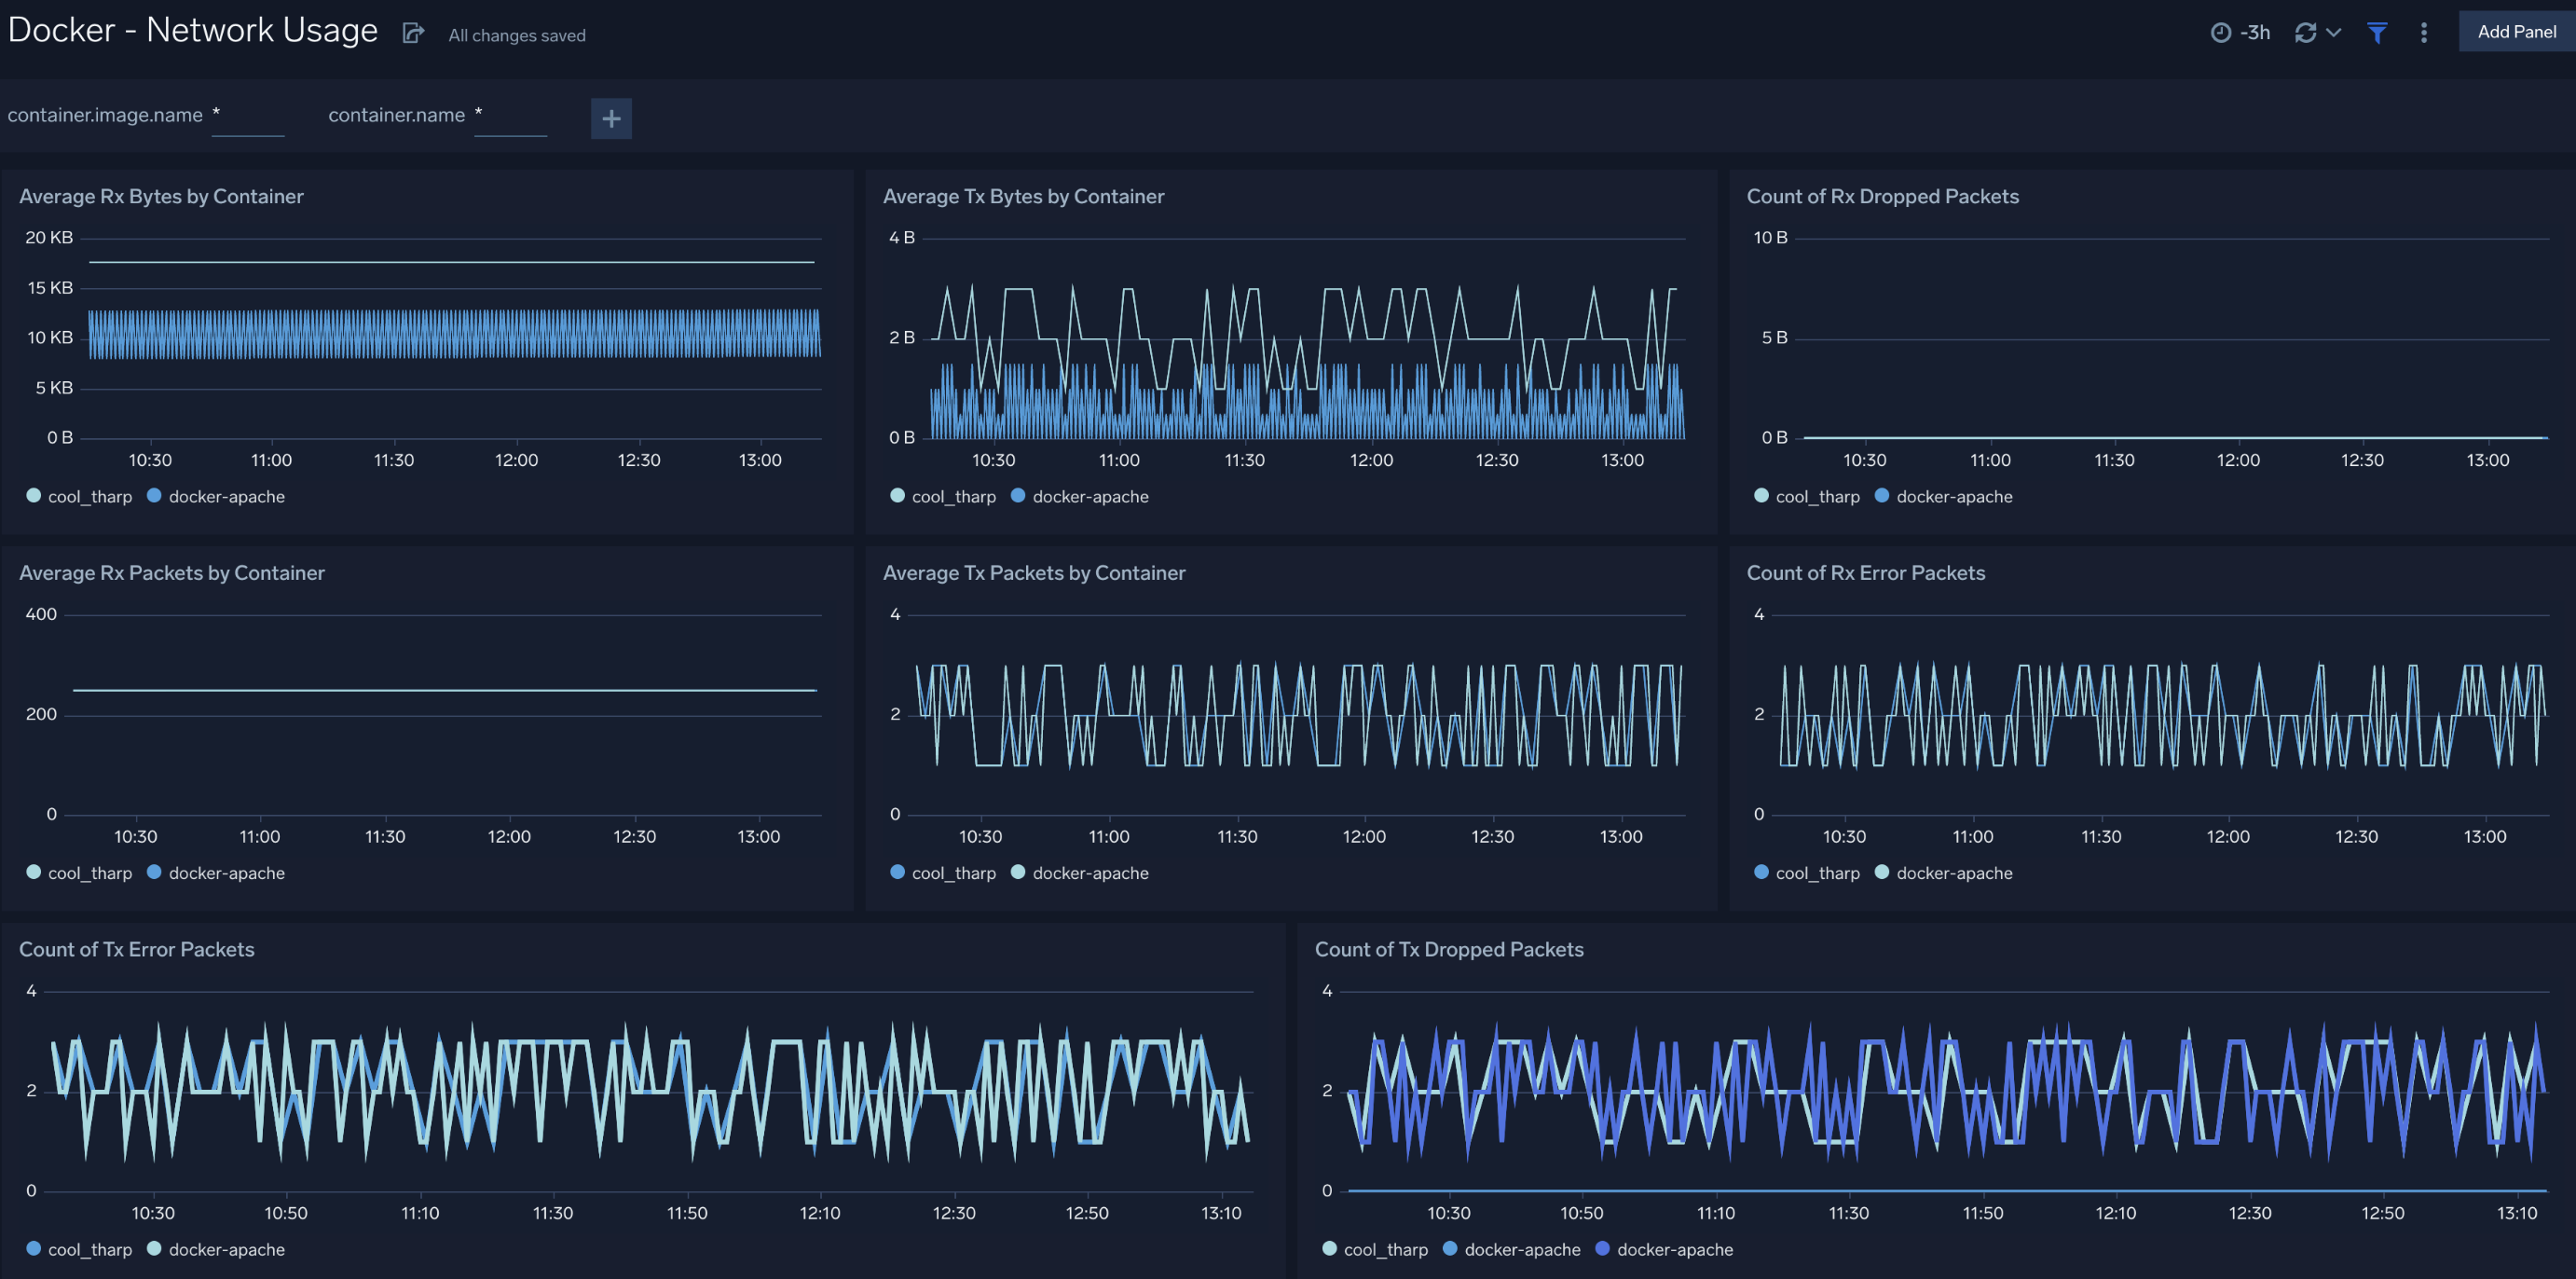
- Average Rx Bytes by Container. Displays the average number of bytes received per timeslice by each container.
- Average Tx Bytes by Container. Displays the average number of bytes transmitted per timeslice by each container.
- Count of Rx Dropped Packets. Count of received packets dropped by each container per timeslice.
- Count of Rx Error Packets. Count of error packets received per timeslice by each container.
- Average Rx Packets by Container. Average packets received per timeslice by each container.
- Average Tx Packets by Container. Average packets transmitted per timeslice by each container.
- Count of Tx Dropped Packets. Count of packets dropped during transmission per timeslice by each container.
- Count of Tx Error Packets. Count of error packets transmitted per timeslice by each container.
Create monitors for Docker app
From your App Catalog:
- From the Sumo Logic navigation, select App Catalog.
- In the Search Apps field, search for and then select your app.
- Make sure the app is installed.
- Navigate to What's Included tab and scroll down to the Monitors section.
- Click Create next to the pre-configured monitors. In the create monitors window, adjust the trigger conditions and notifications settings based on your requirements.
- Scroll down to Monitor Details.
- Under Location click on New Folder.
note
By default, monitor will be saved in the root folder. So to make the maintenance easier, create a new folder in the location of your choice.
- Enter Folder Name. Folder Description is optional.
tip
Using app version in the folder name will be helpful to determine the versioning for future updates.
- Click Create. Once the folder is created, click on Save.
Docker alerts
| Alert Name | Alert Description and conditions | Alert Condition | Recover Condition |
|---|---|---|---|
Docker - High CPU Consumption by Container Alert | This alert gets fired when cpu utilization exceeds 90% for any container. | Count > 90 | Count < = 90 |
Docker - High Memory Consumption by Container Alert | This alert gets fired when memory utilization exceeds 90% for any container. | Count > 90 | Count < = 90 |