Kafka - OpenTelemetry Collector

The Sumo Logic app for Kafka is a unified logs and metrics app. The app helps you to monitor the brokers, partition replicas, and consumer groups components of Kafka messaging/streaming clusters. Pre-configured dashboards provide insights into the broker operations, topics, replication, and error logs.
We use the OpenTelemetry collector for Kafka metrics and logs collection.
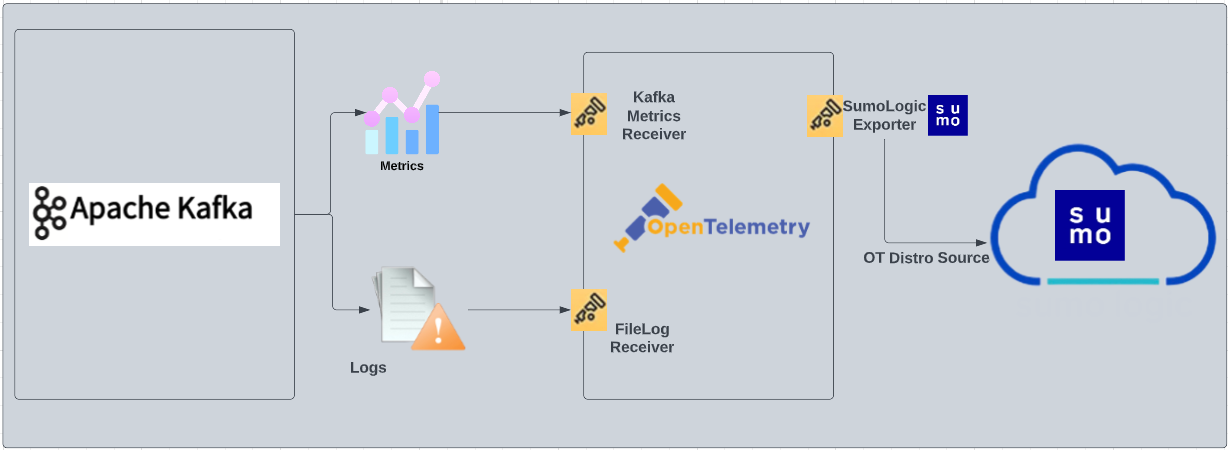
The diagram below illustrates the components of the Kafka collection for each Kafka broker node. OpenTelemetry collector runs on the same host as Kafka, and uses the Kafka Receiver to obtain Kafka metrics, and the Sumo Logic OpenTelemetry Exporter to send the metrics to Sumo Logic. Kafka logs are sent to Sumo Logic through a filelog receiver.
This app has been tested with following Kafka versions:
2.6.02.7.03.1.2
This app includes built-in monitors. For details on creating custom monitors, refer to Create monitors for Kafka app.
Log types and Metrics
The Sumo Logic app for Kafka uses:
- Kafka app supports the default logs format.
- For a list of metrics that are collected and used by the app, refer to the Kafka Metrics.
Fields Creation in Sumo Logic for Kafka
Following are the Fields which will be created as part of Kafka app installation, if not already present.
messaging.cluster.name. User configured. Enter a name to uniquely identify your Kafka cluster. This cluster name will be shown in the Sumo Logic dashboards.messaging.node.name. Has value ofhost name.messaging.system. Has fixed value ofkafka.sumo.datasource. Has fixed value ofkafka.
Prerequisites
For metrics collection
Kafka metrics receiver collects Kafka metrics (brokers, topics, partitions, and consumer groups) from the Kafka server.
For logs collection
Configure logging in Kafka: By default, Kafka logs (server.log and controller.log) are stored in the /opt/Kafka/kafka_<VERSION>/logs directory. Make a note of this logs directory.
Ensure that the otelcol has adequate permissions to access all log file paths. Execute the following command:
sudo setfacl -R -m d:u:otelcol-sumo:r-x,u:otelcol-sumo:r-x,g:otelcol-sumo:r-x <PATH_TO_LOG_FILE>
For Linux systems with ACL Support, the otelcol install process should have created the ACL grants necessary for the otelcol system user to access default log locations. You can verify the active ACL grants using the getfacl command. Install the ACL in your Linux environment, if not installed.
The required ACL may not be supported for some rare cases, for example, Linux OS Distro, which is officially not supported by Sumo Logic. In this case, you can run the following command to explicitly grant the permissions.
sudo setfacl -R -m d:u:otelcol-sumo:r-x,d:g:otelcol-sumo:r-x,u:otelcol-sumo:r-x,g:otelcol-sumo:r-x <PATH_TO_LOG_FILE>
Run the above command for all the log files in the directory that need to be ingested, which are not residing in the default location.
If Linux ACL Support is not available, traditional Unix-styled user and group permission must be modified. It should be sufficient to add the otelcol system user to the specific group that has access to the log files.
For Windows systems, log files which are collected should be accessible by the SYSTEM group. Use the following set of PowerShell commands if the SYSTEM group does not have access.
$NewAcl = Get-Acl -Path "<PATH_TO_LOG_FILE>"
# Set properties
$identity = "NT AUTHORITY\SYSTEM"
$fileSystemRights = "ReadAndExecute"
$type = "Allow"
# Create new rule
$fileSystemAccessRuleArgumentList = $identity, $fileSystemRights, $type
$fileSystemAccessRule = New-Object -TypeName System.Security.AccessControl.FileSystemAccessRule -ArgumentList $fileSystemAccessRuleArgumentList
# Apply new rule
$NewAcl.SetAccessRule($fileSystemAccessRule)
Set-Acl -Path "<PATH_TO_LOG_FILE>" -AclObject $NewAcl
Collection configuration and app installation
Follow these steps to set up and deploy the source template to collect data in Sumo Logic from a remotely managed OpenTelemetry collector.
Step 1: Set up remotely managed OpenTelemetry collector
If you want to configure your source locally, you can do so by downloading the YAML file. For details, see Configure OpenTelemetry collectors locally.
In this step, we'll install remotely managed OpenTelemetry collector and add a uniquely identifiable tag to these collectors.
- Classic UI. In the main Sumo Logic menu, Select App Catalog.
New UI. In the Sumo Logic main menu select App Catalog. - In the 🔎 Search Apps field, run a search for your desired OpenTelemetry app, then select it. For example, Apache - OpenTelemetry.
- Click the Manage dropdown and then select Add Collection.
- On the Set Up Collector page, select Add a New Collector and then click Next.
If you want to use an existing OpenTelemetry Collector, you can skip this step by selecting the Use an existing Collector option.
- Select the platform where you want to install the Sumo Logic OpenTelemetry Collector. For example, Linux.
This will generate a command that you can execute in the machine environment you need to monitor. Once executed, it will install the Sumo Logic OpenTelemetry Collector.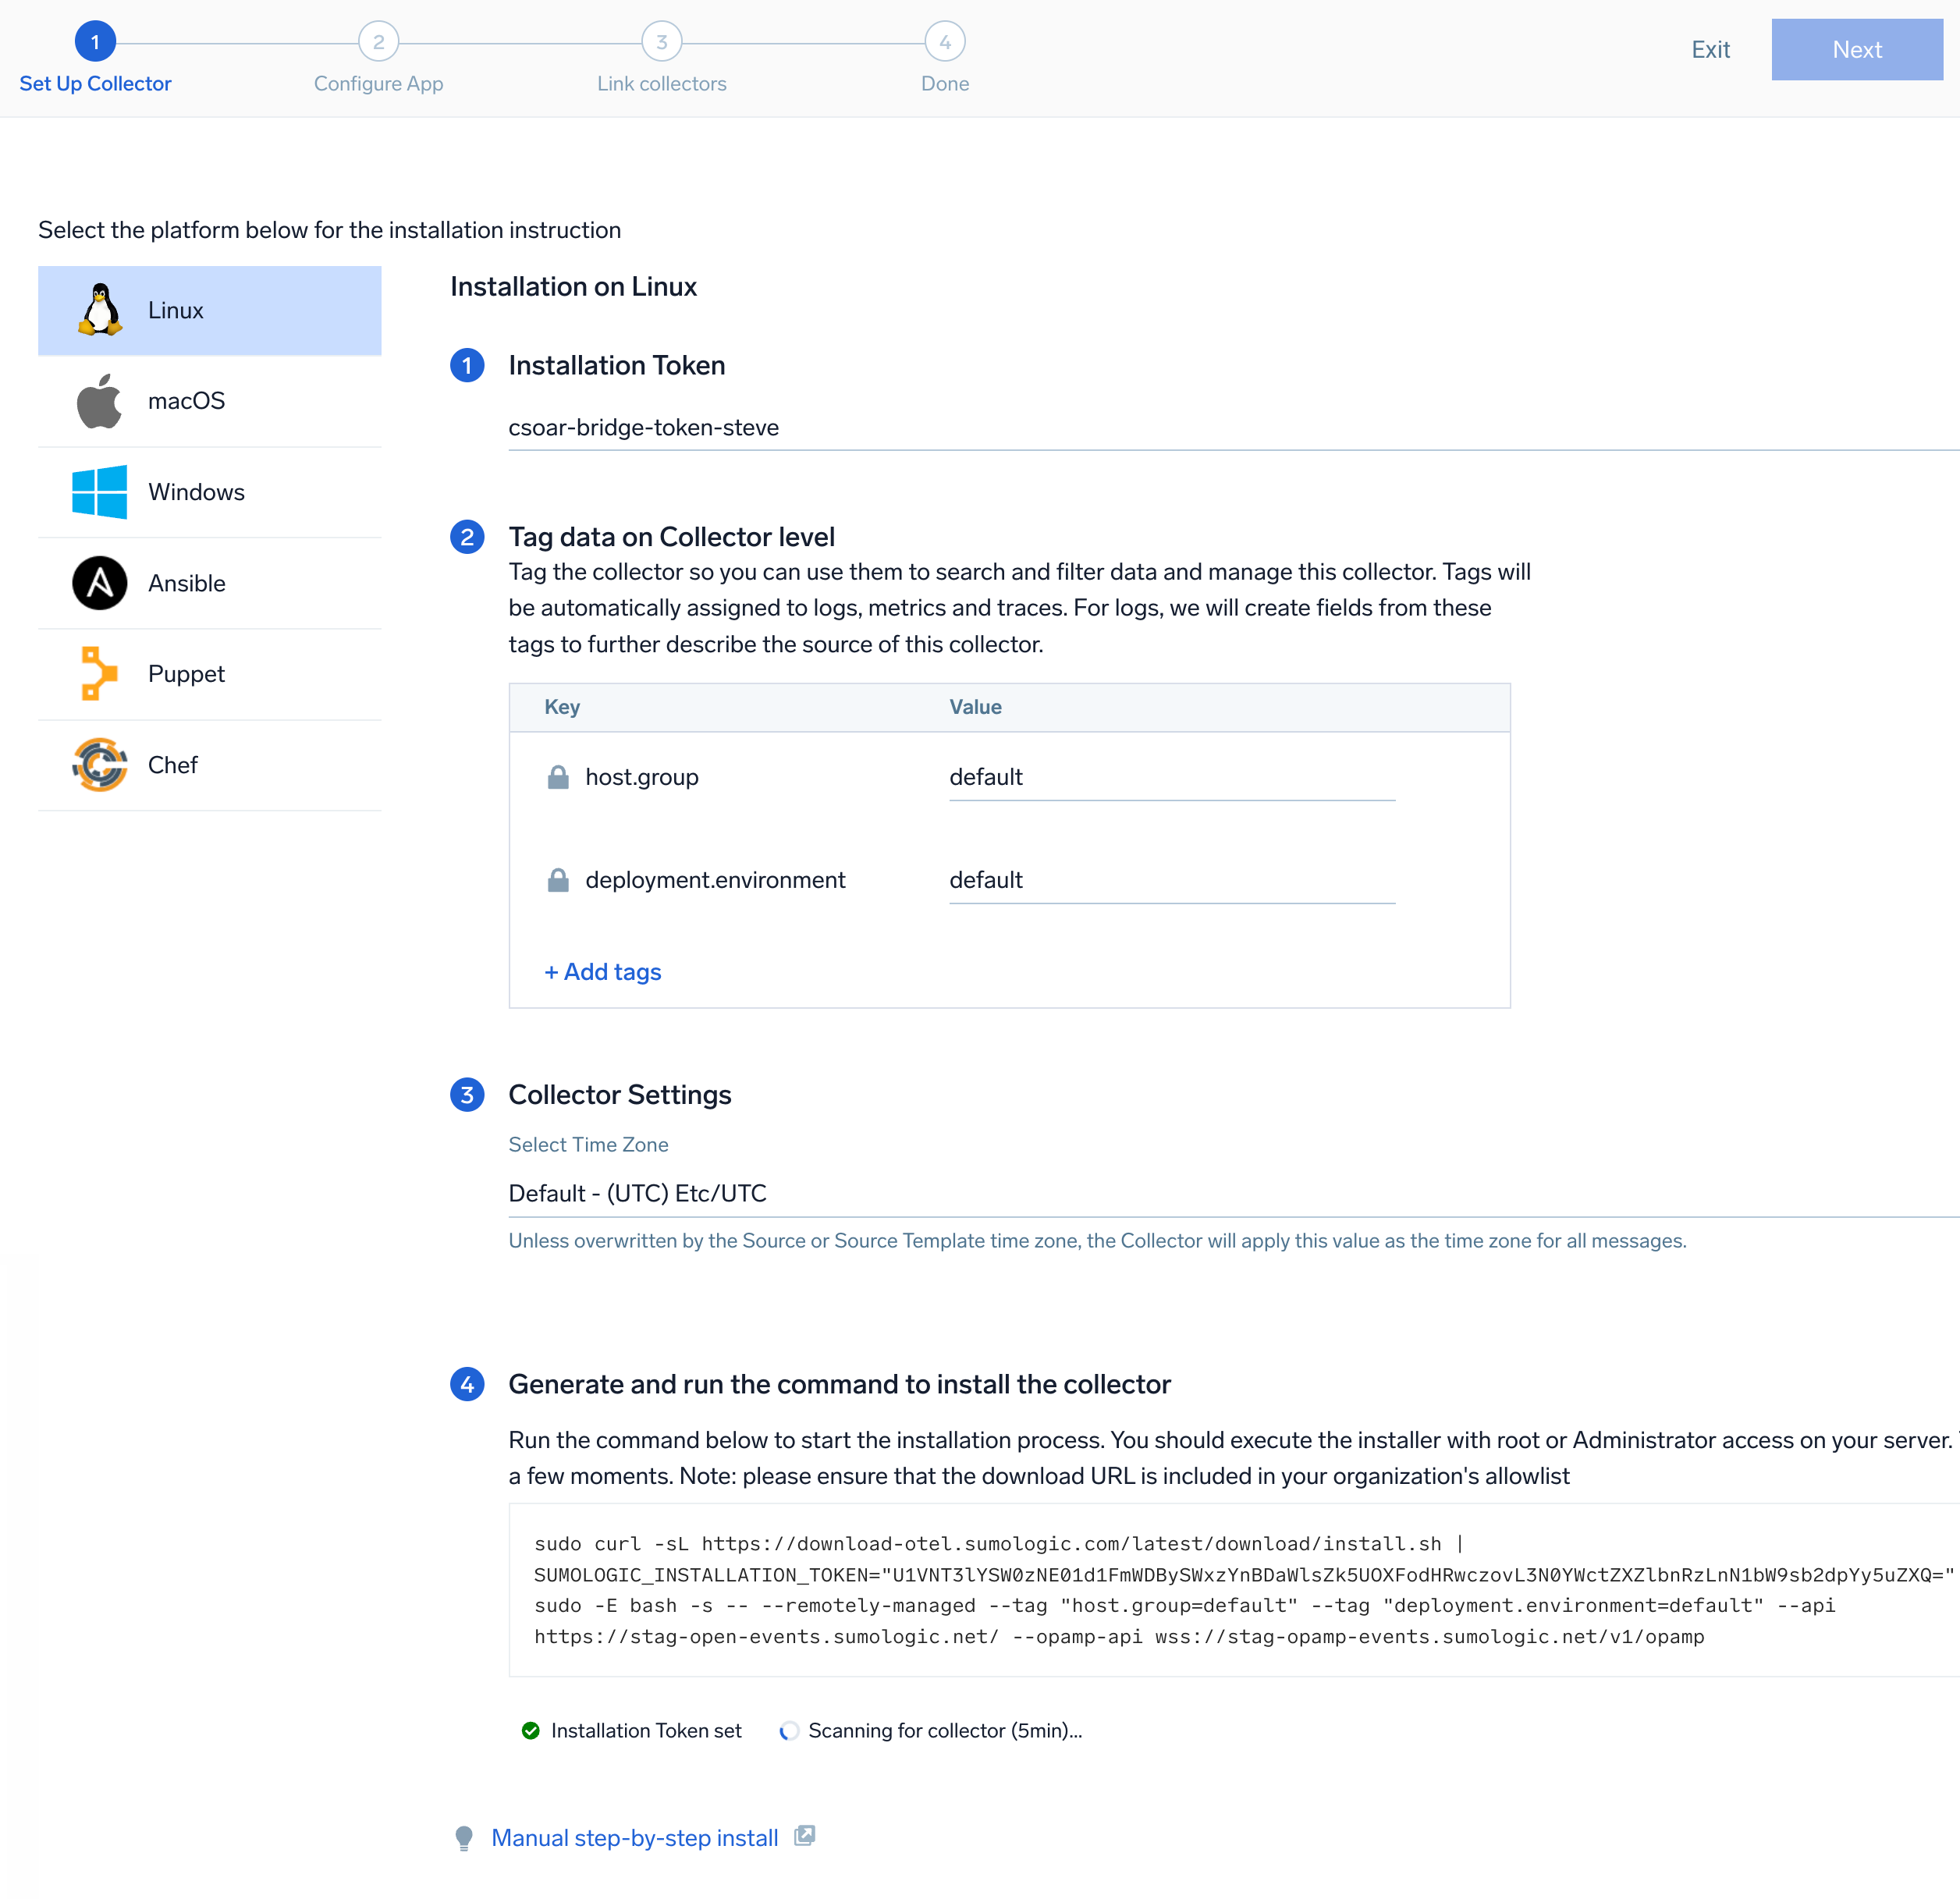 The installation commands now include a
 --remotely-managedflag. When this flag is used, a remotely managed collector is installed automatically instead of a locally managed one. If you prefer to use a locally managed collector, simply remove the flag from the installation command.
Step 2: Configure the source template
In this step, you will configure the yaml required for Kafka collection. Below are the inputs required for configuration:
- Name. Name of the source template.
- Description. Description for the source template.
- Server file log path. Enter the path to the server log file for your Kafka instance.
- Controller file log path. Enter the path to the controller log file for your Kafka instance.
- Endpoint. The URL of the broker endpoint (default:
localhost:9092). - Fields/Metadata. You can provide any customer fields to be tagged with the data collected. By default, Sumo Logic tags
_sourceCategorywith the value otel/kafka user needs to provide the value forwebengine.cluster.name.
Timestamp Parsing. You can configure timestamp parsing for logs ingested using this source template. For more information, see Timestamps, Time Zones, Time Ranges, and Date Formats for the OpenTelemetry Collector.
Processing Rules. You can add processing rules for logs/metrics collected. To learn more, refer to Processing Rules.
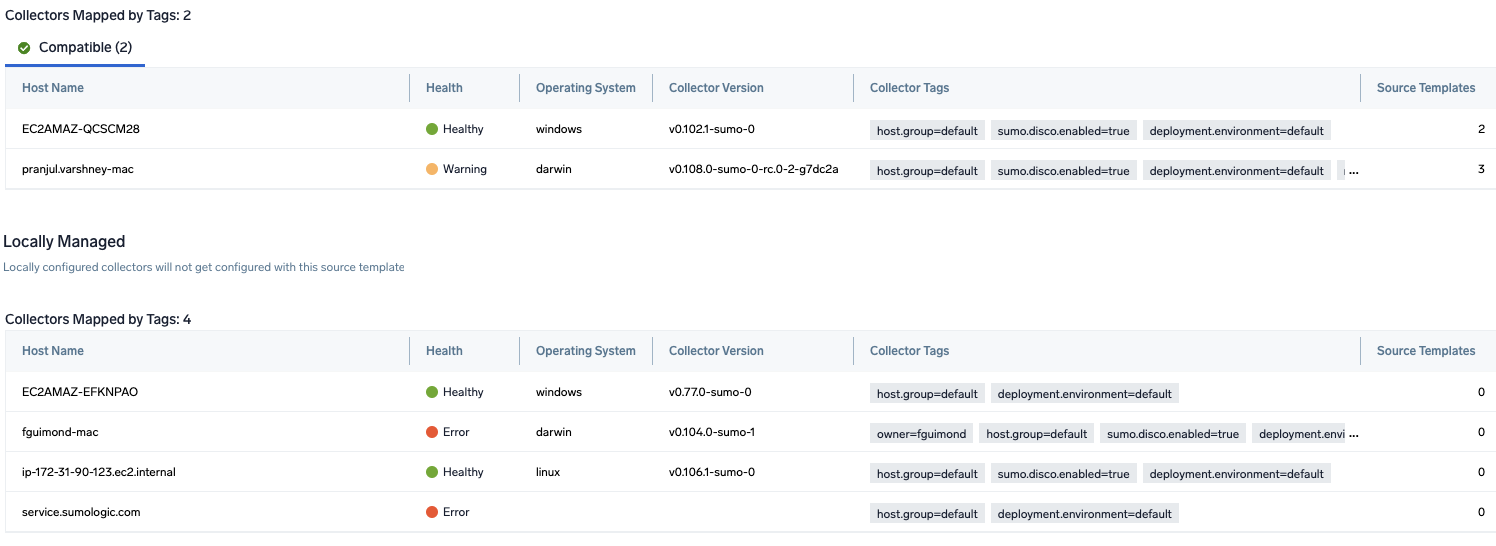
Step 3: Push the source template to the desired remotely managed collectors
A new source template will always be created with the latest version of the source template.
Follow the below steps to create a data collection configuration to gather the required logs and link them to all the collectors with the help of collector tags.
- Complete the source template form with the name and file path for your logs (for example, error logs or access logs), then click Next.
- Under Link Collectors, you will have the option to link the collectors using the collector name or by adding tags to find the group of collectors (for example,
application = Apache).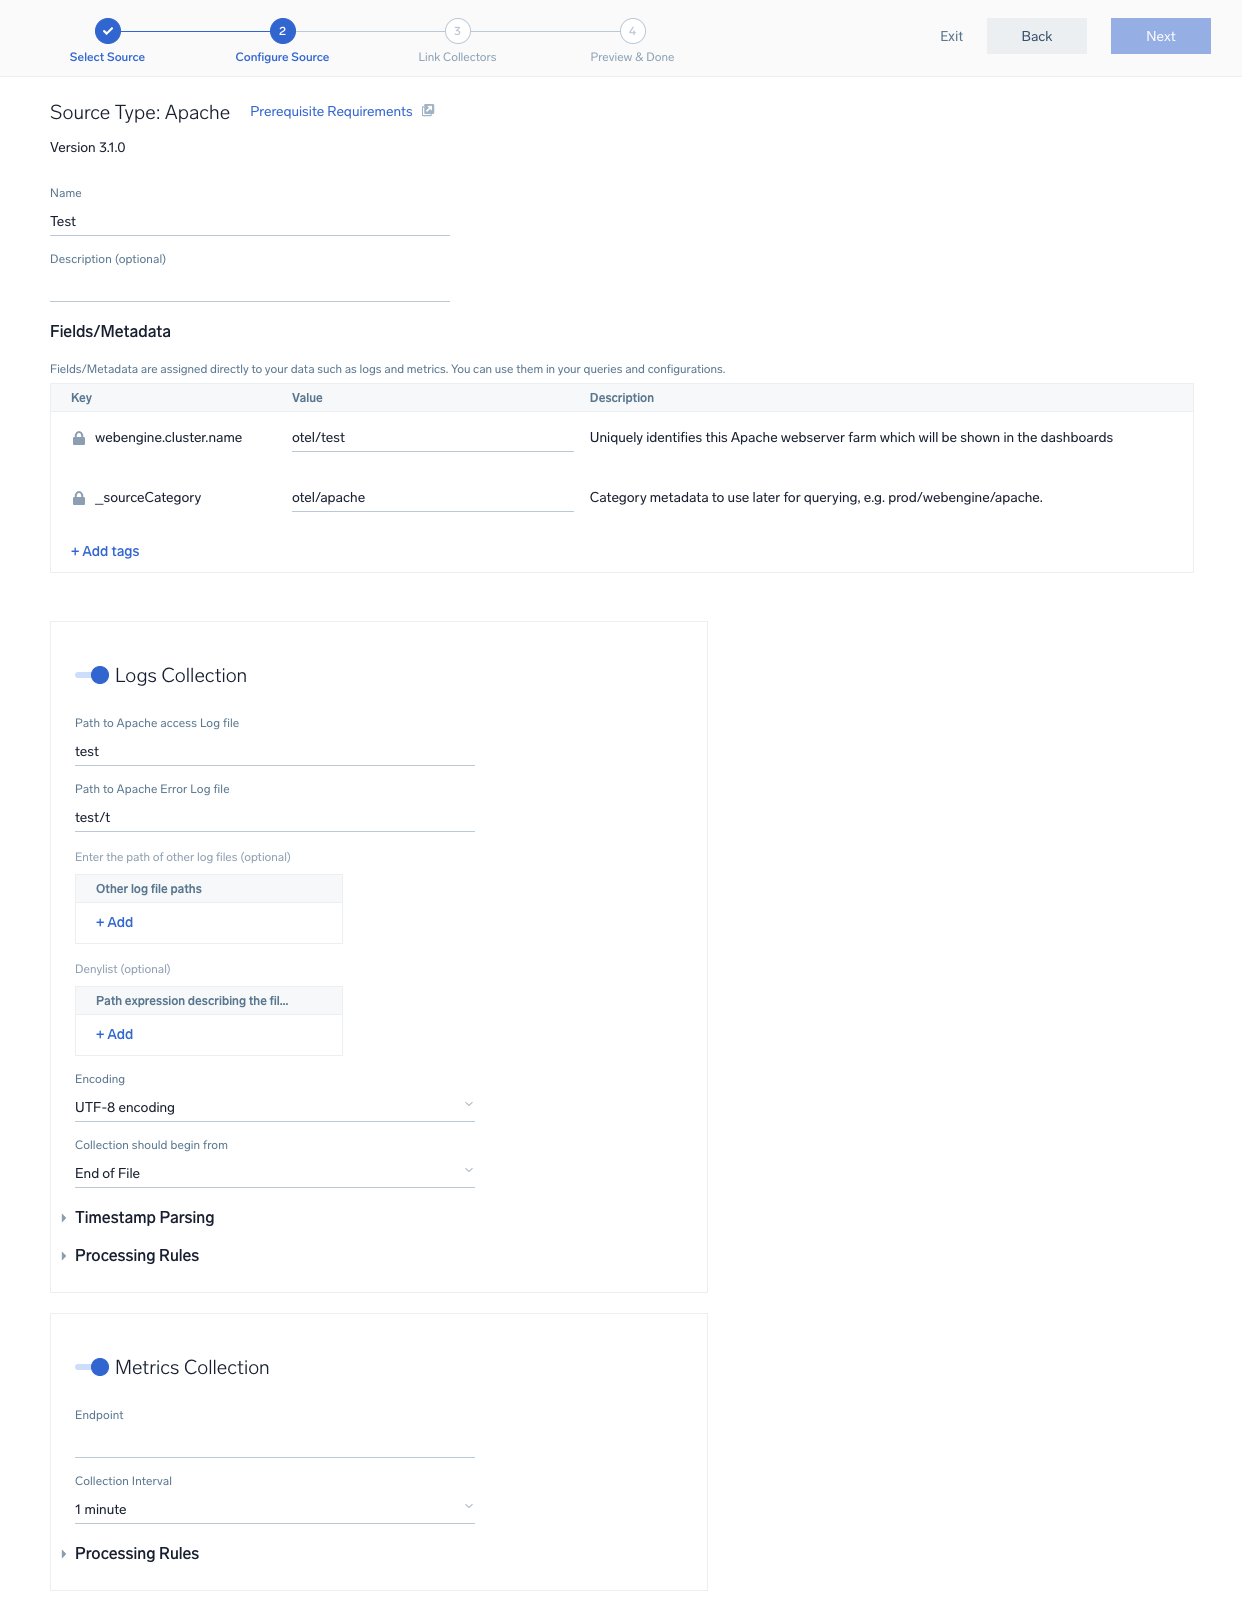
- Preview and confirm the collectors that will be linked (fetched automatically) to the newly created source template.
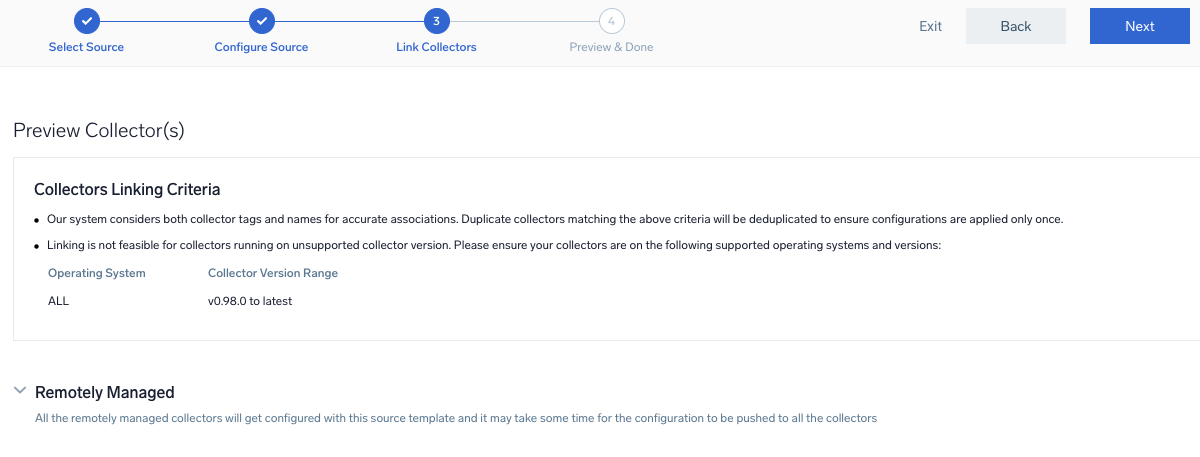
- Click Next to complete the source template creation. In the background, the system will apply the configuration to all the linked collectors and will start collecting the respective telemetry data from the remote host (in the example, it would start collecting Apache error logs).
- Click the Log Search or Metrics Search icons to search for and analyze your data collected for this source template.
Sample log messages
[2021-03-10 20:12:28,742] INFO [KafkaServer id=0]
started (kafka.server.KafkaServer)
Sample metrics
"Query","metric","deployment.environment","host.name","messaging.cluster.name","messaging.node.name","messaging.system","os.type","sumo.datasource","topic","unit","latest"
"A","kafka.topic.partitions","prod","ip-10-0-18-47","kafkaotdemo","ip-10-0-18-47","kafka","linux","kafka","otlp_spans","{partitions}","1"
Sample queries
Log query
This is a sample log query from the Events by Severity panel in the Kafka - Logs dashboard.
sumo.datasource=kafka messaging.cluster.name={{messaging.cluster.name}}
| json auto maxdepth 1 nodrop
| if (isEmpty(log), , log) as kafka_log_message
| parse field=kafka_log_message "[*] * *" as date_time,severity,msg
| where severity in ("DEBUG", "INFO", "ERROR", "TRACE", "FATAL")
| count by severity
Metrics query
This is a sample metrics query from the Partition by Topics panel in the Kafka - Metrics dashboard.
sumo.datasource=kafka metric=kafka.topic.partitions messaging.cluster.name={{messaging.cluster.name}} | sum by messaging.cluster.name,topic
Viewing Kafka Dashboards
All dashboards have a set of filters that you can apply to the entire dashboard. Use these filters to drill down and examine the data to a granular level.
- You can change the time range for a dashboard or panel by selecting a predefined interval from a drop-down list, choosing a recently used time range, or specifying custom dates and times. Learn more.
- You can use template variables to drill down and examine the data on a granular level. For more information, see Filtering Dashboards with Template Variables.
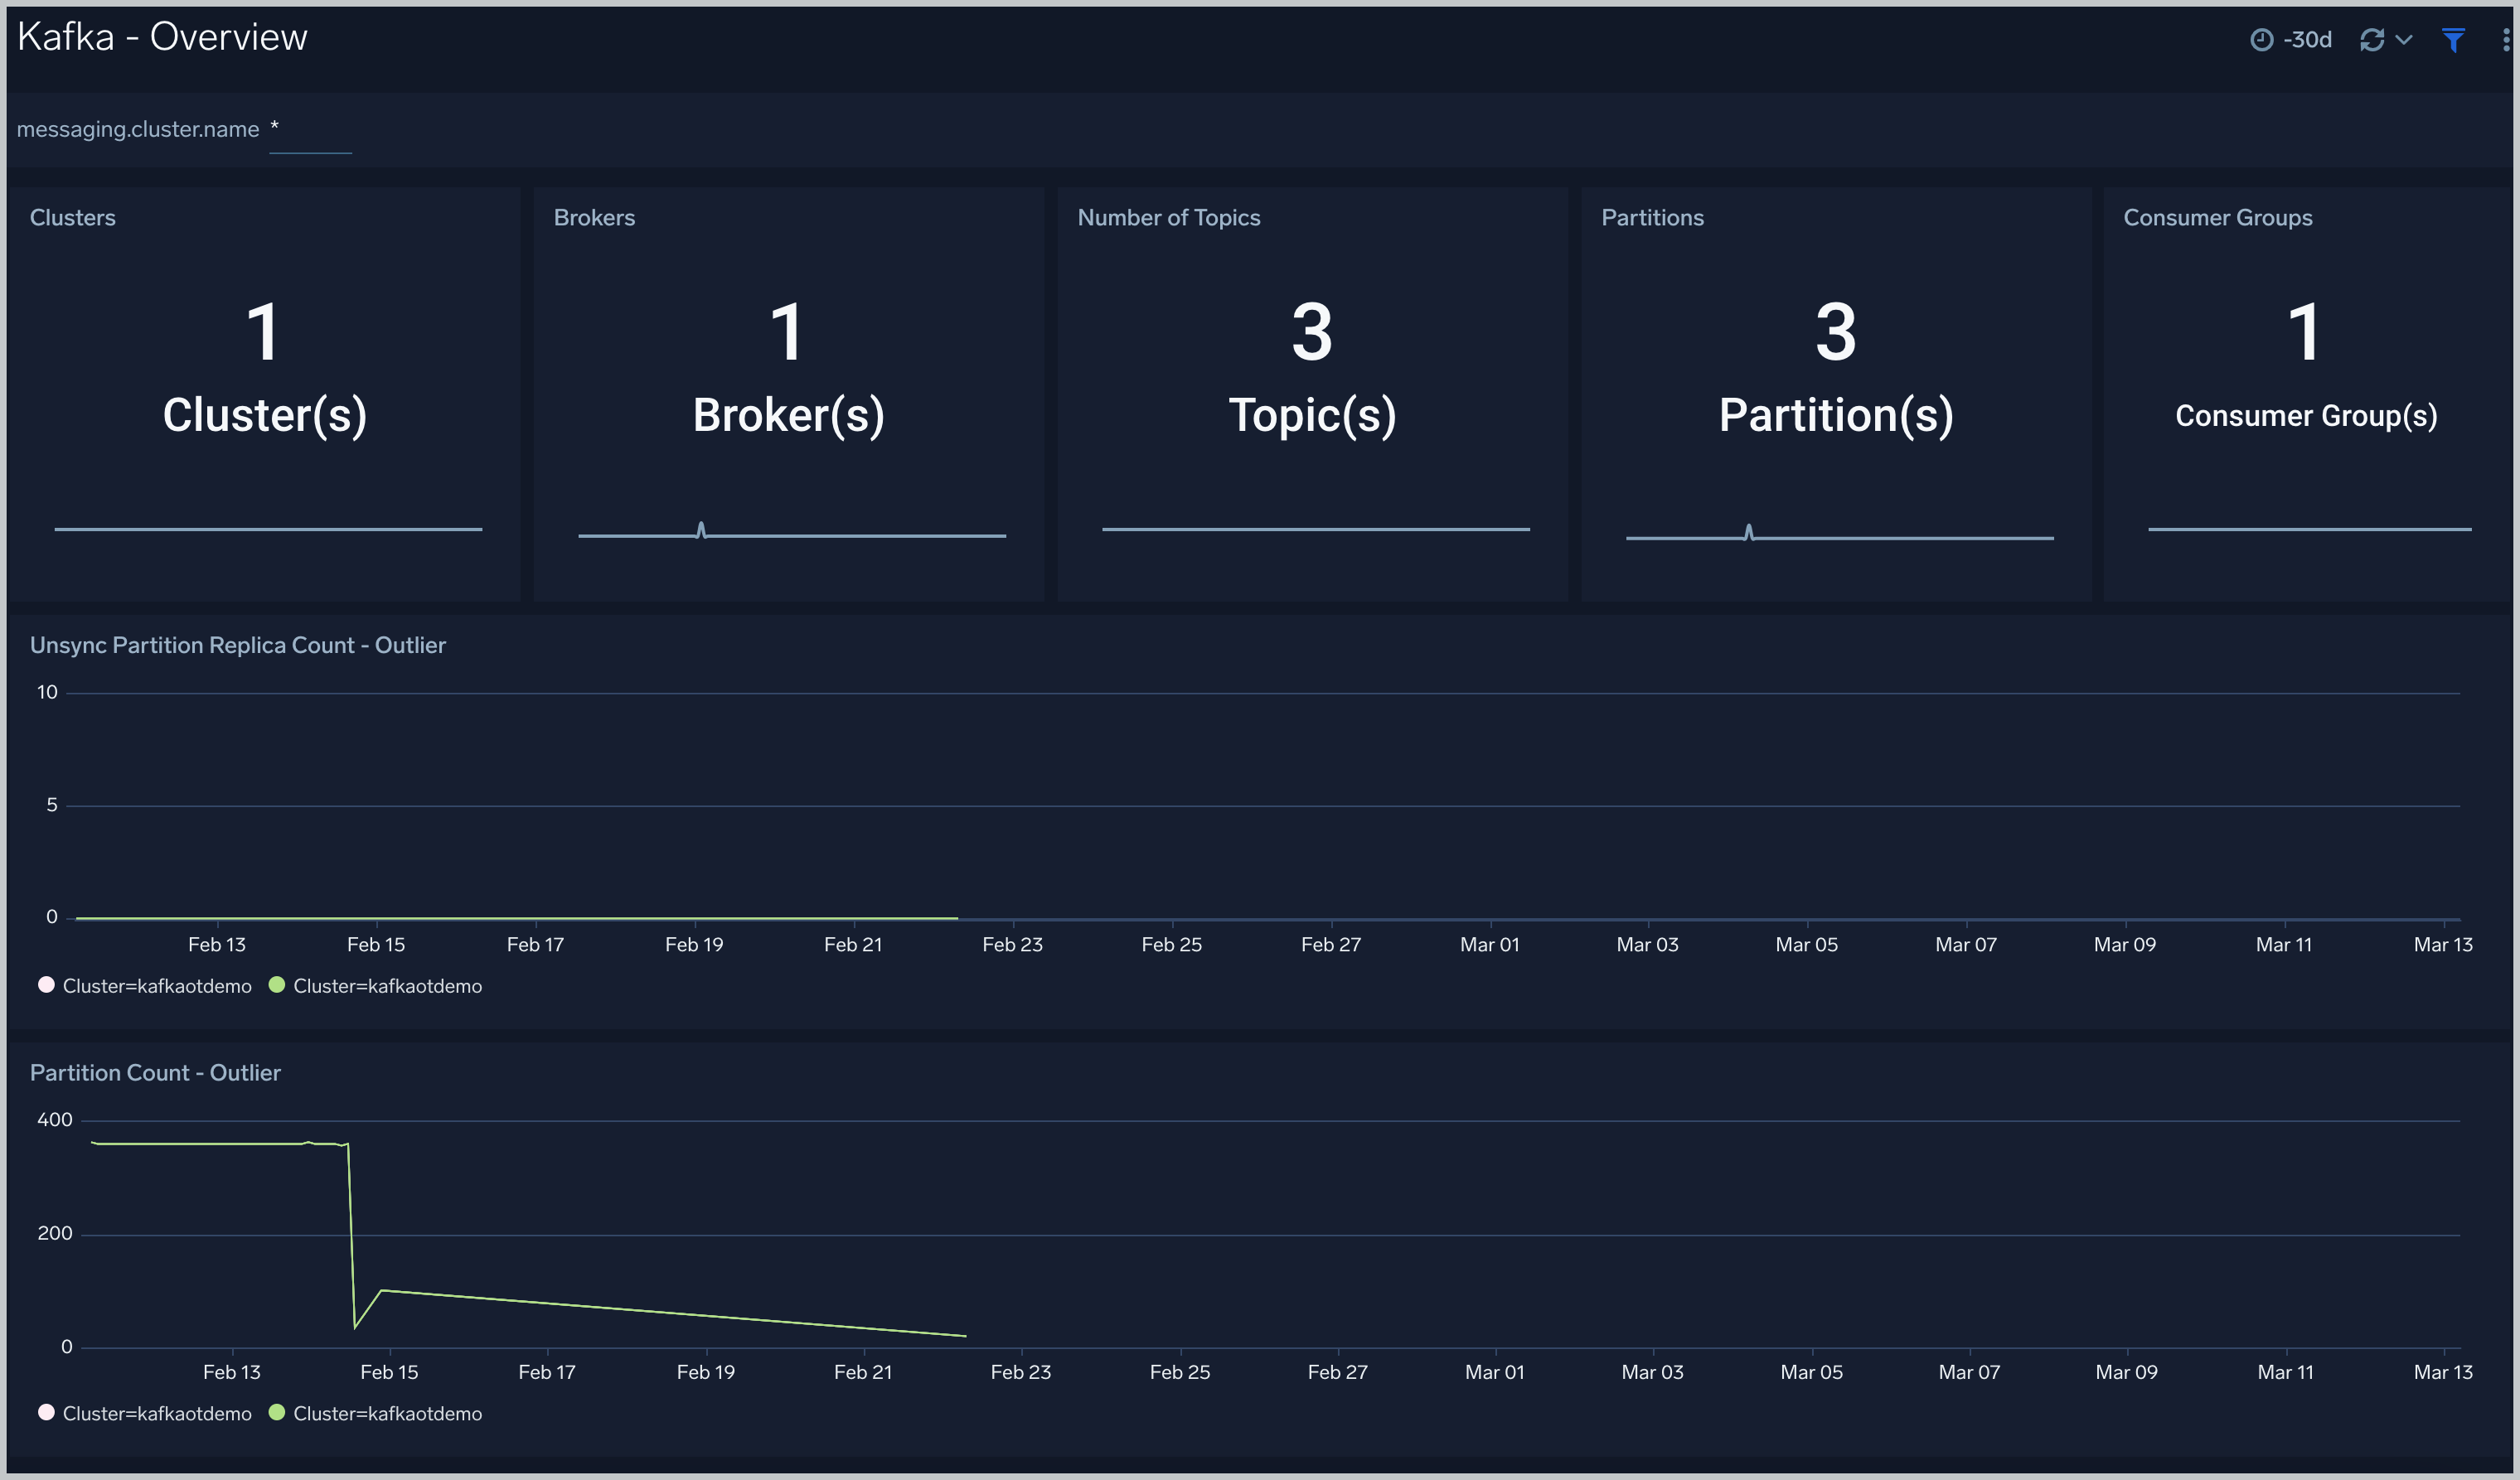
Overview
The Kafka - Overview dashboard gives you an at-a-glance view of your Kafka deployment across brokers, topics, partitions and consumer groups.
Use this dashboard to:
- Analyze trends across Partition Count and Unsync Partition Replica count metrics.
- Determine the number of brokers, partitions and topics across each cluster and ensure they match with expectations
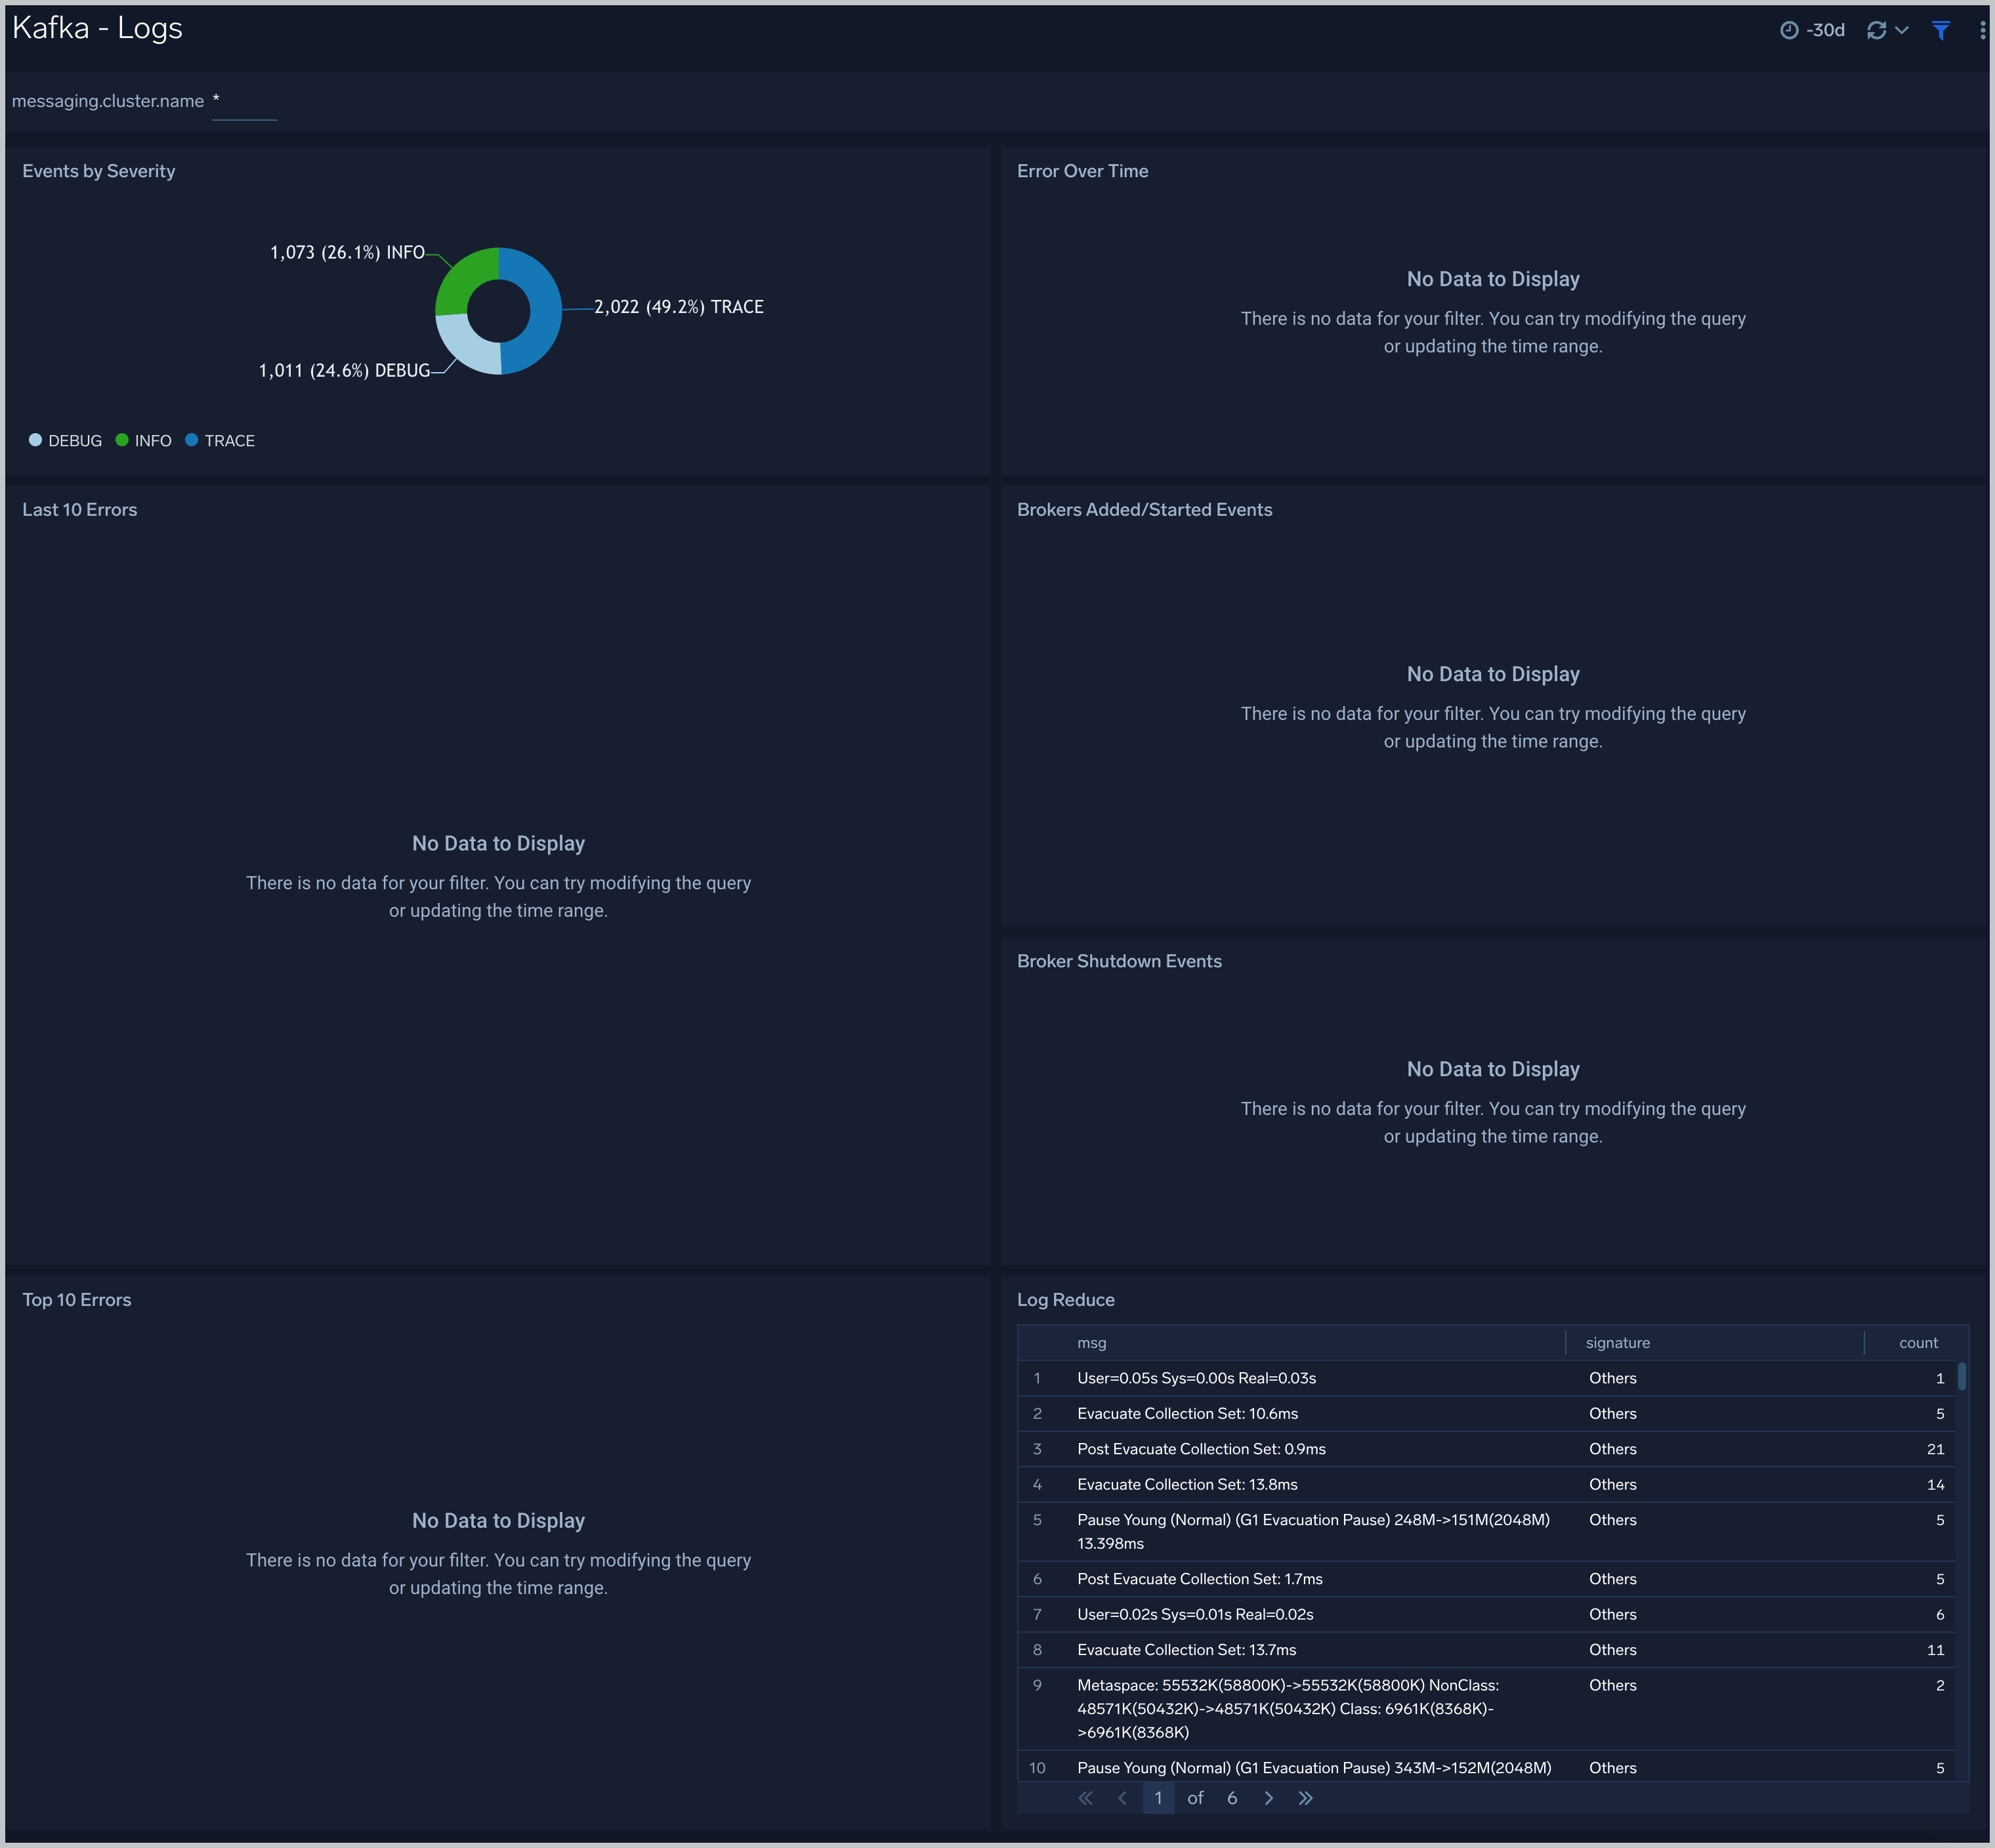
Logs
The Kafka - Logs dashboard helps you quickly analyze your Kafka error logs across all clusters.
Use this dashboard to:
- Identify critical events in your Kafka broker and controller logs.
- Examine trends to detect spikes in Error or Fatal events.
- Monitor Broker added/started and shutdown events in your cluster.
- Quickly determine patterns across all logs in a given Kafka cluster.
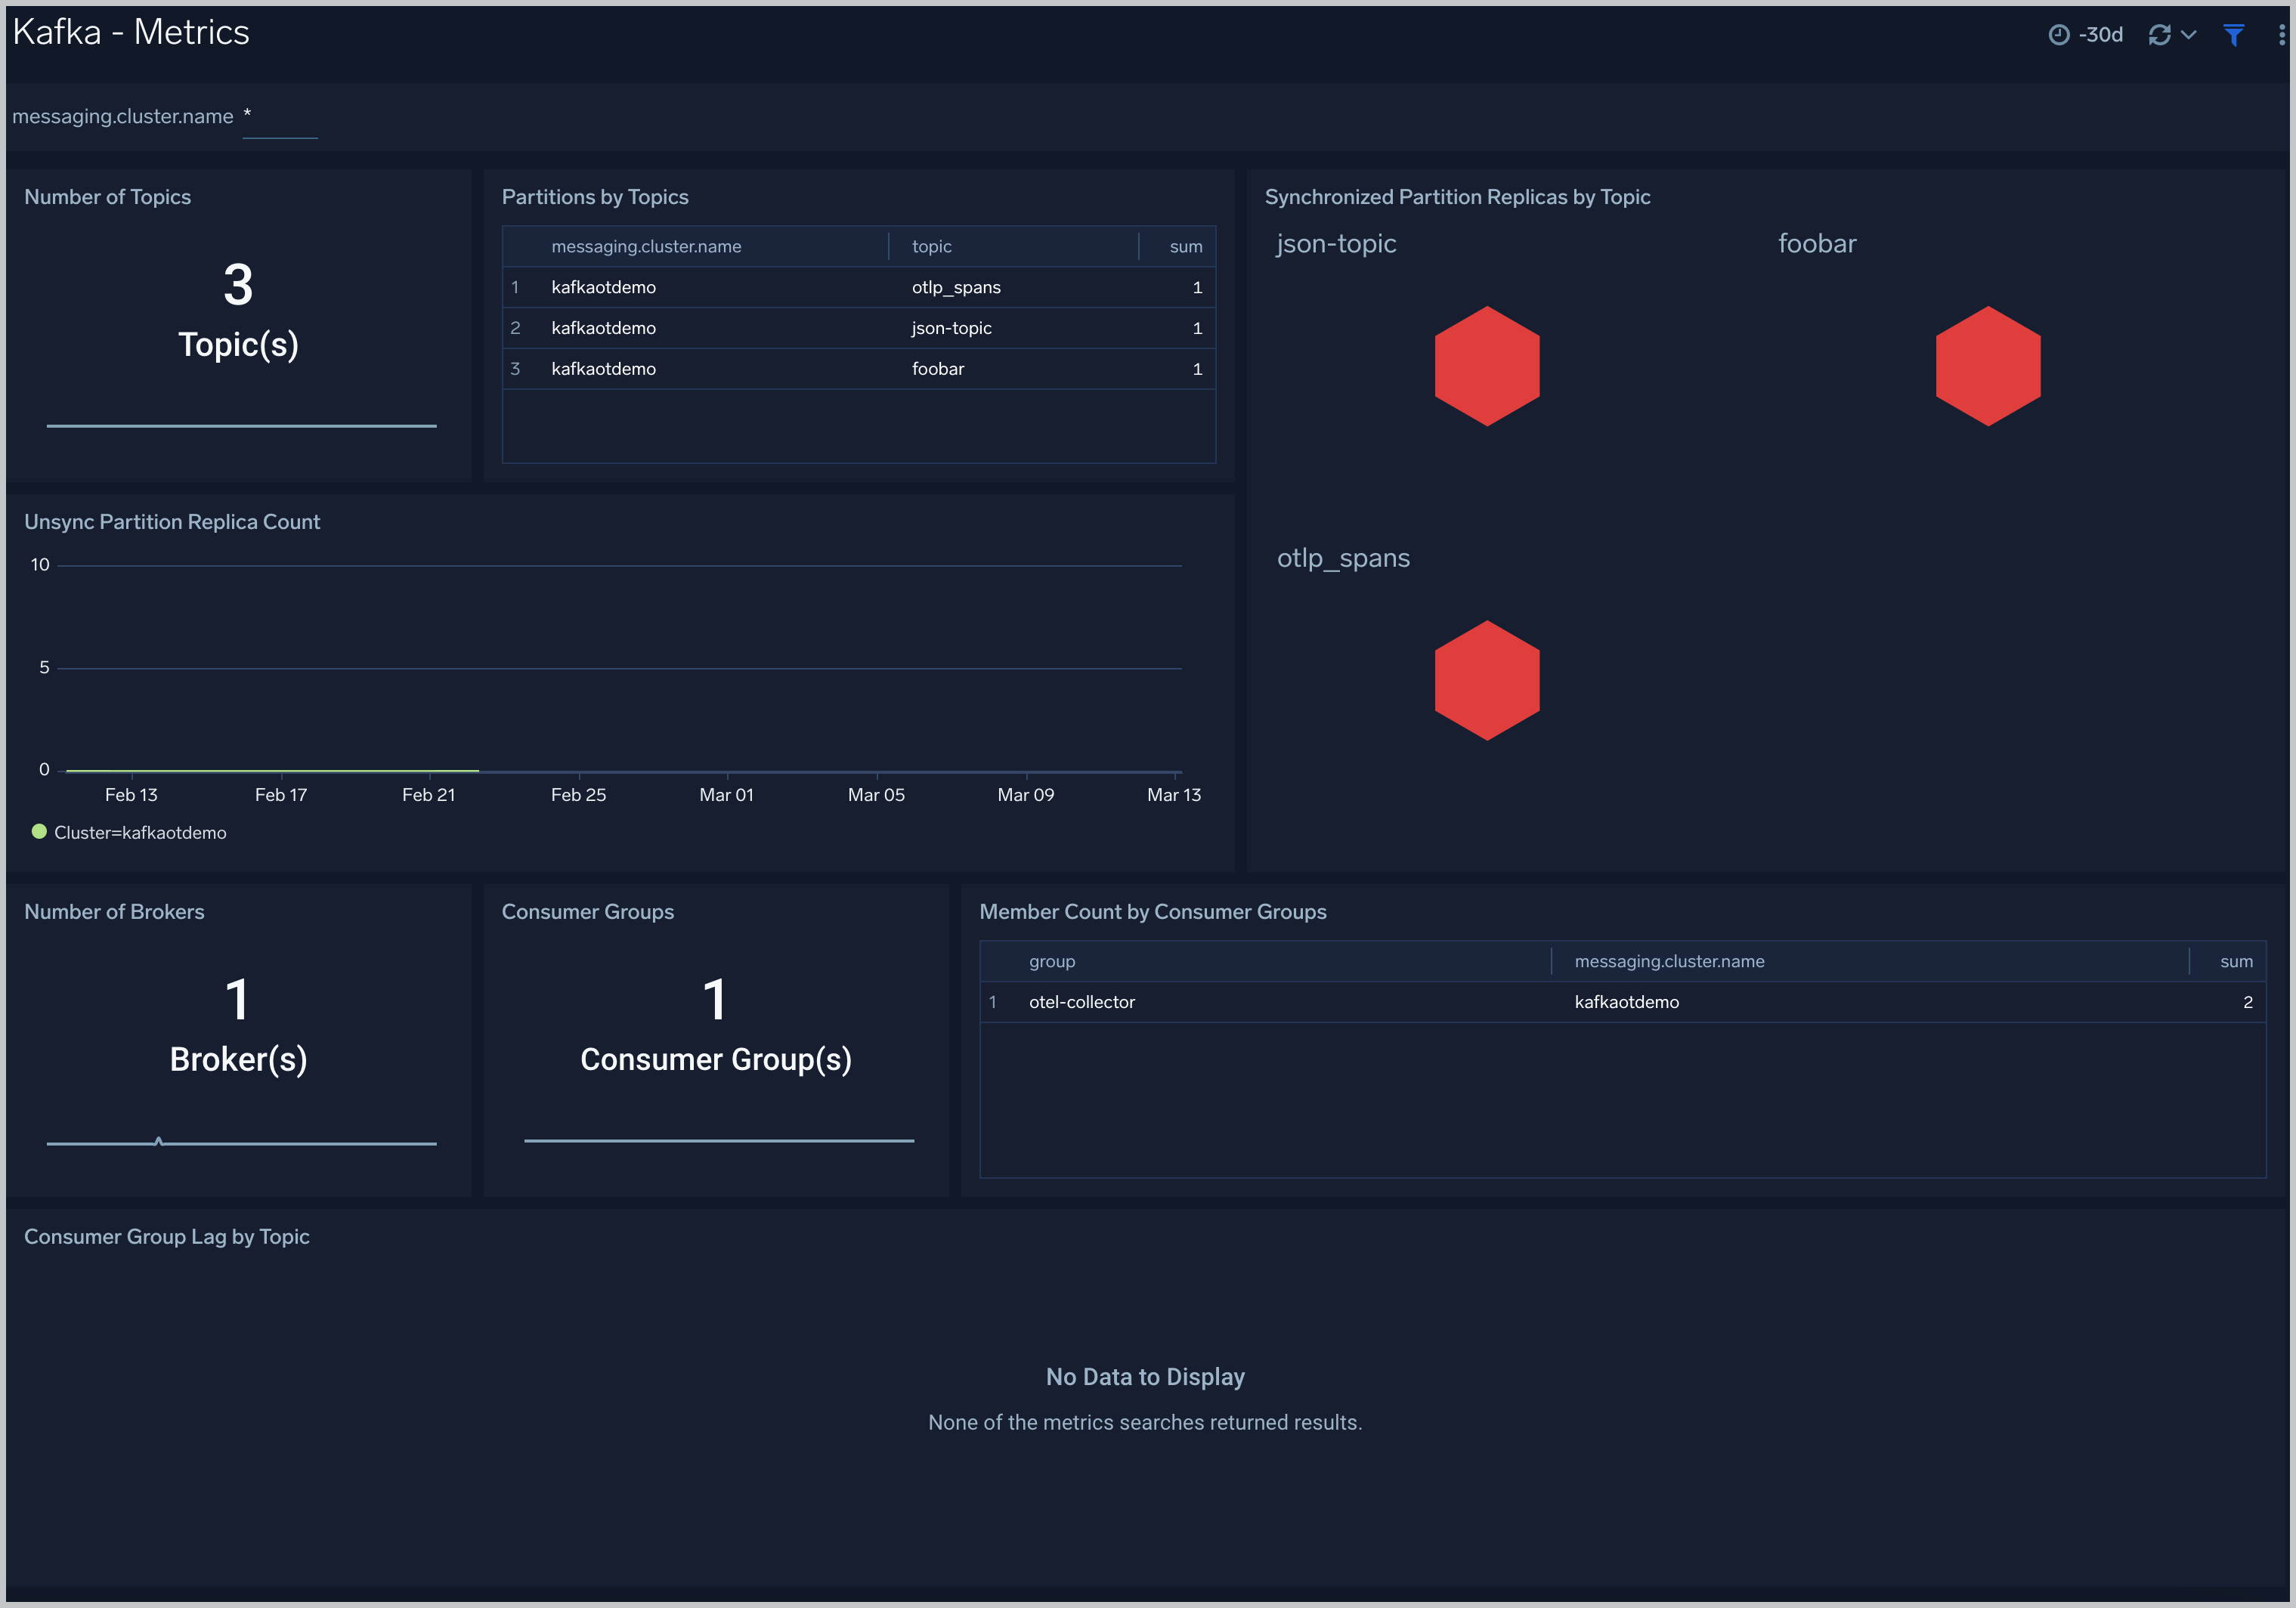
Metrics
The Kafka - Metrics dashboard helps you to monitor unsynchronized partition replicas and consumer groups.
Use this dashboard to:
- Monitor consumer Group Lag by Topic.
- Identify unsynchronized partition replicas.
Create monitors for Kafka app
From your App Catalog:
- From the Sumo Logic navigation, select App Catalog.
- In the Search Apps field, search for and then select your app.
- Make sure the app is installed.
- Navigate to What's Included tab and scroll down to the Monitors section.
- Click Create next to the pre-configured monitors. In the create monitors window, adjust the trigger conditions and notifications settings based on your requirements.
- Scroll down to Monitor Details.
- Under Location click on New Folder.
note
By default, monitor will be saved in the root folder. So to make the maintenance easier, create a new folder in the location of your choice.
- Enter Folder Name. Folder Description is optional.
tip
Using app version in the folder name will be helpful to determine the versioning for future updates.
- Click Create. Once the folder is created, click on Save.
Kafka alerts
| Alert Name | Alert Description and conditions | Alert Condition | Recover Condition |
|---|---|---|---|
Kafka - Fatal Event on Broker Alert | This alert gets triggered when we detect a fatal operation on a Kafka broker node | Count >= 1 | Count < 1 |
Kafka - Large number of broker errors Alert | This alert gets triggered when we detect that there are 5 or more errors on a Broker node within a time interval of 5 minutes. | Count >= 5 | Count < 5 |