 Meet the new
 Host Metrics Sumo Logic app

The Host Metrics app allows you to monitor the performance and resource utilization of hosts and processes that your mission critical applications are dependent upon. Preconfigured dashboards provide insight into CPU, memory, network, file descriptors, page faults, and TCP connectors. This app uses the Sumo Logic installed collector for the collection of host metrics data.
Collecting metrics for the Host Metrics app
This procedure explains how to collect metrics from a host machine and ingest them into Sumo Logic for metrics visualization.
Configure a Collector
Configure an Installed Collector. Collectors can be installed on Linux, Windows, or Mac OS hosts.
Configure a Source
- Configure a Host Metrics Source. Choose Add Source and select Host Metrics as the source type.
- Configure the Source Fields as follows:
- Name. Required. Description is optional. The source name is stored in a searchable field called
_sourceName. - Source Host. Enter the host name of the machine from which the metrics will be collected.
- Source Category. Required. The Source Category metadata field is a fundamental building block to organize and label Sources. For details, see Best Practices.
- Scan Interval. Select the frequency for the Source to scan for hostmetrics data. Selecting a short interval will increase the message volume and could cause your deployment to incur additional charges. The default is 1 minute.
- Metrics. Select check boxes for the metrics to collect. By default, all CPU and memory metrics are collected. Select the top level check box to select all metrics in that category. A blue checkmark icon indicates that the category is selected. To select individual metrics, click the right-facing arrow to expand the category and select the individual metrics. The icon changes to
 , as shown below.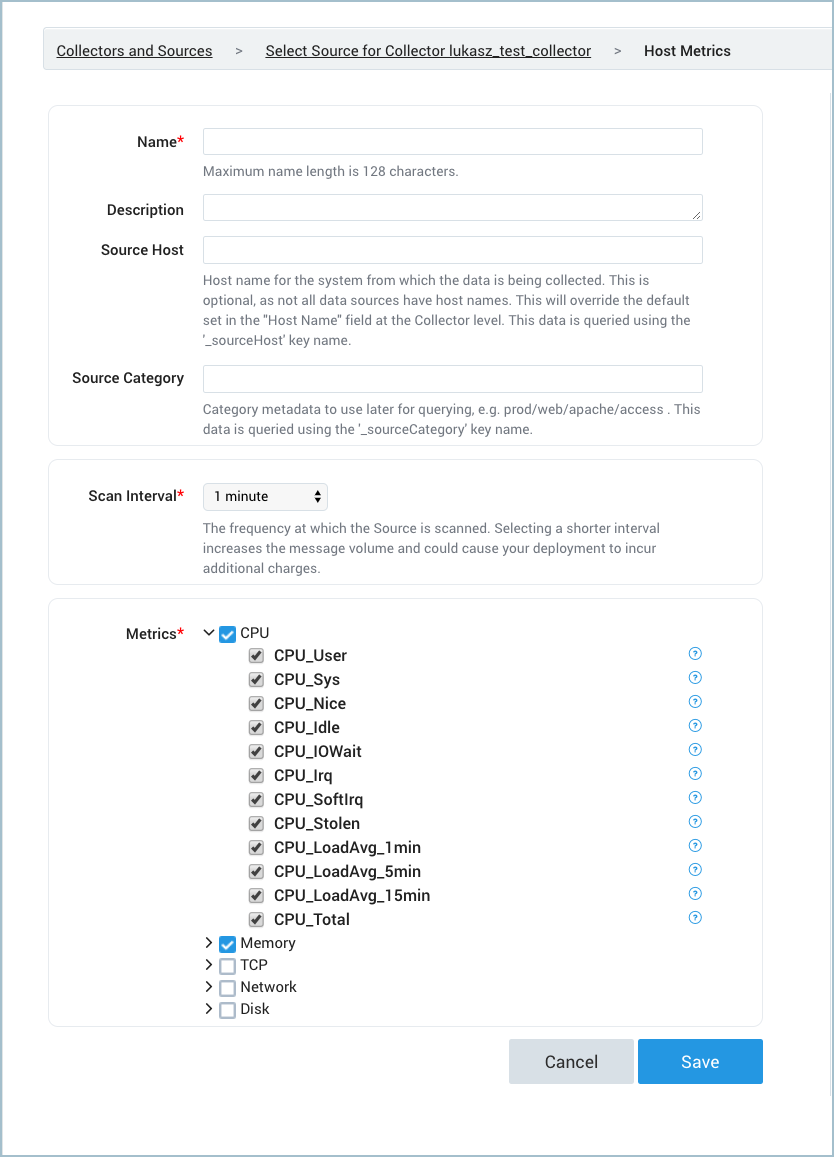
- Name. Required. Description is optional. The source name is stored in a searchable field called
- Click Save.
Metric types
Available metrics include:
- CPU
- Memory
- TCP
- Network
- Disk
The metrics that are collected are described in Host Metrics for Installed Collectors.
Host metrics are gathered by the open-source SIGAR library.
The following tables list the available host metrics.
CPU metrics
| Metric | Units | Description |
|---|---|---|
| CPU_User | % | Total system cpu user time |
| CPU_Sys | % | Total system cpu kernel time |
| CPU_Nice | % | Total system cpu nice time |
| CPU_Idle | % | Total system cpu idle time |
| CPU_IOWait | % | Total system cpu IO wait time |
| CPU_Irq | % | Total system cpu time servicing interrupts |
| CPU_SoftIrq | % | Total system cpu time servicing softirqs |
| CPU_Stolen | % | Total system cpu involuntary wait time |
| CPU_LoadAvg_1min* | Average | System load average for past 1 minute |
| CPU_LoadAvg_5min* | Average | System load average for past 5 minutes |
| CPU_LoadAvg_15min* | Average | System load average for past 15 minutes |
| CPU_Total | % | Total system CPU usage time |
Load averages are not available on Windows platform.
Memory Metrics
| Metric | Units | Description |
| Mem_Total | Bytes | Total amount of physical RAM |
| Mem_Free | Bytes | The amount of physical RAM left unused by the system |
| Mem_Used | Bytes | Total used system memory, calculated as
This metric includes the space allocated in buffers and in the Page Cache, which can make it appear that a larger portion of physical RAM is being consumed than is actually in use. See |
| Mem_ActualFree | Bytes | Actual total free system memory calculated as:
Where
|
| Mem_ActualUsed | Bytes | Actual total used system memory calculated as: Mem_Total - Mem_Actual_FreeThis metric better represents the amount of physical RAM in use than Mem_Used. |
| Mem_UsedPercent | % | Percent total used system memory calculated as: (Mem_Total - Mem_Actual_Free) / Mem_total |
| Mem_FreePercent | % | Percent total free system memory |
| Mem_PhysicalRam | Bytes | System random access memory |
TCP metrics
| Metric | Units | Description |
|---|---|---|
| TCP_InboundTotal | Count | TCP inbound connection count |
| TCP_OutboundTotal | Count | TCP outbound connection count |
| TCP_Established | Count | TCP established connection count |
| TCP_Listen | Count | TCP listen connection count |
| TCP_Idle | Count | TCP idle connection count |
| TCP_Closing | Count | TCP closing connection count |
| TCP_CloseWait | Count | TCP close_wait connection count |
| TCP_Close | Count | TCP close connection count |
| TCP_TimeWait | Count | TCP time_wait connection count |
Networking metrics
These have two additional dimensions:
- Interface: Name of the network interface (example:
eth0) - Description: Description of the network interface (example:
Dual Band Wireless-AC 8265)
Networking metrics are cumulative, so you can use the rate operator to display these metrics as a rate per second. For example: metric=Net_InBytes Interface=eth0 | rate.
| Metric | Units | Description |
|---|---|---|
| Net_InPackets | Packets | Number of received packets |
| Net_OutPackets | Packets | Number of sent packets |
| Net_InBytes | Bytes | Number of received bytes |
| Net_OutBytes | Bytes | Number of sent bytes |
Disk metrics
Disk metrics have two additional dimensions:
- DevName: Device name, such as the mount name (example:
udev) - DirName: Directory name, such as the mount directory (example:
/dev)
Disk_Reads, Disk_Writes, Disk_ReadBytes, and Disk_WriteBytes are cumulative, so you can use the rate operator to display these metrics as a rate per second. For example: metric=Disk_WriteBytes | rate.
| Metric | Units | Description |
|---|---|---|
| Disk_Reads | Operations | Number of physical disk reads |
| Disk_ReadBytes | Bytes | Number of physical disk bytes read |
| Disk_Writes | Operations | Number of physical disk writes |
| Disk_WriteBytes | Bytes | Number of physical disk bytes written |
| Disk_Queue | Operations | Number of disk queue operations |
| Disk_InodesAvailable* | Nodes | Number of free file nodes |
| Disk_Used | Bytes | Total used bytes on filesystem |
| Disk_UsedPercent | % | Percentage of filesystem space used |
| Disk_Available | Bytes | Total available bytes on filesystem |
Disk_InodesAvailable is not available on Windows platform.
Time Intervals
The time interval determines how frequently the Source is scanned for metrics data. Sumo Logic supports pre-specified time intervals (10 seconds, 15 seconds, 30 seconds, 1 minute, and 5 minutes).
You can also specify a time interval in JSON by using the interval parameter, as follows:
"interval" : 60000
The JSON parameter is in milliseconds. We recommend 60 seconds (60000 ms) or longer granularity. Specifying a shorter interval will increase the message volume and could cause your deployment to incur additional charges.
AWS Metadata
Collectors running on AWS EC2 instances can optionally collect AWS Metadata such as EC2 tags to make it easier to search for Host Metrics. For more information, see AWS Metadata Source for Metrics.
Only one AWS Metadata Source for Metrics is required to collect EC2 tags from multiple hosts.
Installing the Host Metrics app
To install the app, do the following:
Next-Gen App: To install or update the app, you must be an account administrator or a user with Manage Apps, Manage Monitors, Manage Fields, Manage Metric Rules, and Manage Collectors capabilities depending upon the different content types part of the app.
- Select App Catalog.
- In the 🔎 Search Apps field, run a search for your desired app, then select it.
- Click Install App.
note
Sometimes this button says Add Integration.
- Click Next in the Setup Data section.
- In the Configure section of your respective app, complete the following fields.
- Field Name. If you already have collectors and sources set up, select the configured metadata field name (eg _sourcecategory) or specify other custom metadata (eg: _collector) along with its metadata Field Value.
- Click Next. You will be redirected to the Preview & Done section.
Post-installation
Once your app is installed, it will appear in your Installed Apps folder, and dashboard panels will start to fill automatically.
Each panel slowly fills with data matching the time range query received since the panel was created. Results will not immediately be available but will be updated with full graphs and charts over time.
Viewing Host Metrics dashboards
All dashboards have a set of filters that you can apply to the entire dashboard. Use these filters to drill down and examine the data to a granular level.
- You can change the time range for a dashboard or panel by selecting a predefined interval from a drop-down list, choosing a recently used time range, or specifying custom dates and times. Learn more.
- You can use template variables to drill down and examine the data on a granular level. For more information, see Filtering Dashboards with Template Variables.
- Most Next-Gen apps allow you to provide the scope at the installation time and are comprised of a key (
_sourceCategoryby default) and a default value for this key. Based on your input, the app dashboards will be parameterized with a dashboard variable, allowing you to change the dataset queried by all panels. This eliminates the need to create multiple copies of the same dashboard with different queries.
Overview
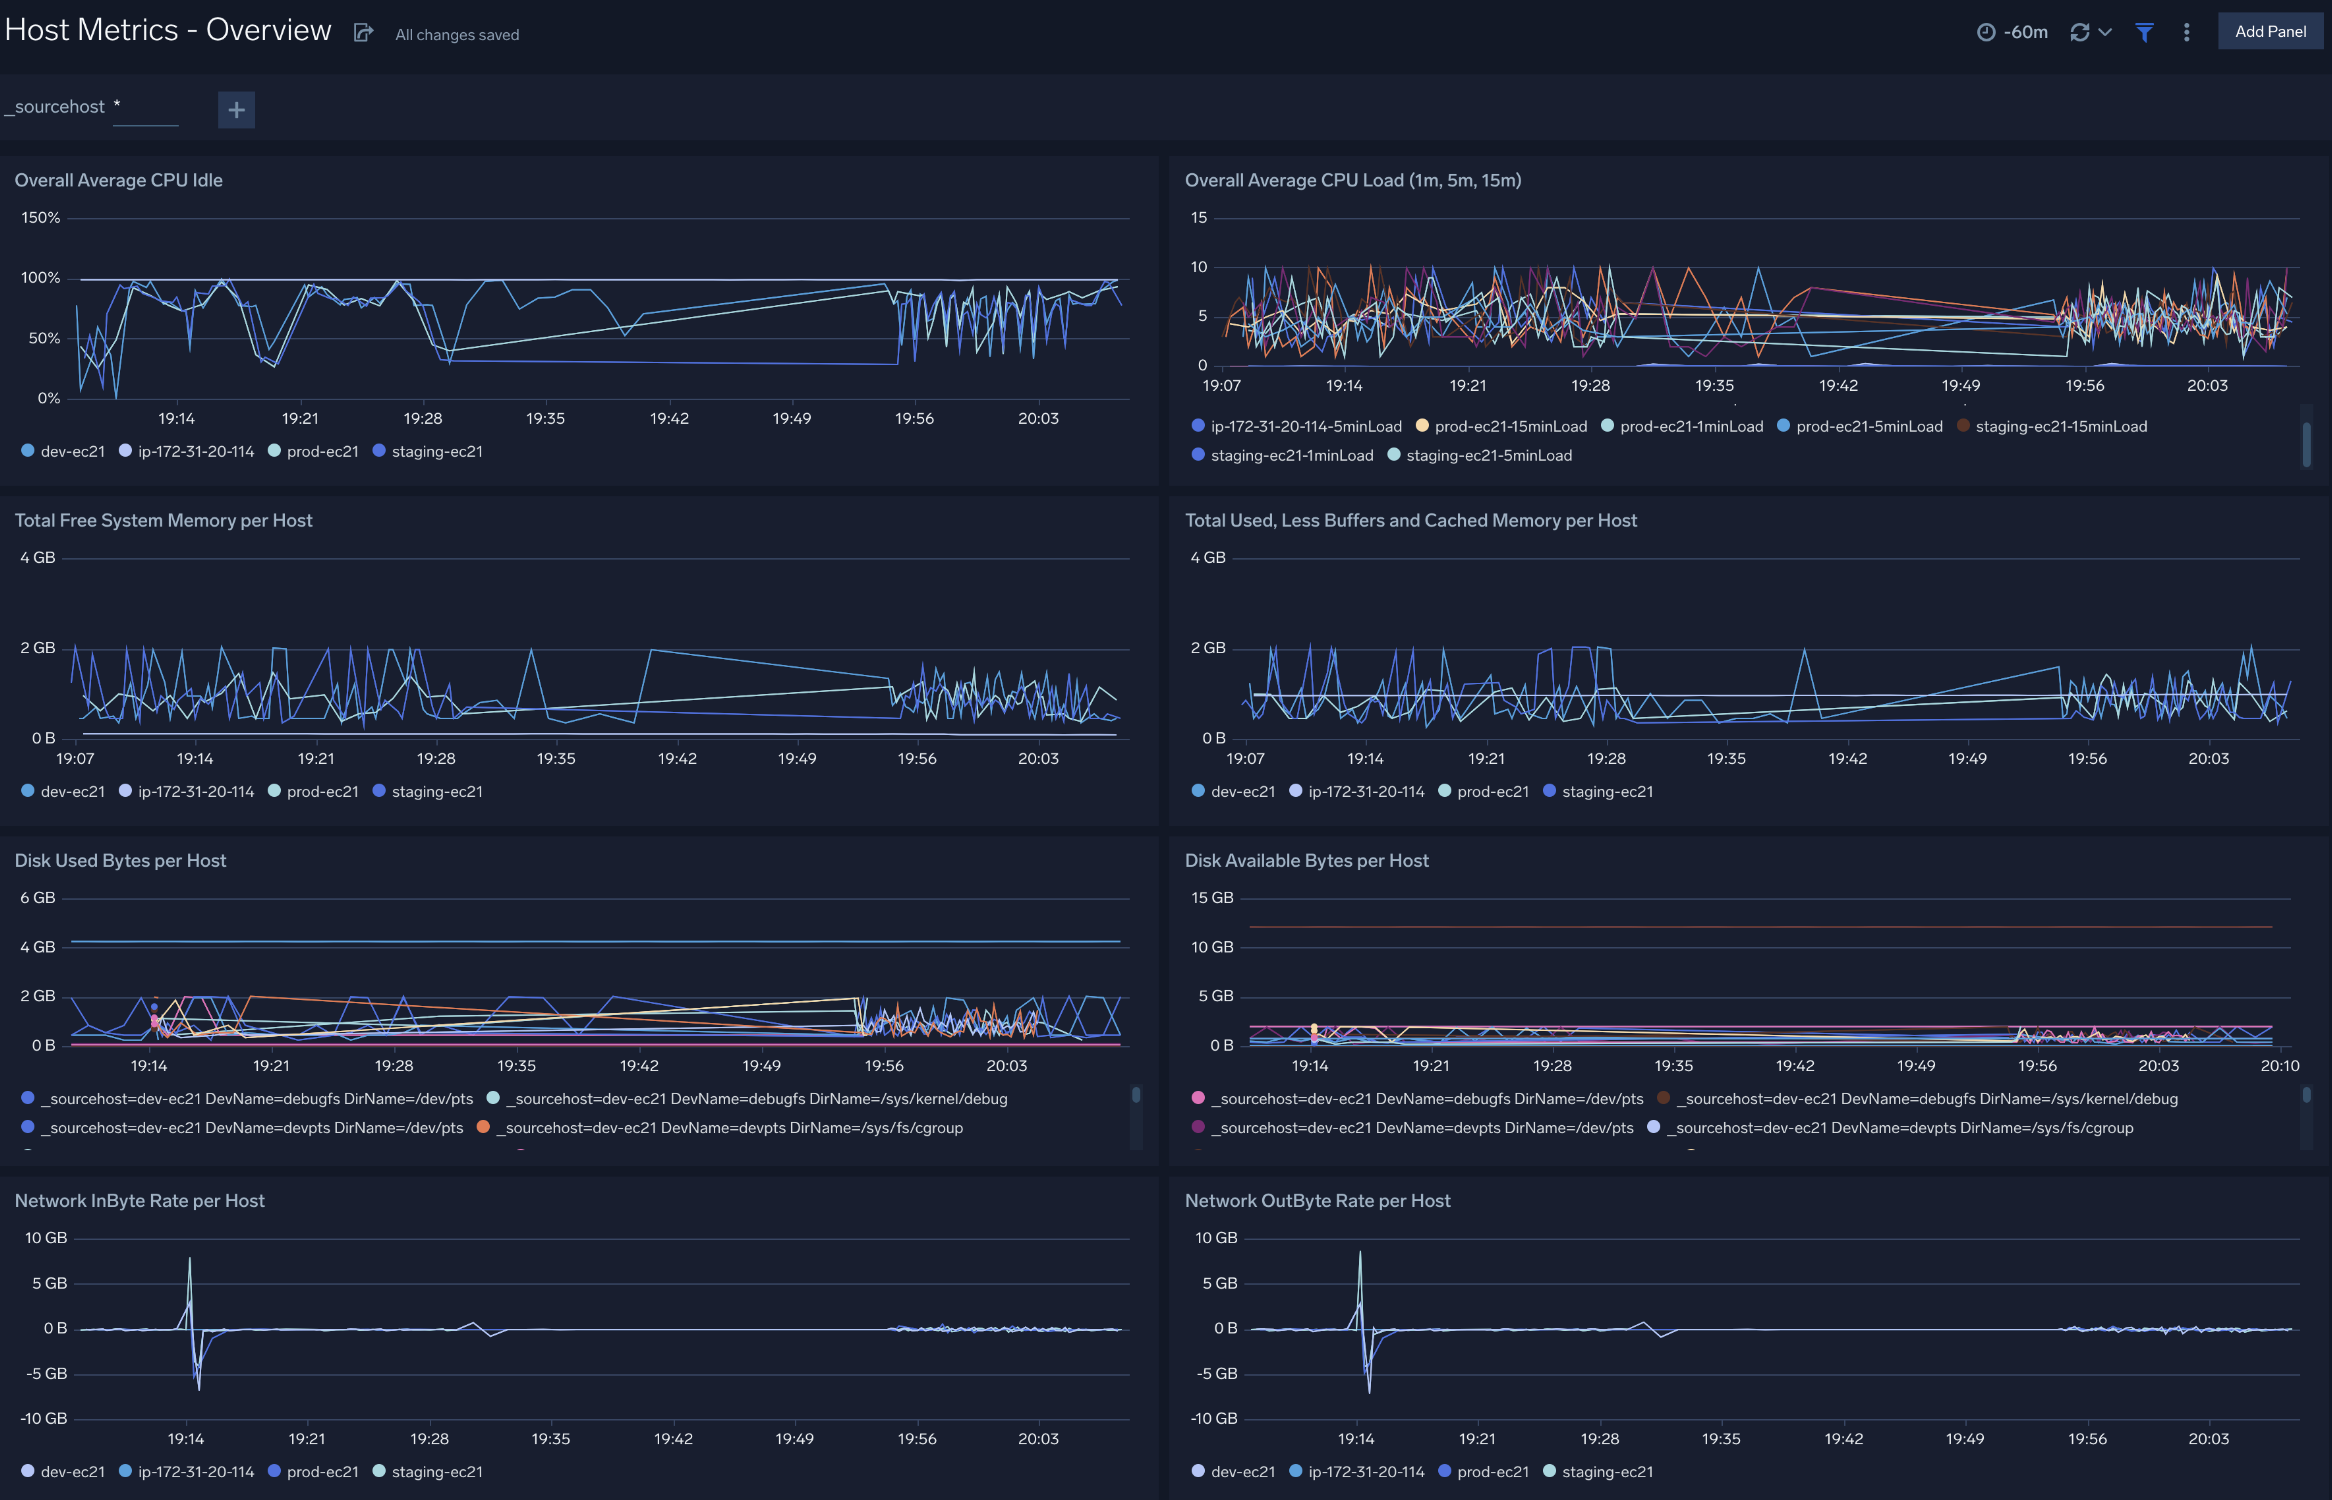
Overall Average CPU Idle. Displays the CPU idle time averaged across all hosts in a line chart on a timeline for the last hour. You can modify the list of hosts using the provided filters.
Overall Average CPU Load (1m, 5m, 15m). Shows the CPU load time for one, five, and 15 minutes averaged across all hosts in a line chart on a timeline for the last hour.
Total Free System Memory per Host. Provides information on the total free system memory per host in a line chart on a timeline for the last hour.
Total Used, Less Buffers and Cached Memory per Host. Displays the total memory used less buffers and cached memory per host in a line chart on a timeline for the last hour.
Disk Used Bytes per Host. Shows the disk used bytes per host in a line chart on a timeline for the last hour.
Disk Available Bytes per Host. Provides the disk available bytes per host in a line chart on a timeline for the last hour.
Network InBytes Rate per Host. Displays the rate of network InBytes per host in a line chart on a timeline for the last hour.
Network OutBytes Rate per Host. Shows the rate of network OutBytes per host in a line chart on a timeline for the last hour.
CPU
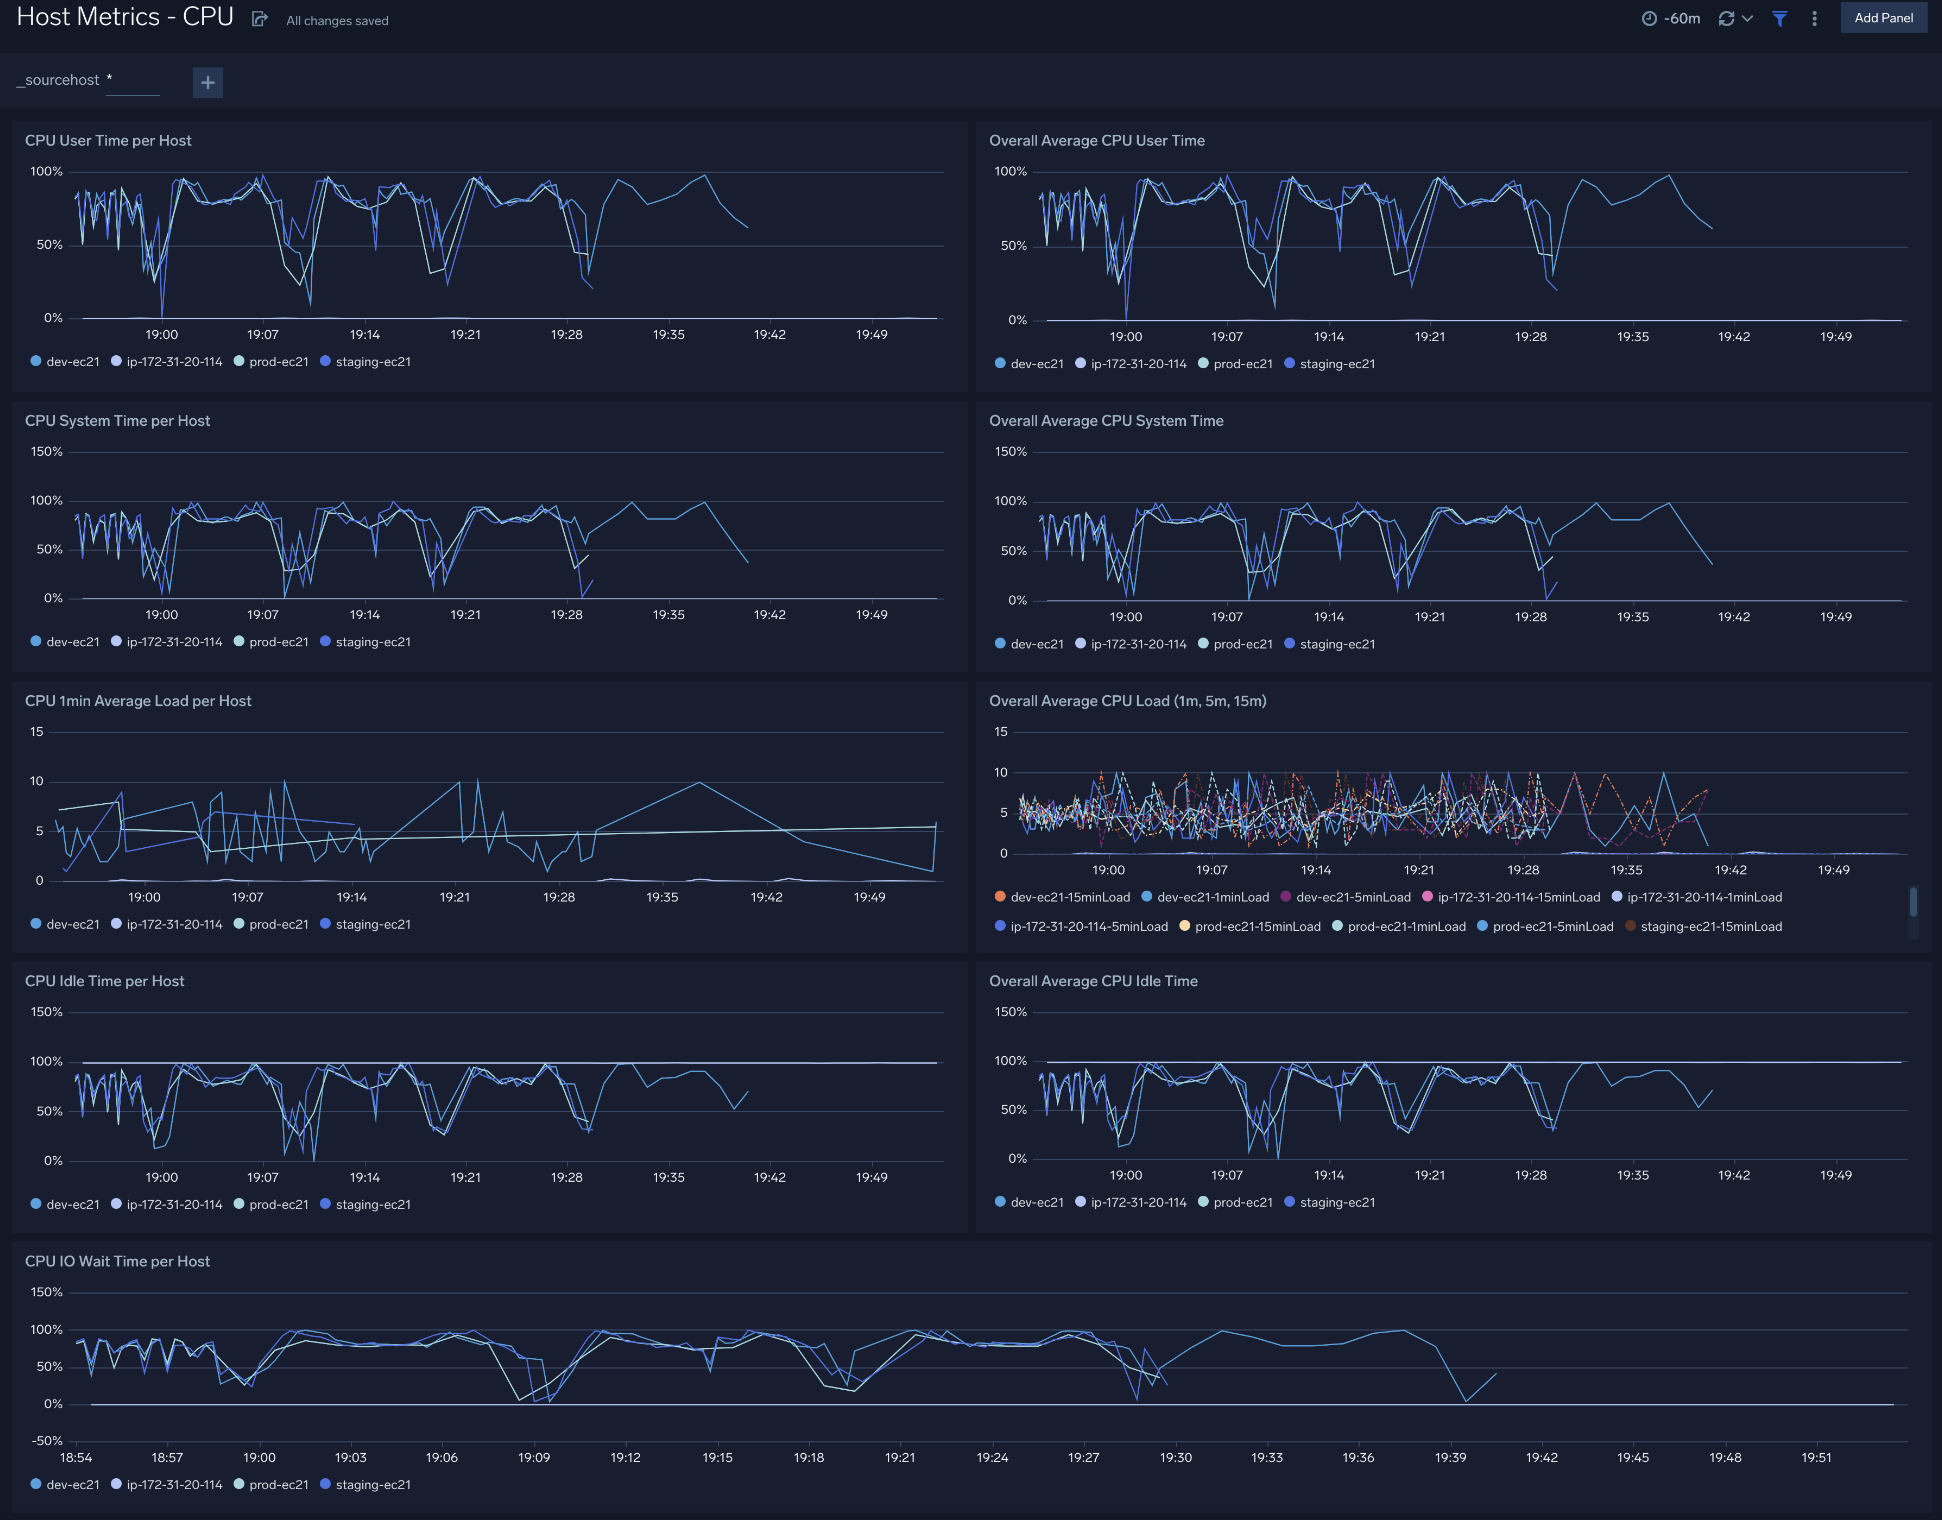
CPU User Time per Host. Displays the CPU user time per host in a line chart on a timeline for the last hour.
Overall Average CPU User Time. Shows the CPU user time averaged across all hosts in a line chart on a timeline for the last hour.
CPU System Time per Host. Provides details on CPU system time per host in a line chart on a timeline for the last hour.
Overall Average CPU System Time. Displays the CPU system time averaged across all hosts in a line chart on a timeline for the last hour.
CPU 1 min Average Load per Host. Shows the CPU 1 minute average load per host in a line chart on a timeline for the last hour.
Overall Average CPU Load (1m, 5m, 15m). Provides the CPU load time for one, five, and 15 minutes averaged across all hosts in a line chart on a timeline for the last hour.
CPU Idle Time per Host. Displays the CPU idle time per host in a line chart on a timeline for the last hour.
Overall Average CPU Idle Time. Shows the CPU idle time averaged across all hosts in a line chart on a timeline for the last hour.
CPU IO Wait Time per Host. Displays the CPU IO wait time per host on a line chart on a timeline for the last hour
Disk
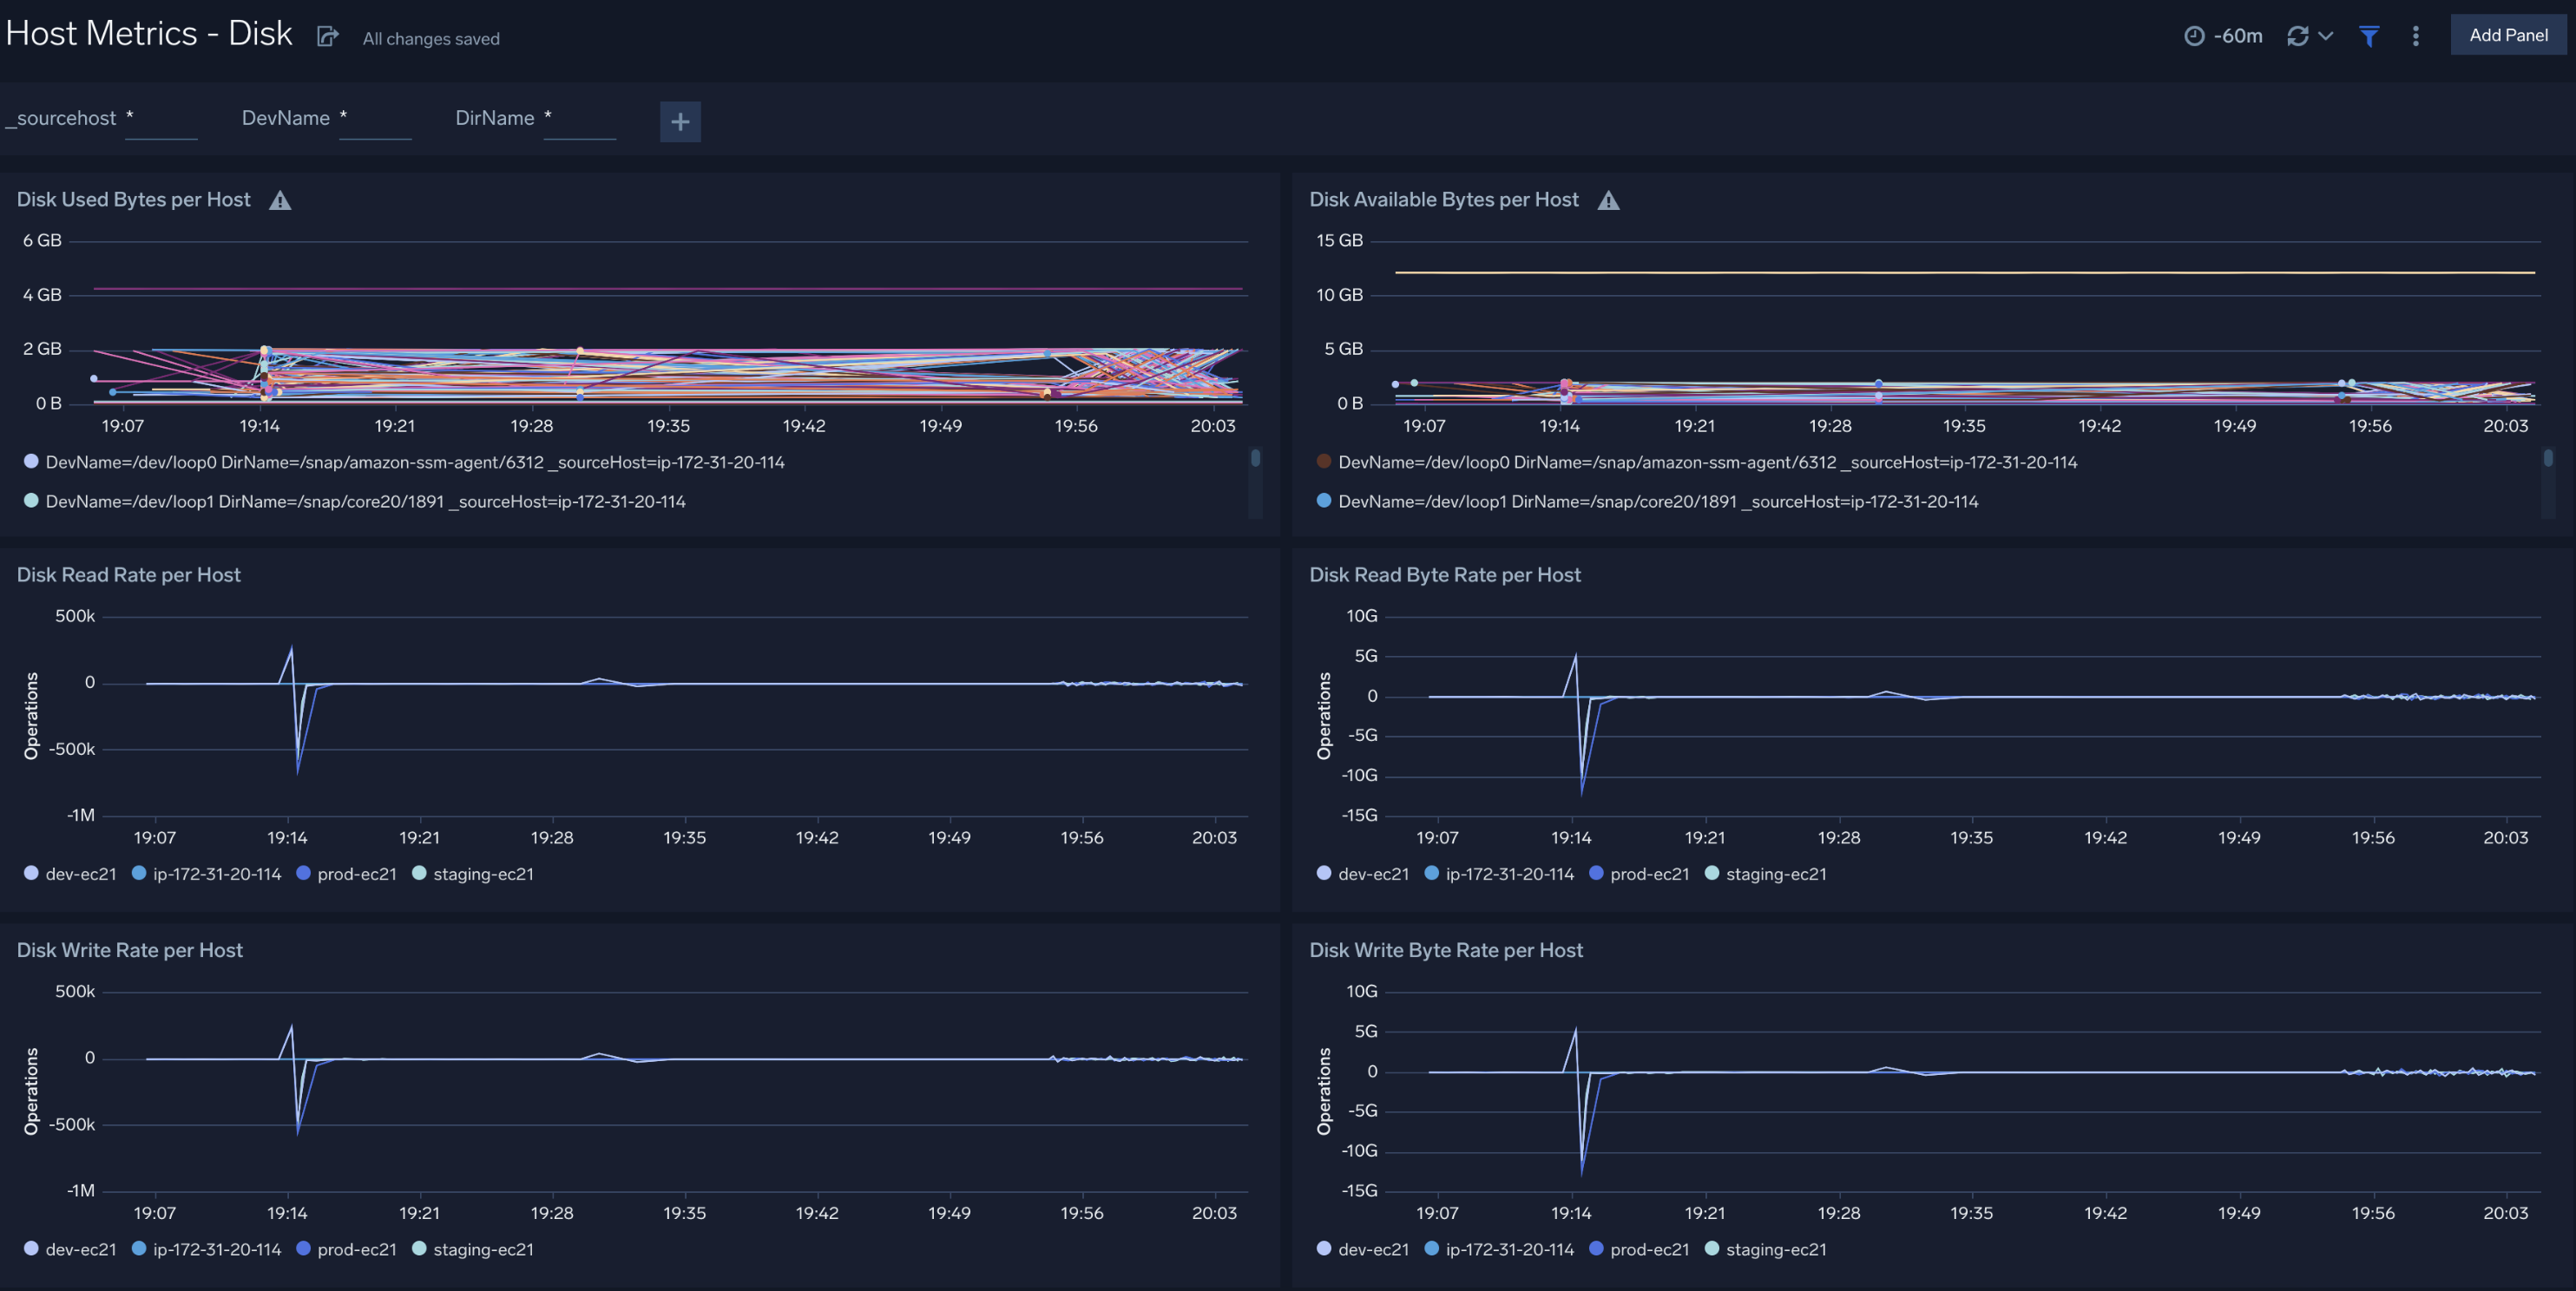
Disk Used Bytes per Host. Displays disk used bytes per host in a line chart on a timeline for the last hour.
Disk Available Bytes per Host. Shows disk available bytes per host in a line chart on a timeline for the last hour.
Disk Read Rate per Host. Provides details on disk read rate per host in a line chart on a timeline for the last hour.
Disk Read Byte Rate per Host. Displays disk read byte rate per host in a line chart on a timeline for the last hour.
Disk Write Rate per Host. Shows disk write rate per host in a line chart on a timeline for the last hour.
Disk Write Byte Rate per Host. Provides details on disk write byte rate per host in a line chart on a timeline for the last hour.
Memory
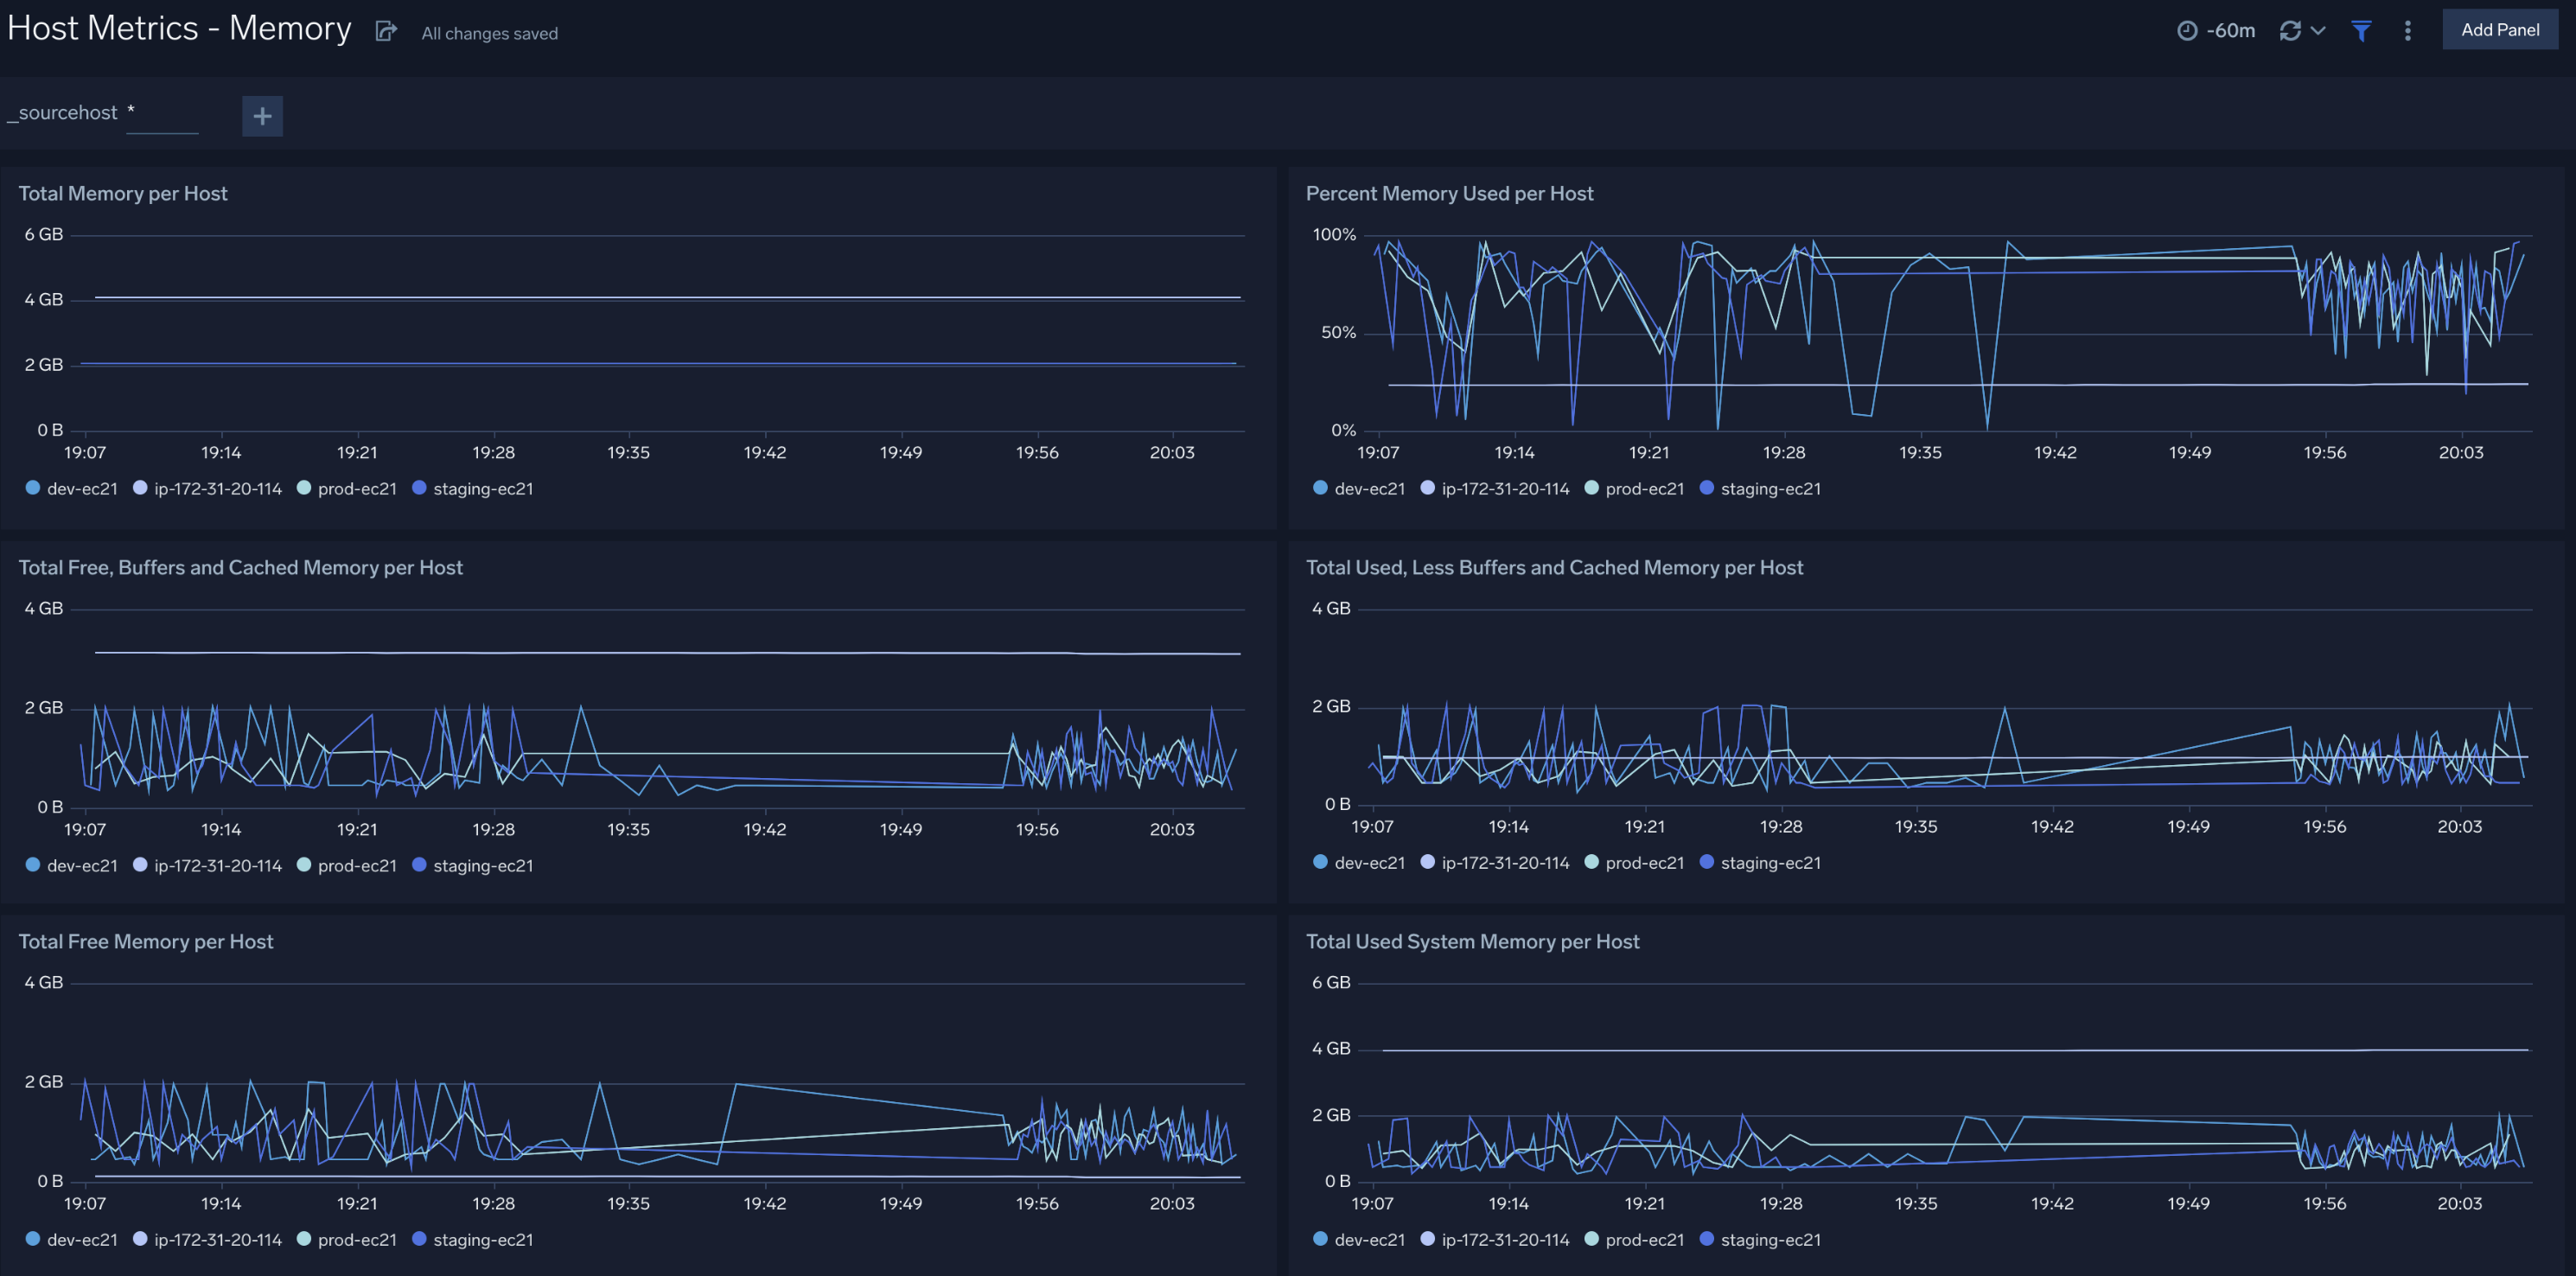
Total Memory per Host. Displays total memory per host in a line chart on a timeline for the last hour.
Percent Memory Used per Host. Shows percent memory used per host in a line chart on a timeline for the last hour.
Total Free, Buffers, and Cached Memory per Host. Provides details on the total free, buffers, and cached memory per host (from a metric called ActualFree) in a line chart on a timeline for the last hour.
Total Used, Less Buffers, and Cached Memory per Host. Displays the total used, buffers, and cached memory (from a metric called ActualUsed) in a line chart on a timeline for the last hour.
Total Free Memory per Host. Shows the amount of total free memory per host available in a line chart on a timeline for the last hour.
Total Used System Memory per Host. Provides details on the total system memory per host used in a line chart on a timeline for the last hour.
Network
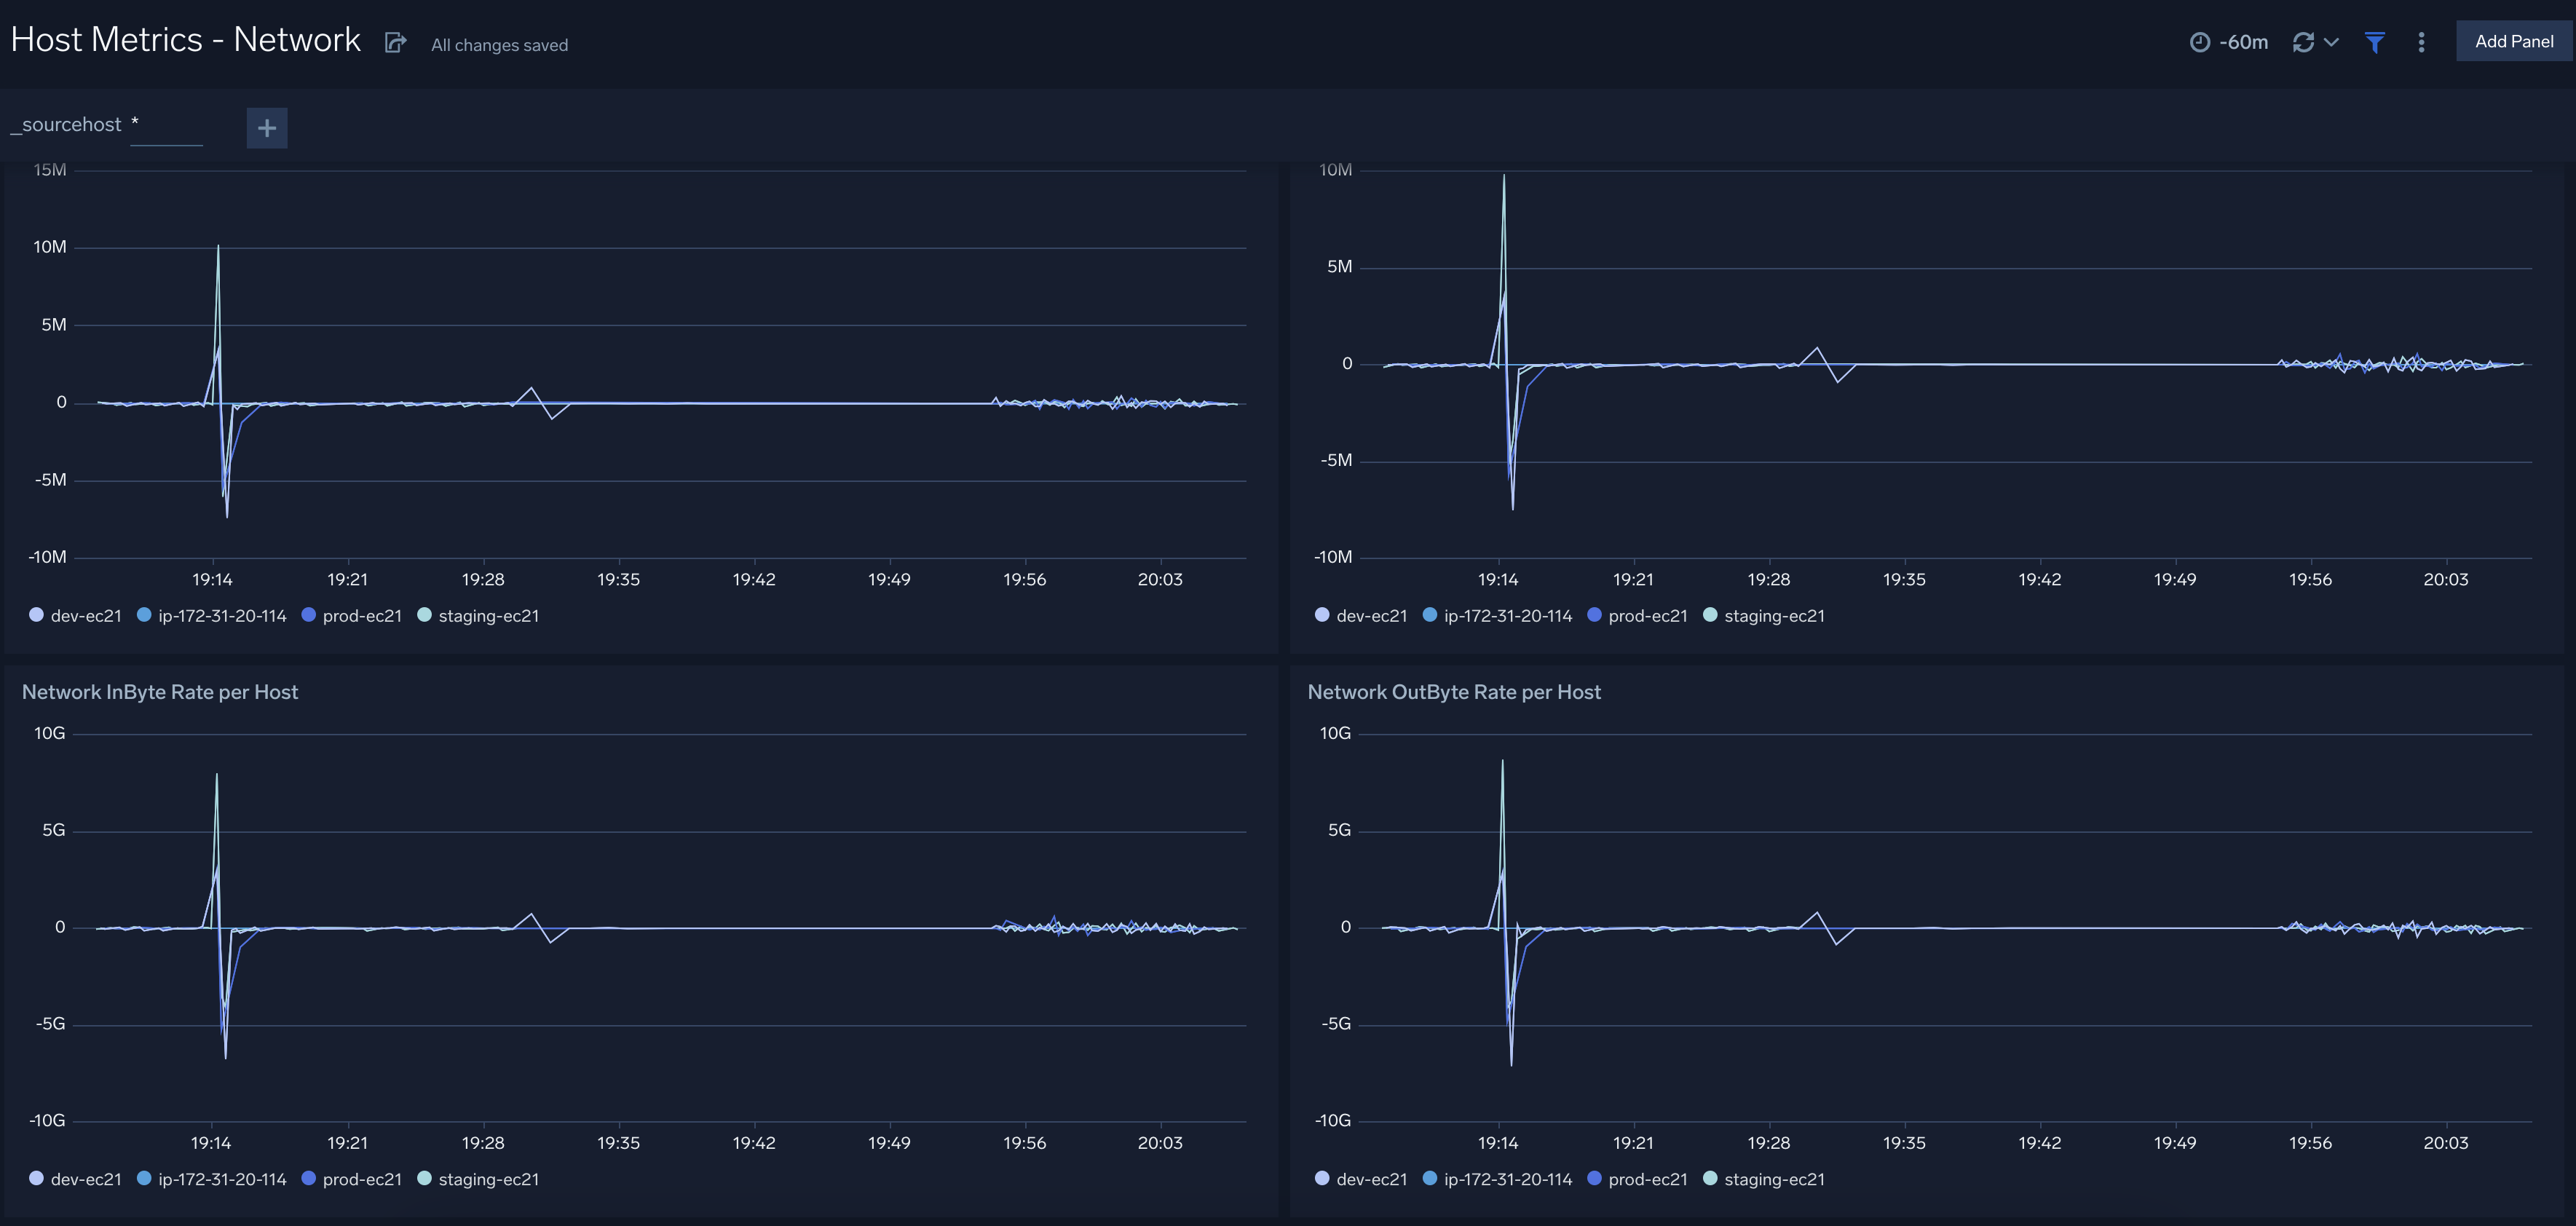
Network InPacket Rate per Host. Displays network InPacket rate per host in a line chart on a timeline for the last hour.
Network OutPacket Rate per Host. Shows network OutPacket rate per host in a line chart on a timeline for the last hour.
Network InByte Rate per Host. Provides details on network InByte rate per host in a line chart on a timeline for the last hour.
Network OutByte Rate per Host. Displays network OutByte rate per host in a line chart on a timeline for the last hour.
TCP
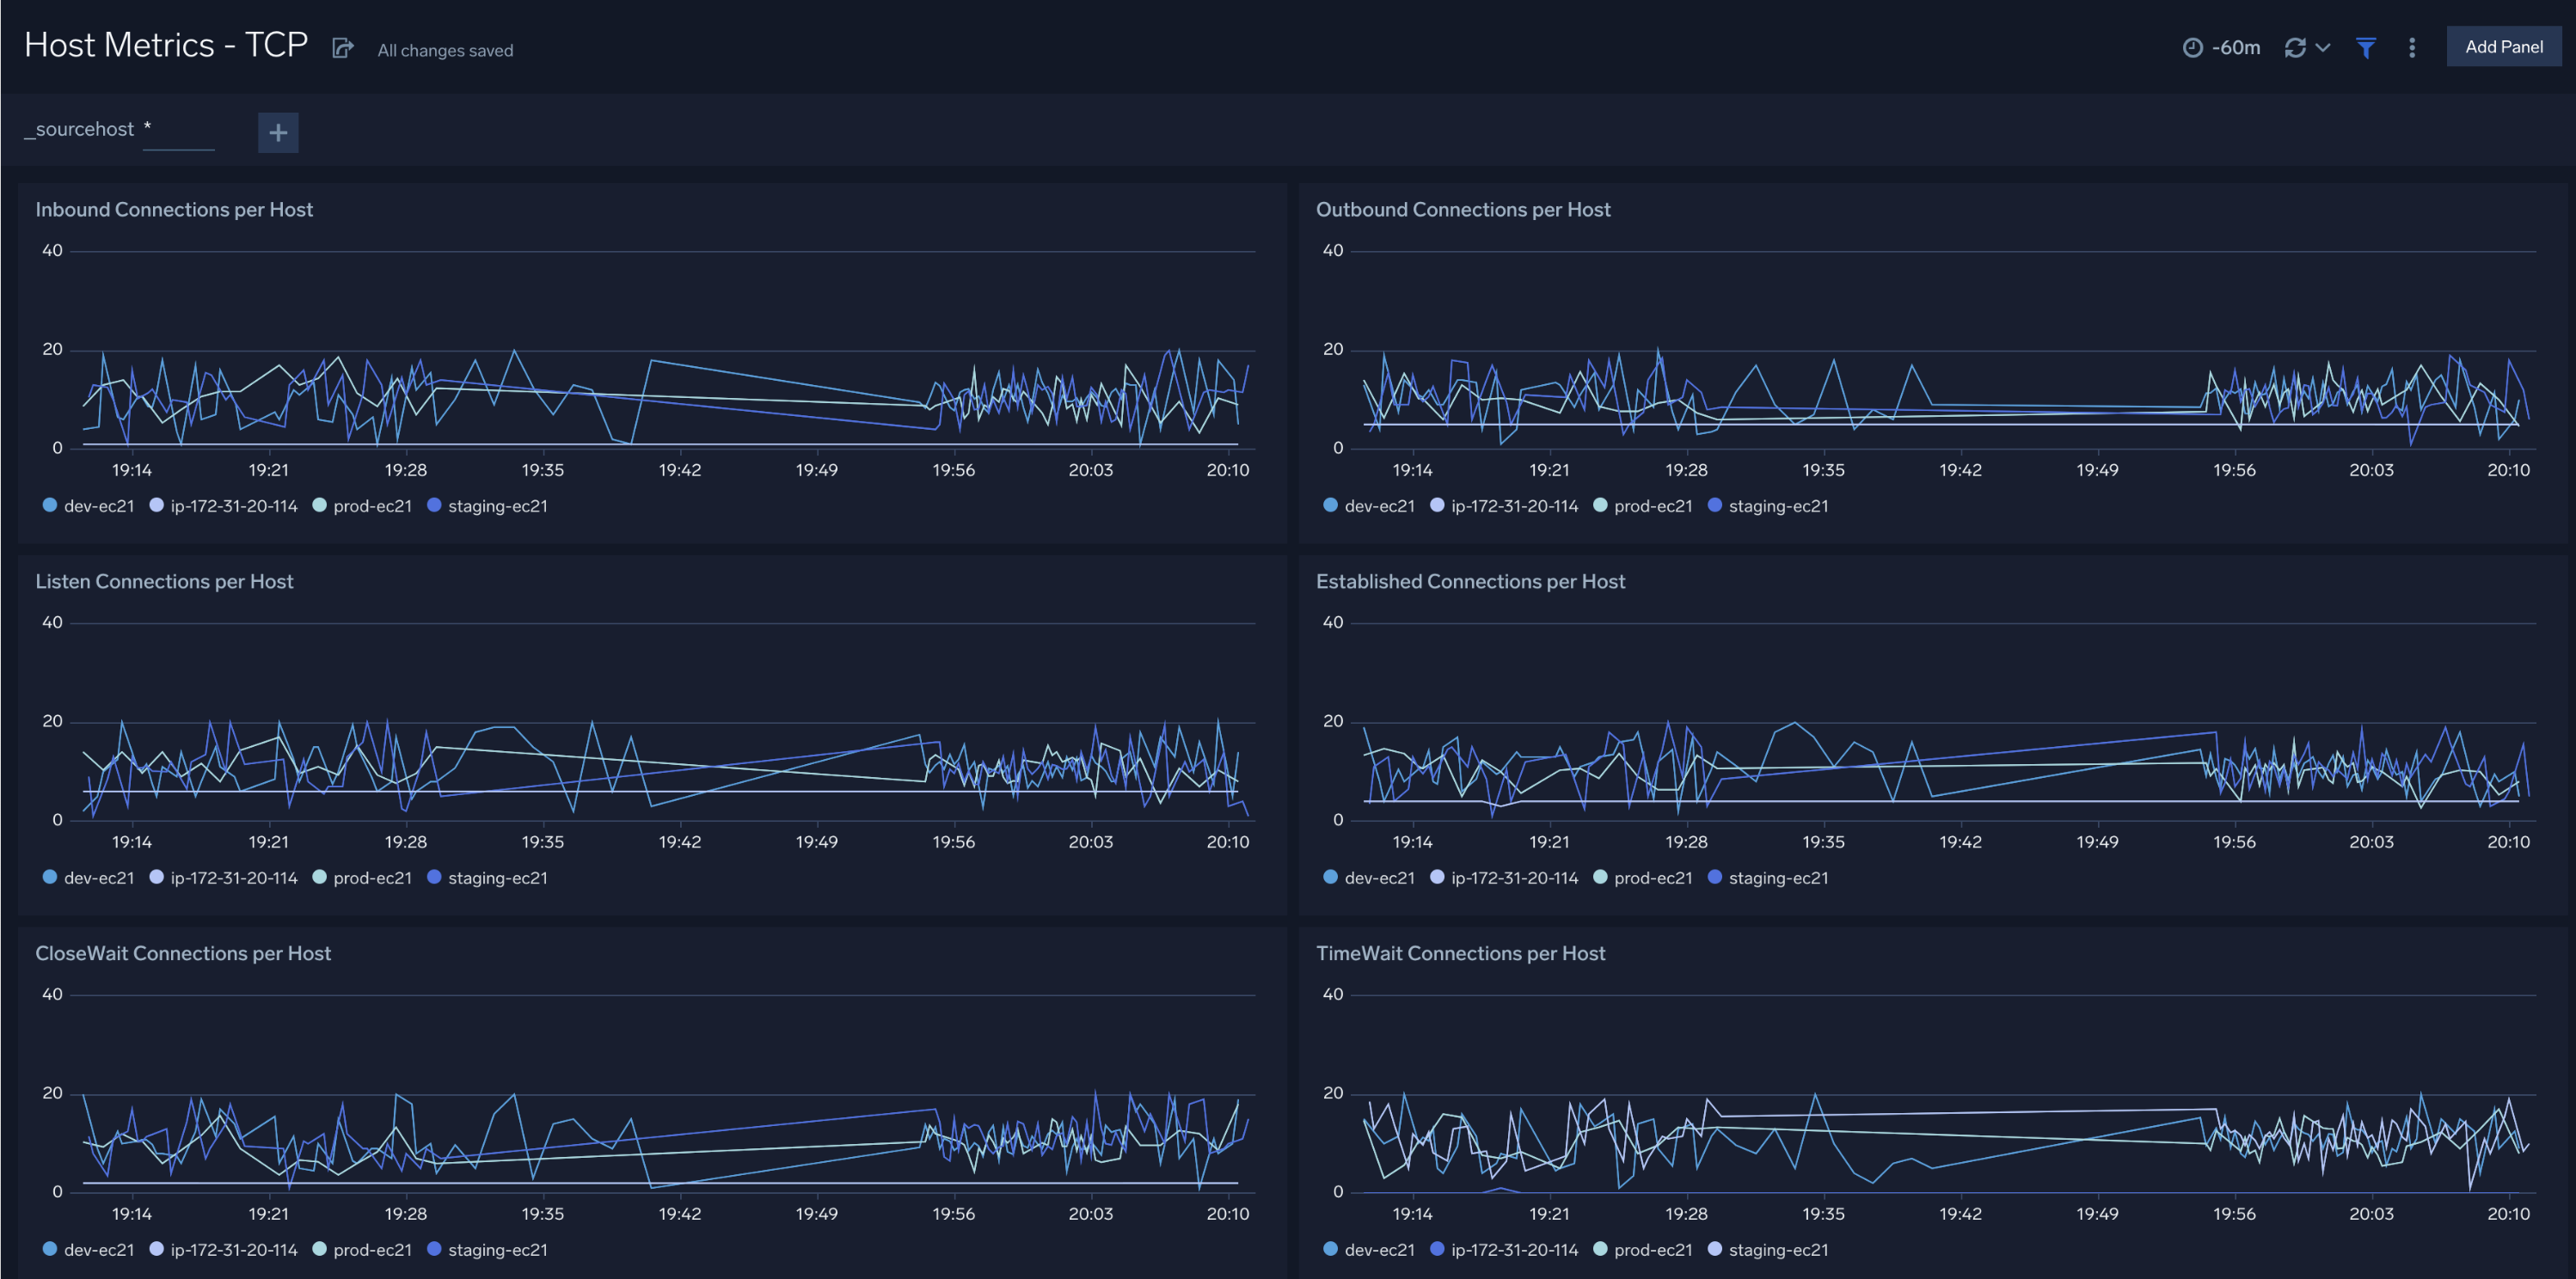
Inbound Connections per Host. Displays inbound connections per host in a line chart on a timeline for the last hour.
Outbound Connections per Host. Shows outbound connections per host in a line chart on a timeline for the last hour.
Listen Connections per Host. Provides details on listen connections per host in a line chart on a timeline for the last hour.
Established Connections per Host. Displays established connections per host in a line chart on a timeline for the last hour.
CloseWait Connections per Host. Shows CloseWait connections per host in a line chart on a timeline for the last hour.
TimeWait Connections per Host. Provides details on TimeWait connections per host in a line chart on a timeline for the last hour.
Filters
The supported filters are:
_sourceCategory_sourceHost_source_collector
Create monitors for Host Metrics app
From your App Catalog:
- From the Sumo Logic navigation, select App Catalog.
- In the Search Apps field, search for and then select your app.
- Make sure the app is installed.
- Navigate to What's Included tab and scroll down to the Monitors section.
- Click Create next to the pre-configured monitors. In the create monitors window, adjust the trigger conditions and notifications settings based on your requirements.
- Scroll down to Monitor Details.
- Under Location click on New Folder.
note
By default, monitor will be saved in the root folder. So to make the maintenance easier, create a new folder in the location of your choice.
- Enter Folder Name. Folder Description is optional.
tip
Using app version in the folder name will be helpful to determine the versioning for future updates.
- Click Create. Once the folder is created, click on Save.
Host Metrics alerts
| Name | Description | Trigger Type (Critical / Warning / MissingData) | Alert Condition |
|---|---|---|---|
Host Metrics - Excessive Disk IO | This alert is triggered when disk read throughput is unusually high, indicating potential disk I/O saturation. | Critical, Warning | Critical: Disk read rate > 500 MB/s; Warning: Disk read rate > 200 MB/s |
Host Metrics - High CPU IO Wait | This alert is triggered when CPU IO wait time is high, indicating I/O bottlenecks that are stalling CPU execution. | Critical, Warning | Critical: CPU IO wait > 50%; Warning: CPU IO wait > 30% |
Host Metrics - High CPU Usage | This alert is triggered when CPU idle time drops below safe thresholds, indicating high CPU utilization. | Critical, Warning | Critical: CPU idle ≤ 5%; Warning: CPU idle ≤ 20% |
Host Metrics - High Disk Queue | This alert is triggered when the disk queue depth is high, indicating disk I/O saturation. | Critical, Warning | Critical: Disk queue > 10; Warning: Disk queue > 5 |
Host Metrics - High Disk Usage | This alert is triggered when disk space utilization exceeds safe levels, indicating the filesystem is running low on space. | Critical, Warning | Critical: Disk used > 95%; Warning: Disk used > 85% |
Host Metrics - High Memory Usage | This alert is triggered when memory utilization exceeds safe levels, indicating the host may be under memory pressure. | Critical, Warning | Critical: Memory used > 95%; Warning: Memory used > 85% |
Host Metrics - High Network Inbound | This alert is triggered when inbound network traffic is unusually high, indicating potential network saturation or an inbound traffic spike. | Critical, Warning | Critical: Inbound > 125 MB/s; Warning: Inbound > 62.5 MB/s |
Host Metrics - High Network Outbound | This alert is triggered when outbound network traffic is unusually high, indicating potential network saturation or an outbound traffic spike. | Critical, Warning | Critical: Outbound > 125 MB/s; Warning: Outbound > 62.5 MB/s |
Host Metrics - Low Free Memory | This alert is triggered when actual free memory (including buffers and cached) is critically low, indicating the host is nearly out of usable memory. | Critical, Warning | Critical: Free memory < 256 MB; Warning: Free memory < 512 MB |
Host Metrics - TCP Close_Wait Accumulation | This alert is triggered when a high number of TCP connections are stuck in CLOSE_WAIT state, indicating the application is not closing sockets properly. | Critical, Warning | Critical: CloseWait connections > 500; Warning: CloseWait connections > 200 |
Host Metrics - TCP Time_Wait Saturation | This alert is triggered when there are too many TCP connections in TIME_WAIT state, indicating potential port exhaustion from rapidly cycling connections. | Critical, Warning | Critical: TimeWait connections > 10,000; Warning: TimeWait connections > 5,000 |
Host Metrics - Unusual Connection Count | This alert is triggered when the number of established TCP connections spikes abnormally, indicating unusual traffic patterns or a potential attack. | Critical, Warning | Critical: Established connections > 5,000; Warning: Established connections > 2,000 |
Upgrade/Downgrade the Host Metrics app (Optional)
To update the app, do the following:
Next-Gen App: To install or update the app, you must be an account administrator or a user with Manage Apps, Manage Monitors, Manage Fields, Manage Metric Rules, and Manage Collectors capabilities depending upon the different content types part of the app.
- Select App Catalog.
- In the Search Apps field, search for and then select your app.
Optionally, you can identify apps that can be upgraded in the Upgrade available section. - To upgrade the app, select Upgrade from the Manage dropdown.
- If the upgrade does not have any configuration or property changes, you will be redirected to the Preview & Done section.
- If the upgrade has any configuration or property changes, you will be redirected to the Setup Data page.
- In the Configure section of your respective app, complete the following fields.
- Field Name. If you already have collectors and sources set up, select the configured metadata field name (eg _sourcecategory) or specify other custom metadata (eg: _collector) along with its metadata Field Value.
- Click Next. You will be redirected to the Preview & Done section.
Post-update
Your upgraded app will be installed in the Installed Apps folder and dashboard panels will start to fill automatically.
See our Release Notes changelog for new updates in the app.
To revert the app to a previous version, do the following:
- Select App Catalog.
- In the Search Apps field, search for and then select your app.
- To version down the app, select Revert to < previous version of your app > from the Manage dropdown.
Uninstalling the Host Metrics app (Optional)
To uninstall the app, do the following:
- Select App Catalog.
- In the 🔎 Search Apps field, run a search for your desired app, then select it.
- Click Uninstall.