 Meet the new
 Host and Process Metrics

The Sumo Logic app for Host and Process Metrics allows you to monitor the performance and resource utilization of hosts and processes that your mission critical applications are dependent upon. Preconfigured dashboards provide insight into CPU, memory, network, file descriptors, page faults, and TCP connectors. This app uses Telegraf, an open-source, plugin-based collector for the collection of both host and process metrics data.
This app uses Telegraf and associated input plugins to collect both host and process metrics. To use the installed collector to collect and analyze host metrics, please see the Host Metrics app.
This app has been validated on Linux(Ubuntu 20.04.2 LTS) and Windows (Microsoft Windows Server 2019) and higher using Telegraf 1.18.2. This app is not recommended in Kubernetes environments; instead please use the Kubernetes app.
Collecting metrics for Host and Processes
We use the Telegraf agent for Host and Process metrics collection. Telegraf runs on the same system and uses the input plugins to obtain host and process metrics, and the Sumo Logic output plugin to send the metrics to Sumo Logic.
The following input plugins are used by Sumo Logic:
For Linux:
For Windows:
Configuring metrics collection
This section provides instructions for configuring metrics collection for the Sumo Logic app for Host and Process metrics. Follow the below instructions to set up the metric collection for a given machine:
- Configure a Hosted Collector. To create a new Sumo Logic hosted collector, perform the steps in the Configure a Hosted Collector section of the Sumo Logic documentation.
- Configure an HTTP Logs and Metrics Source. Create a new HTTP Logs and Metrics Source in the hosted collector created above by following these instructions. Suggestions for setting your source category:
- For identifying a specific cluster or a group of hosts:
<clustername>/metrics - For identifying a group of hosts within a given deployment:
<environment name>/<clustername>/metrics. Make a note of the HTTP Source URL and source category.
- For identifying a specific cluster or a group of hosts:
- Install Telegraf. Use the following steps to install Telegraf on each host machine.
- Configure and start Telegraf. As part of collecting metrics data from Telegraf, we will use the input plugins (described earlier) to get data from Telegraf and the Sumo Logic output plugin to send data to Sumo Logic.
- Create or modify telegraf.conf (in linux it’s located in
/etc/telegraf/telegraf.d/and on Windows, it’s located inC:\Program Files\InfluxData\Telegraf\). Copy and paste the inputs, outputs and processors section from one of the below files.- for Linux - linux_sample_telegraf.conf
- for Windows: windows_sample_telegraf.conf
- Enter values for the following parameters (marked with
CHANGE_ME) in the downloaded file:- In the output plugins section which is
[[outputs.sumologic]]:- URL - This is the HTTP source URL created in step 3. Please see this doc for more information on additional parameters for configuring the Sumo Logic Telegraf output plugin.
- Do not modify the following values set by this Telegraf configuration as it will cause the Sumo Logic app to not function correctly.
- data_format = “carbon2” In the output plugins section, which is
[[outputs.sumologic]], This indicates that metrics should be sent in the carbon2 format to Sumo Logic.
- data_format = “carbon2” In the output plugins section, which is
- For other optional parameters refer to the respective plugin documentation listed here for configuring the input plugins for Telegraf.
- For all other parameters, see this doc for more parameters that can be configured in the Telegraf agent globally.
- In the output plugins section which is
- Create or modify telegraf.conf (in linux it’s located in
Once you have finalized your telegraf.conf file, you can start or reload the telegraf service using instructions from the doc.
At this point, host and process metrics should start flowing into Sumo Logic.
See Telegraf’s Metric filtering capabilities to exclude metrics that you do not need from being sent to Sumo Logic.
Monitoring processes with certain pattern
exe. Selects the processes that have process names that match the string that you specify
pattern. Selects the processes that have command lines (including parameters and options used with the command) matching the specified string using regular expression matching rules.
For Linux
On Linux servers, the strings that you specify in an exe or pattern section are evaluated as regular expressions.
Example: For filtering executable name containing nginx (i.e., pgrep <exe>)
[[inputs.procstat]]
    pid_tag=false
    exe = "nginx"
Example: For filtering command lines containing config (i.e., pgrep -f <pattern>)
[[inputs.procstat]]
    pid_tag=false
        pattern = "config"
For Windows
On servers running Windows Server, these strings are evaluated as WMI queries. (Ex pattern: "%apache%"). For more information, see LIKE Operator.
Example: For filtering executable name containing nginx.
[[inputs.procstat]]
    pid_finder = "native"
    pid_tag=false
    exe = "%nginx%"
Example: For filtering command lines containing config.
[[inputs.procstat]]
    pid_finder = "native"
    pid_tag=false
    pattern = "%config%"
Example: For defining multiple patterns for multiple processes you can use the plugin multiple times.
[[inputs.procstat]]
   pid_tag=false
   exe = "nginx"

[[inputs.procstat]]
   exe = "tomcat"
   pid_tag=false
Troubleshooting
- To identify the operating system version and name.
- For Windows machines, run the command in PowerShell to get the OS Version.
[System.Environment]::OSVersion.Version(Get-WmiObject -class Win32_OperatingSystem).Caption
- For Linux, run below command in terminal.
uname -alsb_release -a
- For Windows machines, run the command in PowerShell to get the OS Version.
- To enable debug logs, set
“debug = true”flag in telegraf.conf and run the command, it will output error in stdout.telegraf --config telegraf.conf --test - If the telegraf conf changes are not reflecting, make sure to restart Telegraf using the command
- Windows:
./telegraf.exe --service restart - Linux:
sudo service telegraf restart
- Windows:
- If certain metrics are not coming you may have to run the telegraf agent as root. Check the respective plugin documentation listed here for more information.
Sample queries
CPU Utilization by Host panel in Host and Process Metrics - CPU Dashboard
host.name=* cpu=cpu-total metric=(host_cpu_usage_user OR host_cpu_usage_system OR host_cpu_usage_iowait OR host_cpu_usage_steal OR host_cpu_usage_softirq OR host_cpu_usage_irq OR host_cpu_usage_nice) | sum by host.name
CPU Usage panel in Host and Process Metrics - Process Details Dashboard
metric=procstat_cpu_usage host.name=* process.executable.name=* | avg by host.name, process.executable.name | outlier
Installing the Host and Process Metrics app
To install the app, do the following:
Next-Gen App: To install or update the app, you must be an account administrator or a user with Manage Apps, Manage Monitors, Manage Fields, Manage Metric Rules, and Manage Collectors capabilities depending upon the different content types part of the app.
- Select App Catalog.
- In the 🔎 Search Apps field, run a search for your desired app, then select it.
- Click Install App.
note
Sometimes this button says Add Integration.
- Click Next in the Setup Data section.
- In the Configure section of your respective app, complete the following fields.
- Field Name. If you already have collectors and sources set up, select the configured metadata field name (eg _sourcecategory) or specify other custom metadata (eg: _collector) along with its metadata Field Value.
- Click Next. You will be redirected to the Preview & Done section.
Post-installation
Once your app is installed, it will appear in your Installed Apps folder, and dashboard panels will start to fill automatically.
Each panel slowly fills with data matching the time range query received since the panel was created. Results will not immediately be available but will be updated with full graphs and charts over time.
Viewing Host and Process Metrics dashboards
All dashboards have a set of filters that you can apply to the entire dashboard. Use these filters to drill down and examine the data to a granular level.
- You can change the time range for a dashboard or panel by selecting a predefined interval from a drop-down list, choosing a recently used time range, or specifying custom dates and times. Learn more.
- You can use template variables to drill down and examine the data on a granular level. For more information, see Filtering Dashboards with Template Variables.
- Most Next-Gen apps allow you to provide the scope at the installation time and are comprised of a key (
_sourceCategoryby default) and a default value for this key. Based on your input, the app dashboards will be parameterized with a dashboard variable, allowing you to change the dataset queried by all panels. This eliminates the need to create multiple copies of the same dashboard with different queries.
Overview
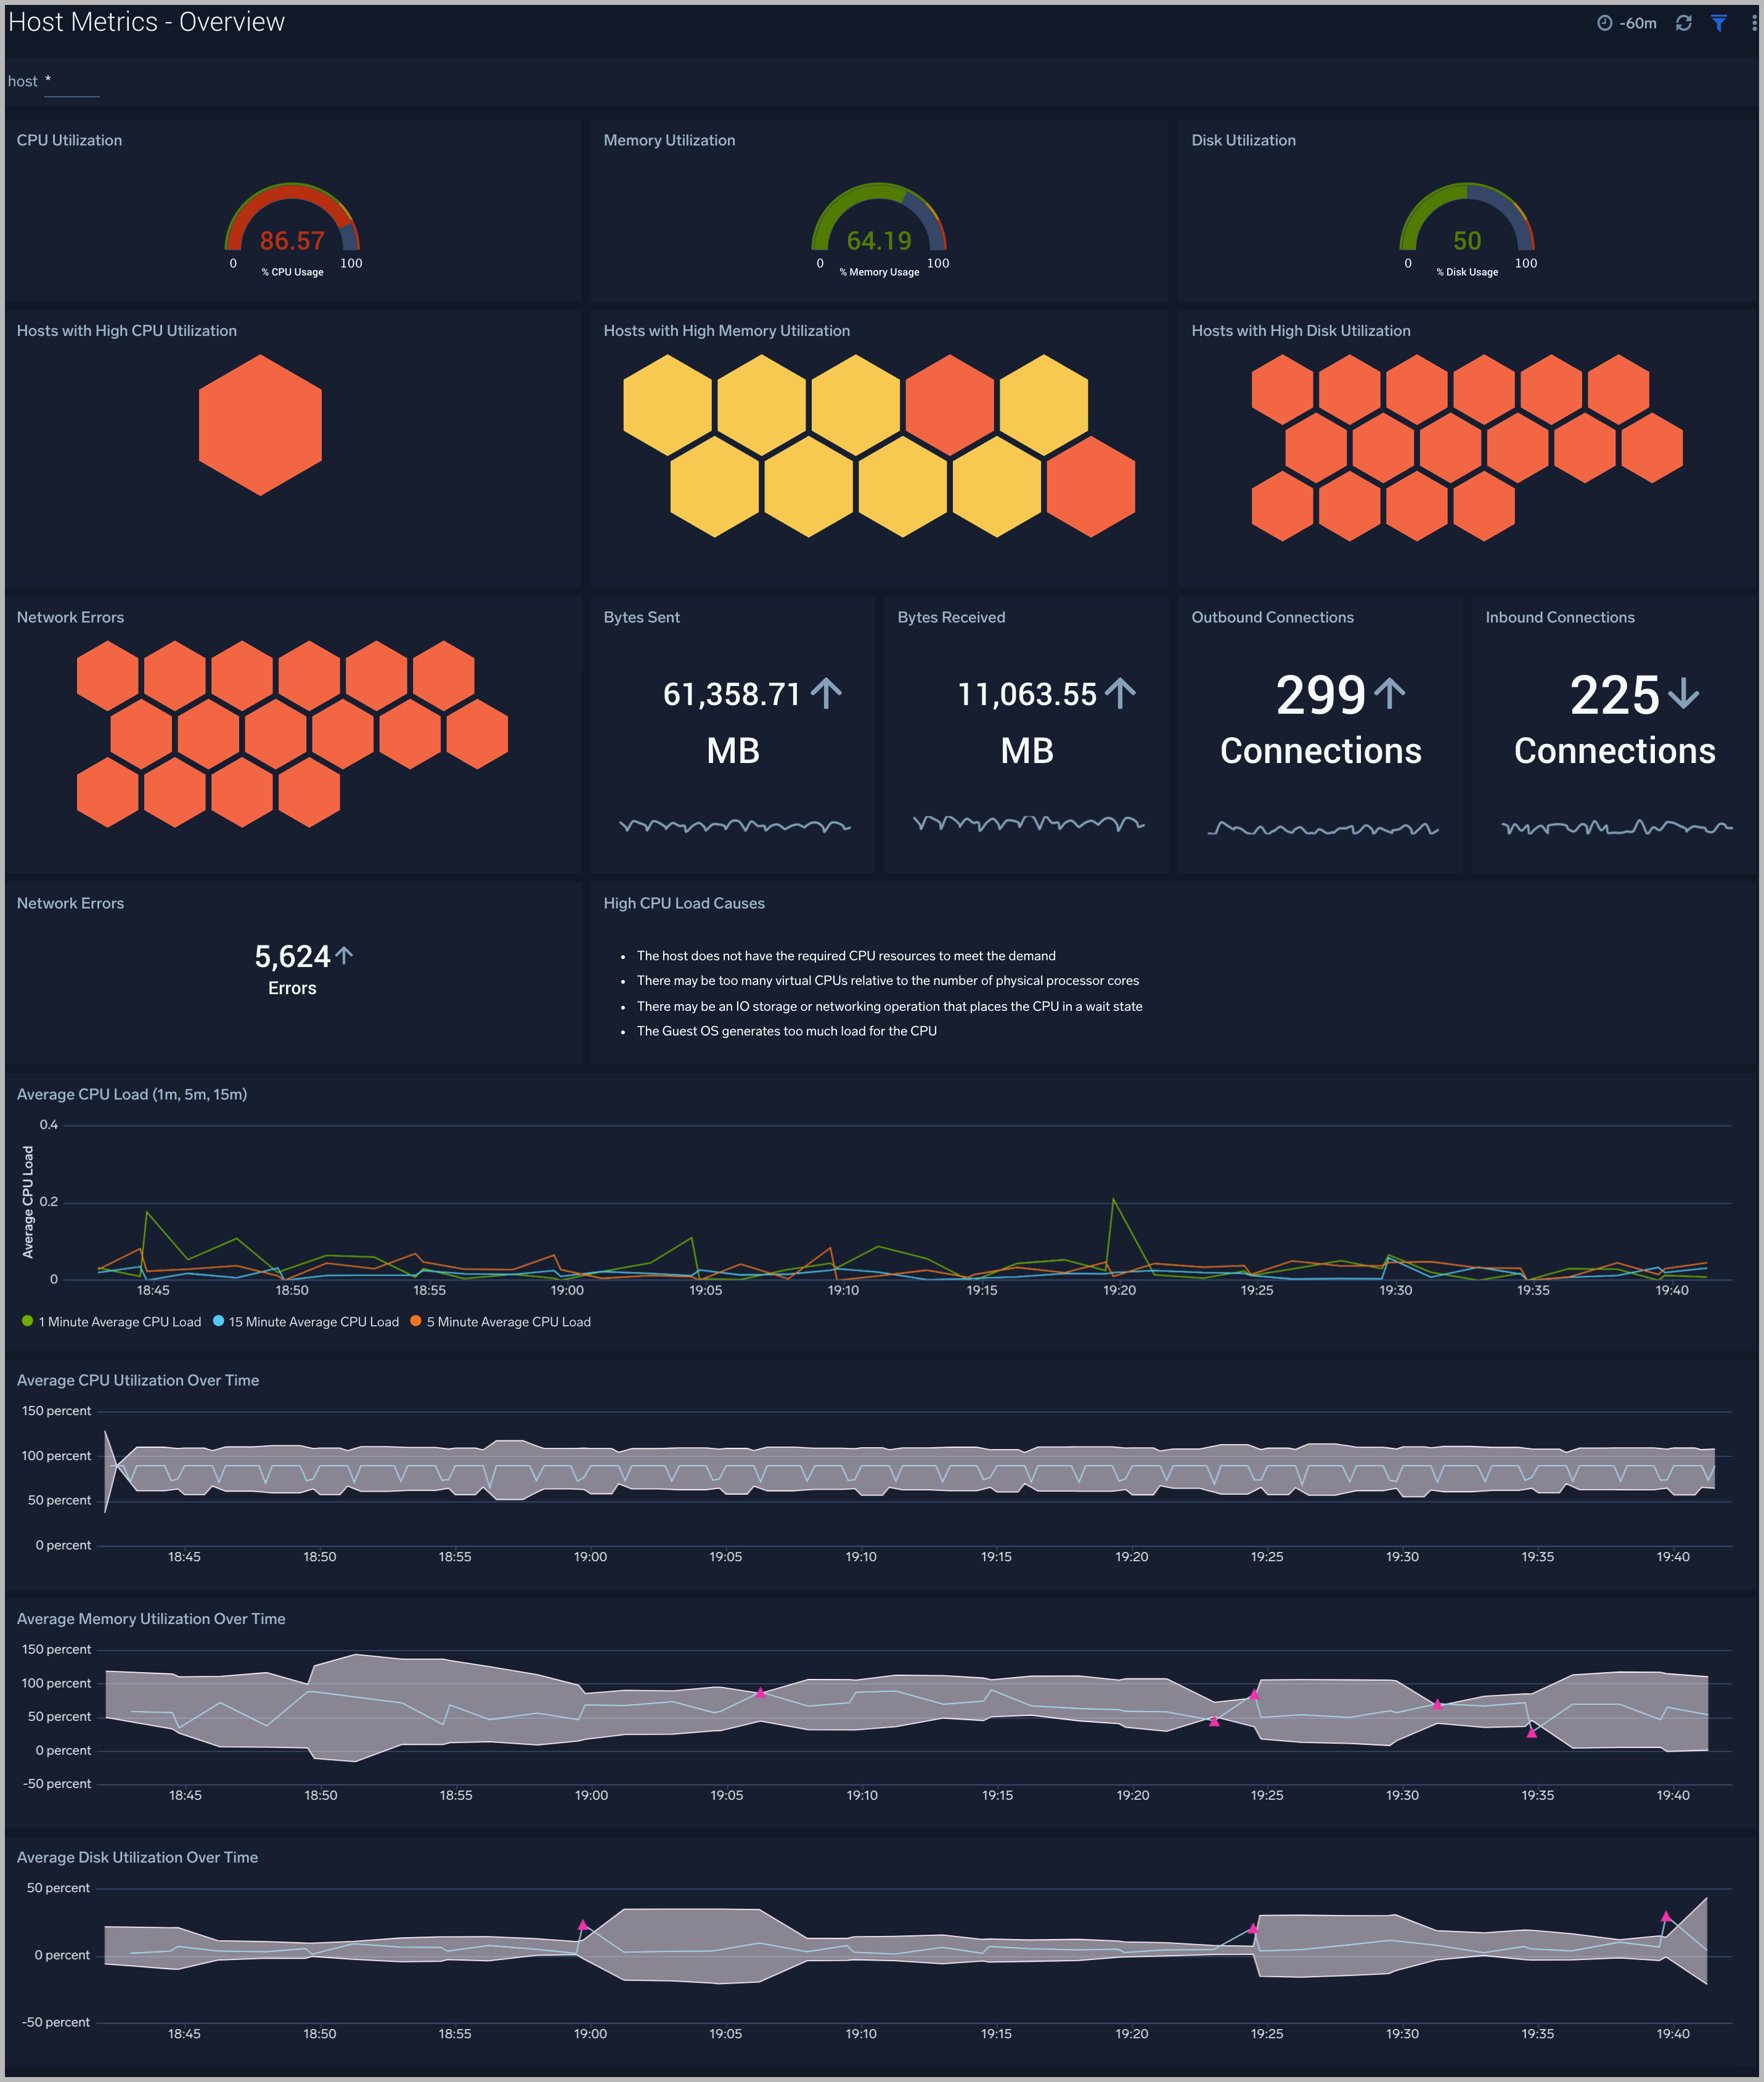
The Host and Process Metrics - Overview dashboard gives you an at-a-glance view of the key metrics like CPU, memory, disk, network, and TCP connections of all your hosts. You can drill down from this dashboard to the Host and Process Metrics - CPU/Disk/Memory/Network/TCP dashboard by using the honeycombs or line charts in all the panels.
Use this dashboard to:
- Identify hosts with high CPU, disk, memory utilization, and identify anomalies over time.
CPU
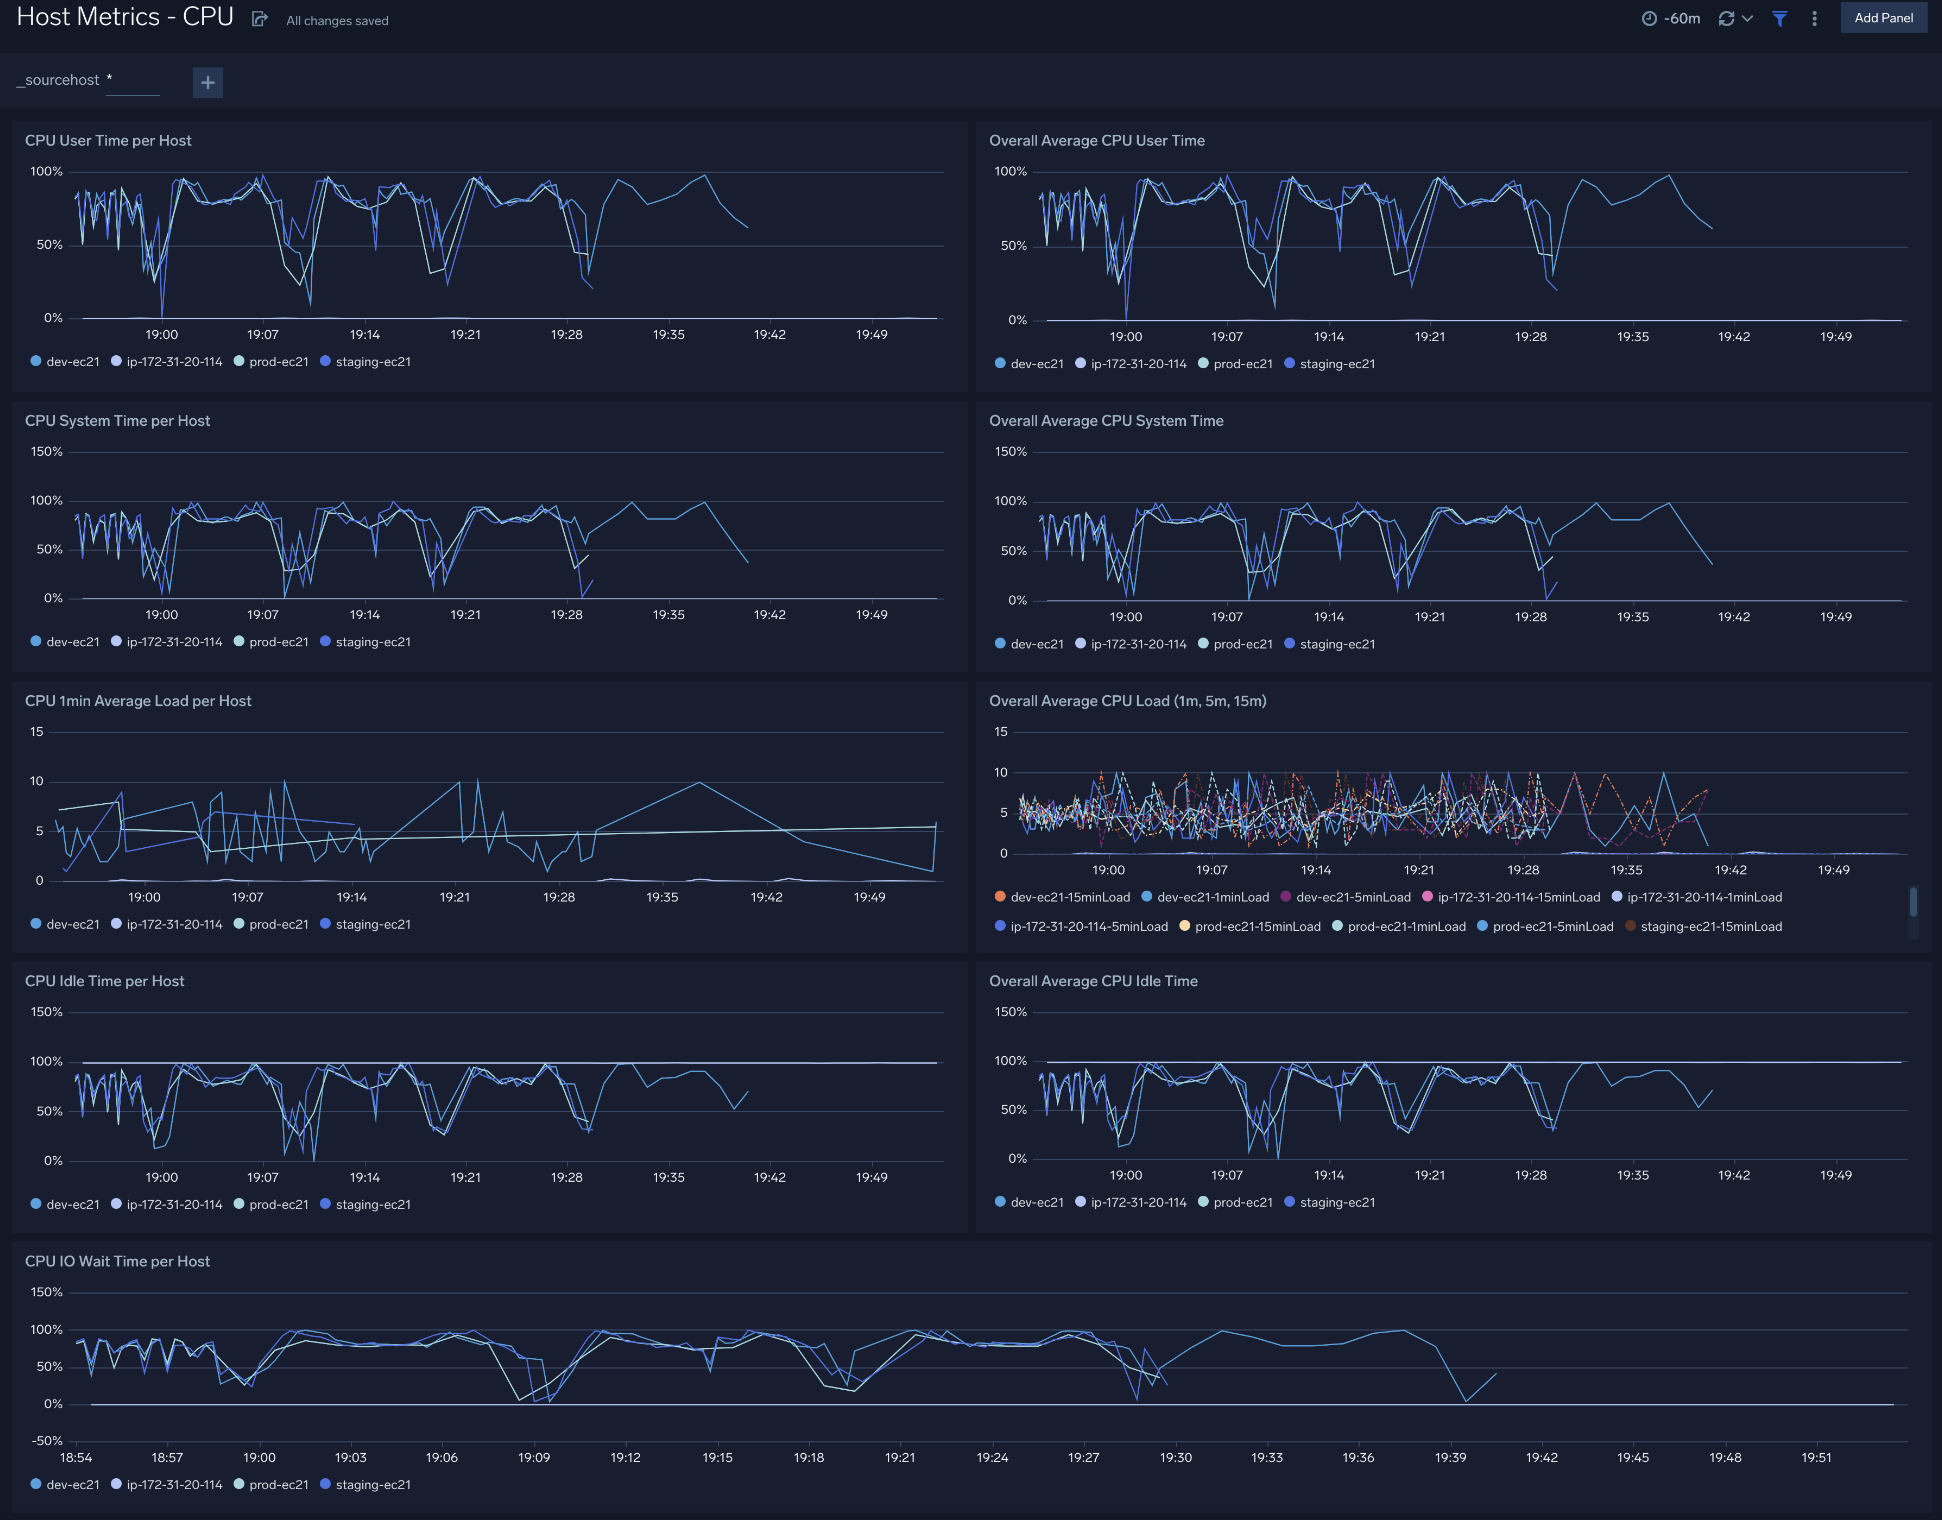
The Host and Process Metrics - CPU dashboard provides a detailed analysis based on CPU metrics. You can drill down from this dashboard to the Host and Process Metrics - Process Details dashboard by using the honeycombs or line charts in all the panels.
Use this dashboard to:
- Identify hosts and processes with high CPU utilization.
- Examine CPU usage by type and identify anomalies over time.
Disk
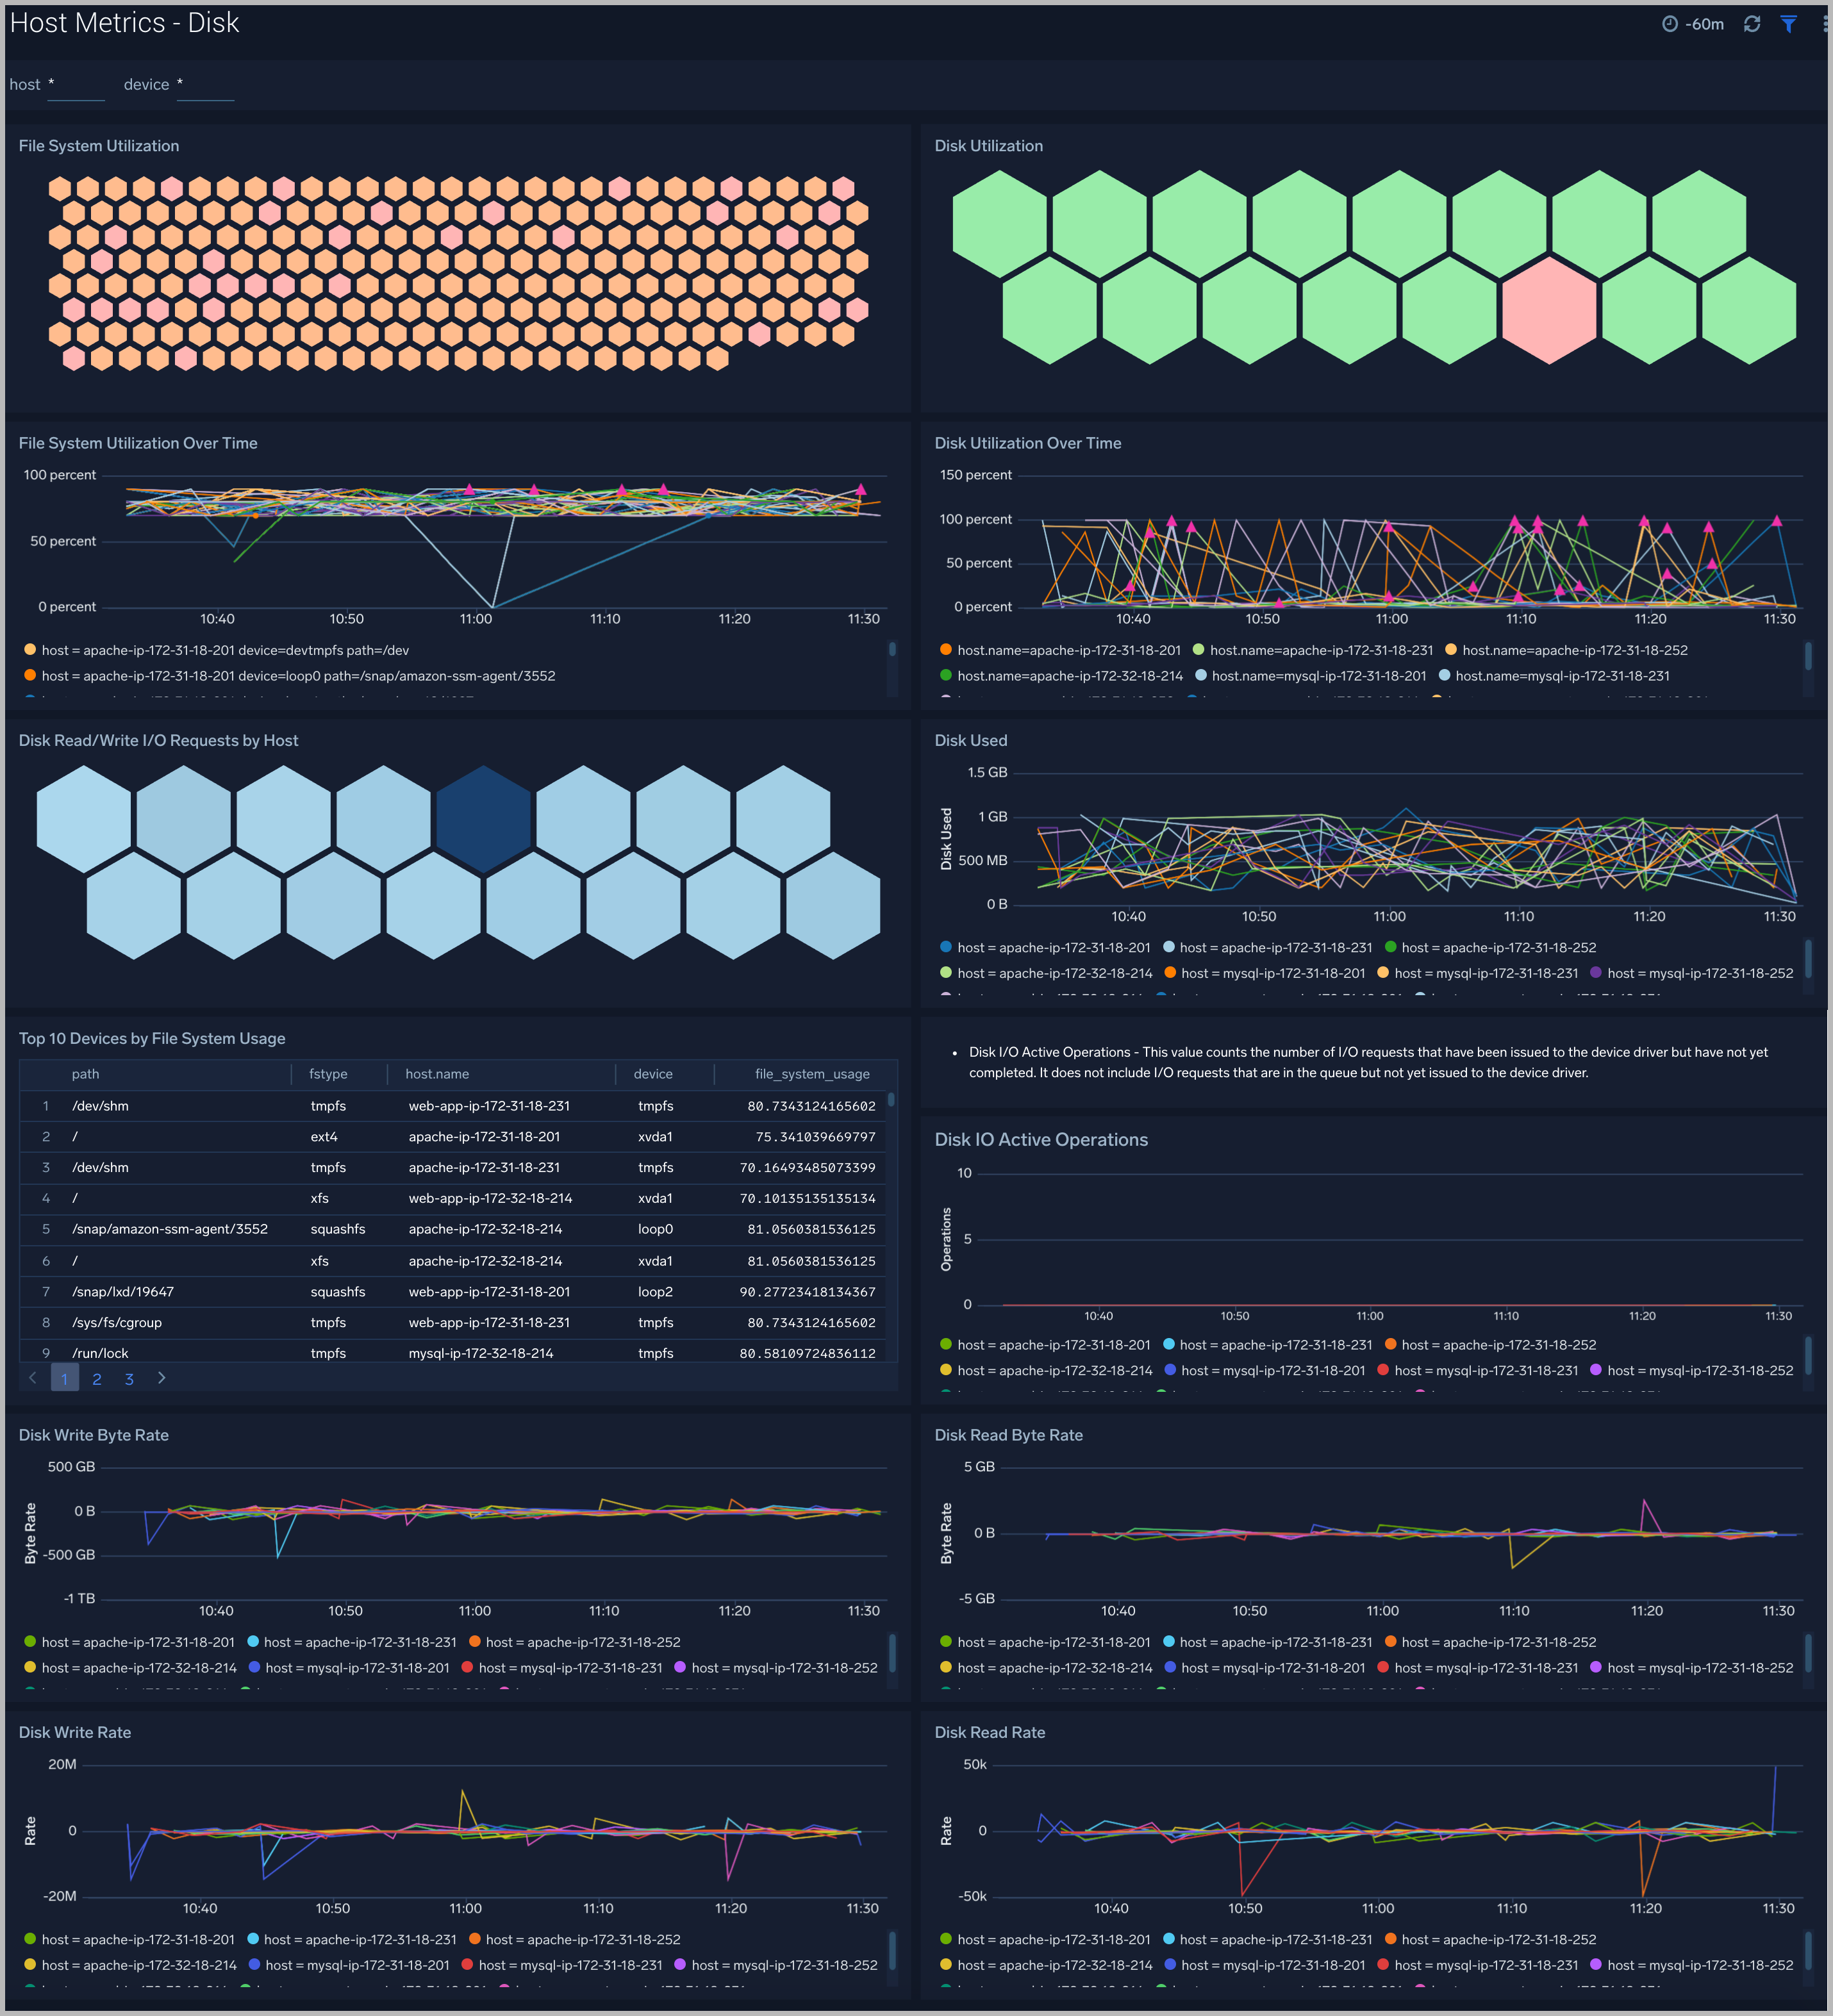
The Host and Process Metrics - Disk dashboard provides detailed information about on disk utilization and disk IO operations. You can drill down from this dashboard to the Host and Process Metrics - Process Details dashboard by using the honeycombs or line charts in all the panels.
Use this dashboard to:
- Identify hosts with high disk utilization and disk IO operations.
- Monitor abnormal spikes in read/write rates.
- Compare disk throughput across storage devices of a host.
Memory
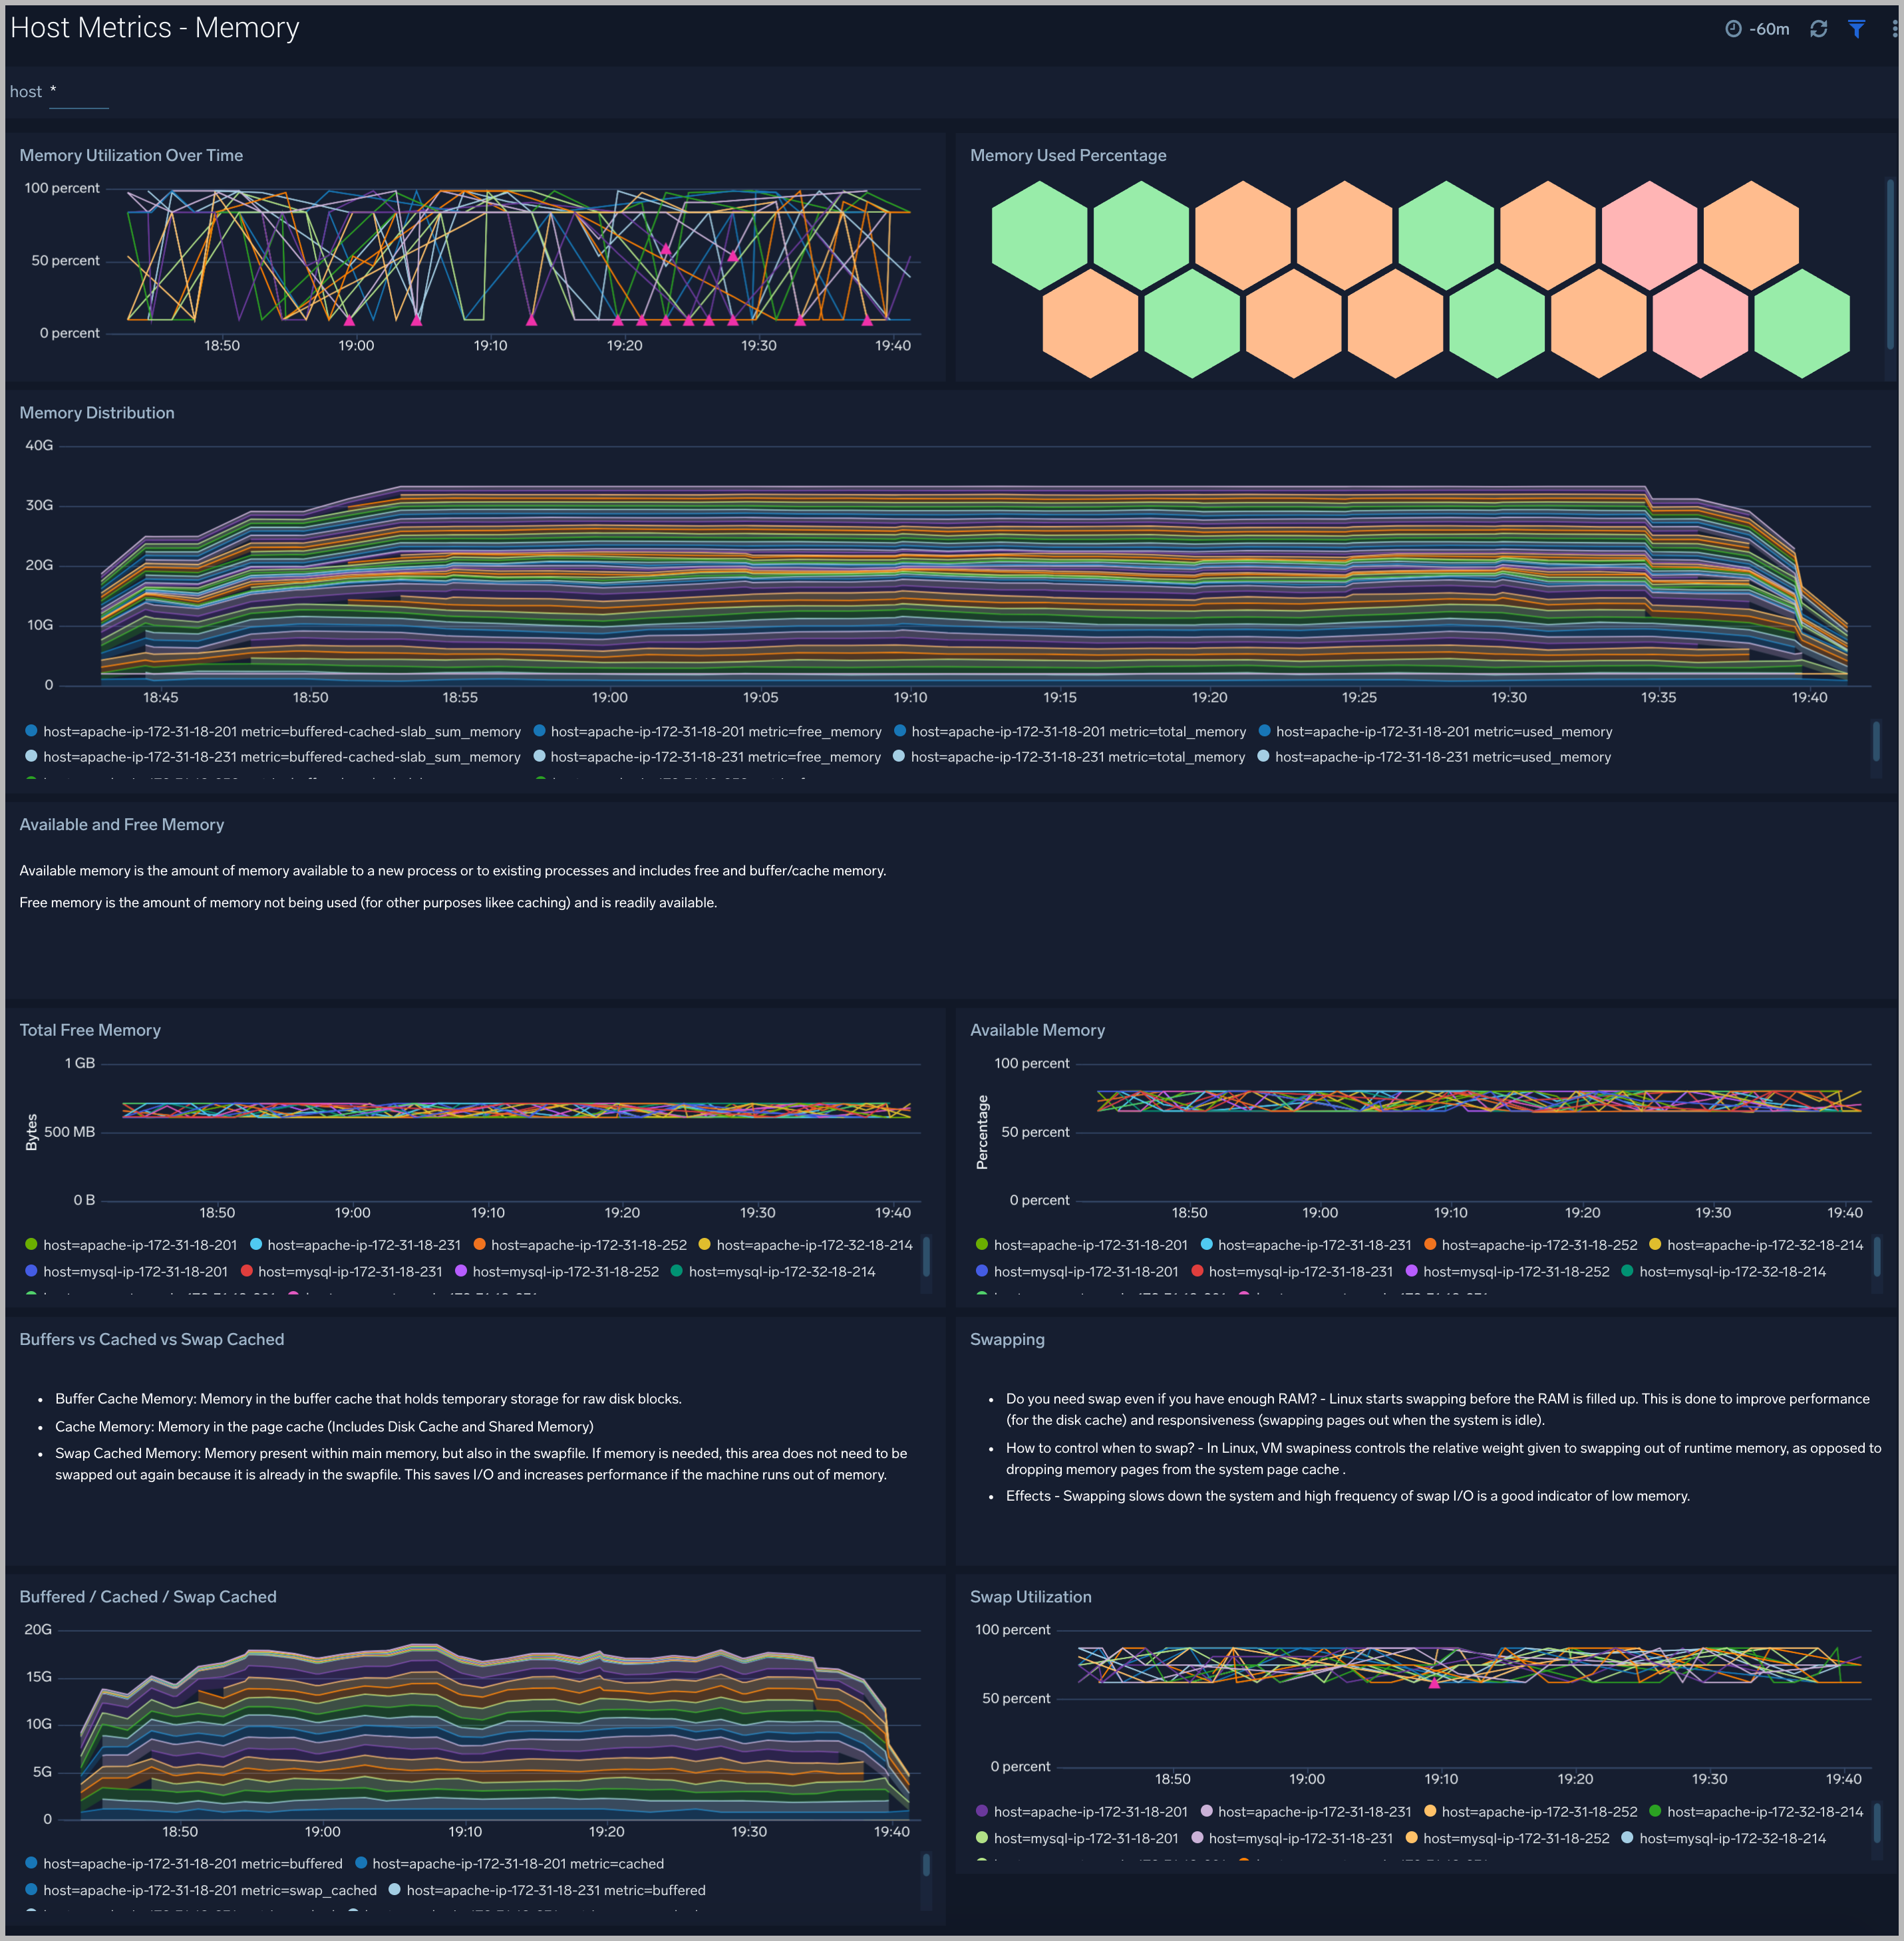
The Host and Process Metrics - Memory dashboard provides detailed information on host memory usage, memory distribution, and swap space utilization. You can drill down from this dashboard to the Host and Process Metrics - Process Details dashboard by using the honeycombs or line charts in all the panels.
Use this dashboard to:
- Identify hosts with high memory utilization.
- Examine memory distribution (free, buffered-cache, used, total) for a given host.
- Monitor abnormal spikes in memory and swap utilization.
Network
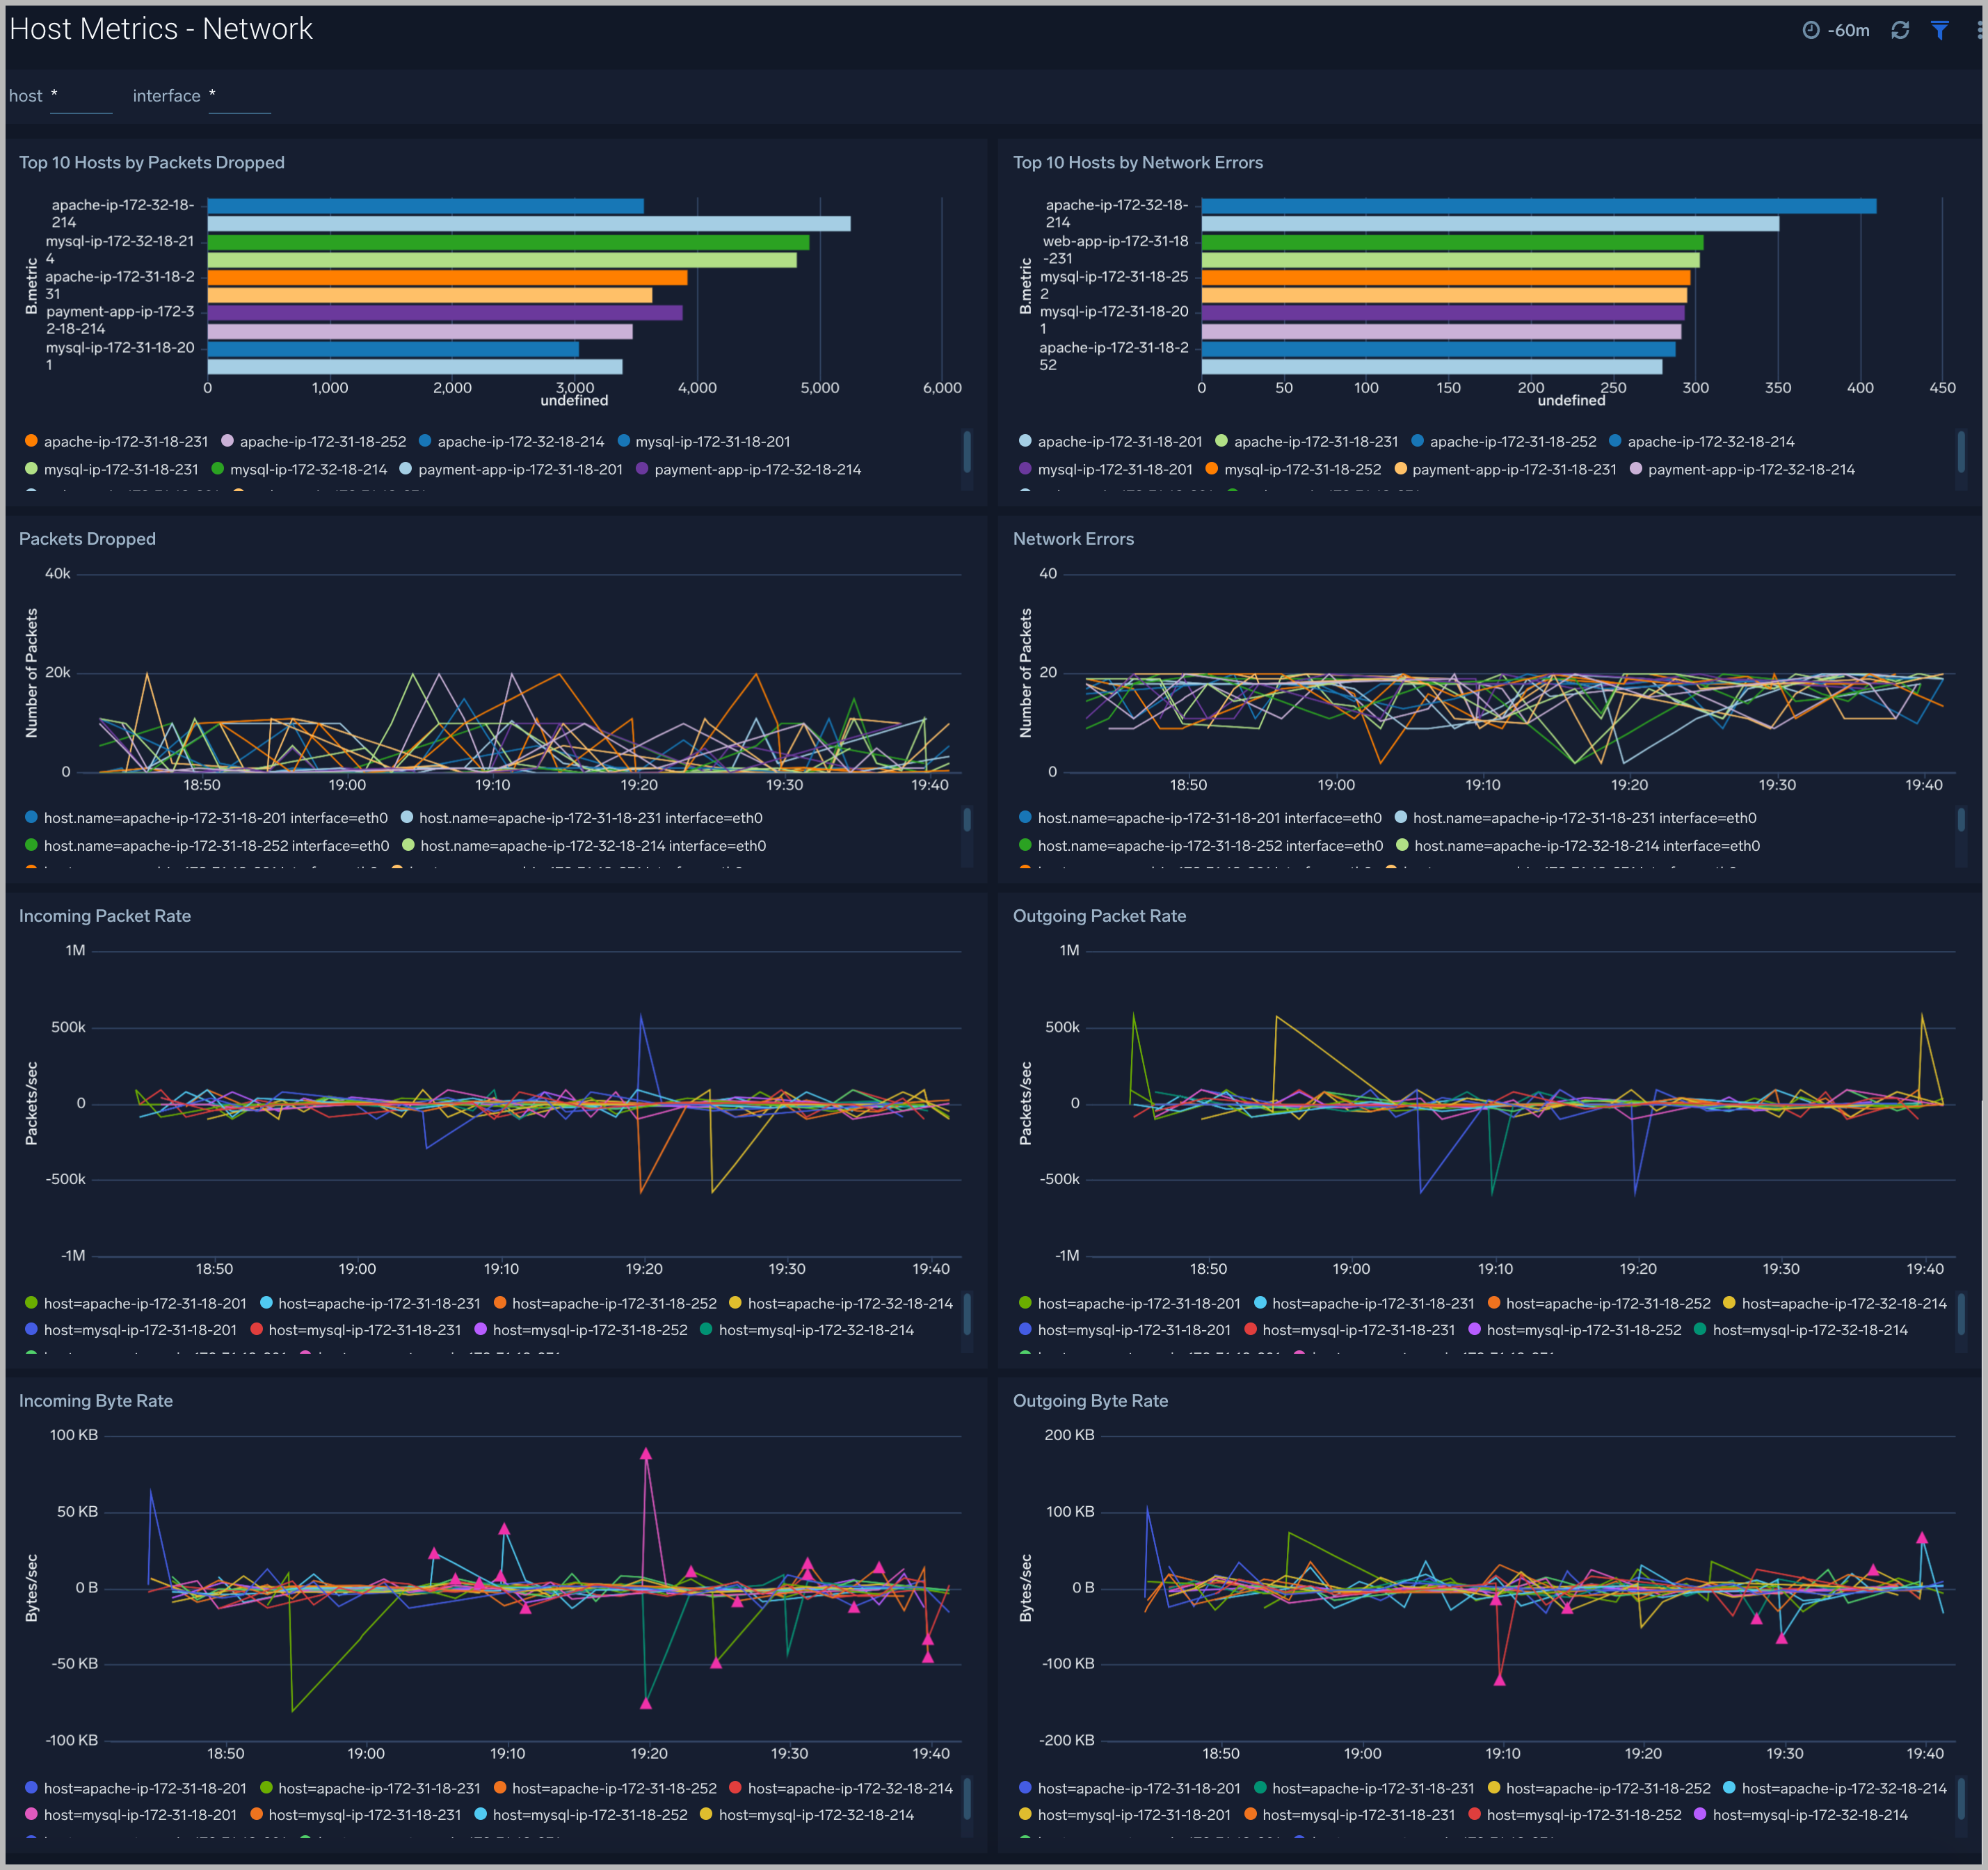
The Host and Process Metrics - Network dashboard provides detailed information on host network errors, throughput, and packets sent and received.
Use this dashboard to:
- Determine top hosts with network errors and dropped packets.
- Monitor abnormal spikes in incoming/outgoing packets and bytes sent and received.
- Use dashboard filters to compare throughput across the interface of a host.
TCP
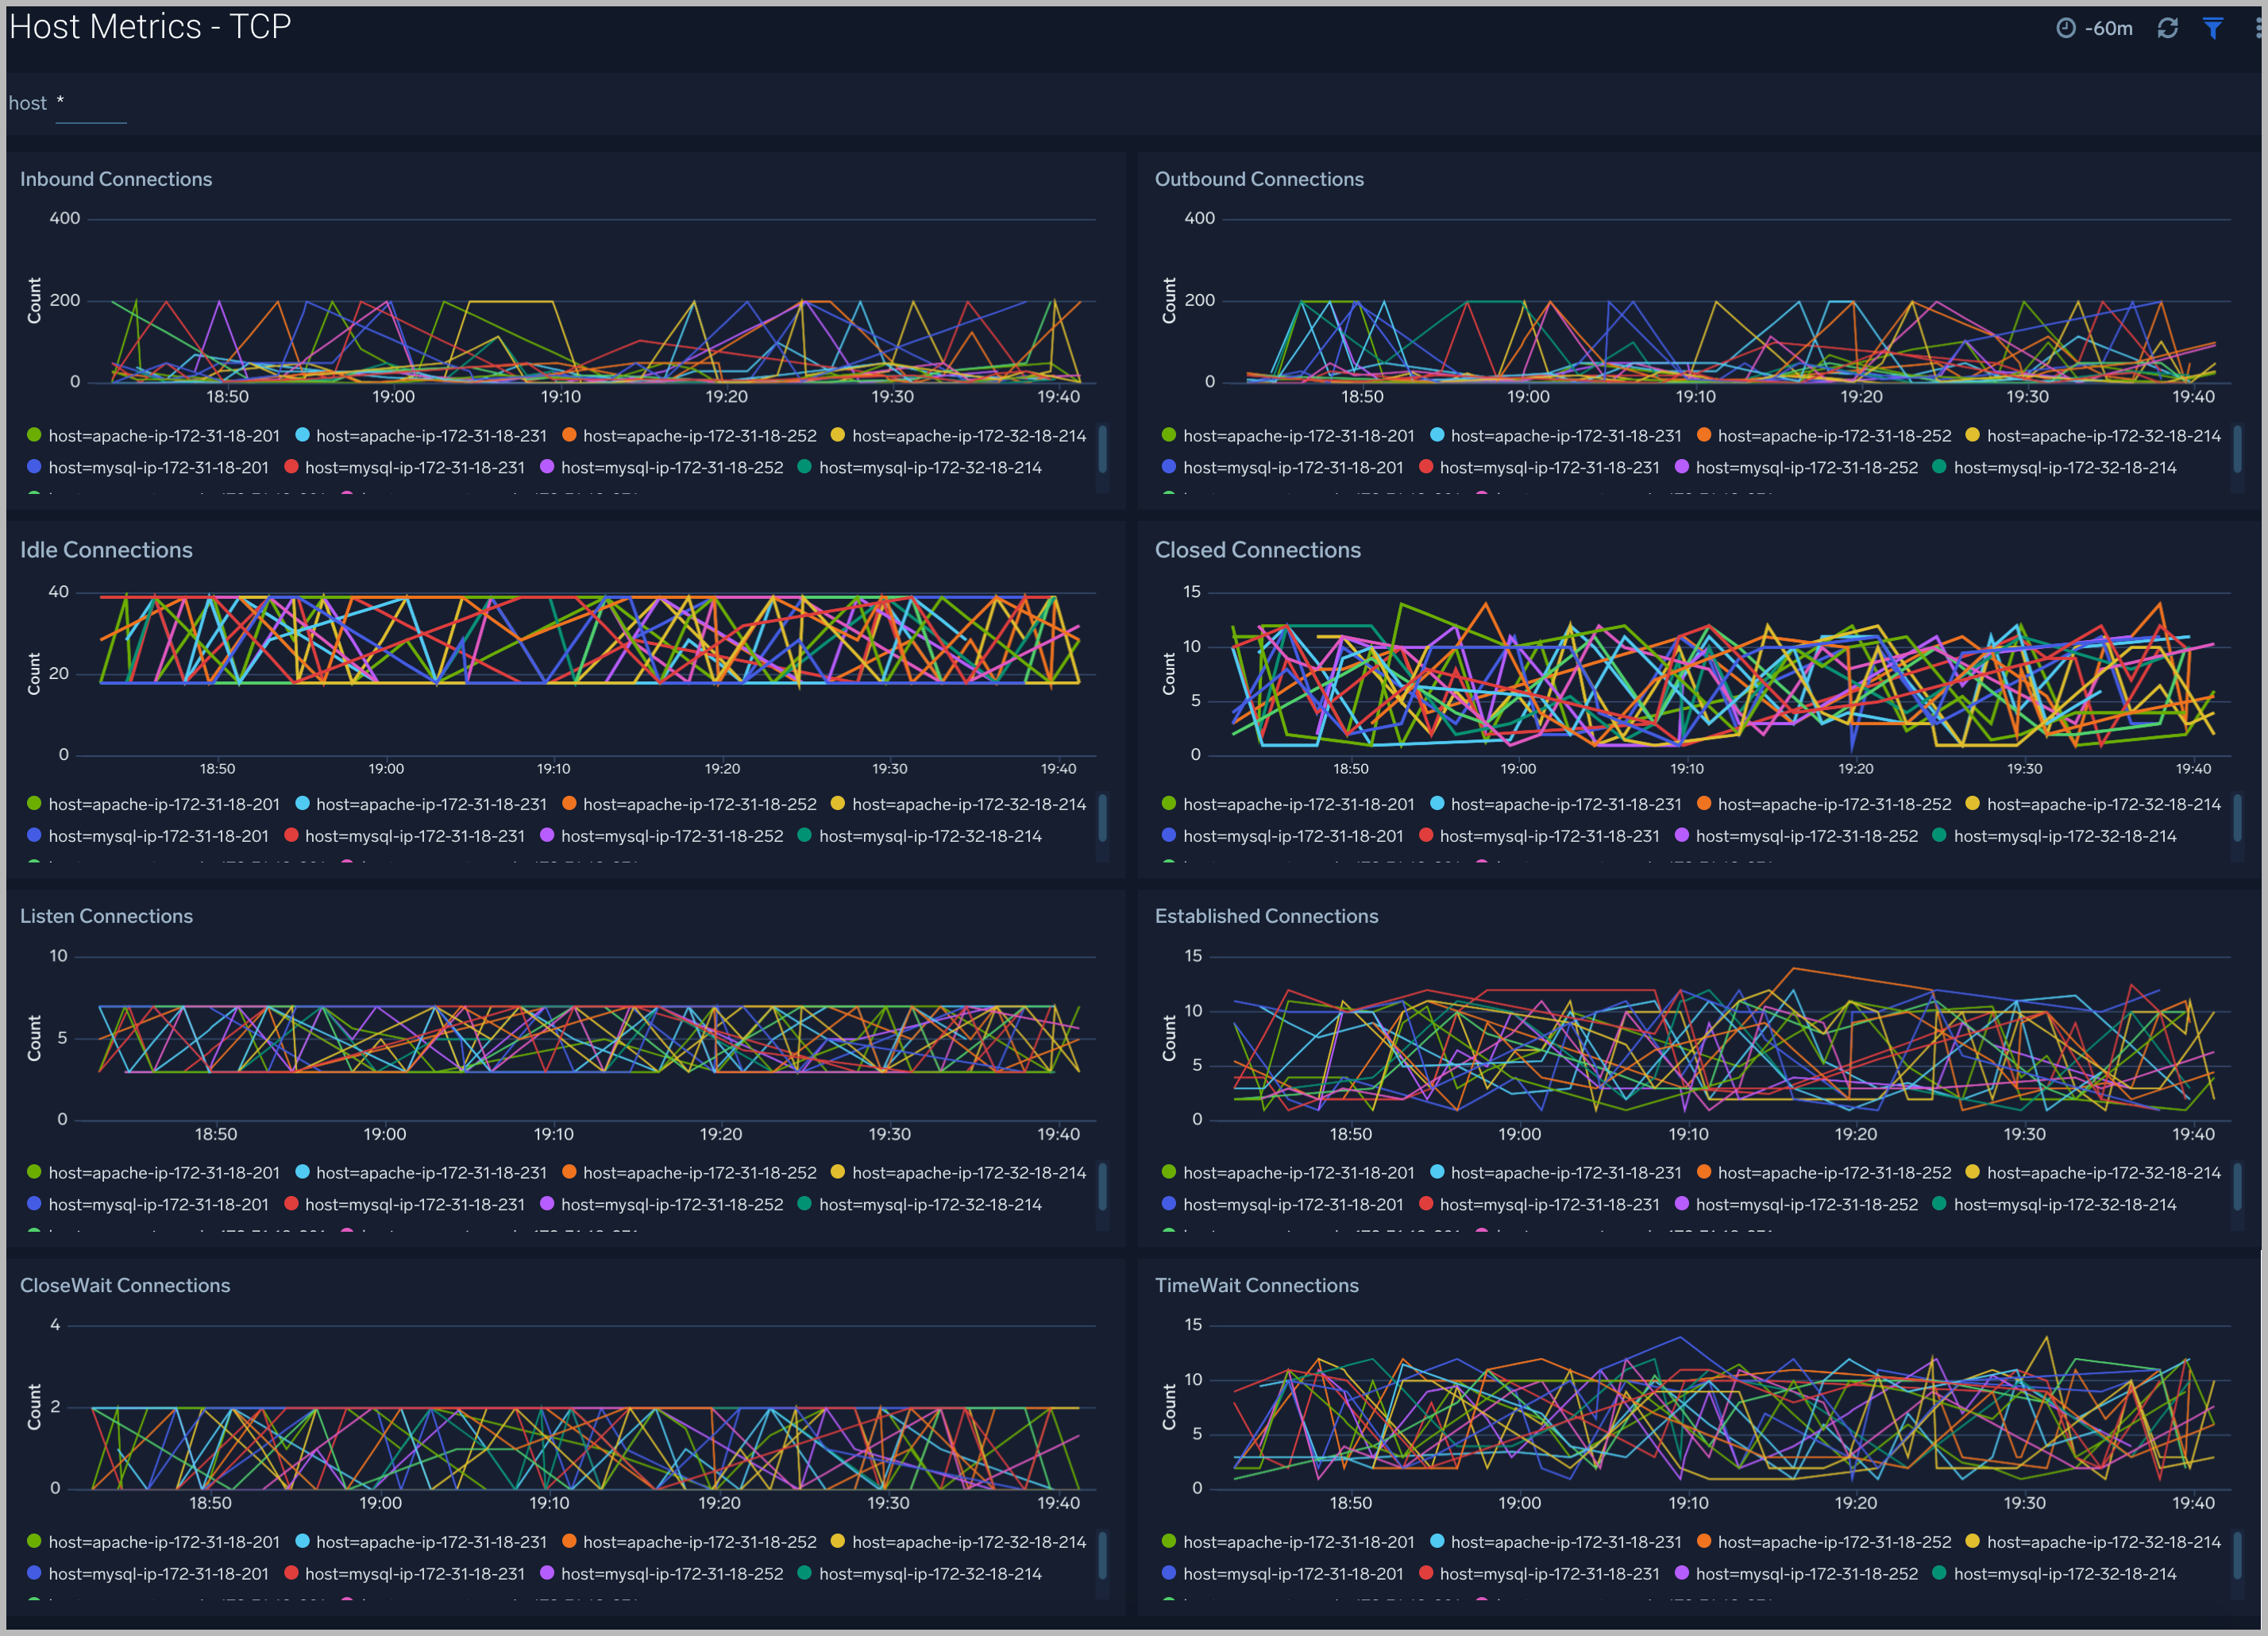
The Host and Process Metrics - TCP dashboard provides detailed information around inbound, outbound, open, and established TCP connections.
Use this dashboard to:
- Identify abnormal spikes in inbound, outbound, open, or established connections.
Process Overview
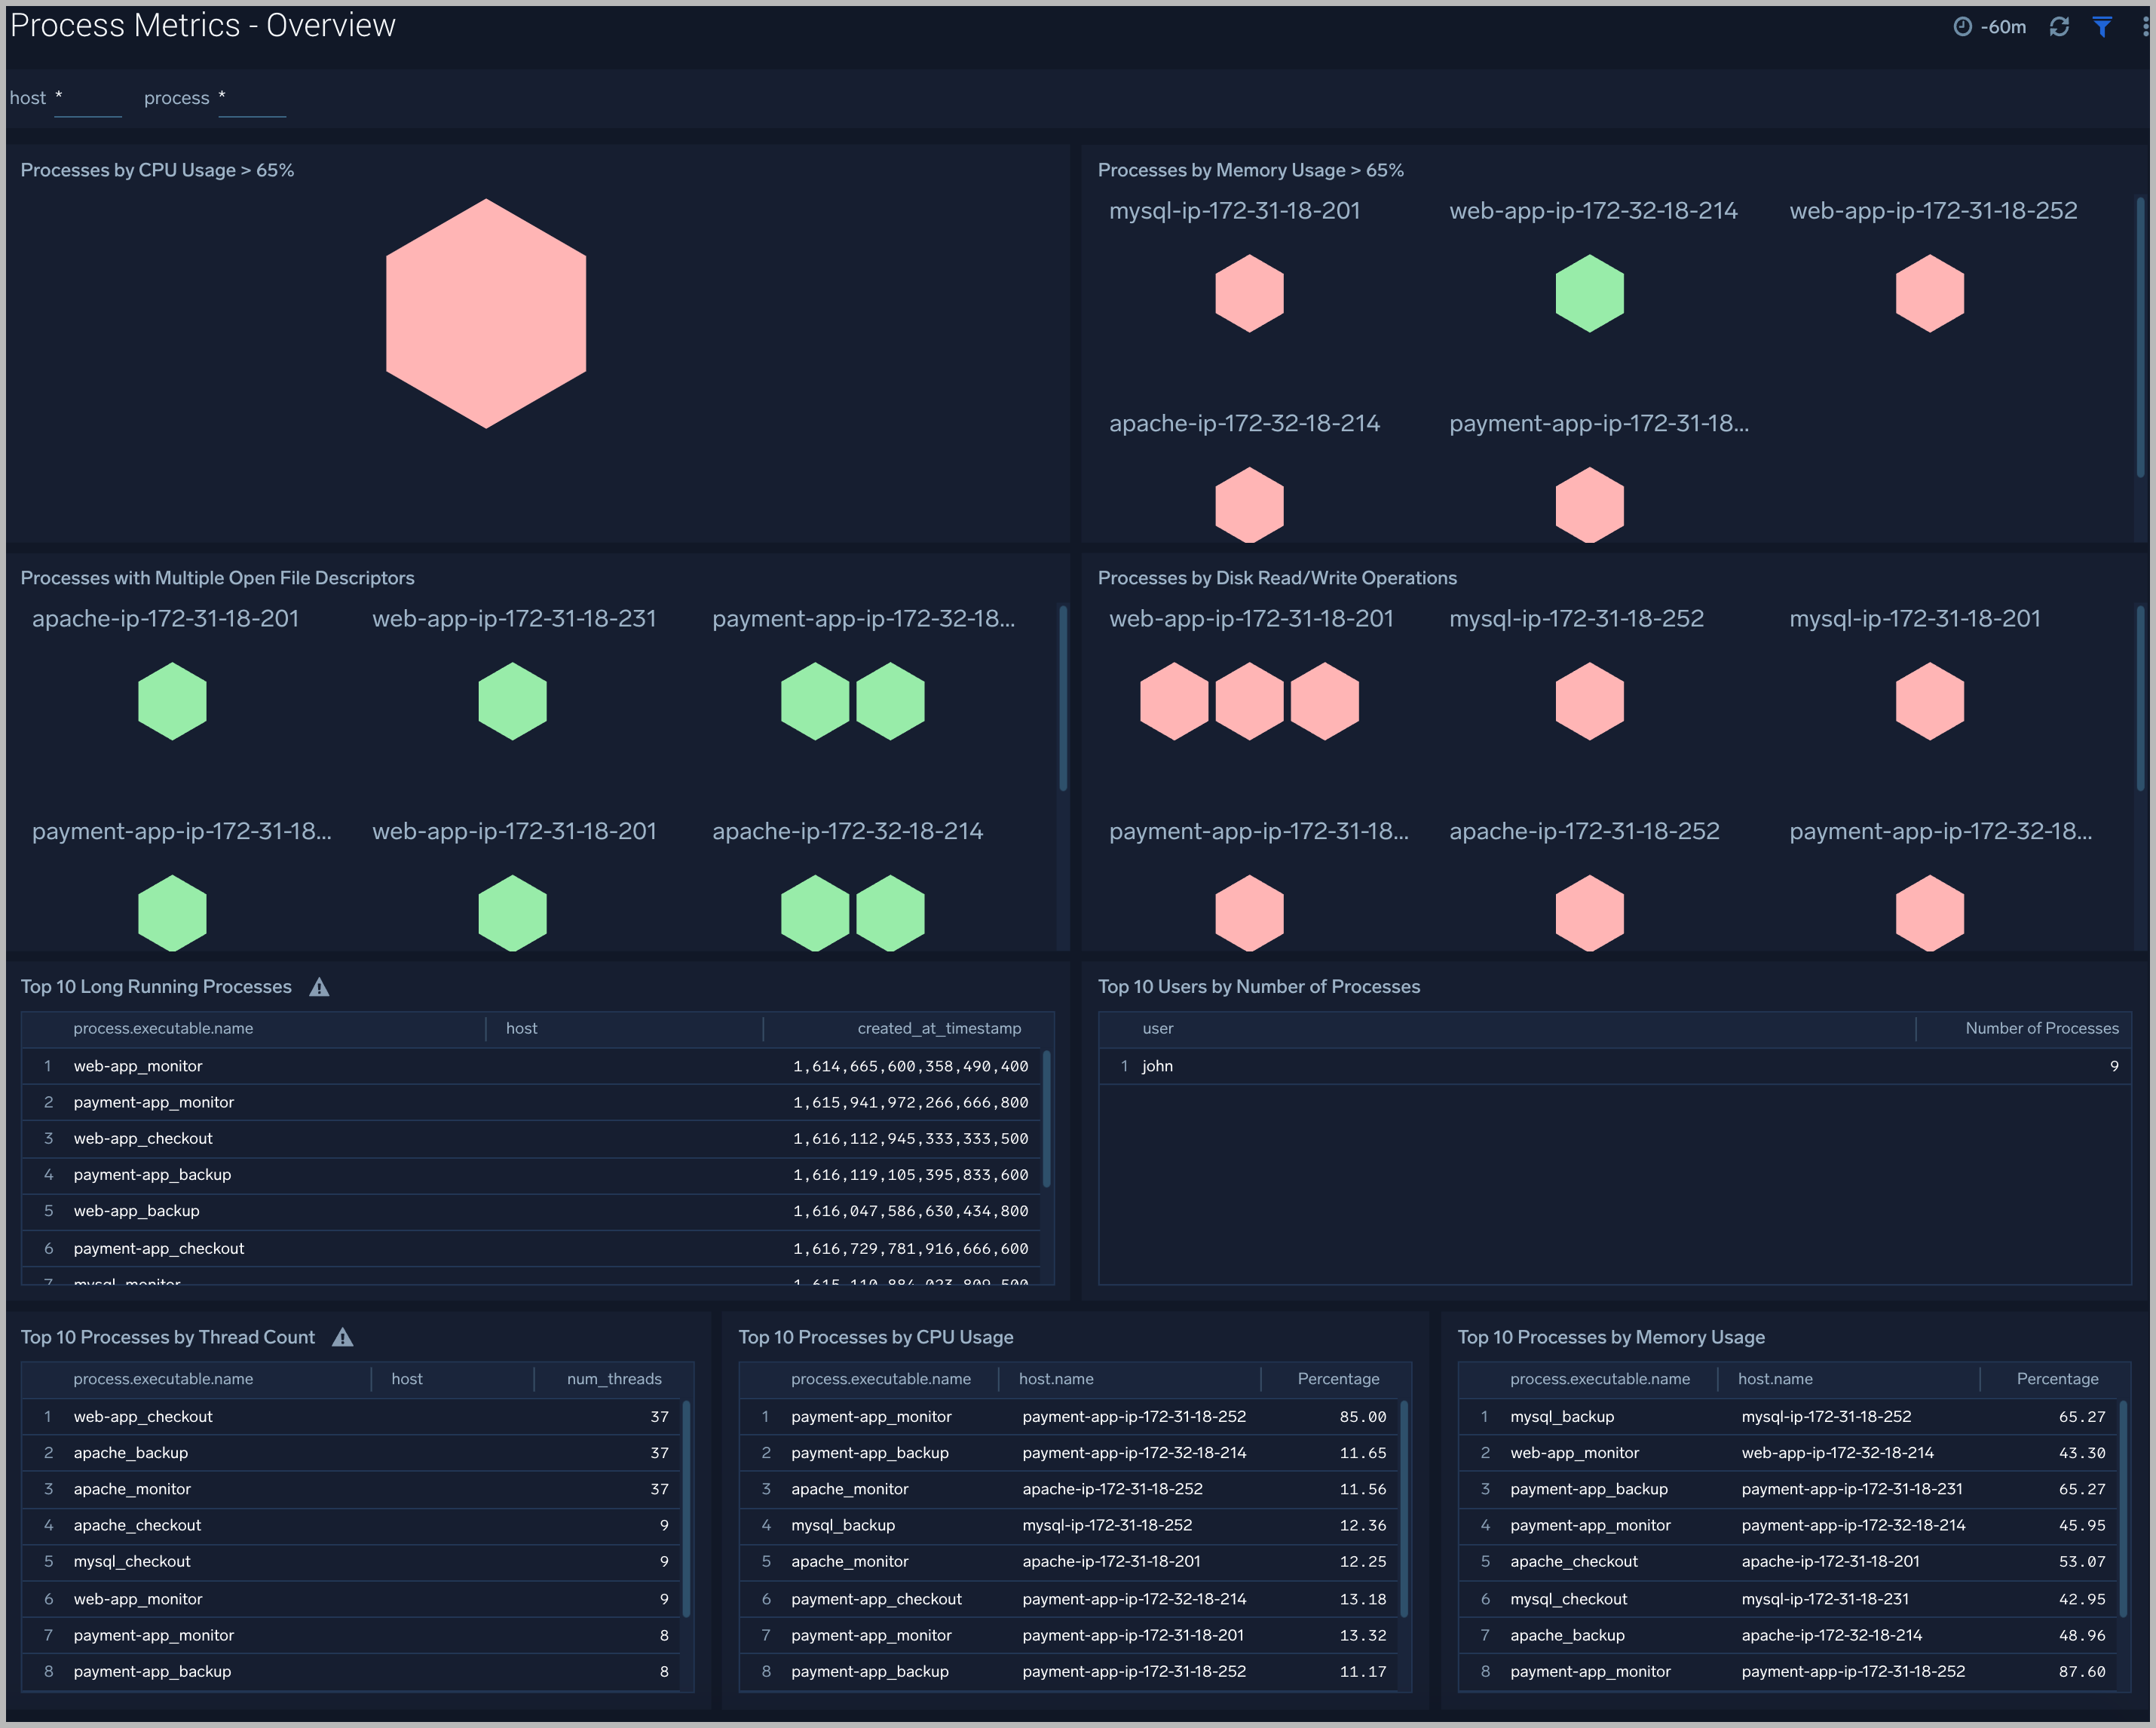
The Host and Process Metrics - Process Overview dashboard gives you an at-a-glance view of all the processes by open file descriptors, CPU usage, memory usage, disk read/write operations and thread count. You can drill down from this dashboard to the Host and Process Metrics - Process Details dashboard by using the honeycombs or line charts in all the panels.
Use this dashboard to:
- Identify top processes by CPU, memory usage, and open file descriptors.
- Determine the longest running processes and users that have spawned the most number of processes.
Process Details
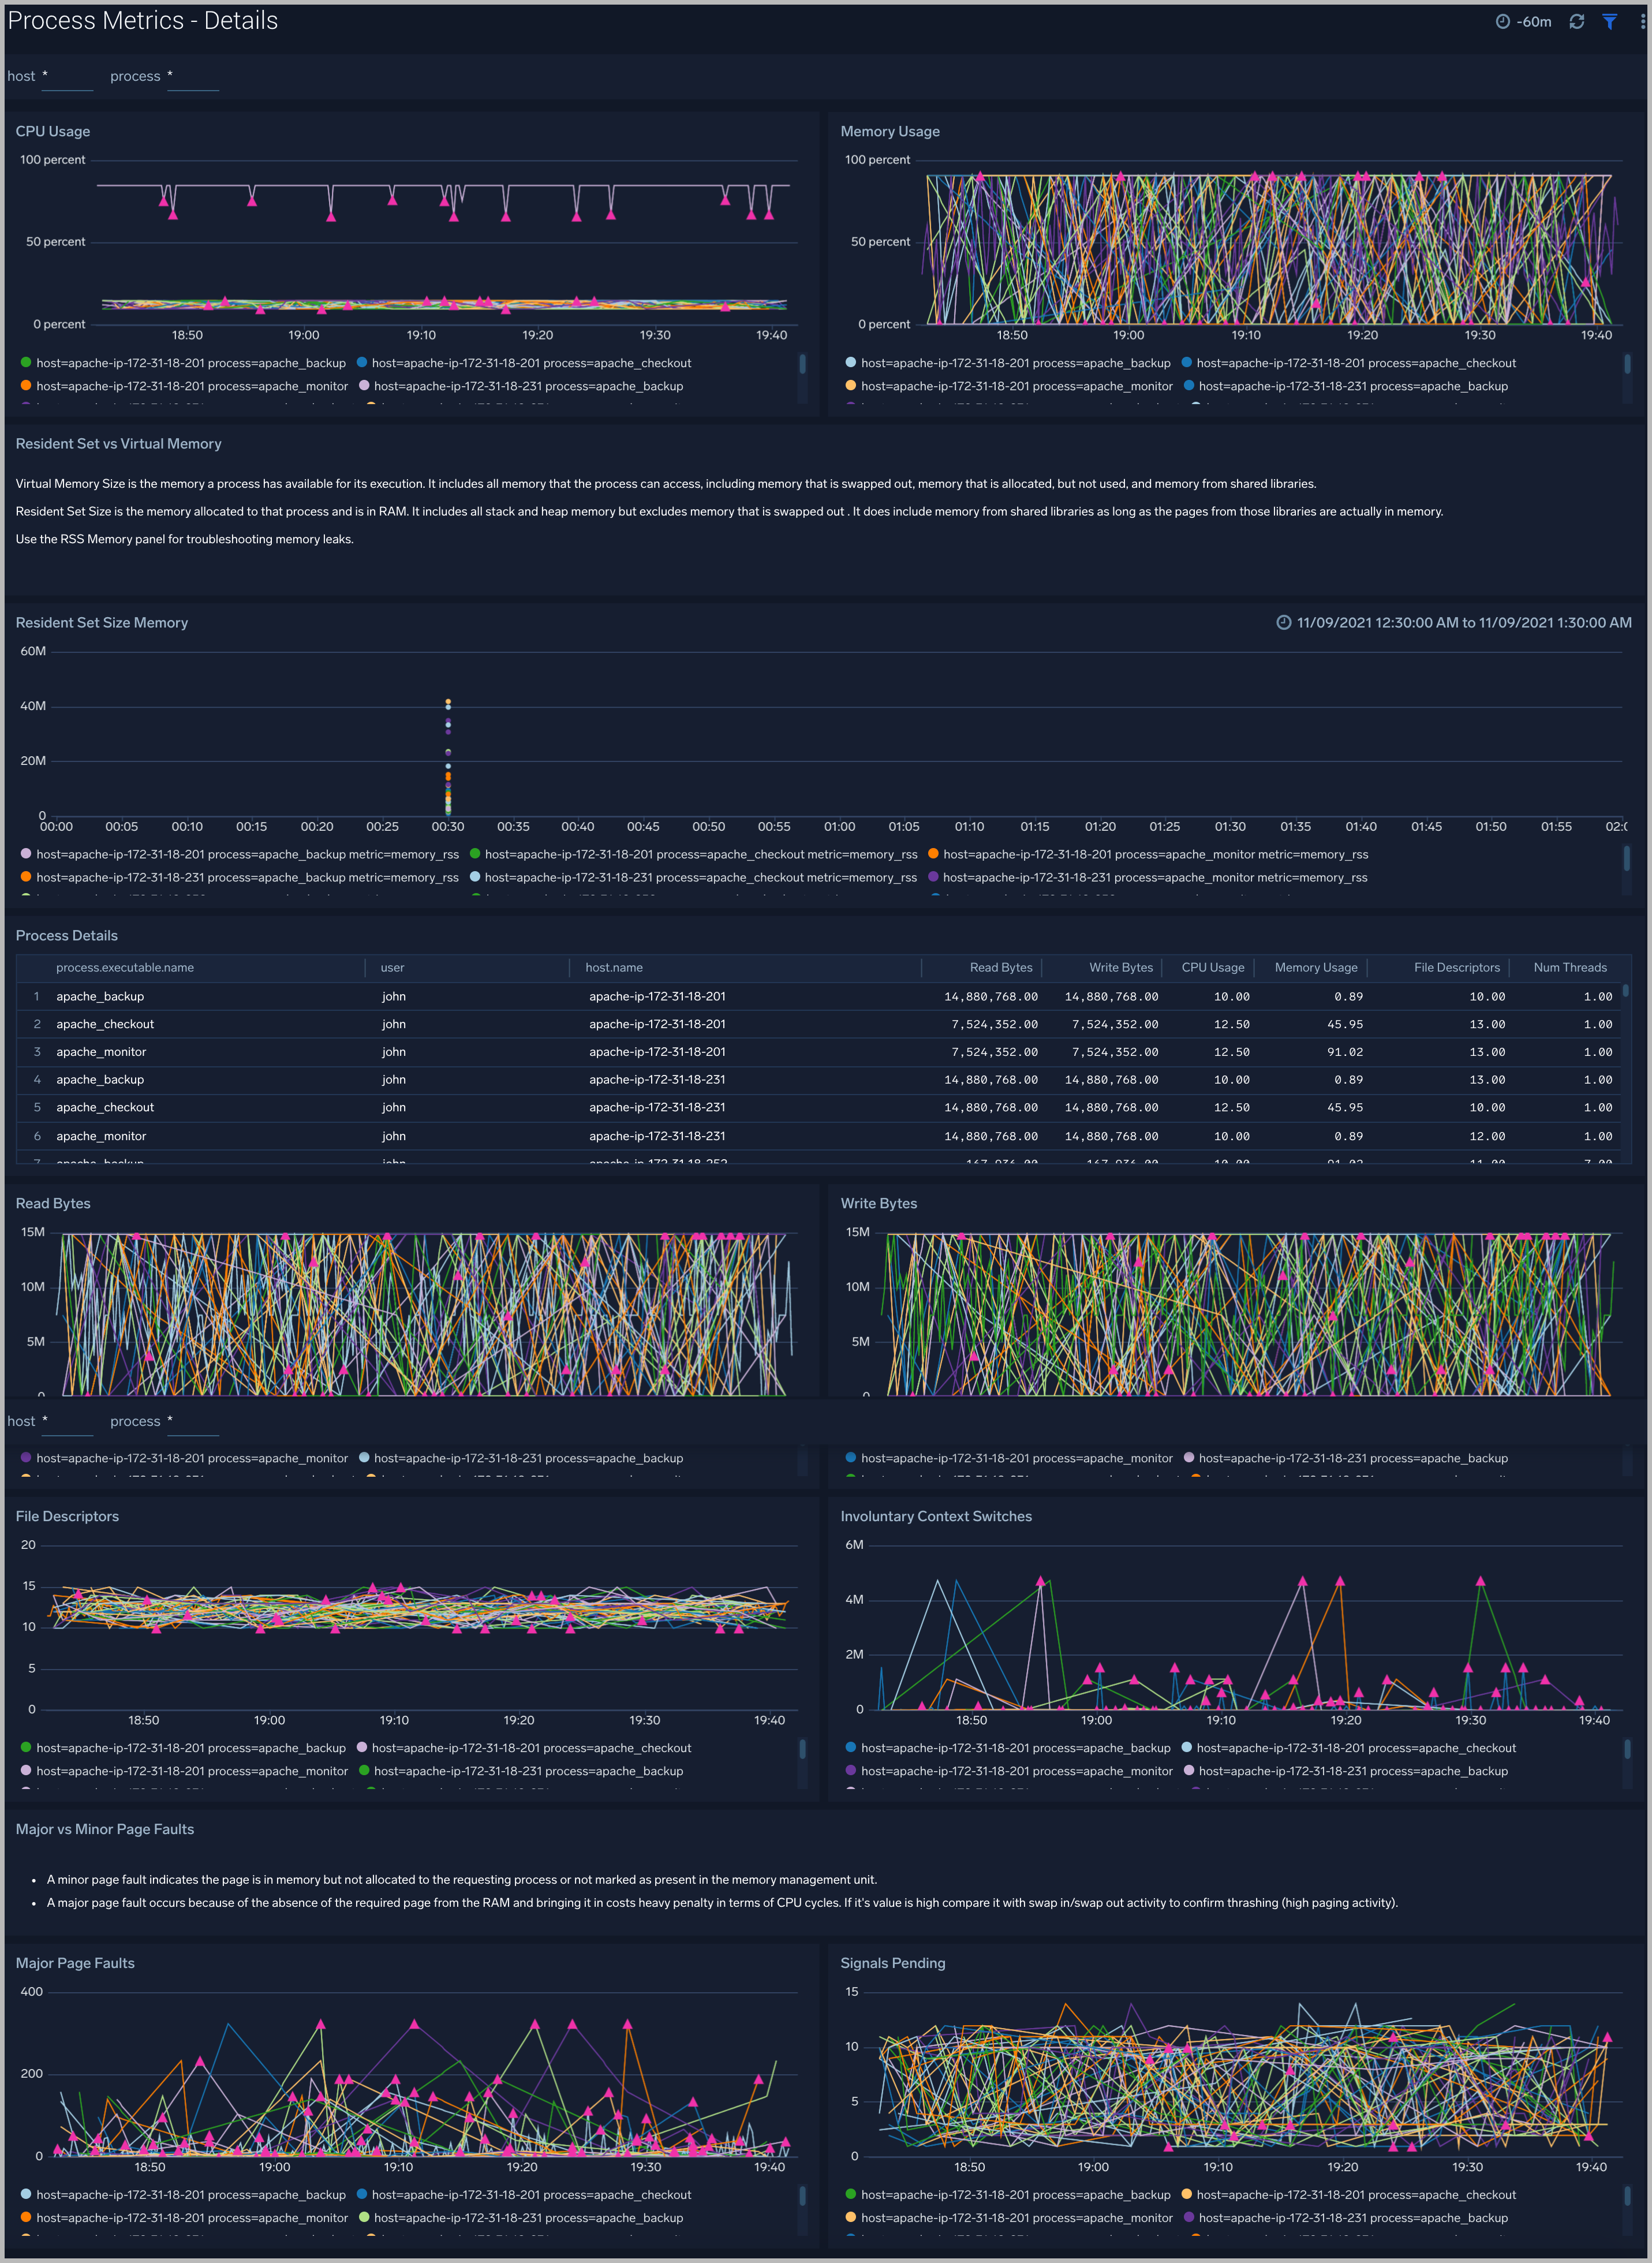
The Host and Process Metrics - Process Details dashboard gives you a detailed view of key process related metrics such as CPU and memory utilization, disk read/write throughput, and major/minor page faults.
Use this dashboard to:
- Determine the number of open file descriptors in all hosts. If the number of open file descriptors reaches the maximum file descriptor limits, it can cause IOException errors.
- Identify anomalies in CPU usage, memory usage, major/minor page faults and reads/writes over time.
- Troubleshoot memory leaks using the resident set memory trend chart.
Process Trends
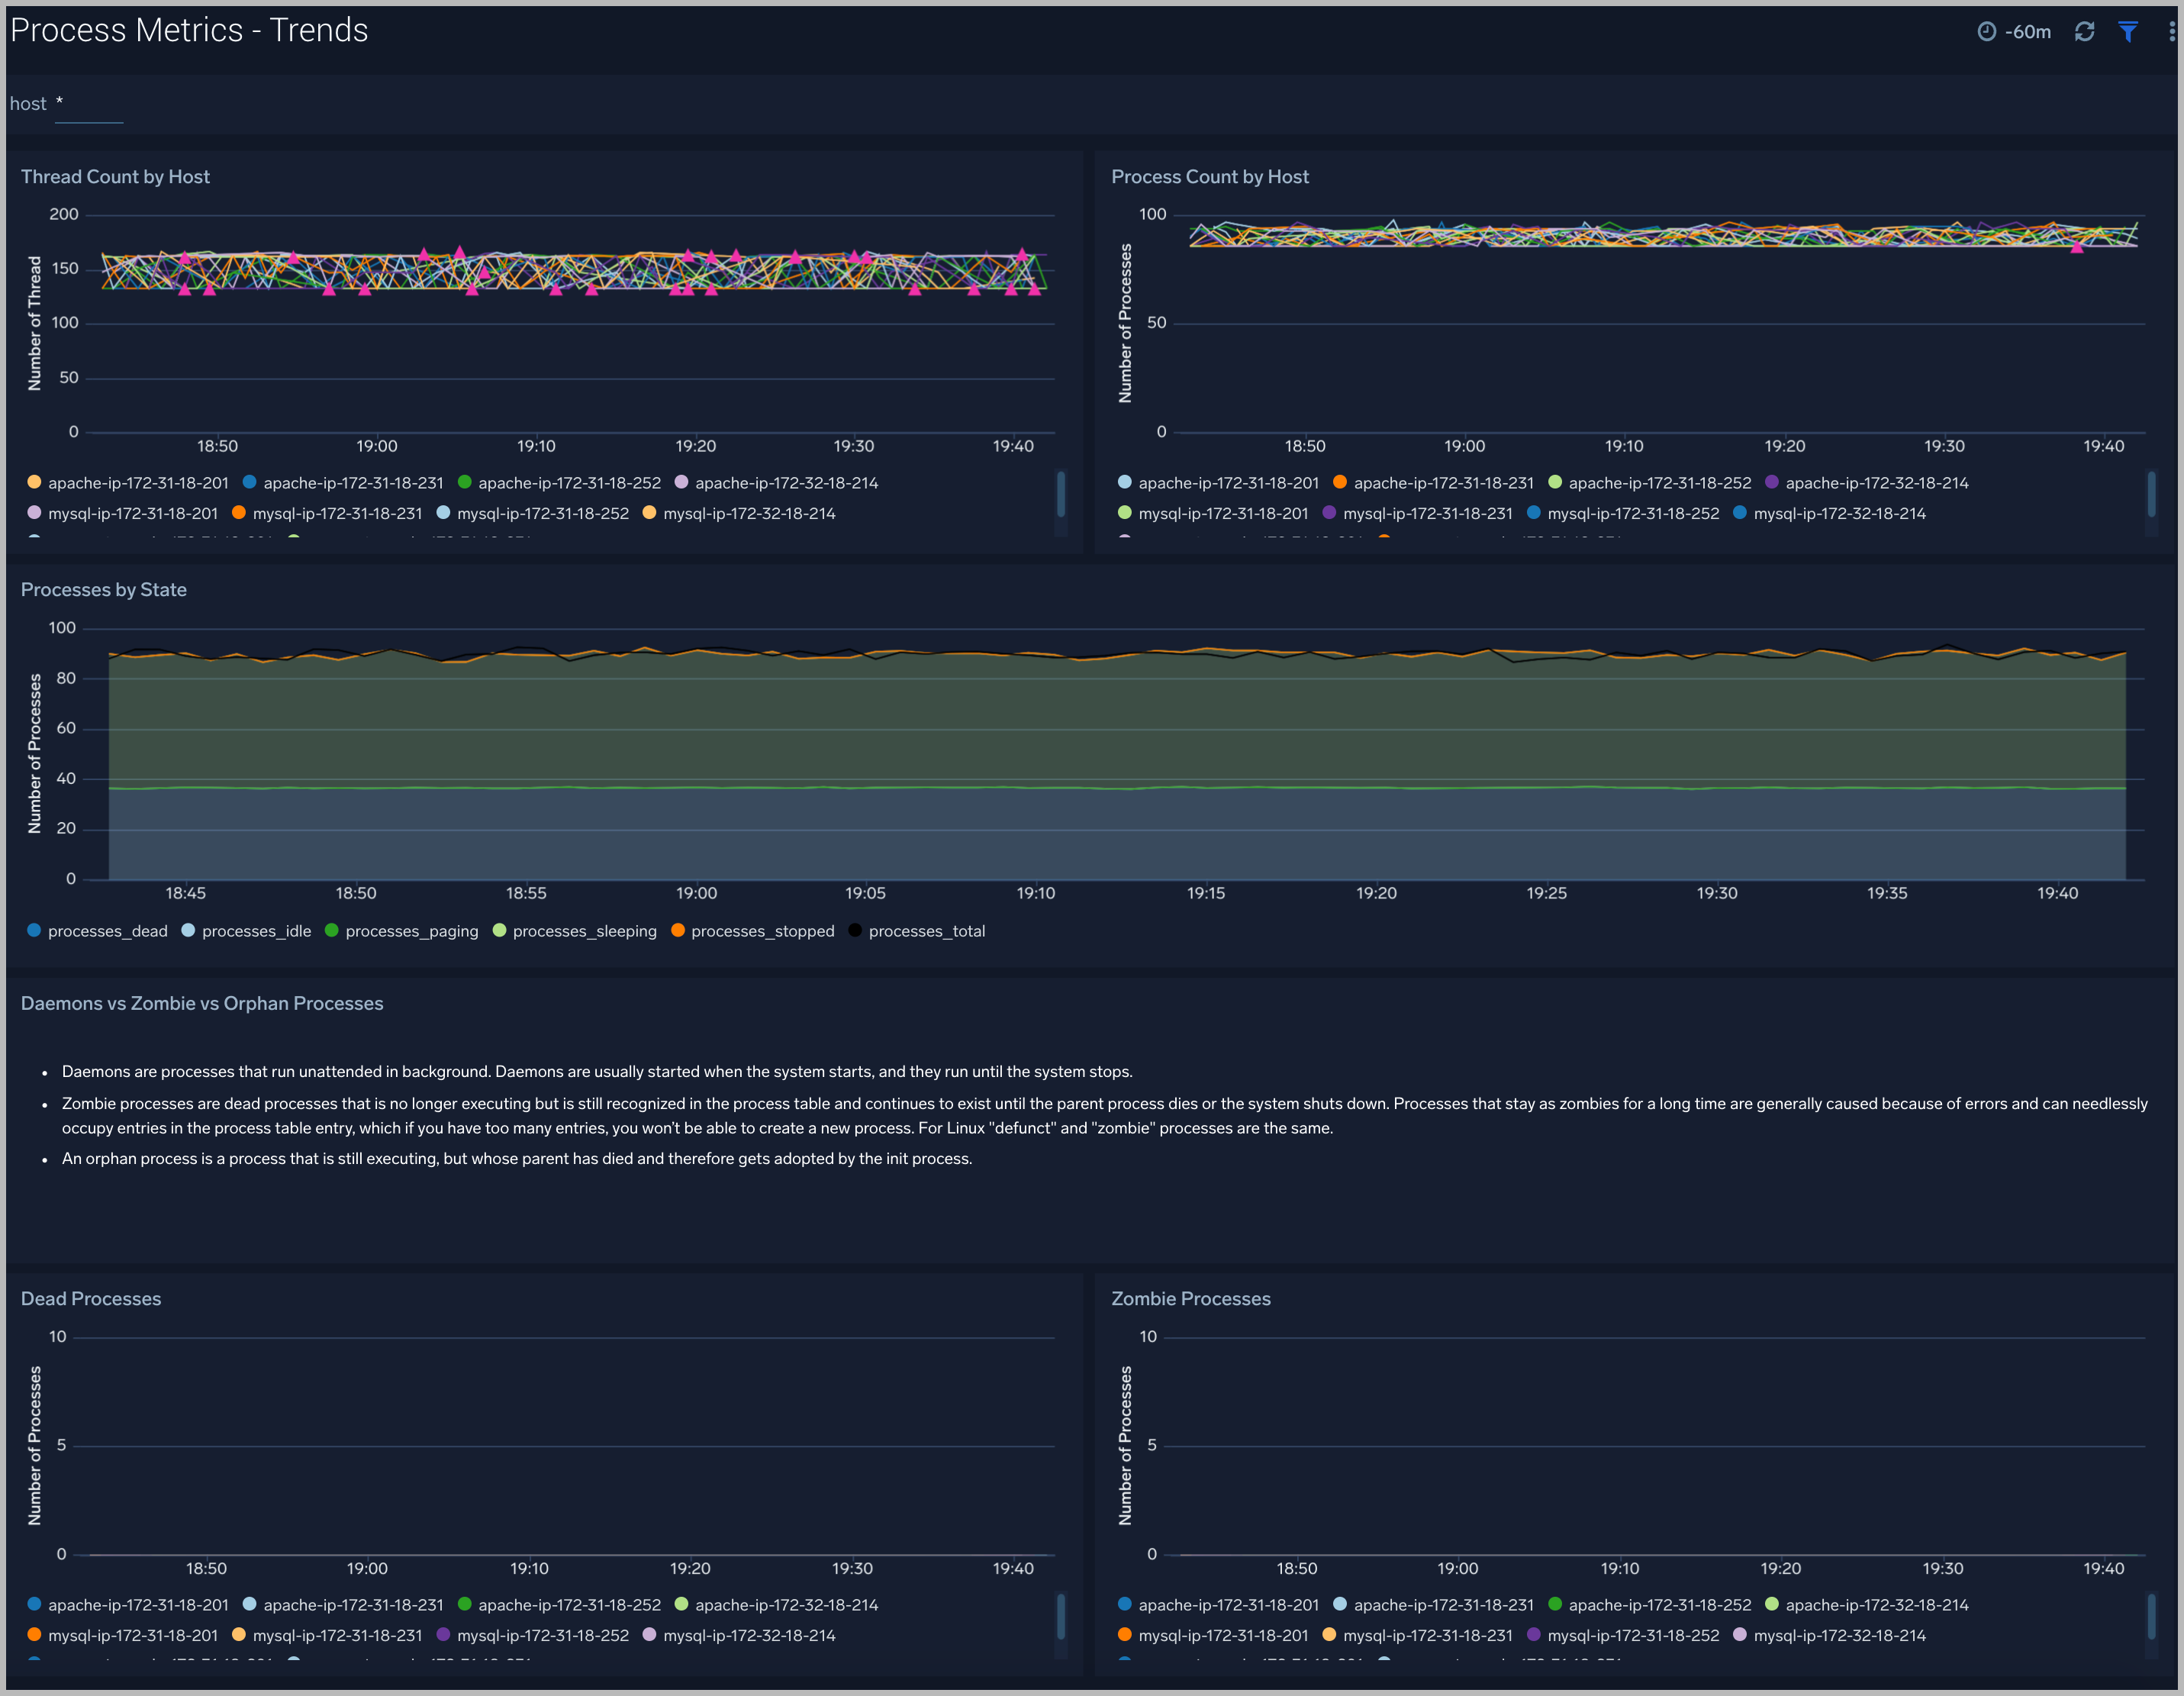
The Host and Process Metrics - Process Trends dashboard gives you insight into the state of your processes over time.
Use this dashboard to:
- Analyze the current state of all the processes (sleeping, dead, idle, stopped, total, paging)
- Identify anomalies over time in the number of threads, zombie processes, and total processes
Create monitors for the Host and Process Metrics app
From your App Catalog:
- From the Sumo Logic navigation, select App Catalog.
- In the Search Apps field, search for and then select your app.
- Make sure the app is installed.
- Navigate to What's Included tab and scroll down to the Monitors section.
- Click Create next to the pre-configured monitors. In the create monitors window, adjust the trigger conditions and notifications settings based on your requirements.
- Scroll down to Monitor Details.
- Under Location click on New Folder.
note
By default, monitor will be saved in the root folder. So to make the maintenance easier, create a new folder in the location of your choice.
- Enter Folder Name. Folder Description is optional.
tip
Using app version in the folder name will be helpful to determine the versioning for future updates.
- Click Create. Once the folder is created, click on Save.
Host and Process Metrics alerts
Host Metrics
| Name | Description | Alert Condition | Recover Condition |
|---|---|---|---|
Host and Process Metrics - High CPU Utilization | This alert is triggered when host CPU utilization exceeds the threshold (Warning: 80%, Critical: 90%). | > 90% (Critical) | <= 90% |
Host and Process Metrics - Host Out of Memory | This alert is triggered when memory utilization exceeds the threshold (Warning: 80%, Critical: 90%). | > 90% (Critical) | <= 90% |
Host and Process Metrics - Host Out of Disk Space | This alert is triggered when disk utilization exceeds the threshold (Warning: 80%, Critical: 90%). | > 90% (Critical) | <= 90% |
Host and Process Metrics - Host Out of Inodes | This alert is triggered when a host's filesystem is close to running out of available iNodes (Warning: 80%, Critical: 90%). | > 90% (Critical) | <= 90% |
Host and Process Metrics - Host Swap is Filling Up | This alert is triggered when swap utilization exceeds the threshold (Warning: 60%, Critical: 80%). | > 80% (Critical) | <= 80% |
Host and Process Metrics - Host Swap is Filling Up (Windows) | This alert is triggered when swap utilization exceeds the threshold for Windows machines (Warning: 60%, Critical: 80%). | > 80% (Critical) | <= 80% |
Host and Process Metrics - High Network Errors | This alert is triggered when a host has encountered network errors in the last five minutes. | > 200 (Critical) | <= 200 |
Host and Process Metrics - Unusual Disk Read Rate | This alert is triggered when the disk is reading an unusually high amount of data (> 50 MB/s) over a 5-minute time interval. | > 50 MB/s (Warning) | <= 50 MB/s |
Host and Process Metrics - Unusual Disk Write Rate | This alert is triggered when the disk is writing an unusually high amount of data (> 50 MB/s) over a 5-minute time interval. | > 50 MB/s (Warning) | <= 50 MB/s |
Host and Process Metrics - Unusual Network Throughput In | This alert is triggered when host network interfaces are receiving an unusually high amount of data (> 100 MB/s) over a 5-minute time interval. | > 100 MB/s (Warning) | <= 100 MB/s |
Host and Process Metrics - Unusual Network Throughput Out | This alert is triggered when host network interfaces are sending an unusually high amount of data (> 100 MB/s) over a 5-minute time interval. | > 100 MB/s (Warning) | <= 100 MB/s |
Host and Process Metrics - High CPU IO Wait | This alert is triggered when CPU I/O wait is high, indicating disk or network I/O bottlenecks causing the CPU to idle while waiting for operations to complete. | > 50% (Critical) | <= 50% |
Host and Process Metrics - High Disk IO | This alert is triggered when disk I/O operations in progress are high, indicating disk saturation that can lead to slow application response times and system degradation. | > 100 (Critical) | <= 100 |
Host and Process Metrics - High Network Packet Drops | This alert is triggered when network packet drops are high, indicating network congestion or buffer overflow leading to retransmissions and degraded application performance. | > 200 (Critical) | <= 200 |
Process Metrics
| Name | Description | Alert Condition | Recover Condition |
|---|---|---|---|
Host and Process Metrics - Process High CPU Usage | This alert is triggered when the CPU utilization of a process exceeds the threshold (Warning: 60%, Critical: 80%). | > 80% (Critical) | <= 80% |
Host and Process Metrics - Process High Memory Usage | This alert is triggered when the memory used by a process exceeds the threshold (Warning: 60%, Critical: 80%). | > 80% (Critical) | <= 80% |
Host and Process Metrics - Process High Open File Descriptors | This alert is triggered when the number of file descriptors used by a process exceeds the threshold (Warning: 800, Critical: 1000). | > 1000 (Critical) | <= 1000 |
Host and Process Metrics - Process High Page Faults | This alert is triggered when the rate of page faults exceeds the threshold (Warning: 800, Critical: 1000). | > 1000 (Critical) | <= 1000 |
Host and Process Metrics - Process High Read Rate | This alert is triggered when a process is reading an unusually high amount of data (> 20 MB/s) over a 5-minute time interval. | > 20 MB/s (Warning) | <= 20 MB/s |
Host and Process Metrics - Process High Write Rate | This alert is triggered when a process is writing an unusually high amount of data (> 20 MB/s) over a 5-minute time interval. | > 20 MB/s (Warning) | <= 20 MB/s |
Upgrade/Downgrade the Host and Process Metrics app (Optional)
To update the app, do the following:
Next-Gen App: To install or update the app, you must be an account administrator or a user with Manage Apps, Manage Monitors, Manage Fields, Manage Metric Rules, and Manage Collectors capabilities depending upon the different content types part of the app.
- Select App Catalog.
- In the Search Apps field, search for and then select your app.
Optionally, you can identify apps that can be upgraded in the Upgrade available section. - To upgrade the app, select Upgrade from the Manage dropdown.
- If the upgrade does not have any configuration or property changes, you will be redirected to the Preview & Done section.
- If the upgrade has any configuration or property changes, you will be redirected to the Setup Data page.
- In the Configure section of your respective app, complete the following fields.
- Field Name. If you already have collectors and sources set up, select the configured metadata field name (eg _sourcecategory) or specify other custom metadata (eg: _collector) along with its metadata Field Value.
- Click Next. You will be redirected to the Preview & Done section.
Post-update
Your upgraded app will be installed in the Installed Apps folder and dashboard panels will start to fill automatically.
See our Release Notes changelog for new updates in the app.
To revert the app to a previous version, do the following:
- Select App Catalog.
- In the Search Apps field, search for and then select your app.
- To version down the app, select Revert to < previous version of your app > from the Manage dropdown.
Uninstalling the Host and Process Metrics app (Optional)
To uninstall the app, do the following:
- Select App Catalog.
- In the 🔎 Search Apps field, run a search for your desired app, then select it.
- Click Uninstall.