Windows - OpenTelemetry Collector
The Sumo Logic app for Windows allows you to monitor the performance and resource utilization of hosts and processes that your mission-critical applications are dependent upon. In addition to that, our Windows app provides insight into your Windows system's operation and events so that you can better manage and maintain your environment.
The Windows app, which is based on the Windows event log format, consists of predefined searches and dashboards that provide visibility into your environment for real-time analysis of overall usage of Security Status, System Activity, Updates, User Activity, and applications. Our dashboards provide insight into CPU, memory, network, file descriptors, page faults, and TCP connectors.
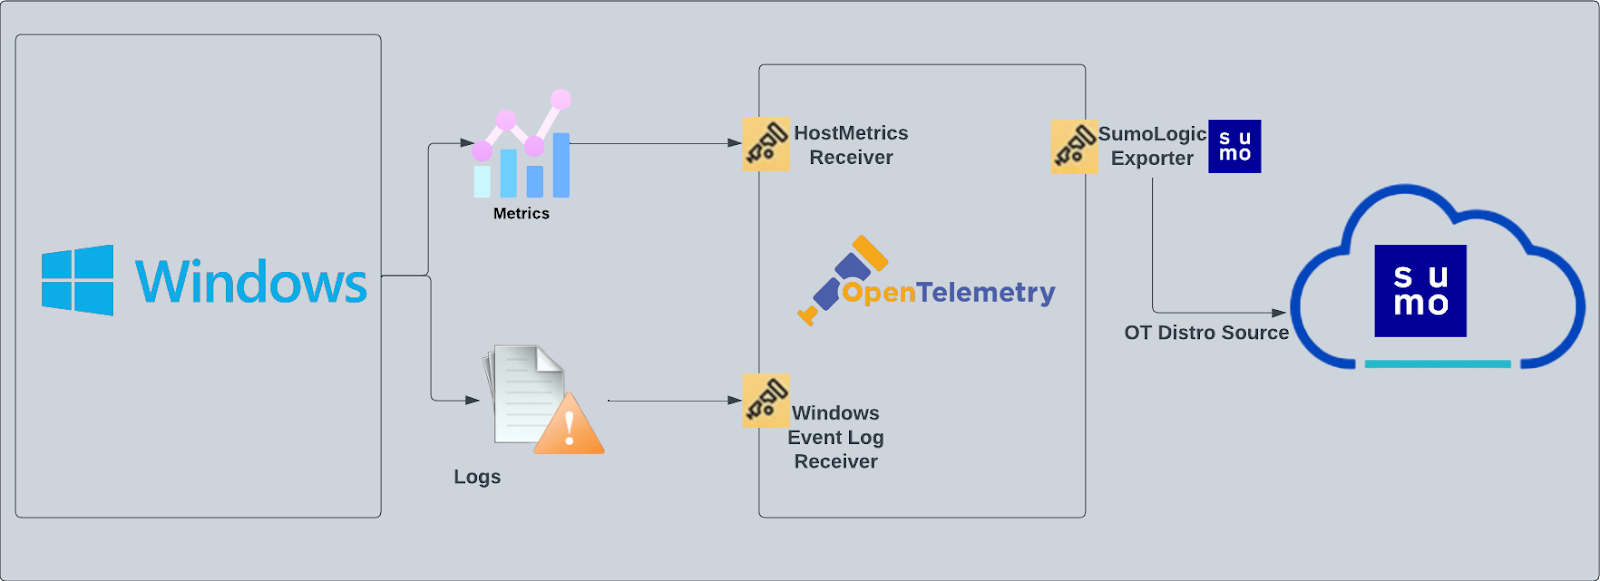
- Windows event logs are sent to Sumo Logic through OpenTelemetry Event Log receiver.
- Windows Host metrics are sent to Sumo Logic through OpenTelemetry Host Metrics receiver.
This app includes built-in monitors. For details on creating custom monitors, refer to Create monitors for Windows app.
Fields Created in Sumo Logic for Windows
Following are the fields which will be created as part of Windows app install if not already present.
sumo.datasource. Has a fixed value ofwindows.deployment.environment. This is a collector level field and is user configured (at the time of collector installation). Through this, the Windows host cluster is identified by the environment where it resides. For example:dev,prod, orqa.host.group. This is a collector level field and is user configured (at the time of collector installation). Through this, the Windows host group is identified.host.name. This is tagged through theresourcedetectionprocessor. It holds the value of the host name where the OTel collector is installed.
Log types
The Windows app assumes events are coming from Windows Event Log receiver in JSON format. It does not work with third party logs.
Standard Windows event channels include:
- Security
- System
- application
Collection configuration and app installation
You can skip this section if you have already set up the logs collection through Windows PCI, Windows - Cloud Security Monitoring and Analytics, or Active Directory app installation. Additional collection is not required as the logs used by this app are already ingested into Sumo Logic.
Follow these steps to set up and deploy the source template to collect data in Sumo Logic from a remotely managed OpenTelemetry collector.
Step 1: Set up remotely managed OpenTelemetry collector
If you want to configure your source locally, you can do so by downloading the YAML file. For details, see Configure OpenTelemetry collectors locally.
In this step, we'll install remotely managed OpenTelemetry collector and add a uniquely identifiable tag to these collectors.
- Classic UI. In the main Sumo Logic menu, Select App Catalog.
New UI. In the Sumo Logic main menu select App Catalog. - In the 🔎 Search Apps field, run a search for your desired OpenTelemetry app, then select it. For example, Apache - OpenTelemetry.
- Click the Manage dropdown and then select Add Collection.
- On the Set Up Collector page, select Add a New Collector and then click Next.
If you want to use an existing OpenTelemetry Collector, you can skip this step by selecting the Use an existing Collector option.
- Select the platform where you want to install the Sumo Logic OpenTelemetry Collector. For example, Linux.
This will generate a command that you can execute in the machine environment you need to monitor. Once executed, it will install the Sumo Logic OpenTelemetry Collector.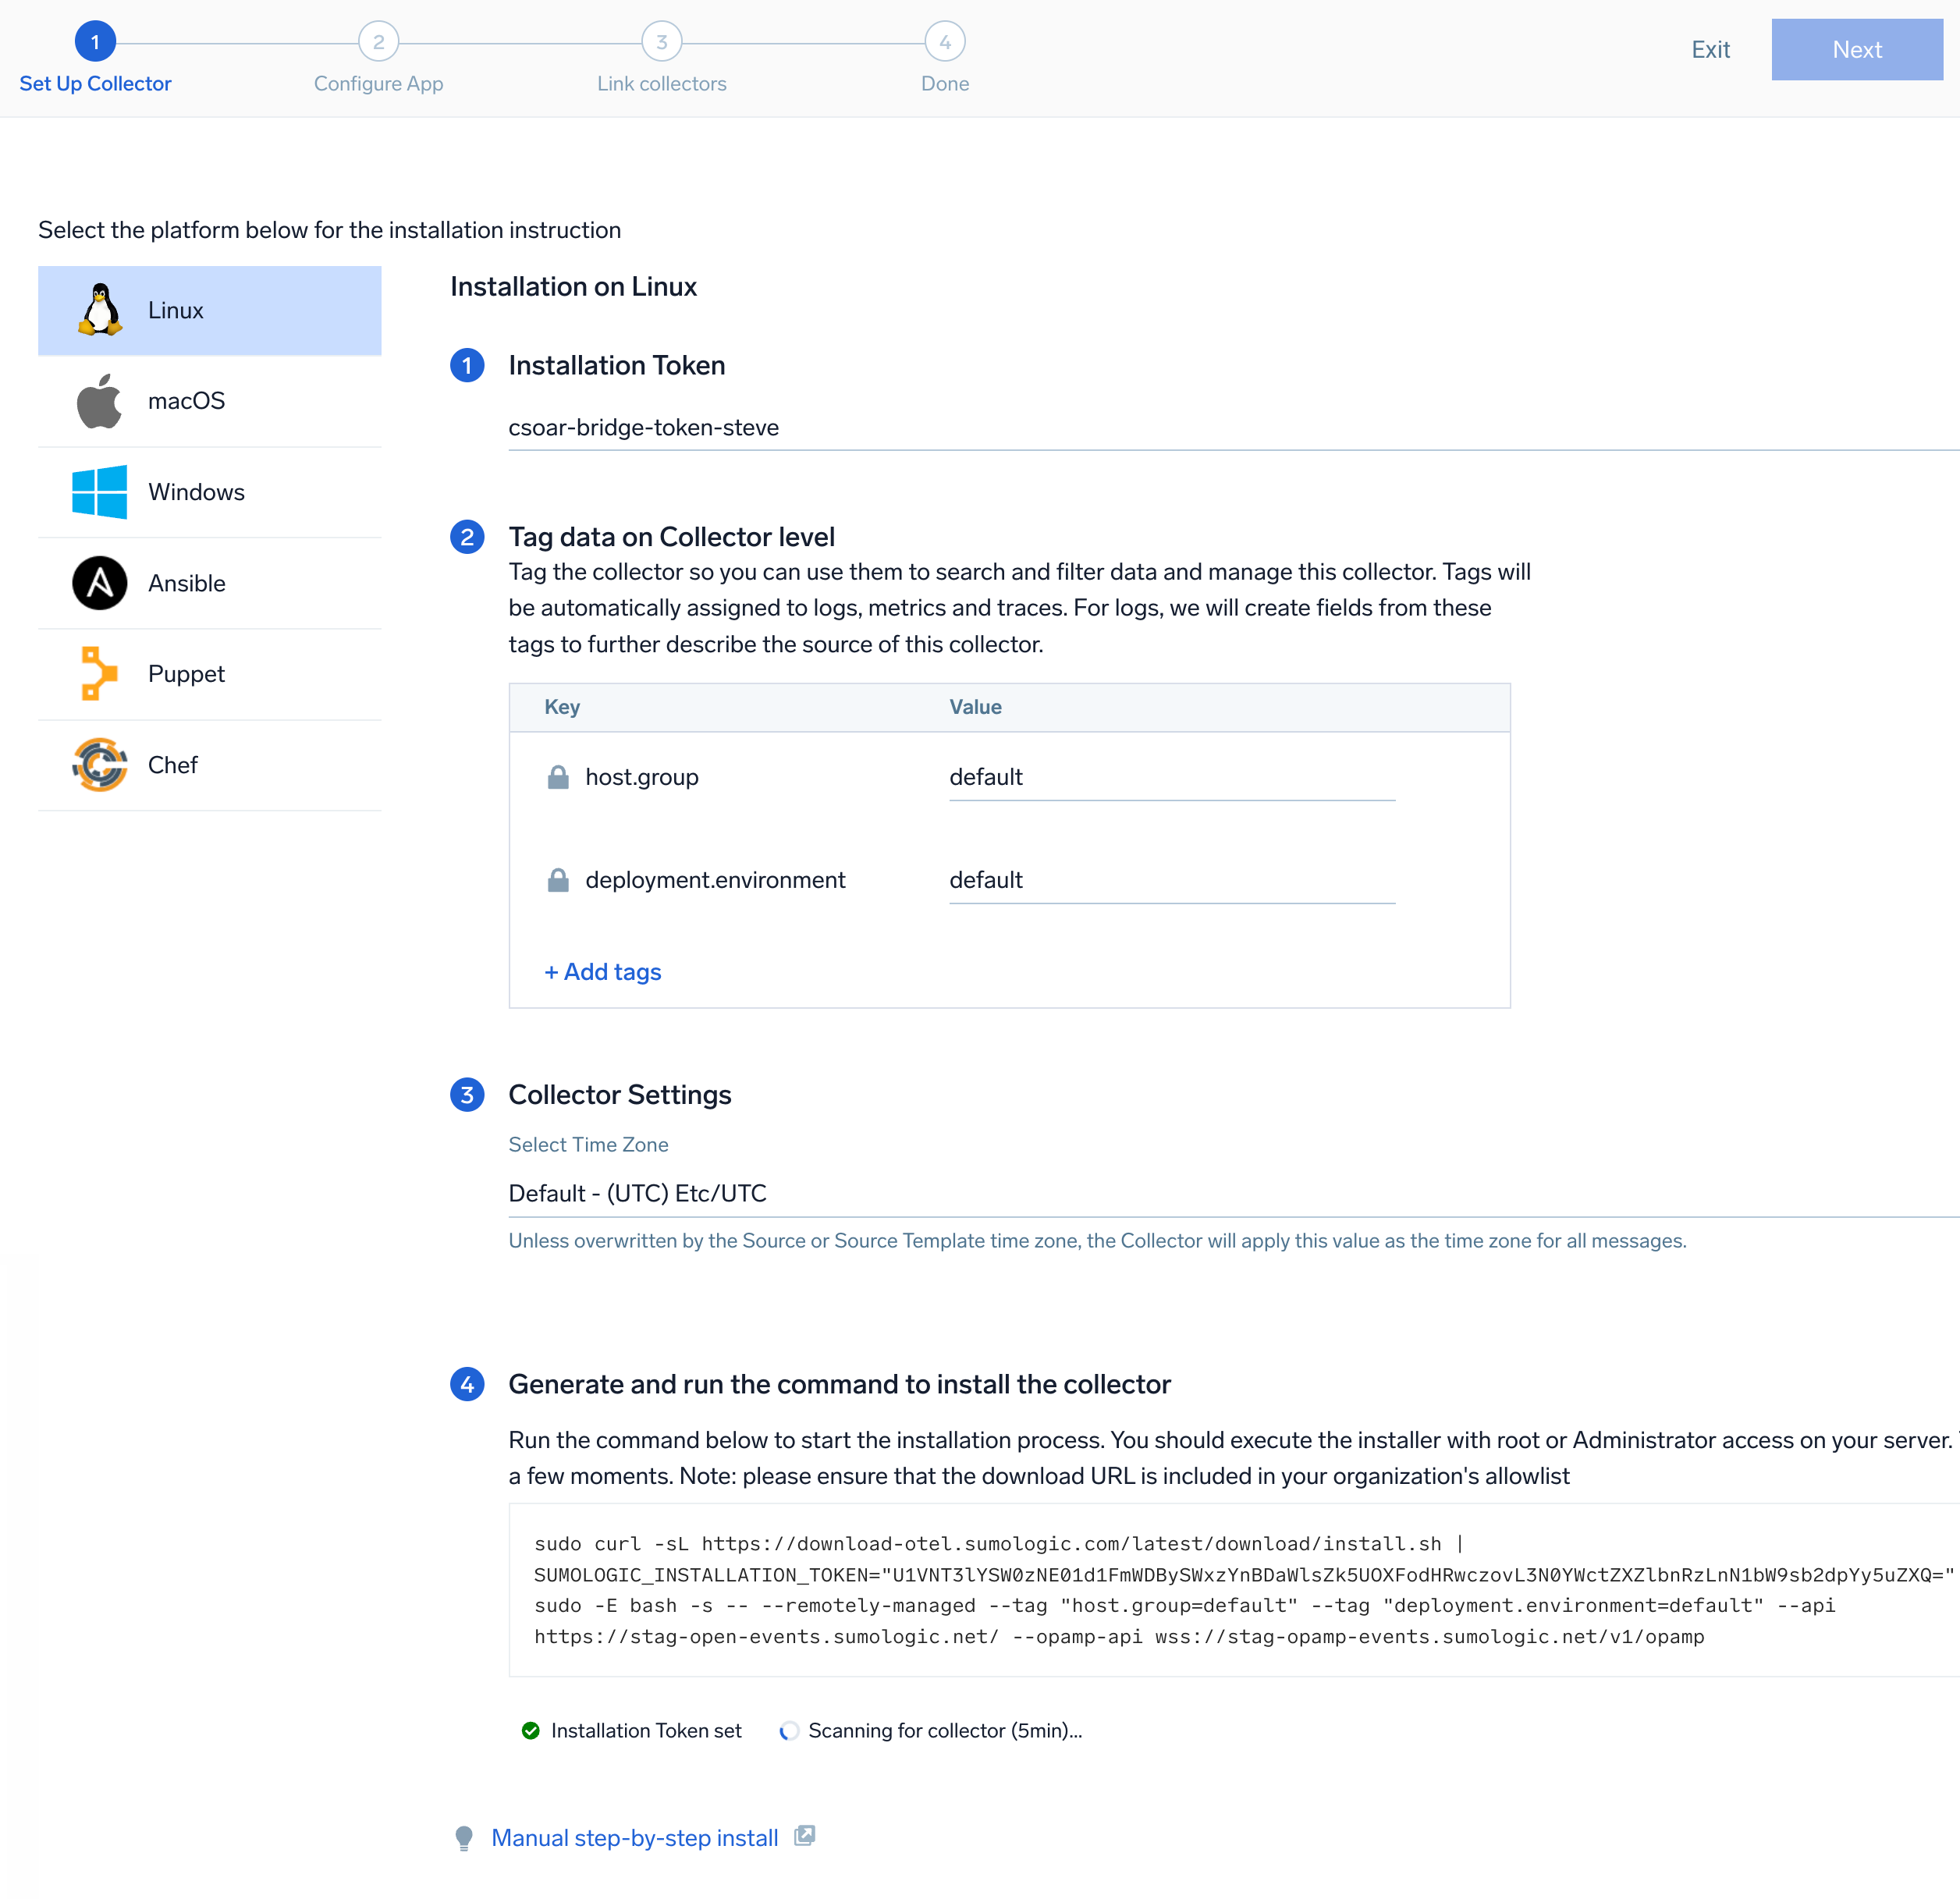 The installation commands now include a
 --remotely-managedflag. When this flag is used, a remotely managed collector is installed automatically instead of a locally managed one. If you prefer to use a locally managed collector, simply remove the flag from the installation command.
Step 2: Configure the source template
In this step, you will configure the YAML required for Windows collection. Below are the inputs required for configuration:
- Name. Name of the source template.
- Description. Description for the source template.
Logs collection
- Fields/Metadata. You can provide any customer fields to be tagged with the data collected. By default, Sumo Logic tags
_sourceCategorywith the valueotel/windows. - Windows Event. In this section you can select choose among the most widely used Windows event channel for which Windows event log collection will be enabled. You can also provide Custom Event Channels providing any customer event channel for which event logs are to be collected.
- Forward to SIEM. Check the checkbox to forward your data to Cloud SIEM.
Metrics collection
- Metrics. Select the metric scrappers you want to enable. By default, metric collection for CPU, memory, disk, load, file system, network and paging are enabled, and process metric collection is disabled.
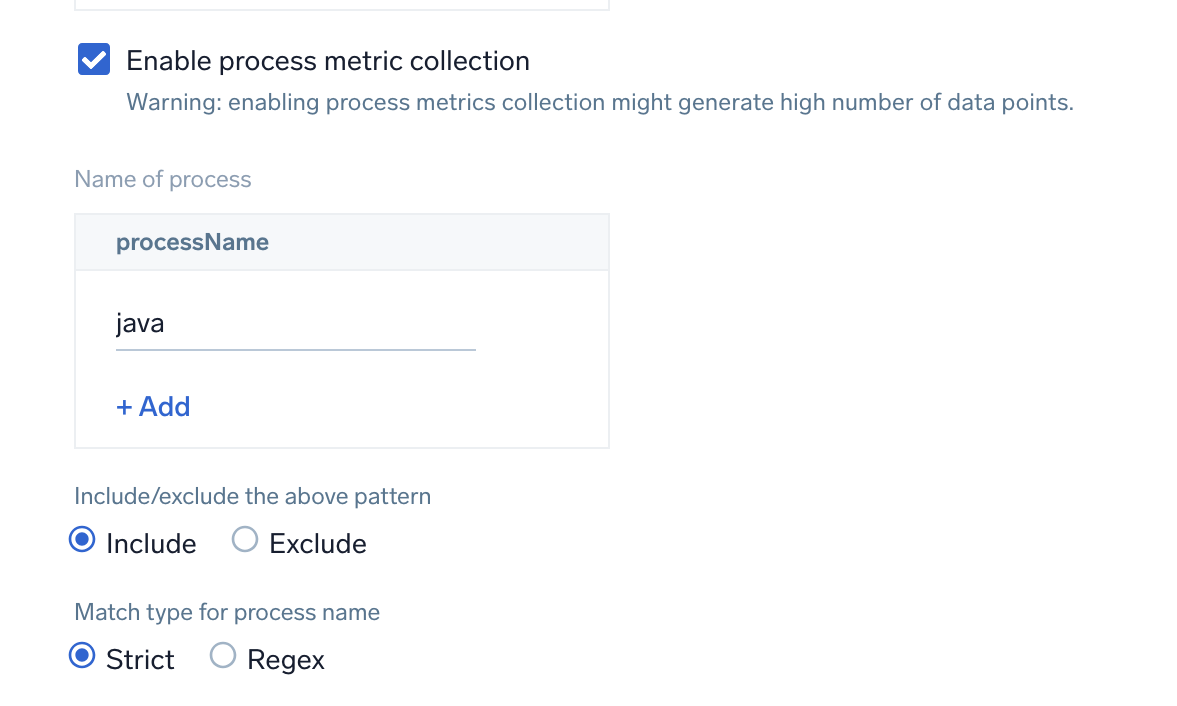
Enable process metric collection (optional)
By default, the collector will not send process metrics to Sumo Logic. This is because the number of processes running on a host can be very large, which would result in a significant increase in Data Points per Minute (DPM).
Click the Enable process metric collection checkbox to collect process-level metrics.
- Name of process. Add the list of process names.
- Include/Exclude the above pattern. Signifies if you want to exclude or include the metrics for the processes listed previously.
- Match type for process name. Select if the process name given should be considered for a strict match with the host machine processes or if it should be considered as regex when matching.
If you need to edit the process list in the future, you can do this manually in the OTEL config yaml by adding or removing in the names list under process scrapper.
process:
  include:
    names: [ <process name1>, <process name2> ... ]
    match_type: <strict|regexp>
- Scan Interval. The frequency at which the source is scanned.
- Processing Rules. You can add processing rules for logs/metrics collected. To learn more, refer to Processing Rules. For masking windows event logs, refer to Mask Rules for Windows Source Template.
Step 3: Push the source template to the desired remotely managed collectors
A new source template will always be created with the latest version of the source template.
Follow the below steps to create a data collection configuration to gather the required logs and link them to all the collectors with the help of collector tags.
- Complete the source template form with the name and file path for your logs (for example, error logs or access logs), then click Next.
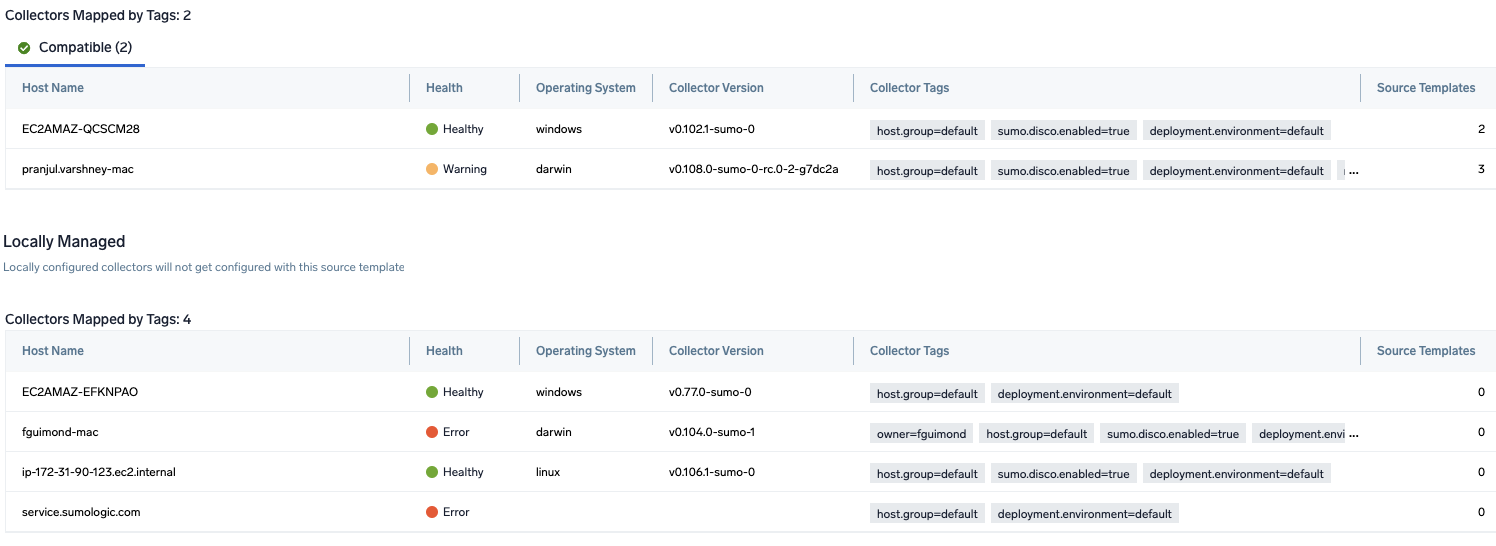
- Under Link Collectors, you will have the option to link the collectors using the collector name or by adding tags to find the group of collectors (for example,
application = Apache).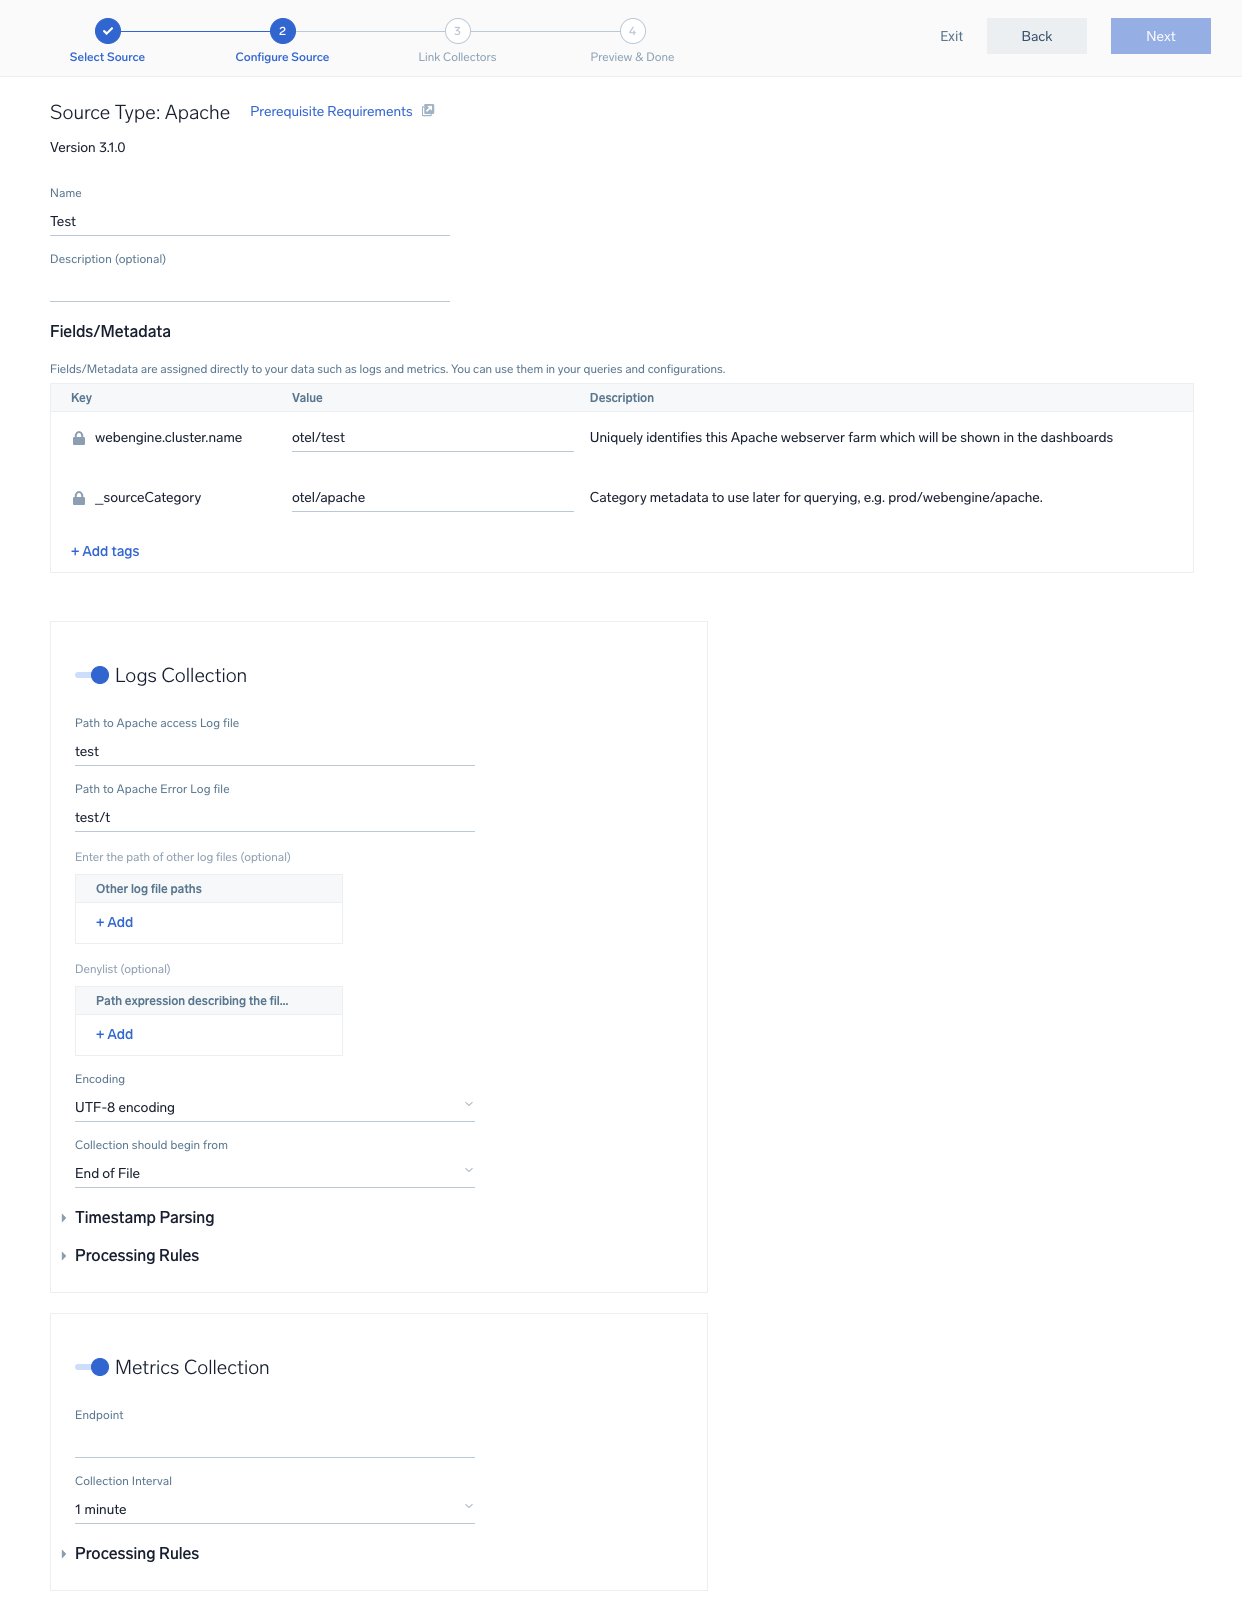
- Preview and confirm the collectors that will be linked (fetched automatically) to the newly created source template.
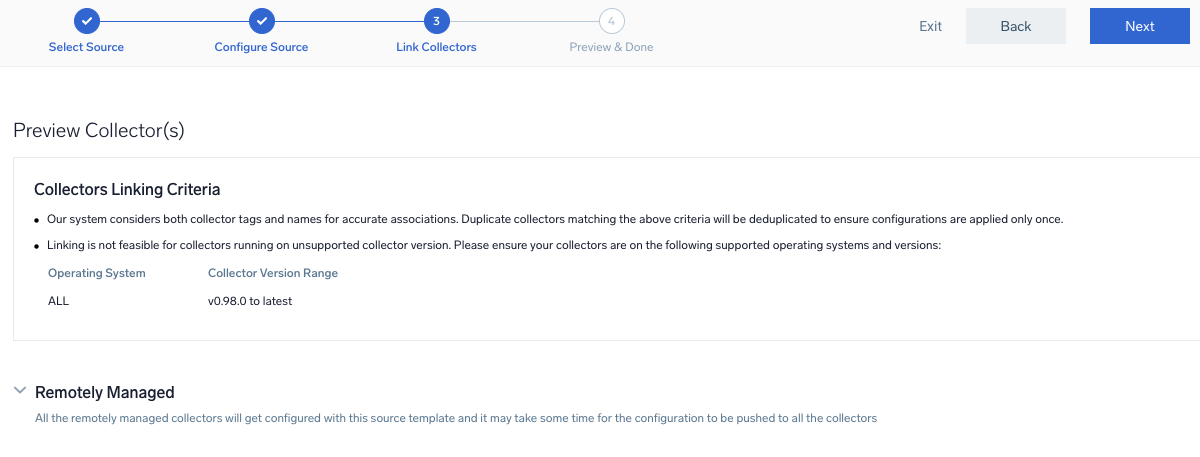
- Click Next to complete the source template creation. In the background, the system will apply the configuration to all the linked collectors and will start collecting the respective telemetry data from the remote host (in the example, it would start collecting Apache error logs).
- Click the Log Search or Metrics Search icons to search for and analyze your data collected for this source template.
If you receive an error during installation that includes the message failed to bind to address localhost, change all instances of localhost to 127.0.0.1 in the YAML file.
Sample log messages
{
	"record_id":"6316",
	"channel":"Application",
	"event_data":"",
	"task":"0",
	"provider":"{\"name\":\"Microsoft-Windows-Security-SPP\",\"guid\":\"{E23B33B0-C8C9-472C-A5F9-F2BDFEA0F156}\",\"event_source\":\"Software Protection Platform Service\"}",
	"system_time":"2023-01-20T15:22:02+0000816Z",
	"computer":"EC2AMAZ-T30T53R",
	"opcode":"0",
	"keywords":"Classic",
	"message":"Offline downlevel migration succeeded.",
	"event_id":"{\"id\":\"16394\",\"qualifiers\":\"49152\"}",
	"level":"Information"
}
Sample metrics message
{
	"queryId":"A",
	"_source":"windows-otel-metric",
	"_metricId":"tYzy7VHWrdxuGHOkPRT5pA",
	"_sourceName":"Http Input",
	"os.type":"windows",
	"sumo.datasource":"windows",
	"direction":"transmit",
	"_sourceCategory":"Labs/windows-otel",
	"_contentType":"Carbon2",
	"host.name":"EC2AMAZ-T30T53R.ec2.internal",
	"metric":"system.network.io",
	"_collectorId":"000000000CEC8ECC",
	"_sourceId":"0000000044DB46EF",
	"unit":"By",
	"_collector":"Labs - windows-otel",
	"device":"Loopback_Pseudo-Interface_1",
	"max":289495780,
	"min":0,
	"avg":229918329.73,
	"sum":3448774946,
	"latest":289485558,
	"count":15
}
Sample queries
This is a sample metrics query from the CPU User Time panel in the Host Metric - CPU dashboard.
sumo.datasource=windows host.name={{host.name}} cpu=cpu0 metric=system.cpu.utilization state=user | avg by host.name
This is a sample log query from the System Restarts panel in the Windows - Overview dashboard.
%"sumo.datasource"=windows  "\"channel\":\"Security\""
| json "event_id", "computer", "message", "channel" as event_id_obj, host.name, msg_summary, channel nodrop
| json field=event_id_obj "id" as event_id
| parse regex field=msg_summary "(?<msg_summary>.*\.*)" nodrop
| where event_id = "4608" and channel = "Security" and host.name matches "{{host.name}}"
| count as Restarts
Viewing the Windows event log based dashboards
All dashboards have a set of filters that you can apply to the entire dashboard. Use these filters to drill down and examine the data to a granular level.
- You can change the time range for a dashboard or panel by selecting a predefined interval from a drop-down list, choosing a recently used time range, or specifying custom dates and times. Learn more.
- You can use template variables to drill down and examine the data on a granular level. For more information, see Filtering Dashboards with Template Variables.
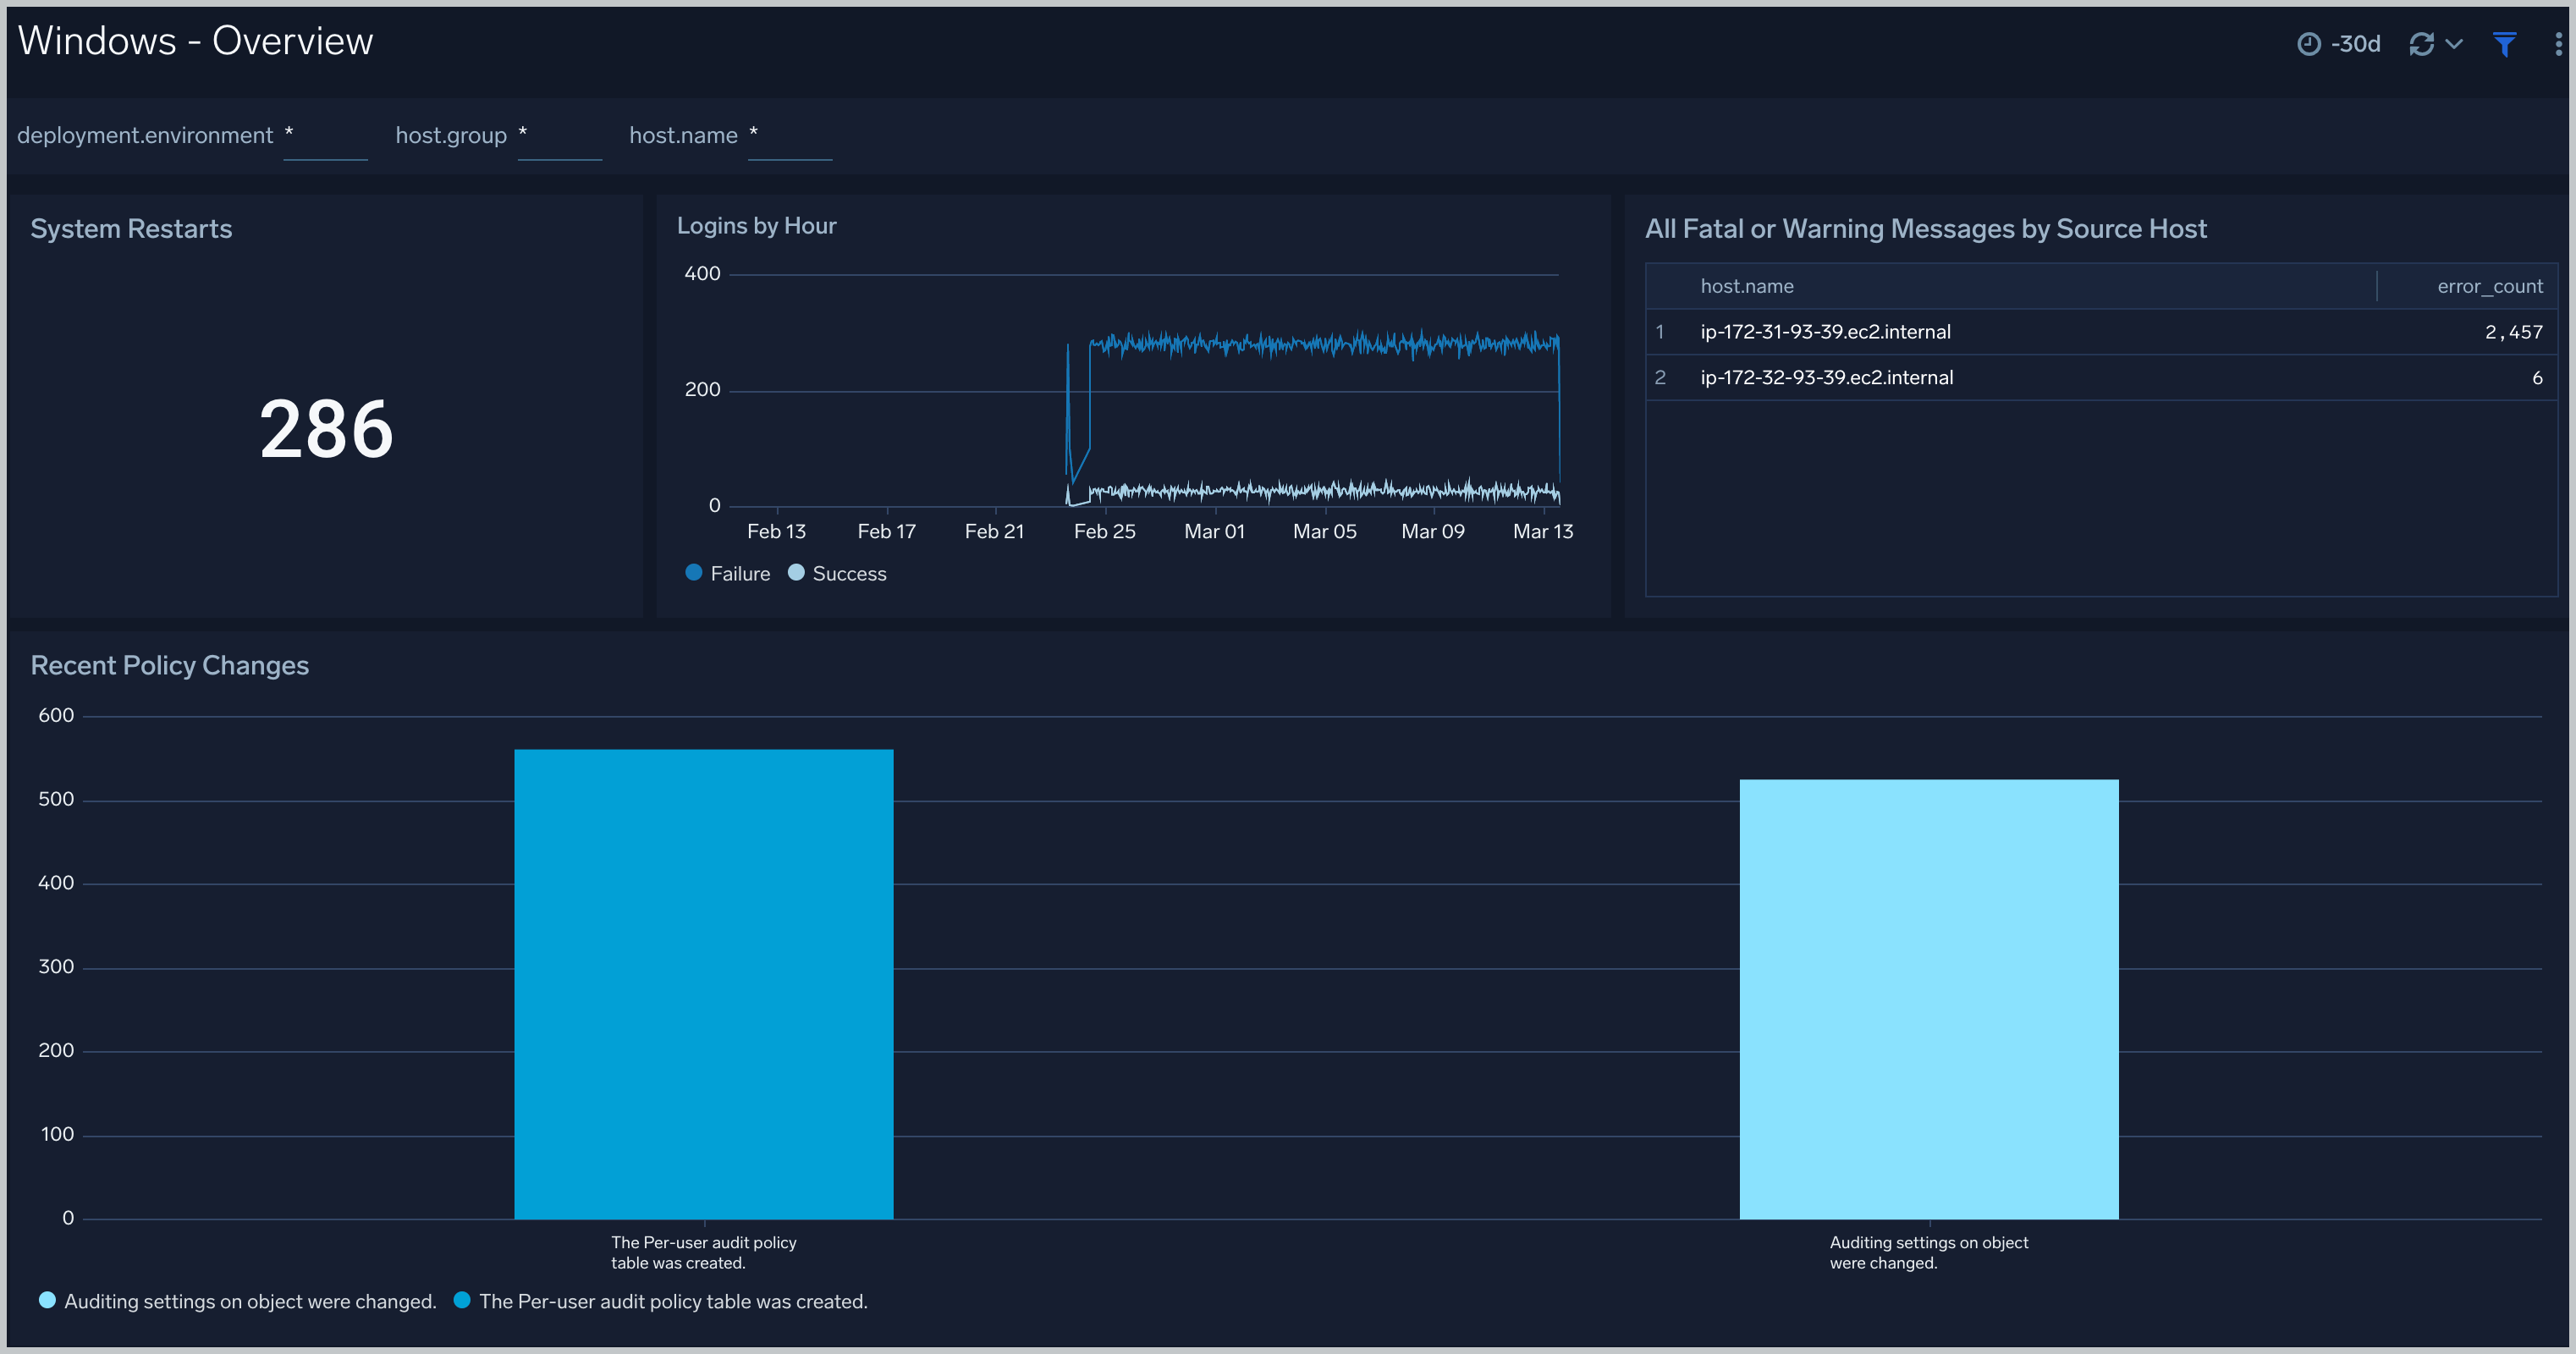
Windows - Overview
The Windows - Overview dashboard provides insights into fatal or warning messages, policy changes, system restarts, and changes to administrative groups.
Use this dashboard to:
- Monitor systems experiencing fatal errors, warnings, and system restarts.
- View system login attempts.
- Monitor policy changes performed on the system.
- Monitor services installed on the systems.
- Monitor the number of changes performed on the Administrative groups.
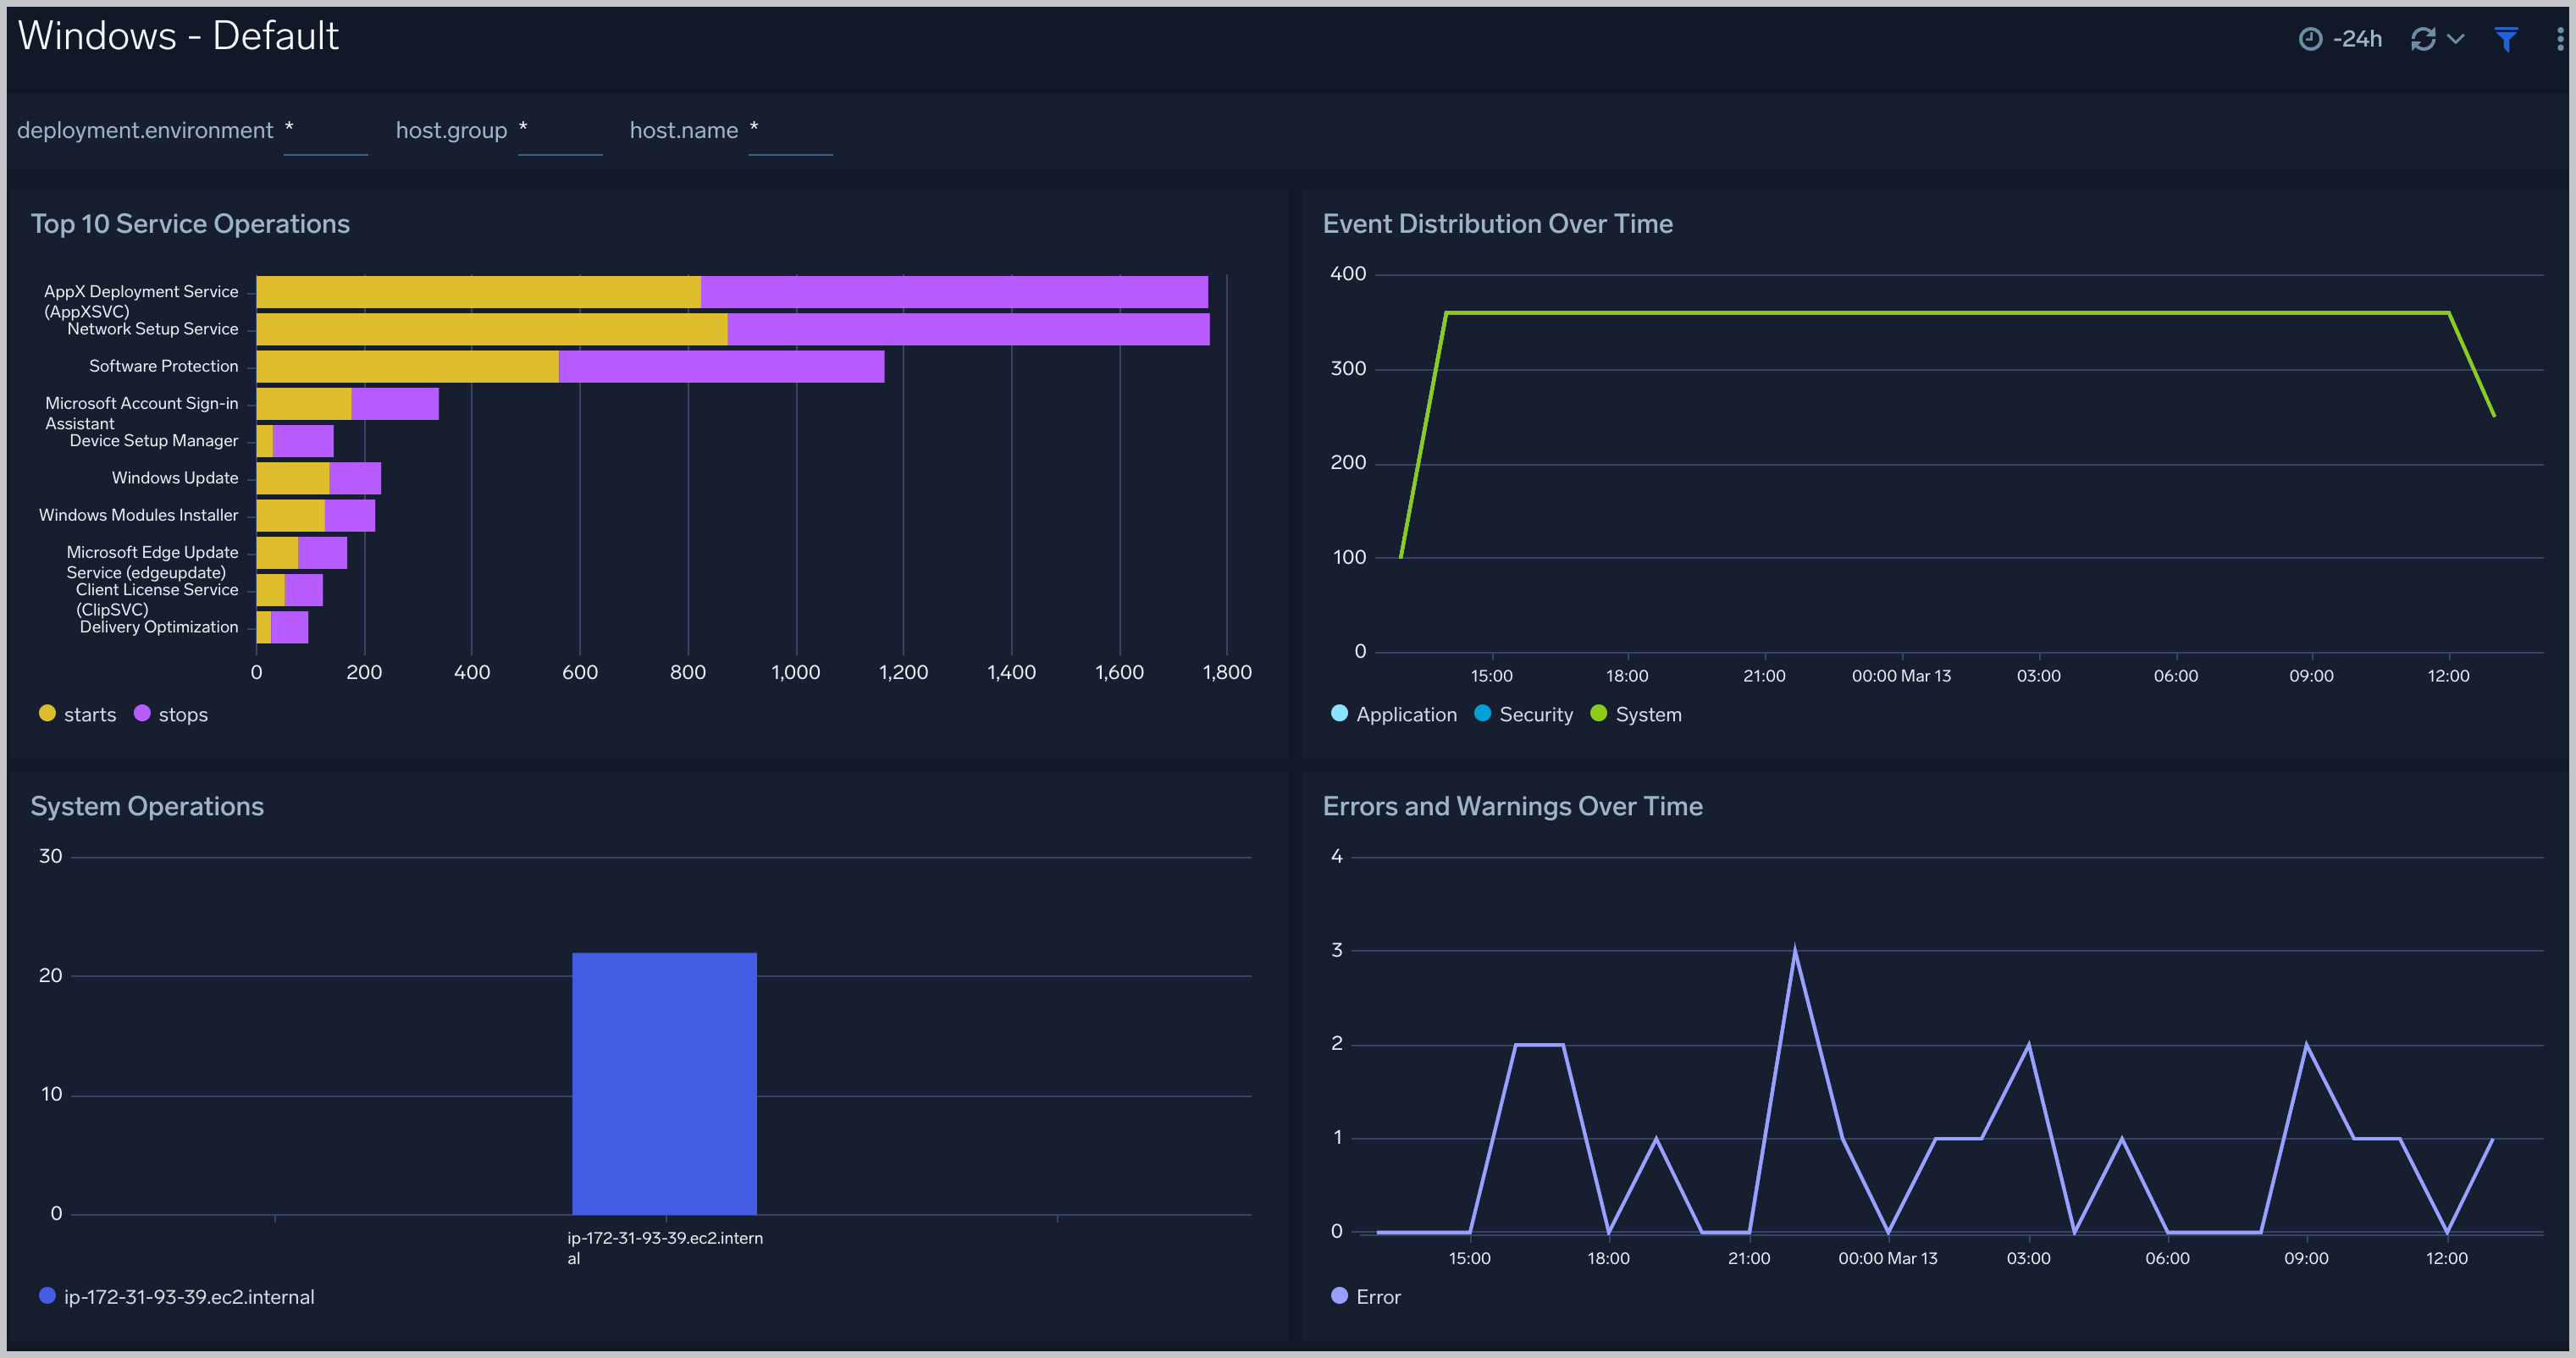
Windows - Default
The Windows - Default dashboard provides information about the start and stop operations for Windows services, Windows events, operations events, and Errors and Warnings.
Use this dashboard to:
- Monitor services being stopped, started on the system.
- Monitor event types (channels) collected from the system.
- Monitor log level (error, warning) trend on the systems.
- Monitor operations performed on the system like restarts, user creation, group creation, and firewall changes.
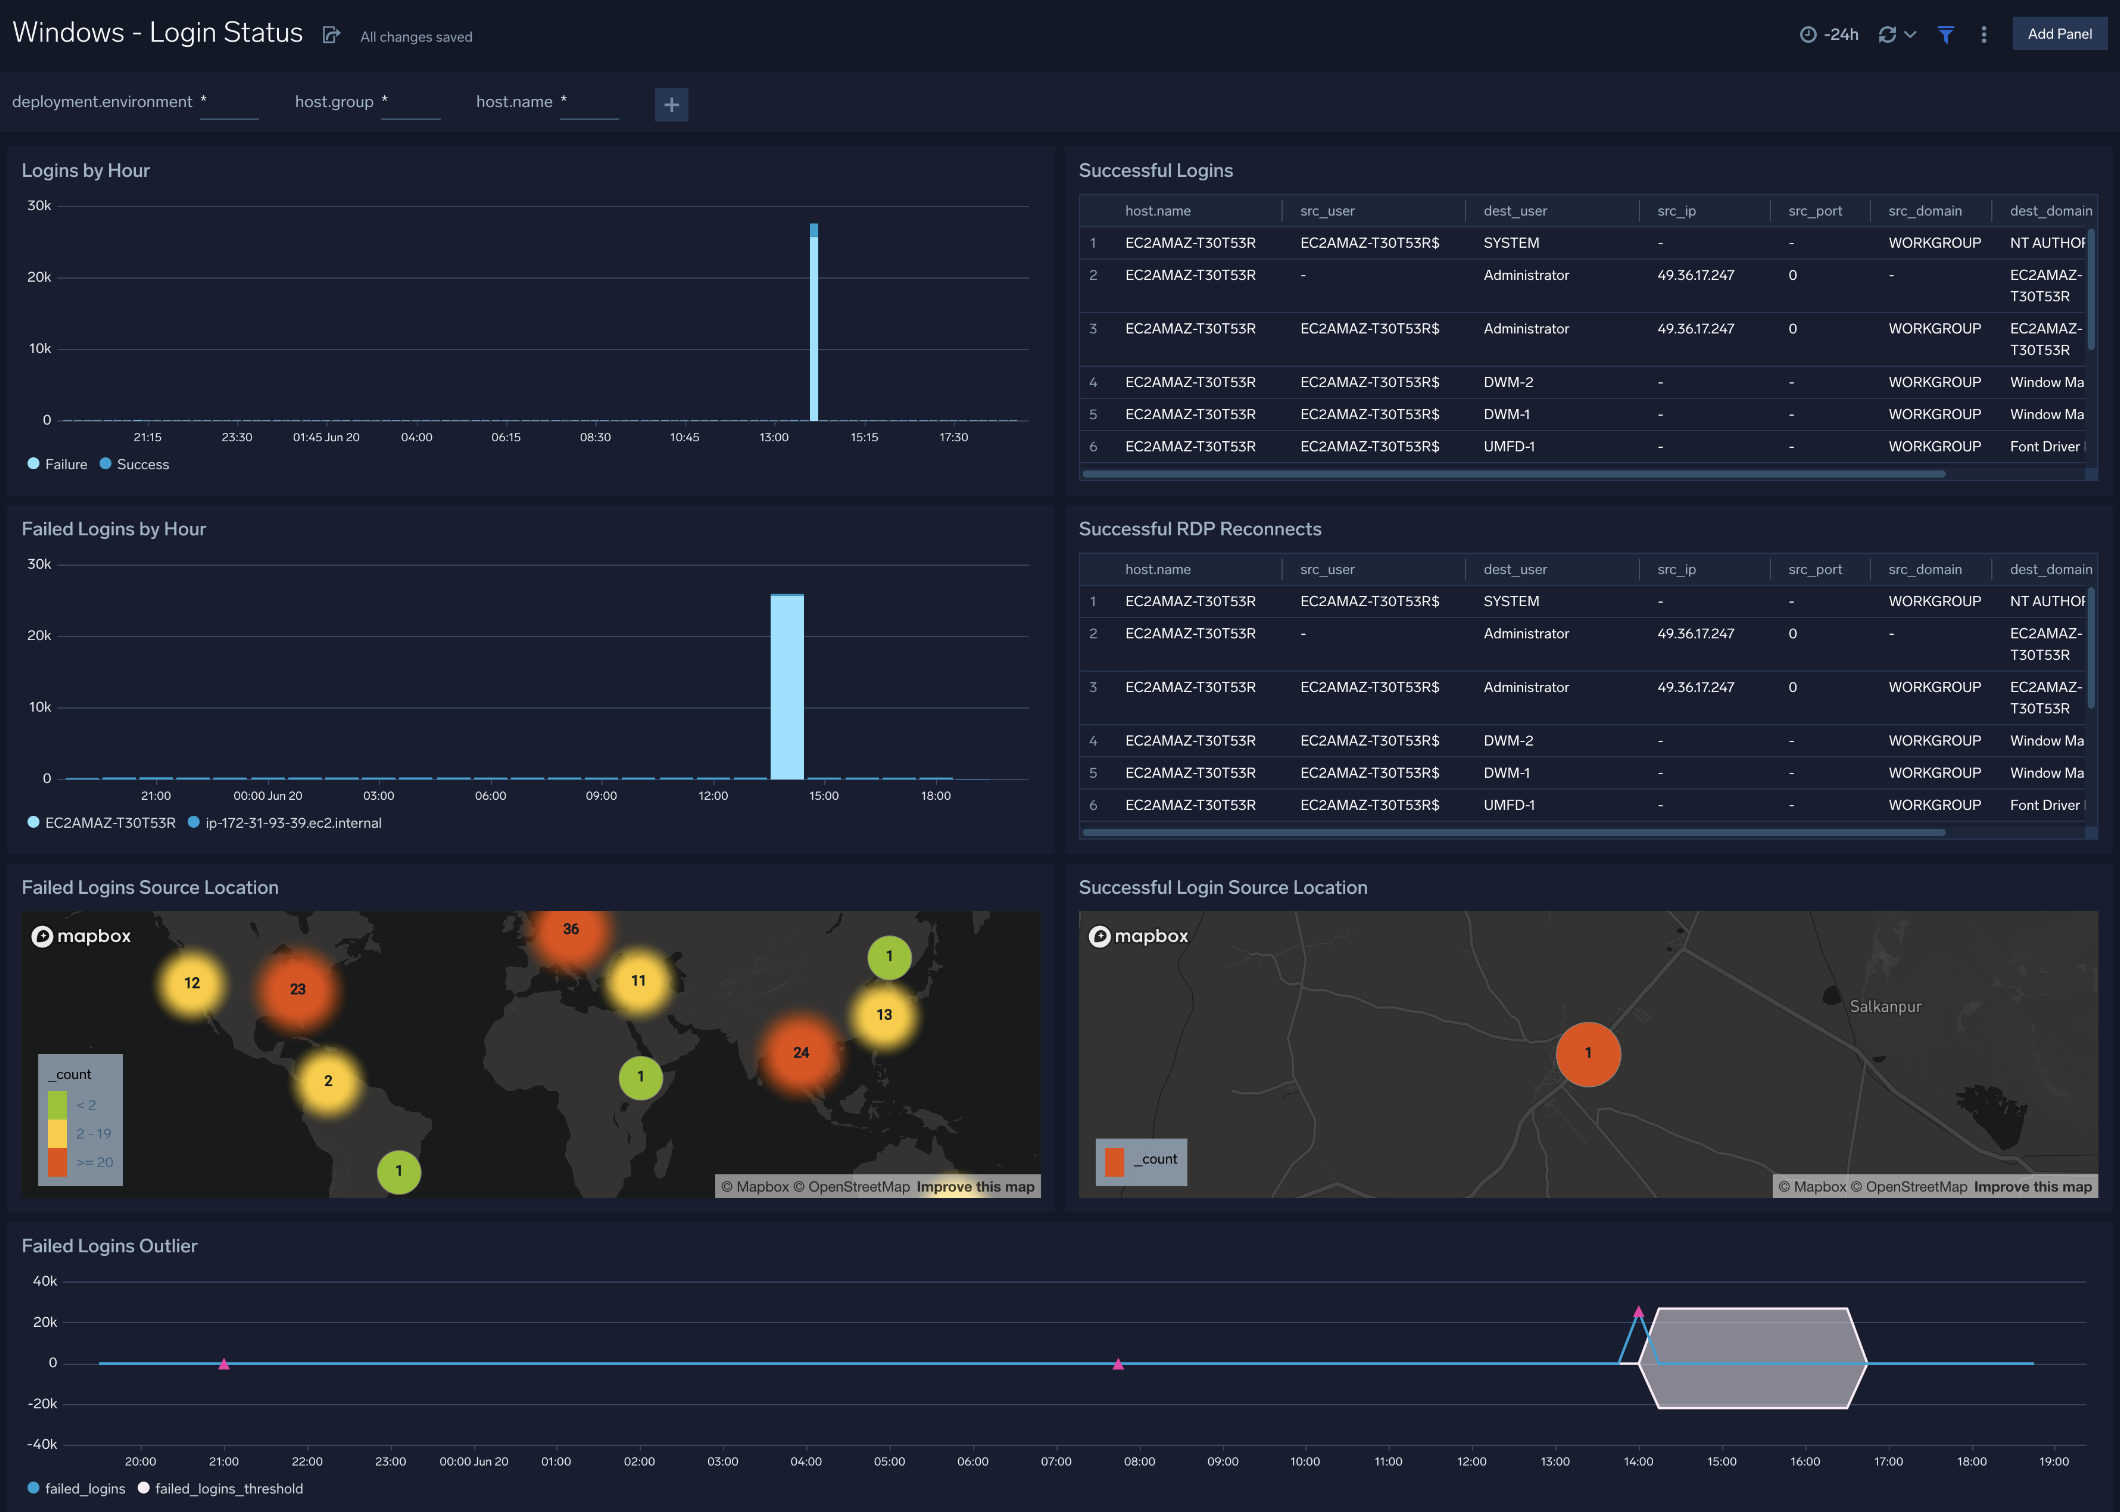
Windows - Login Status
The Windows - Login Status dashboard provides information about successful and failed logins, successful Remote Desktop Protocol (RDP) reconnects, and failed login outliers.
Use this dashboard to:
- Monitor successful and failed logins by the user and track their locations with successful and failed login attempts.
- Monitor RDP reconnect events.
- Track failed login outliers to identify mischievous login activities.
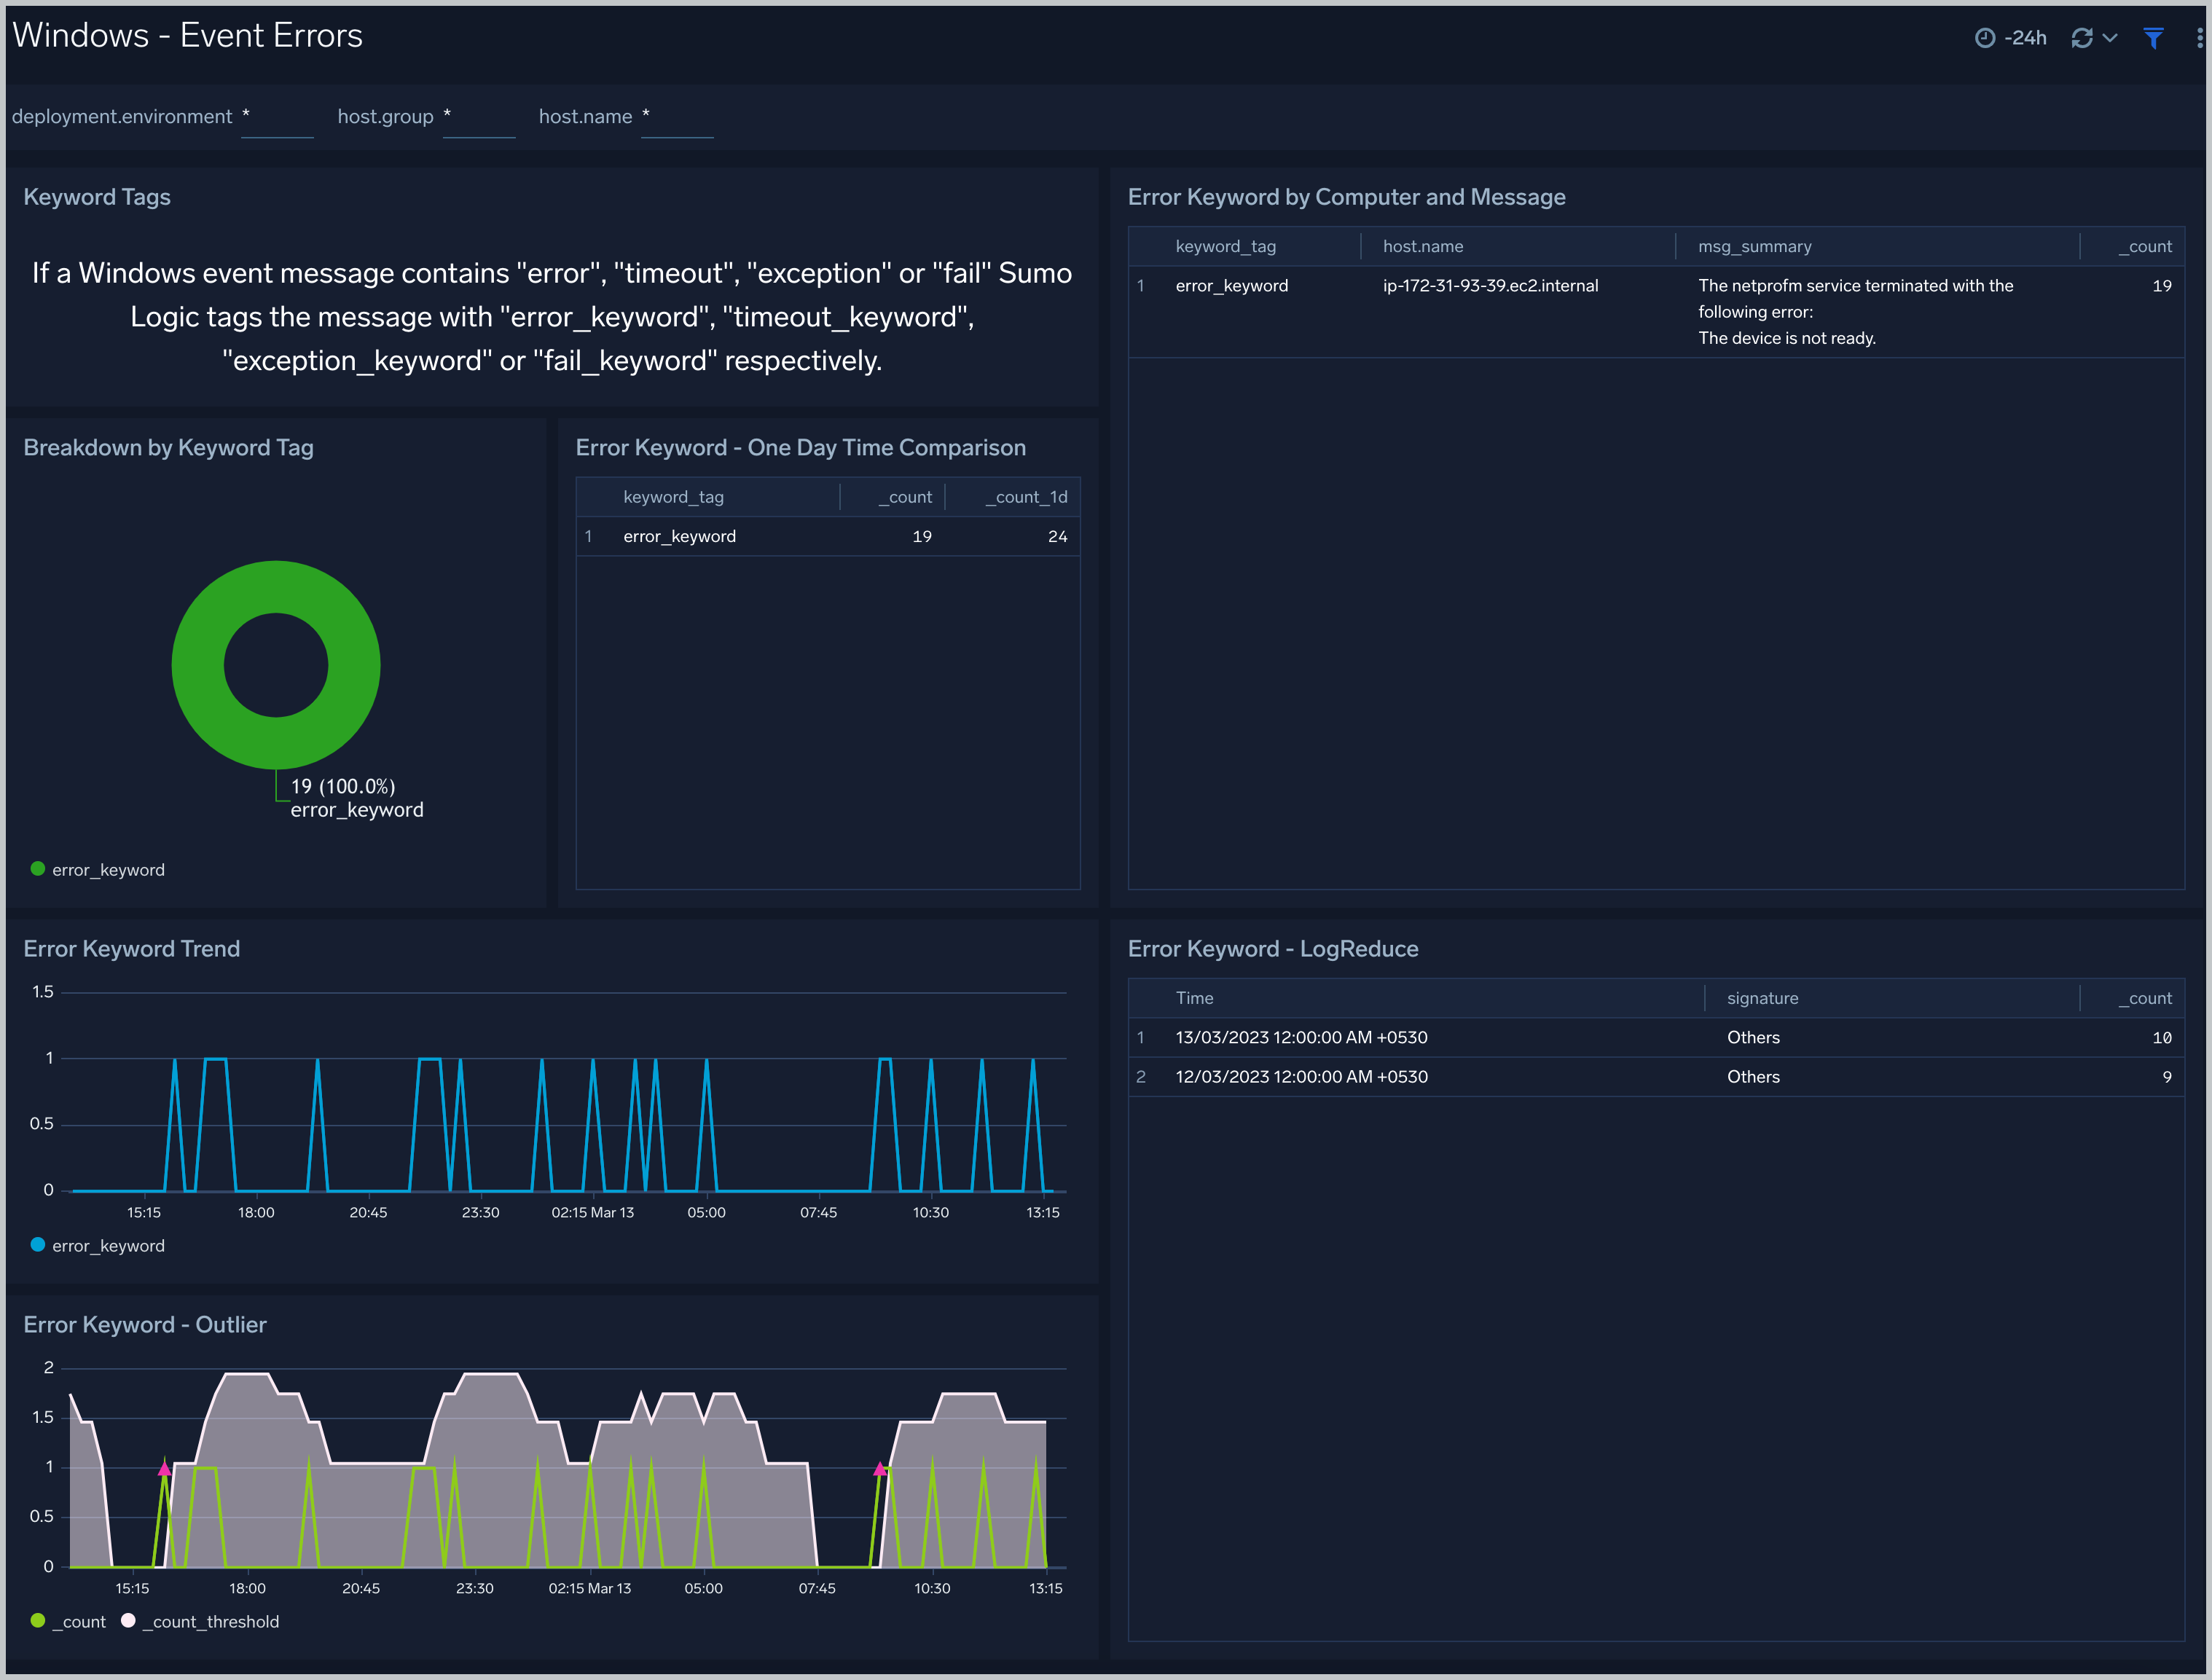
Windows - Event Errors
The Windows - Event Errors dashboards provide insights into error keyword trends and outliers.
Use this dashboard to:
- Monitor various errors in the systems.
- Monitor error trends and outliers to ensure they are within acceptable limits to decide the next step.
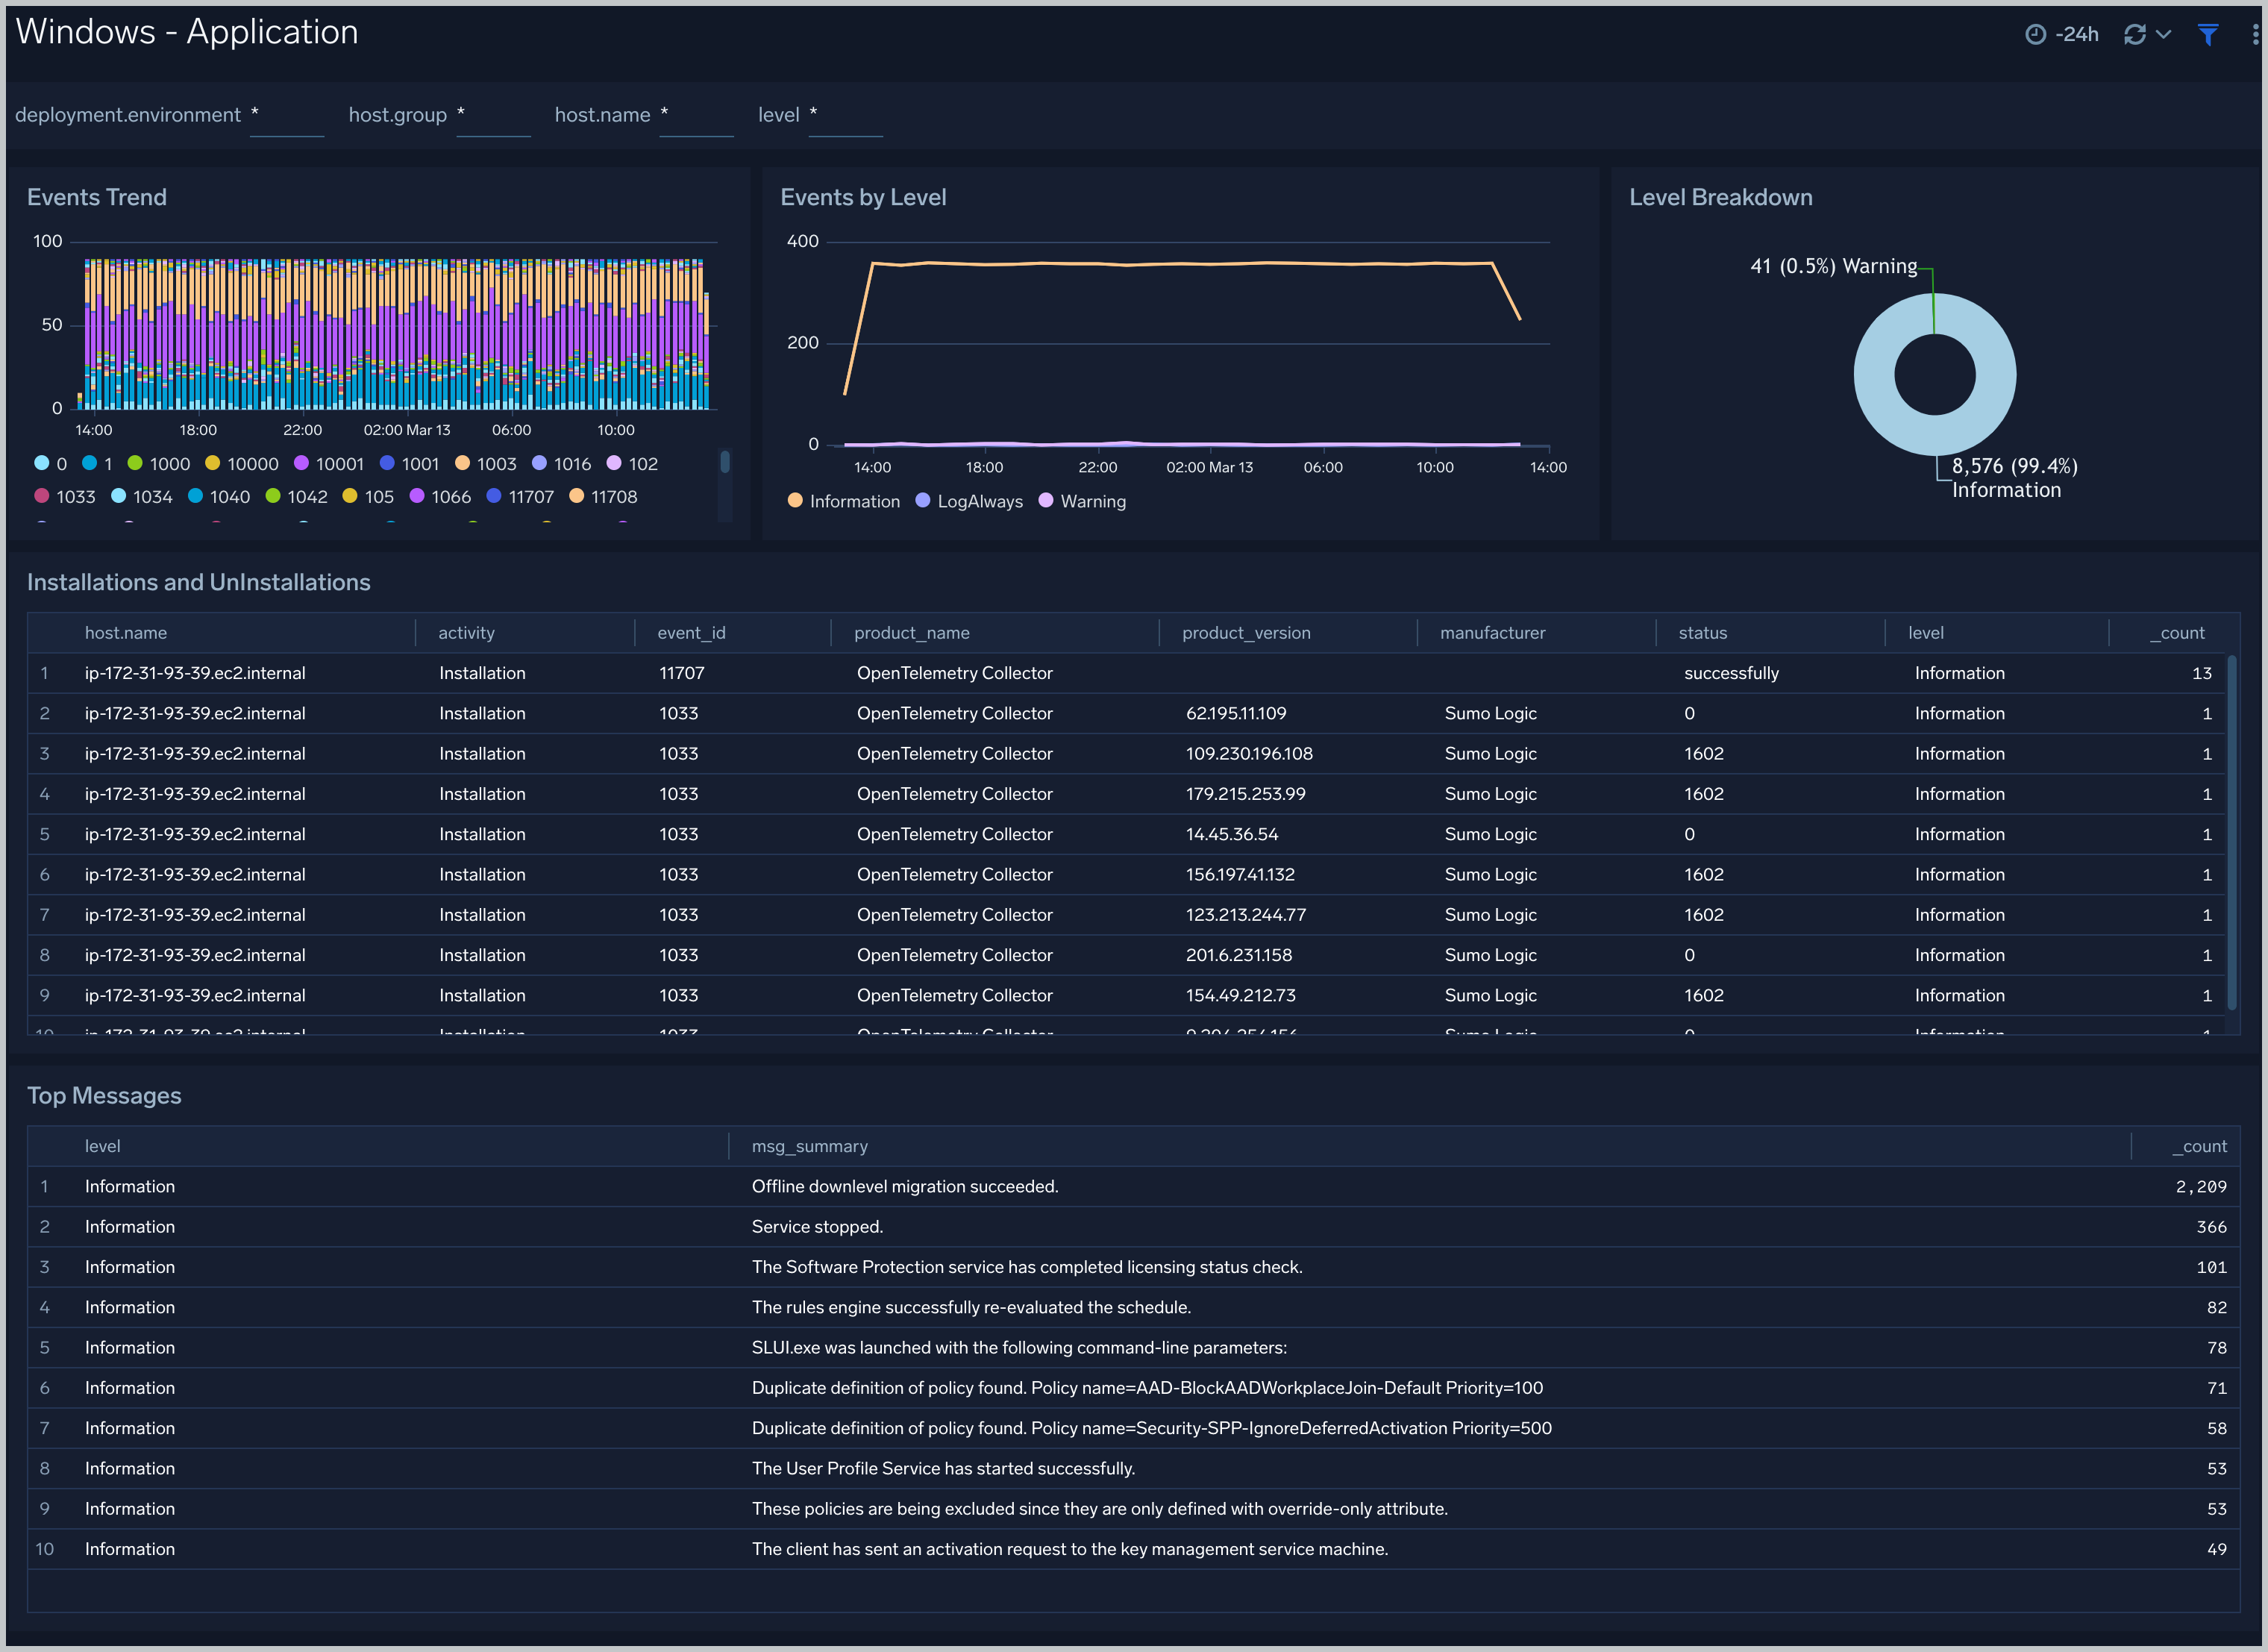
Windows - Application
The Windows - Application dashboard provides detailed information about install, uninstall, and event trends.
Use this dashboard to:
- Monitor Install and uninstall of applications performed on the system.
- Monitor log levels (error, warning, and information) through trends and quick snapshots.
- Monitor various application-specific events happening through recent messages.
Viewing the Windows host metric based dashboards
All dashboards have a set of filters that you can apply to the entire dashboard. Use these filters to drill down and examine the data to a granular level.
- You can change the time range for a dashboard or panel by selecting a predefined interval from a drop-down list, choosing a recently used time range, or specifying custom dates and times. Learn more.
- You can use template variables to drill down and examine the data on a granular level. For more information, see Filtering Dashboards with Template Variables.
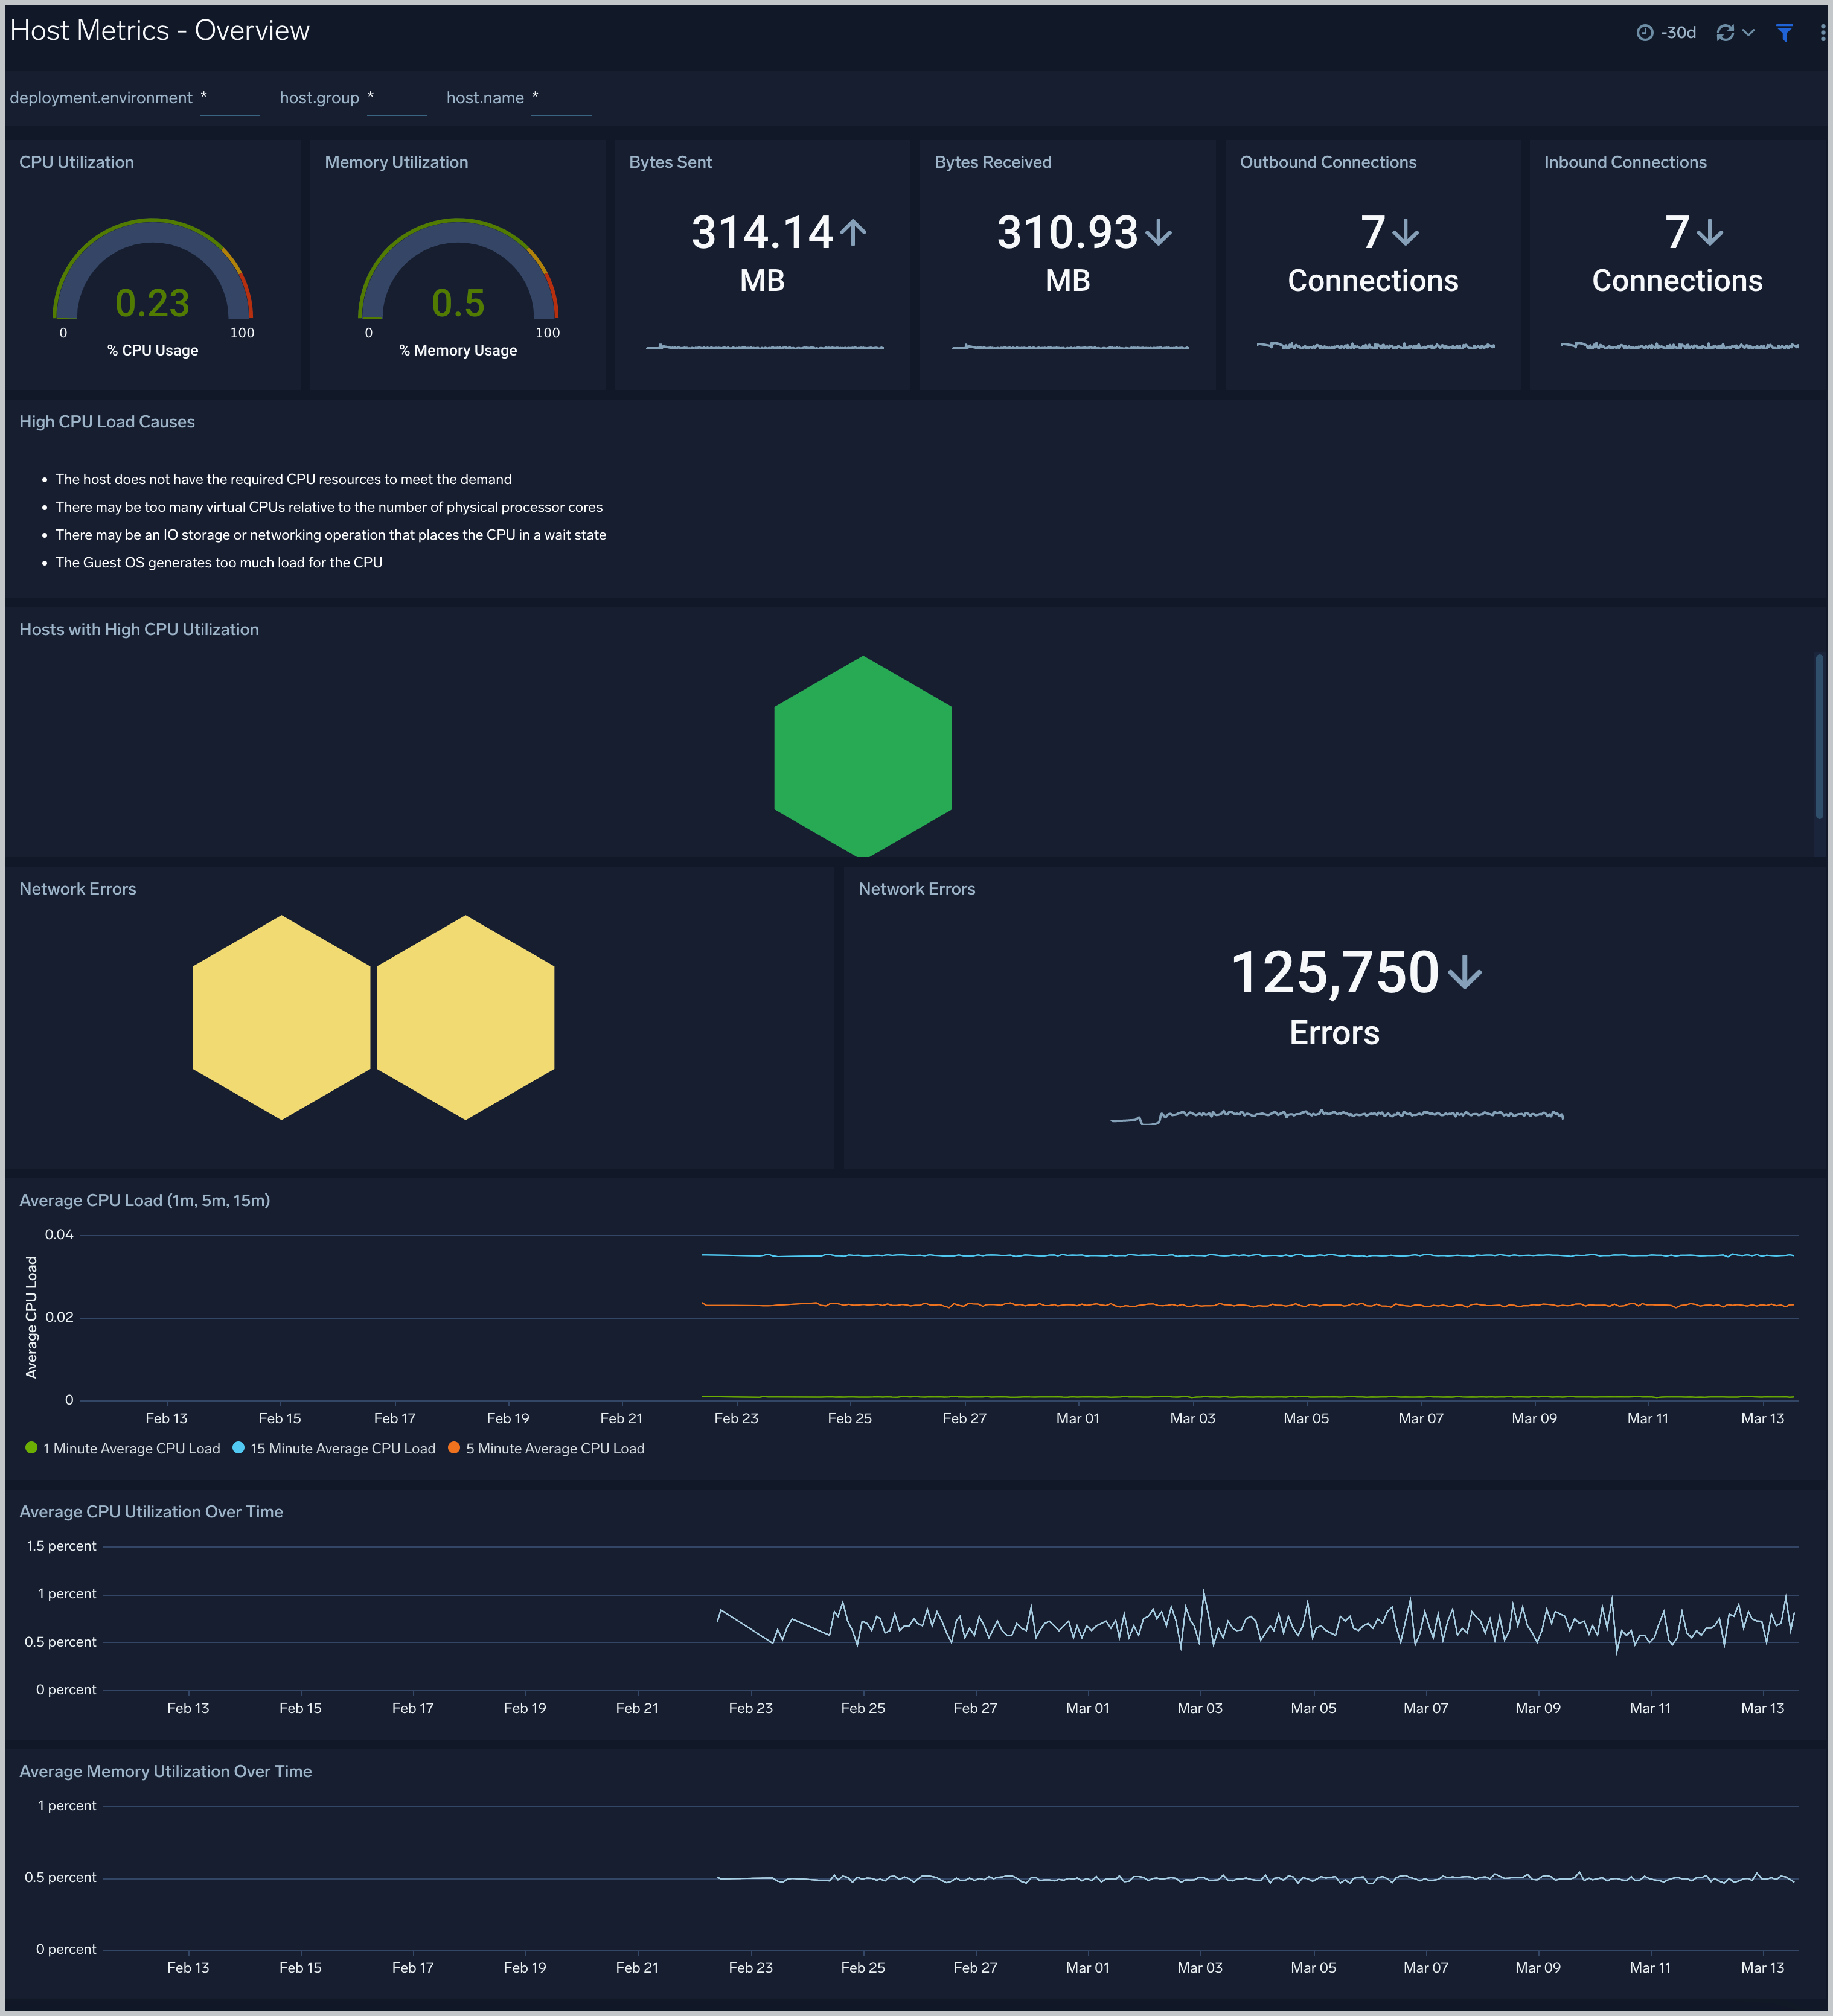
Host Metrics - Overview
The Host Metrics - Overview dashboard gives you an at-a-glance view of the key metrics like CPU, memory, disk, network, and TCP connections of all your hosts. You can drill down from this dashboard to the Host Metrics - CPU/Disk/Memory/Network/TCP dashboard by using the honeycombs or line charts in all the panels.
Use this dashboard to:
- Identify hosts with high CPU, disk, memory utilization, and identify anomalies over time.
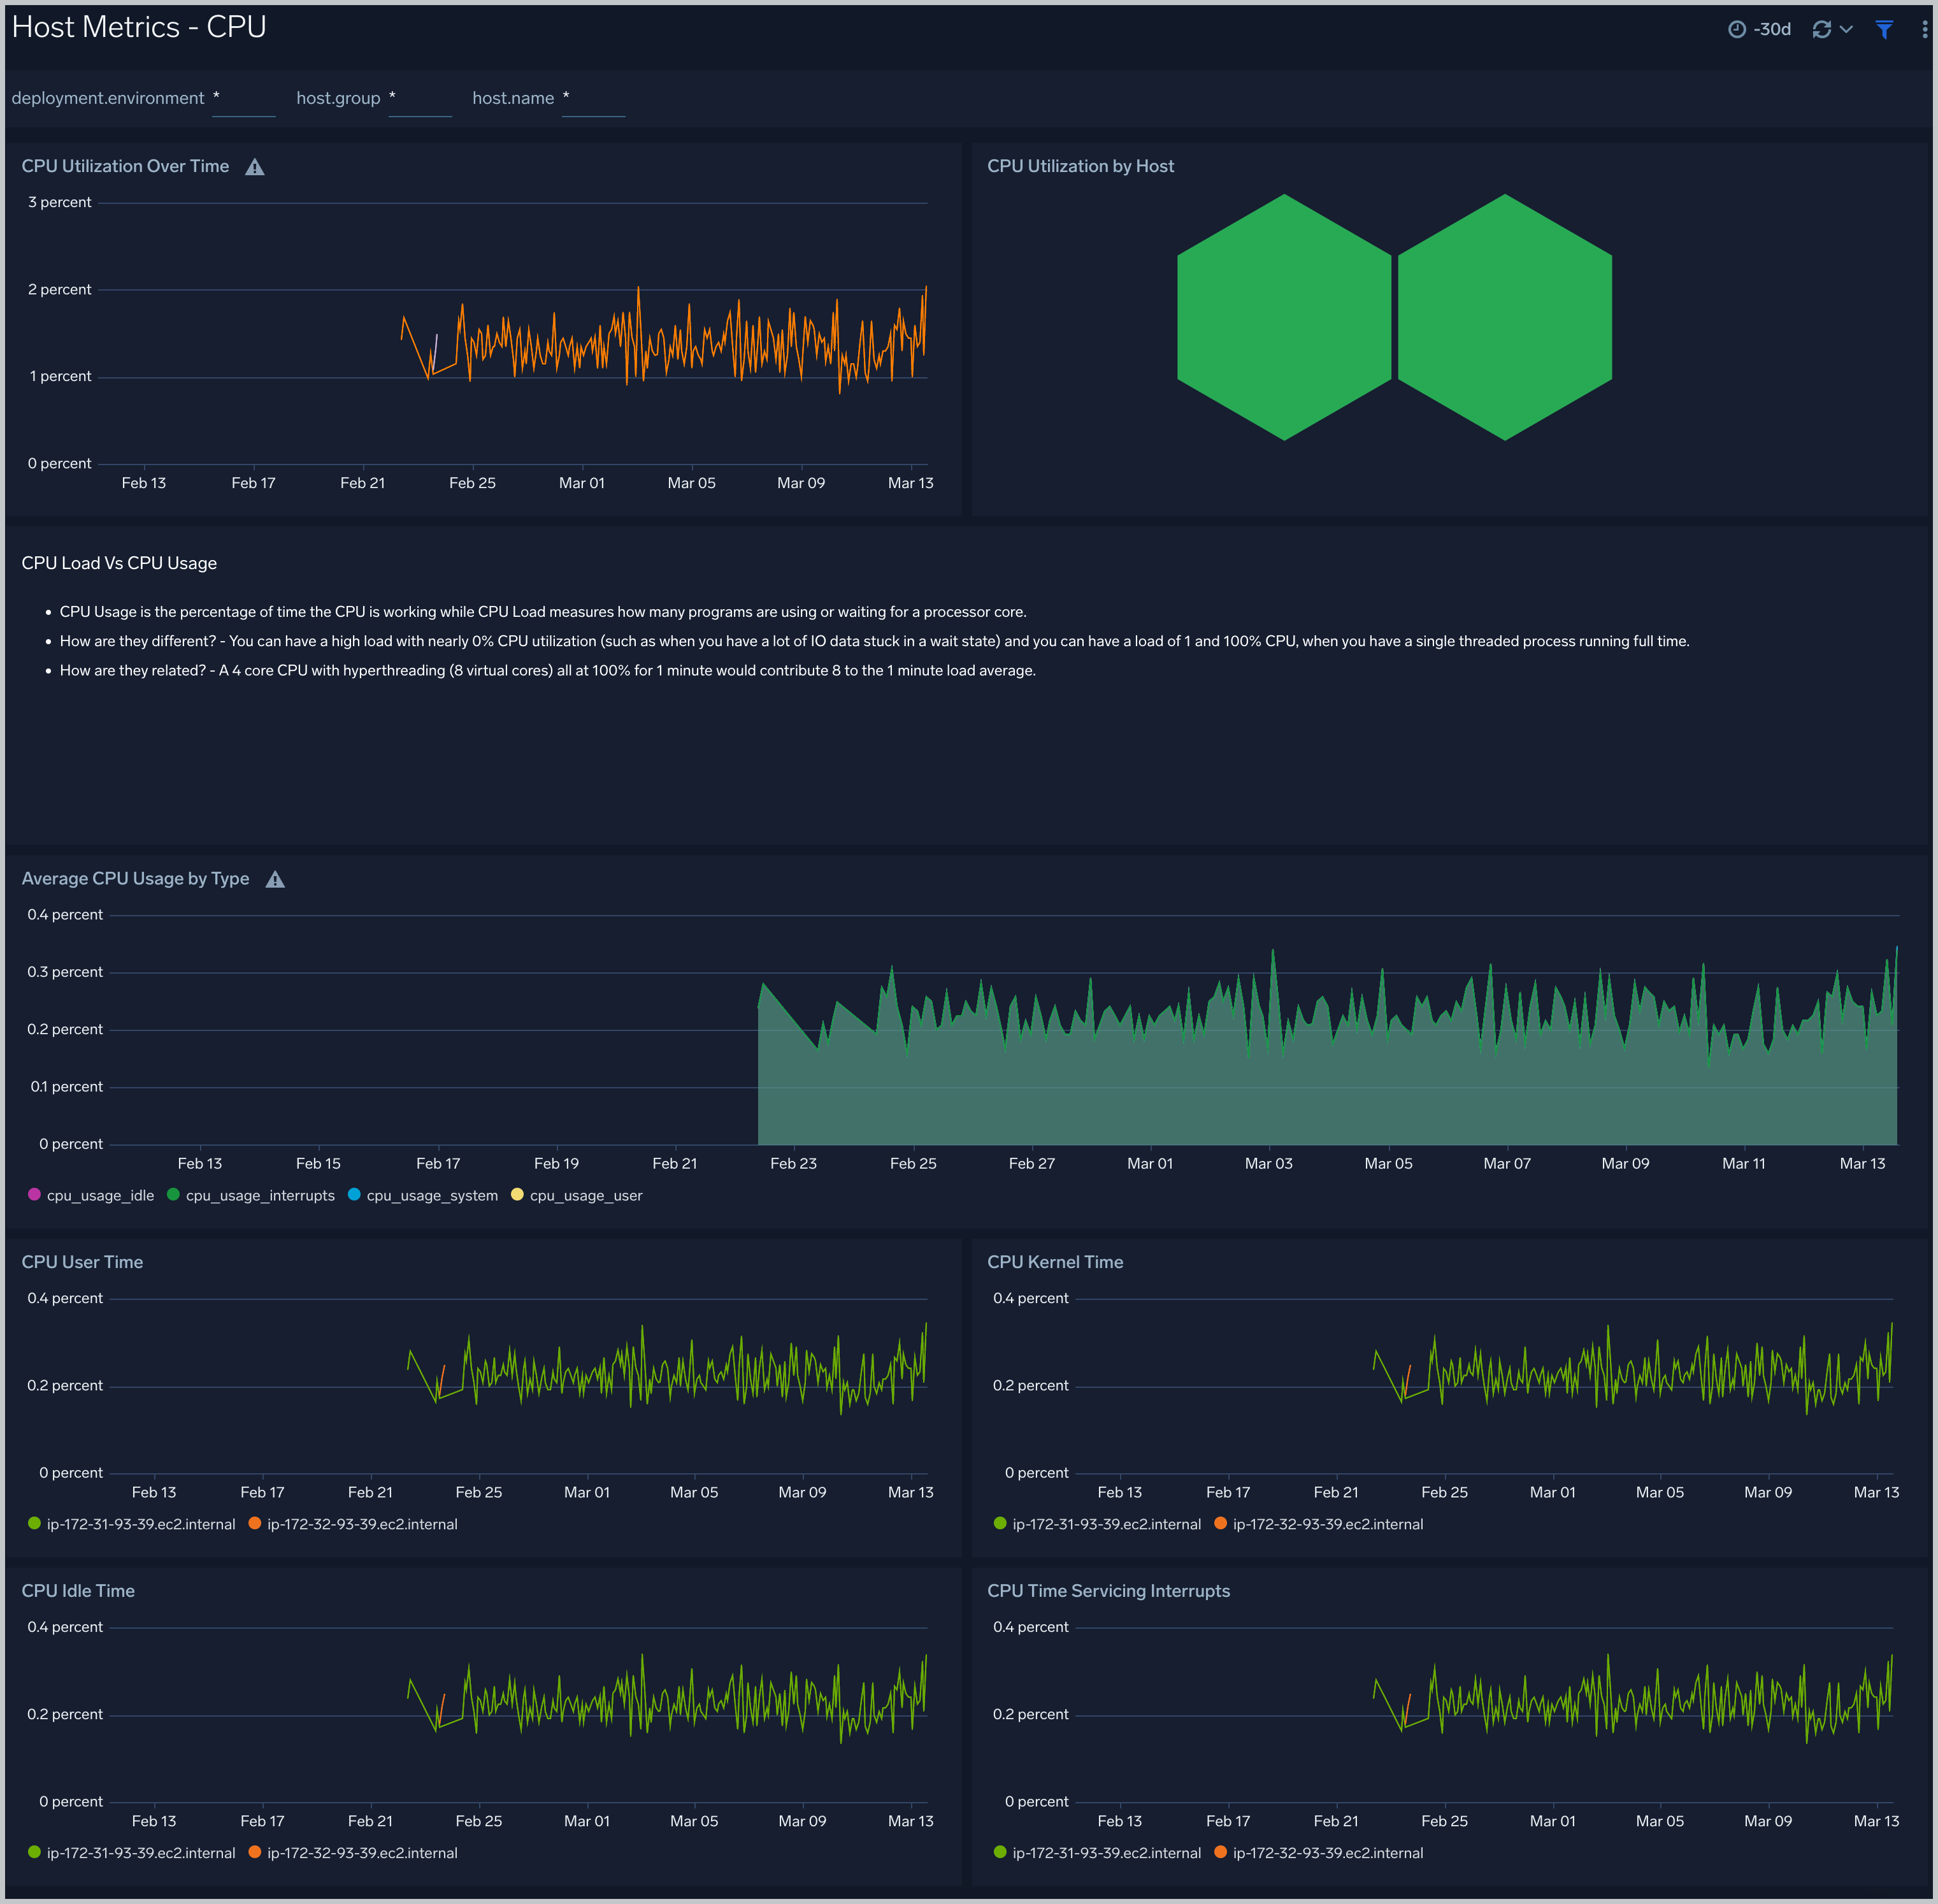
Host Metrics - CPU
The Host Metrics - CPU dashboard provides a detailed analysis based on CPU metrics. You can drill down from this dashboard to the Process Metrics - Details dashboard by using the honeycombs or line charts in all the panels.
Use this dashboard to:
- Identify hosts and processes with high CPU utilization.
- Examine CPU usage by type and identify anomalies over time.
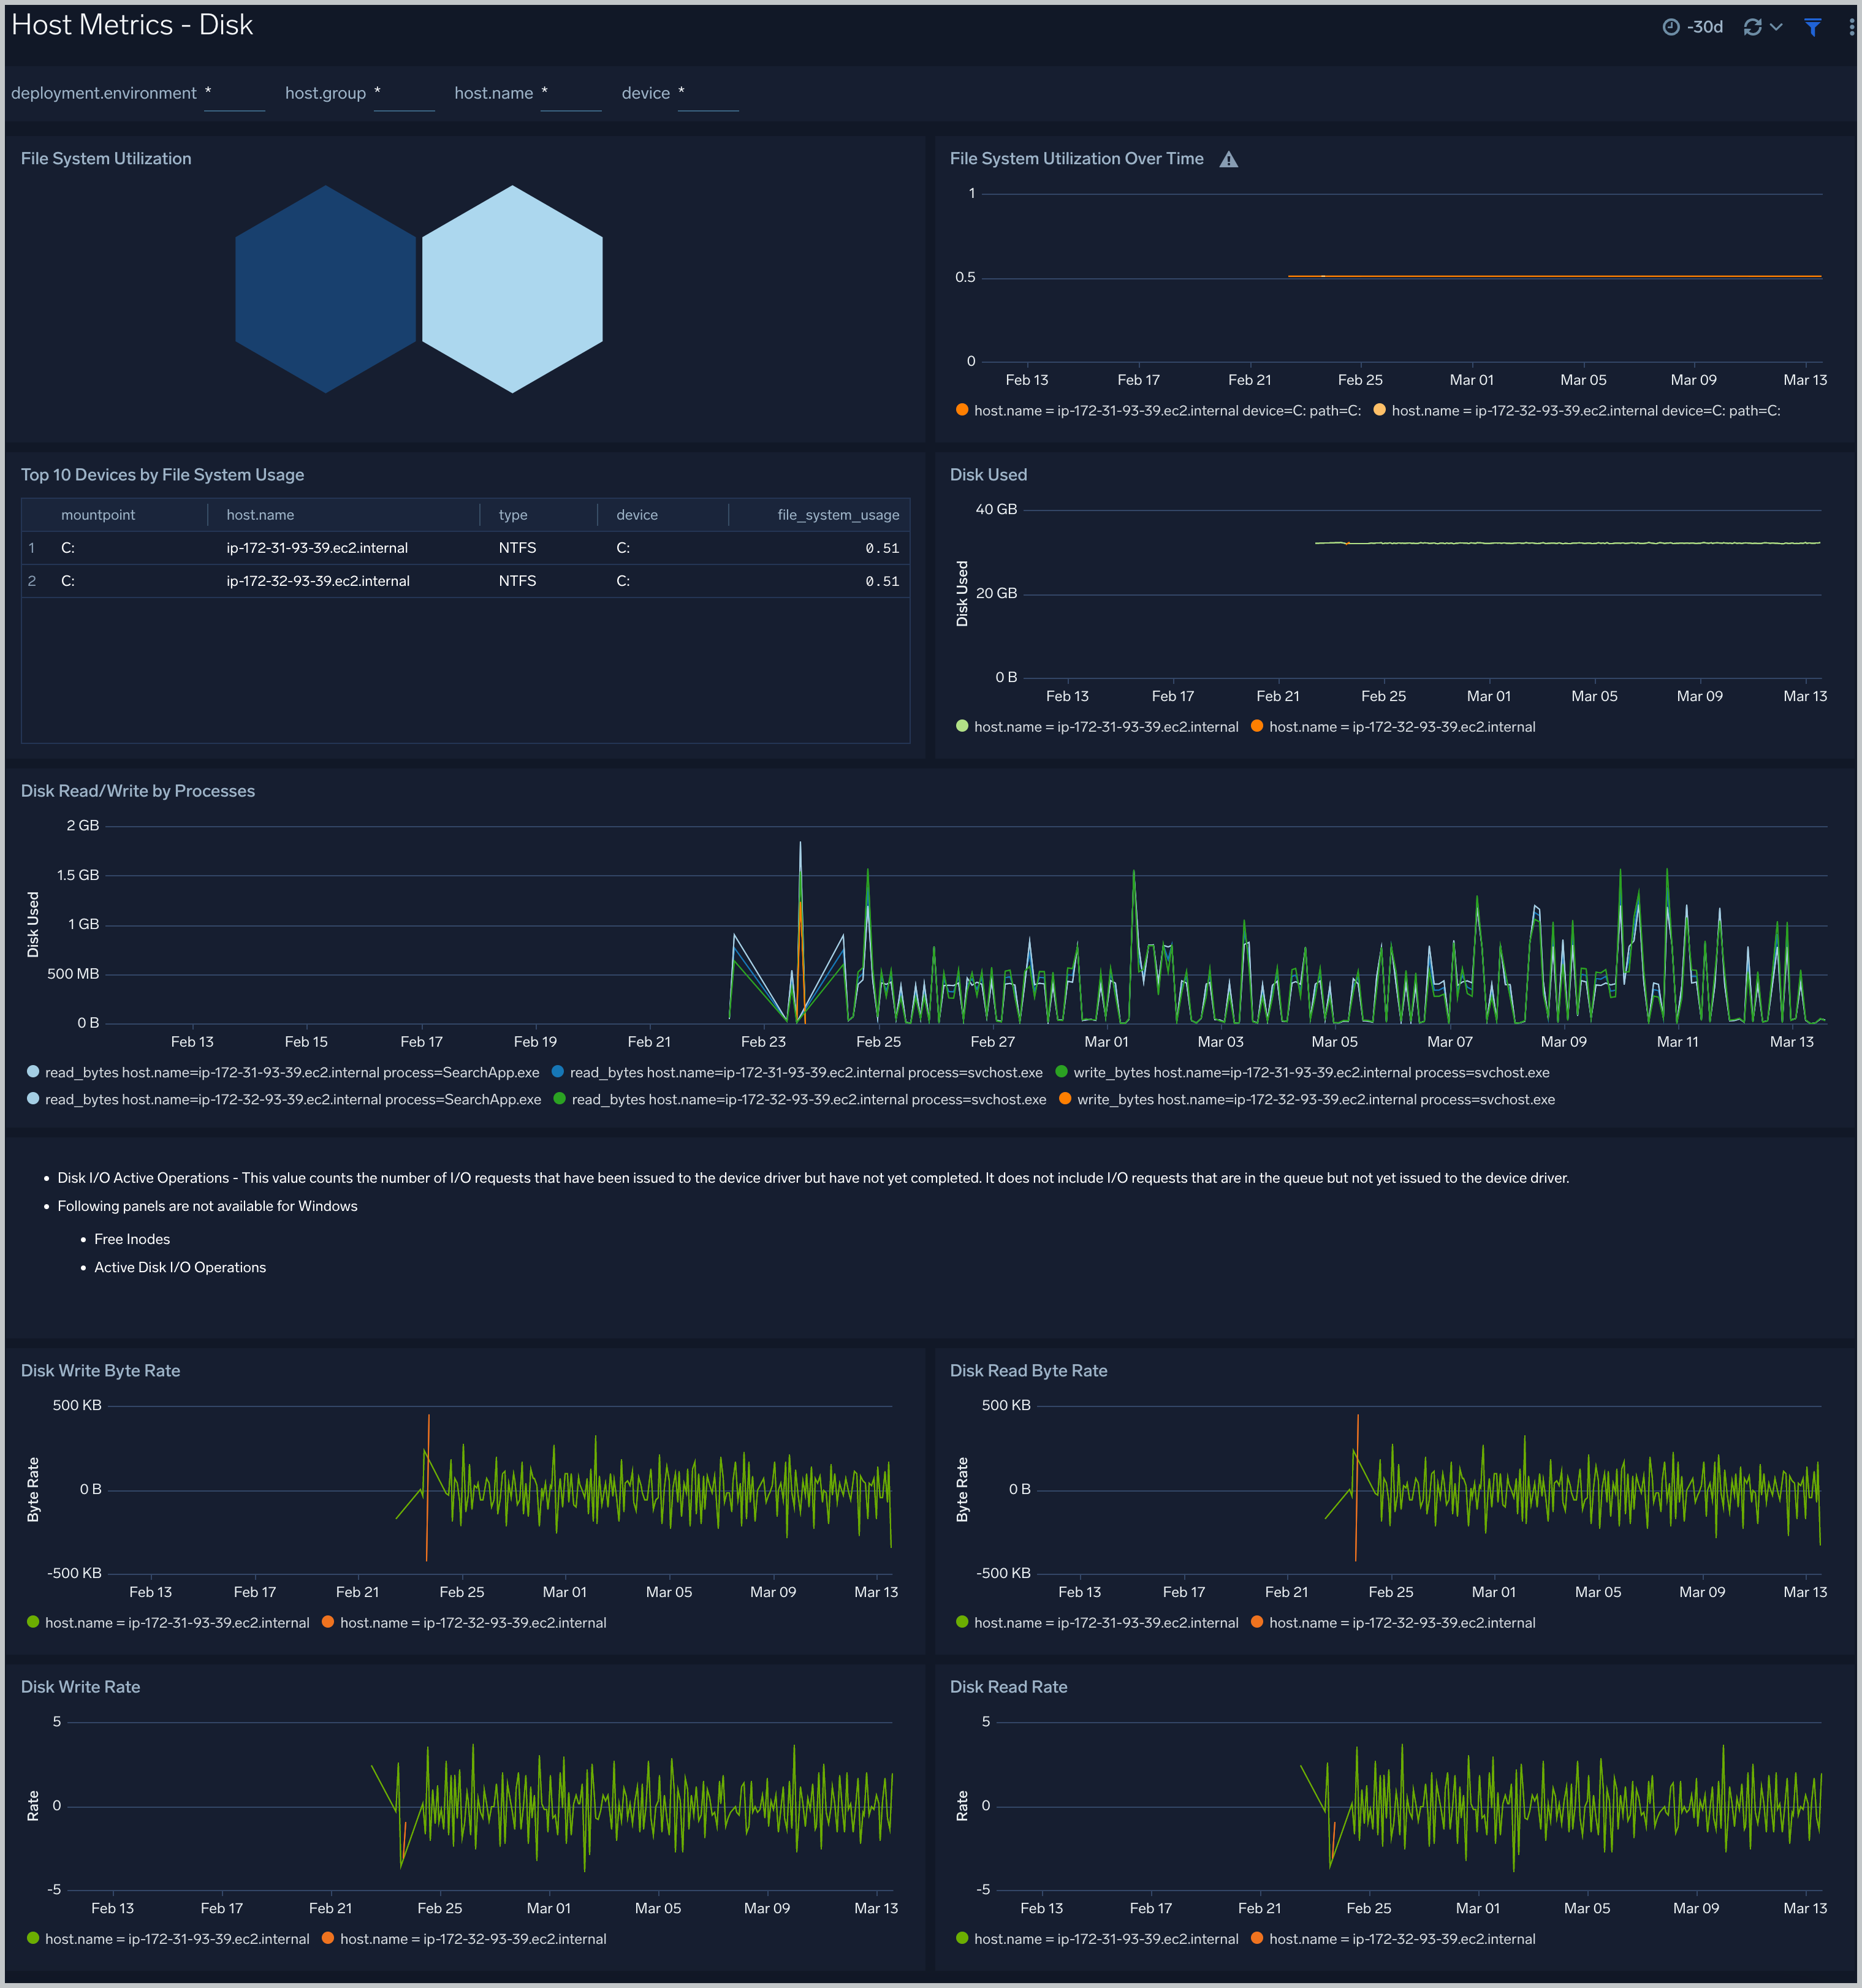
Host Metrics - Disk
The Host Metrics - Disk dashboard provides detailed information about disk utilization and disk IO operations.You can drill down from this dashboard to the Process Metrics - Details dashboard by using the honeycombs or line charts in all the panels.
Use this dashboard to:
- Identify hosts with high disk utilization and disk IO operations.
- Monitor abnormal spikes in read/write rates.
- Compare disk throughput across storage devices of a host.
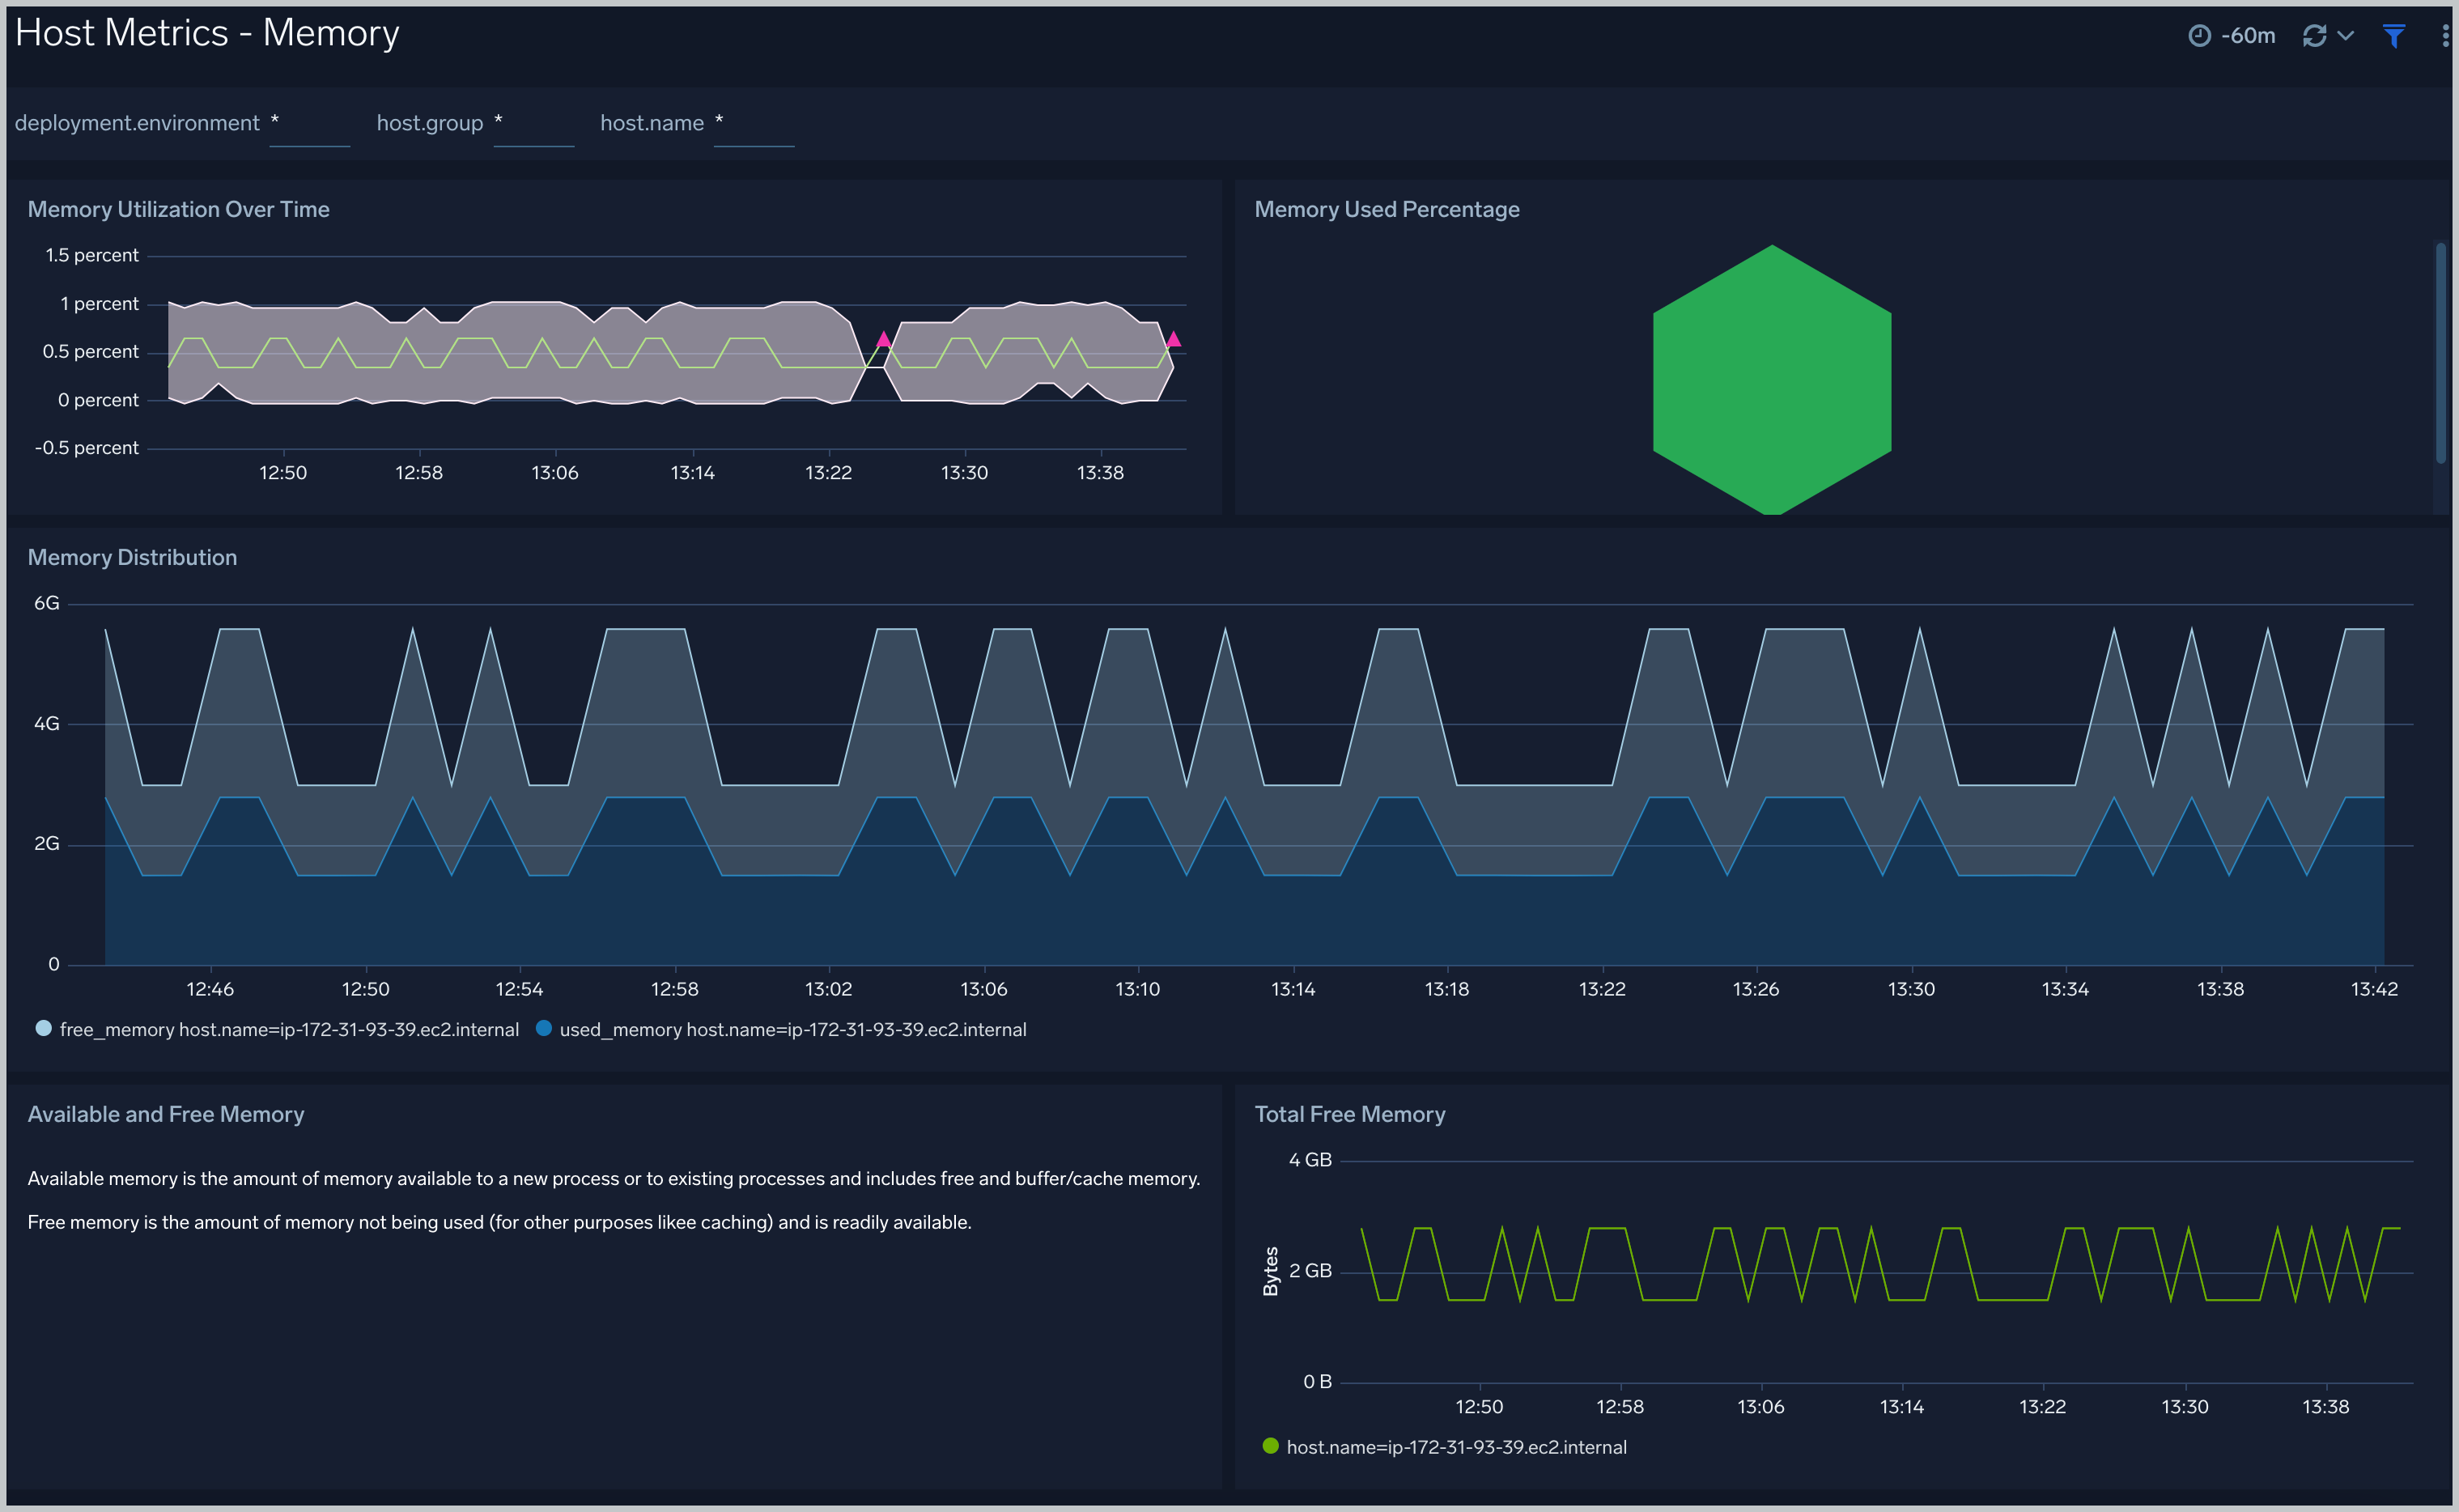
Host Metrics - Memory
The Host Metrics - Memory dashboard provides detailed information on host memory usage, memory distribution, and swap space utilization. You can drill down from this dashboard to the Process Metrics - Details dashboard by using the honeycombs or line charts in all the panels.
Use this dashboard to:
- Identify hosts with high memory utilization.
- Examine memory distribution (free, buffered-cache, used, total) for a given host.
- Monitor abnormal spikes in memory and swap utilization.
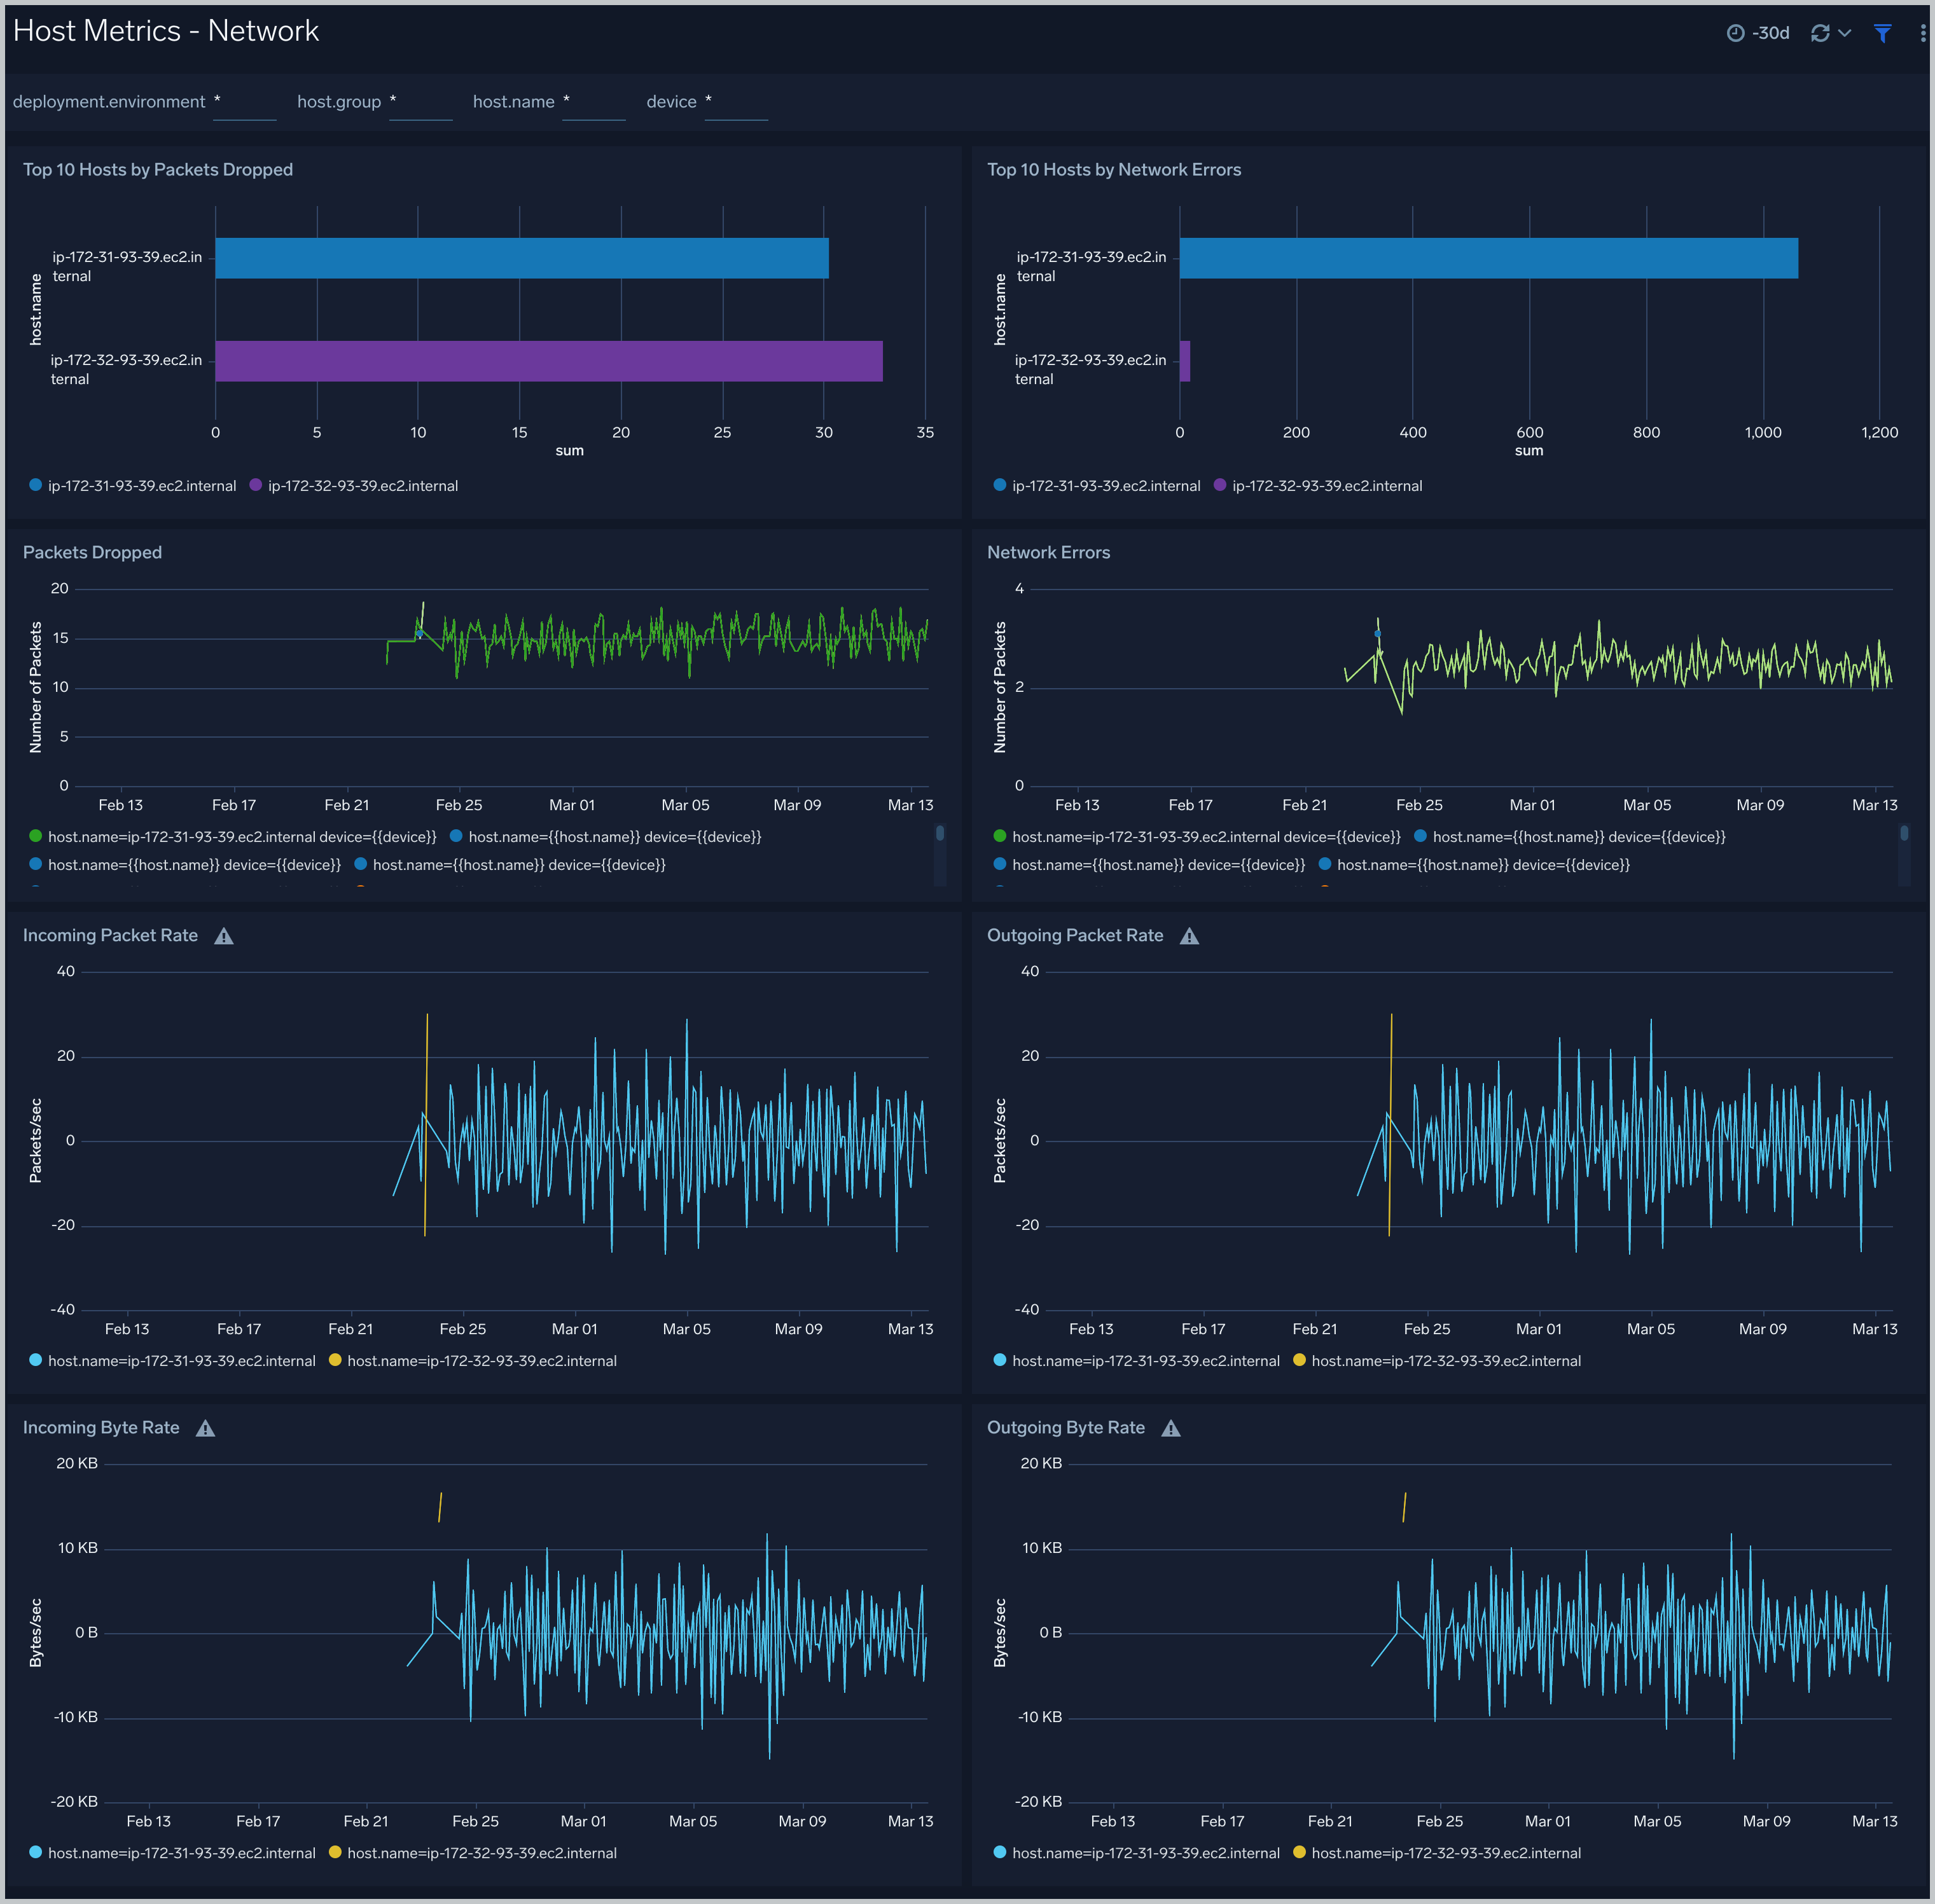
Host Metrics - Network
The Host Metrics - Network dashboard provides detailed information on host network errors, throughput, and packets sent and received.
Use this dashboard to:
- Determine top hosts with network errors and dropped packets.
- Monitor abnormal spikes in incoming/outgoing packets and bytes sent and received.
- Use dashboard filters to compare throughput across the interface of a host.
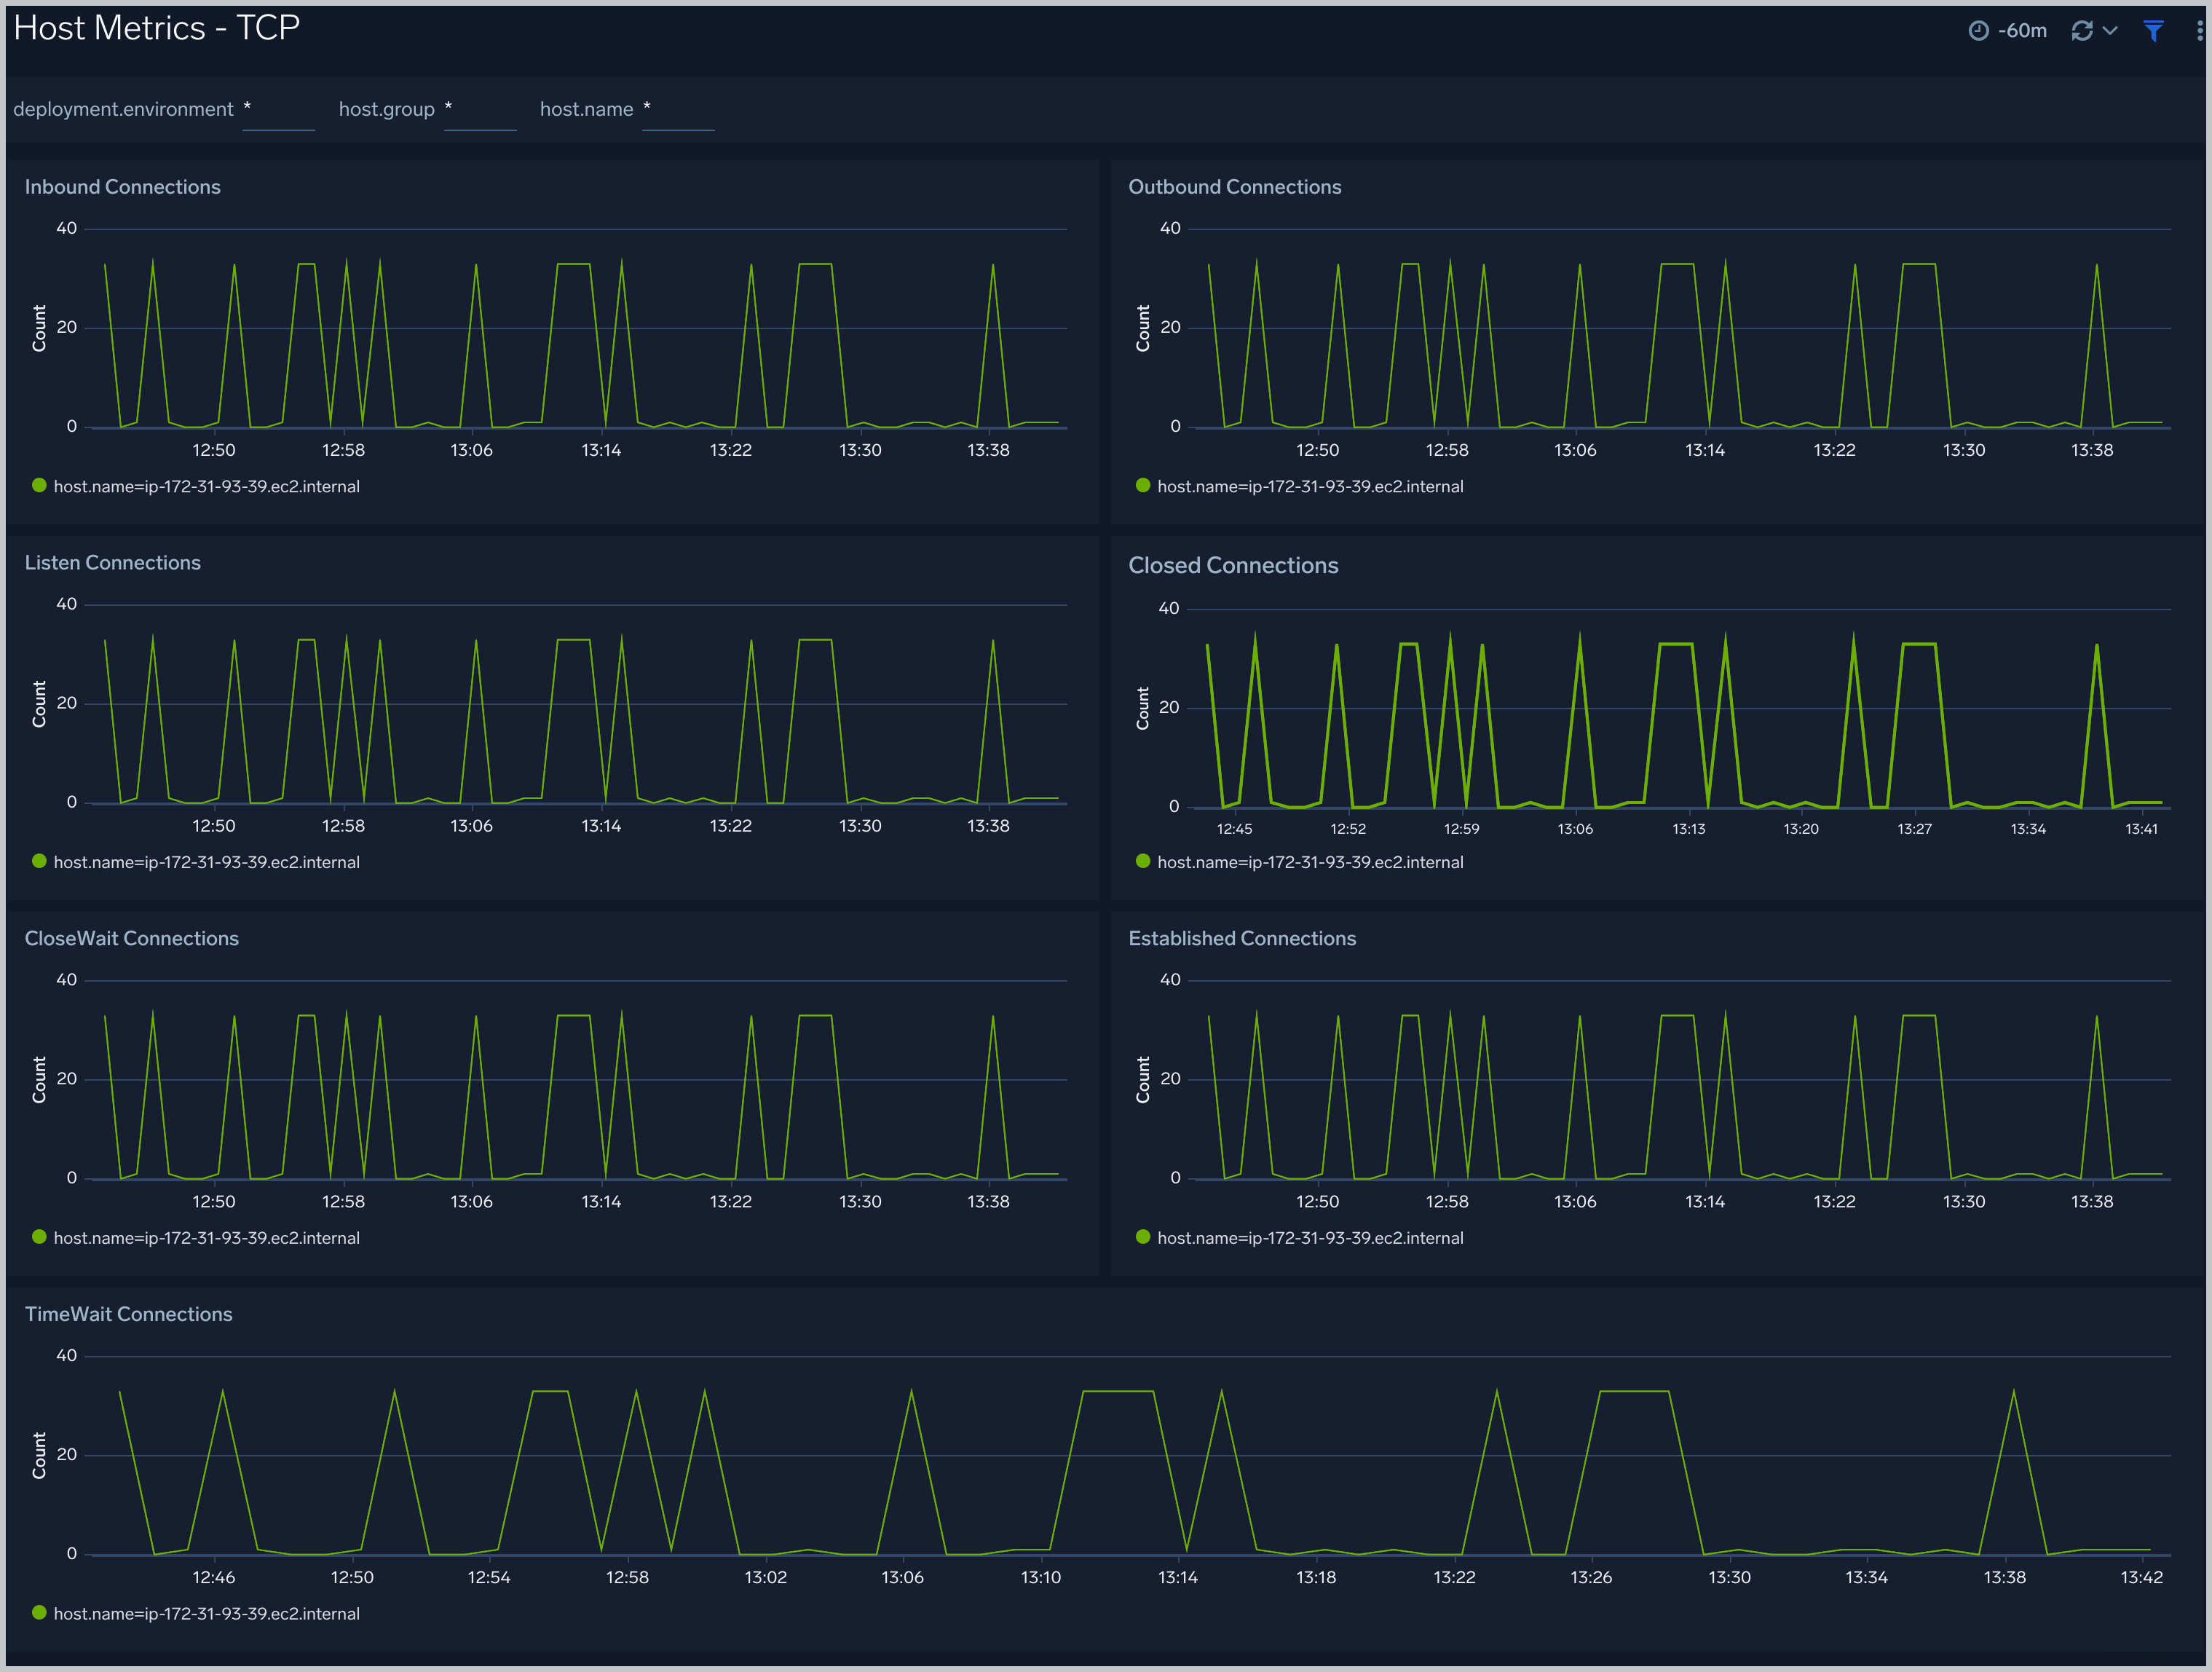
Host Metrics - TCP
The Host Metrics - TCP dashboard provides detailed information around inbound, outbound, open, and established TCP connections.
Use this dashboard to:
- Identify abnormal spikes in inbound, outbound, open, or established connections.
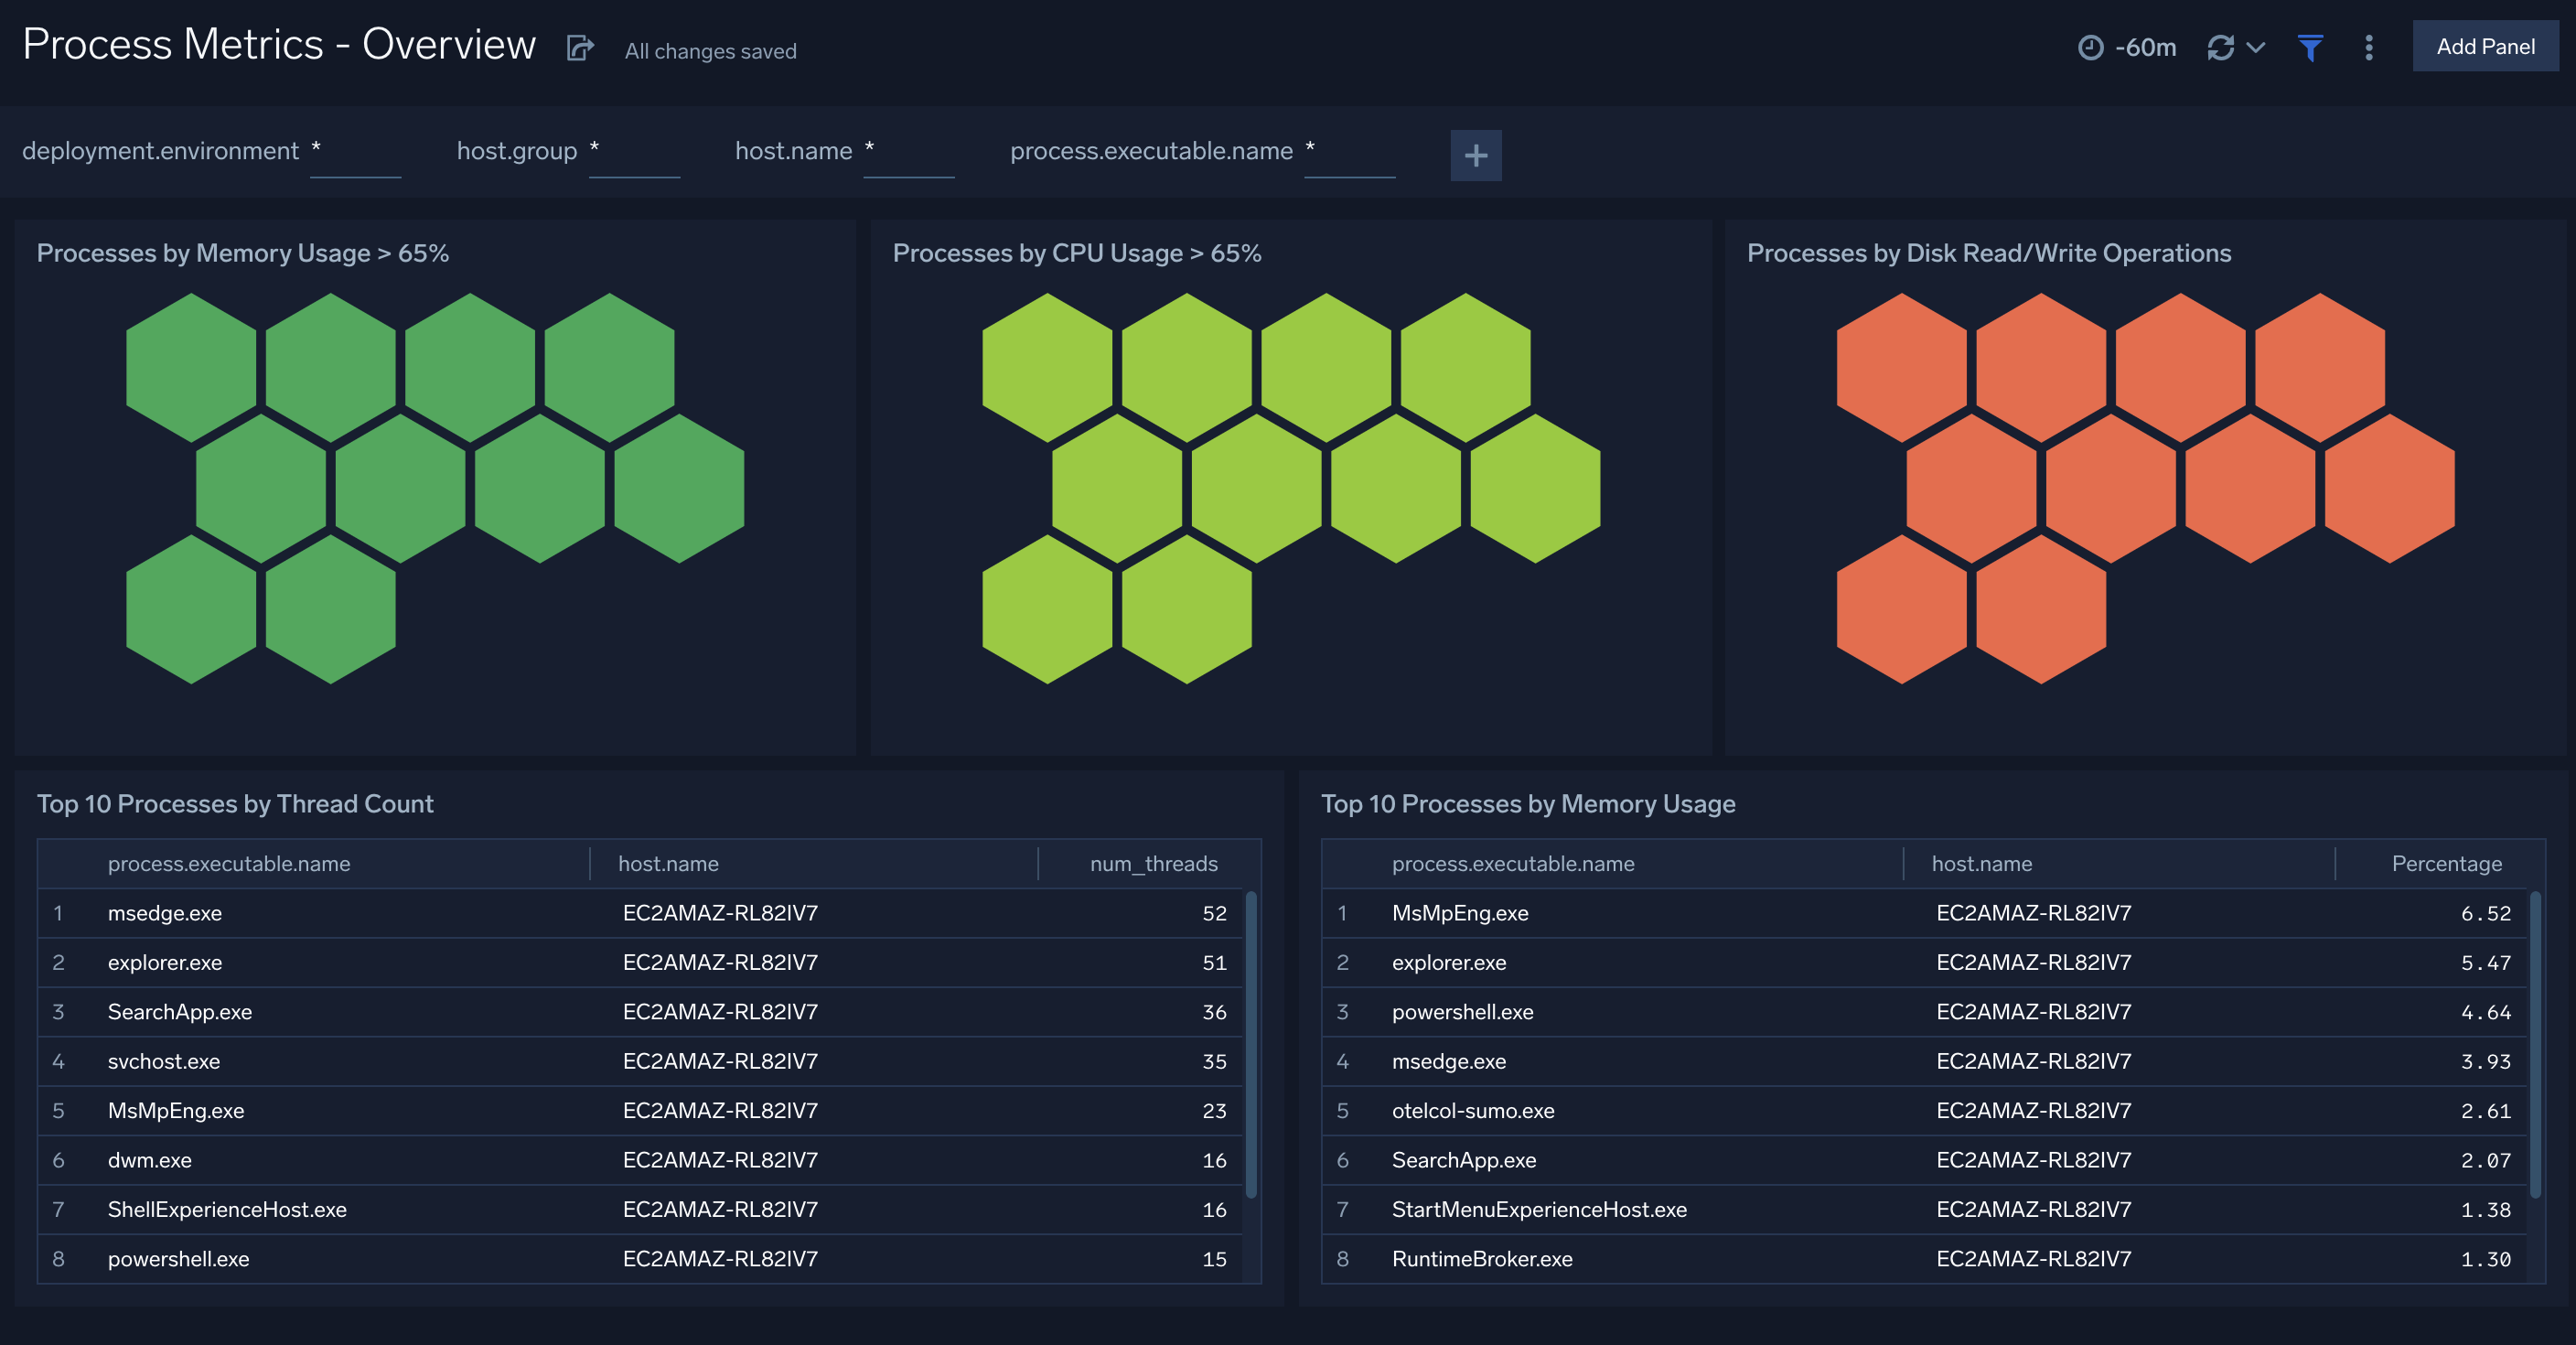
The Process Metrics - Overview
The Process Metrics - Overview dashboard gives you an at-a-glance view of all the processes by open file descriptors, CPU usage, memory usage, disk read/write operations, and thread count.
User this dashboard to :
- Process wise distribution of CPU and memory usage
- Process wise read/write operations
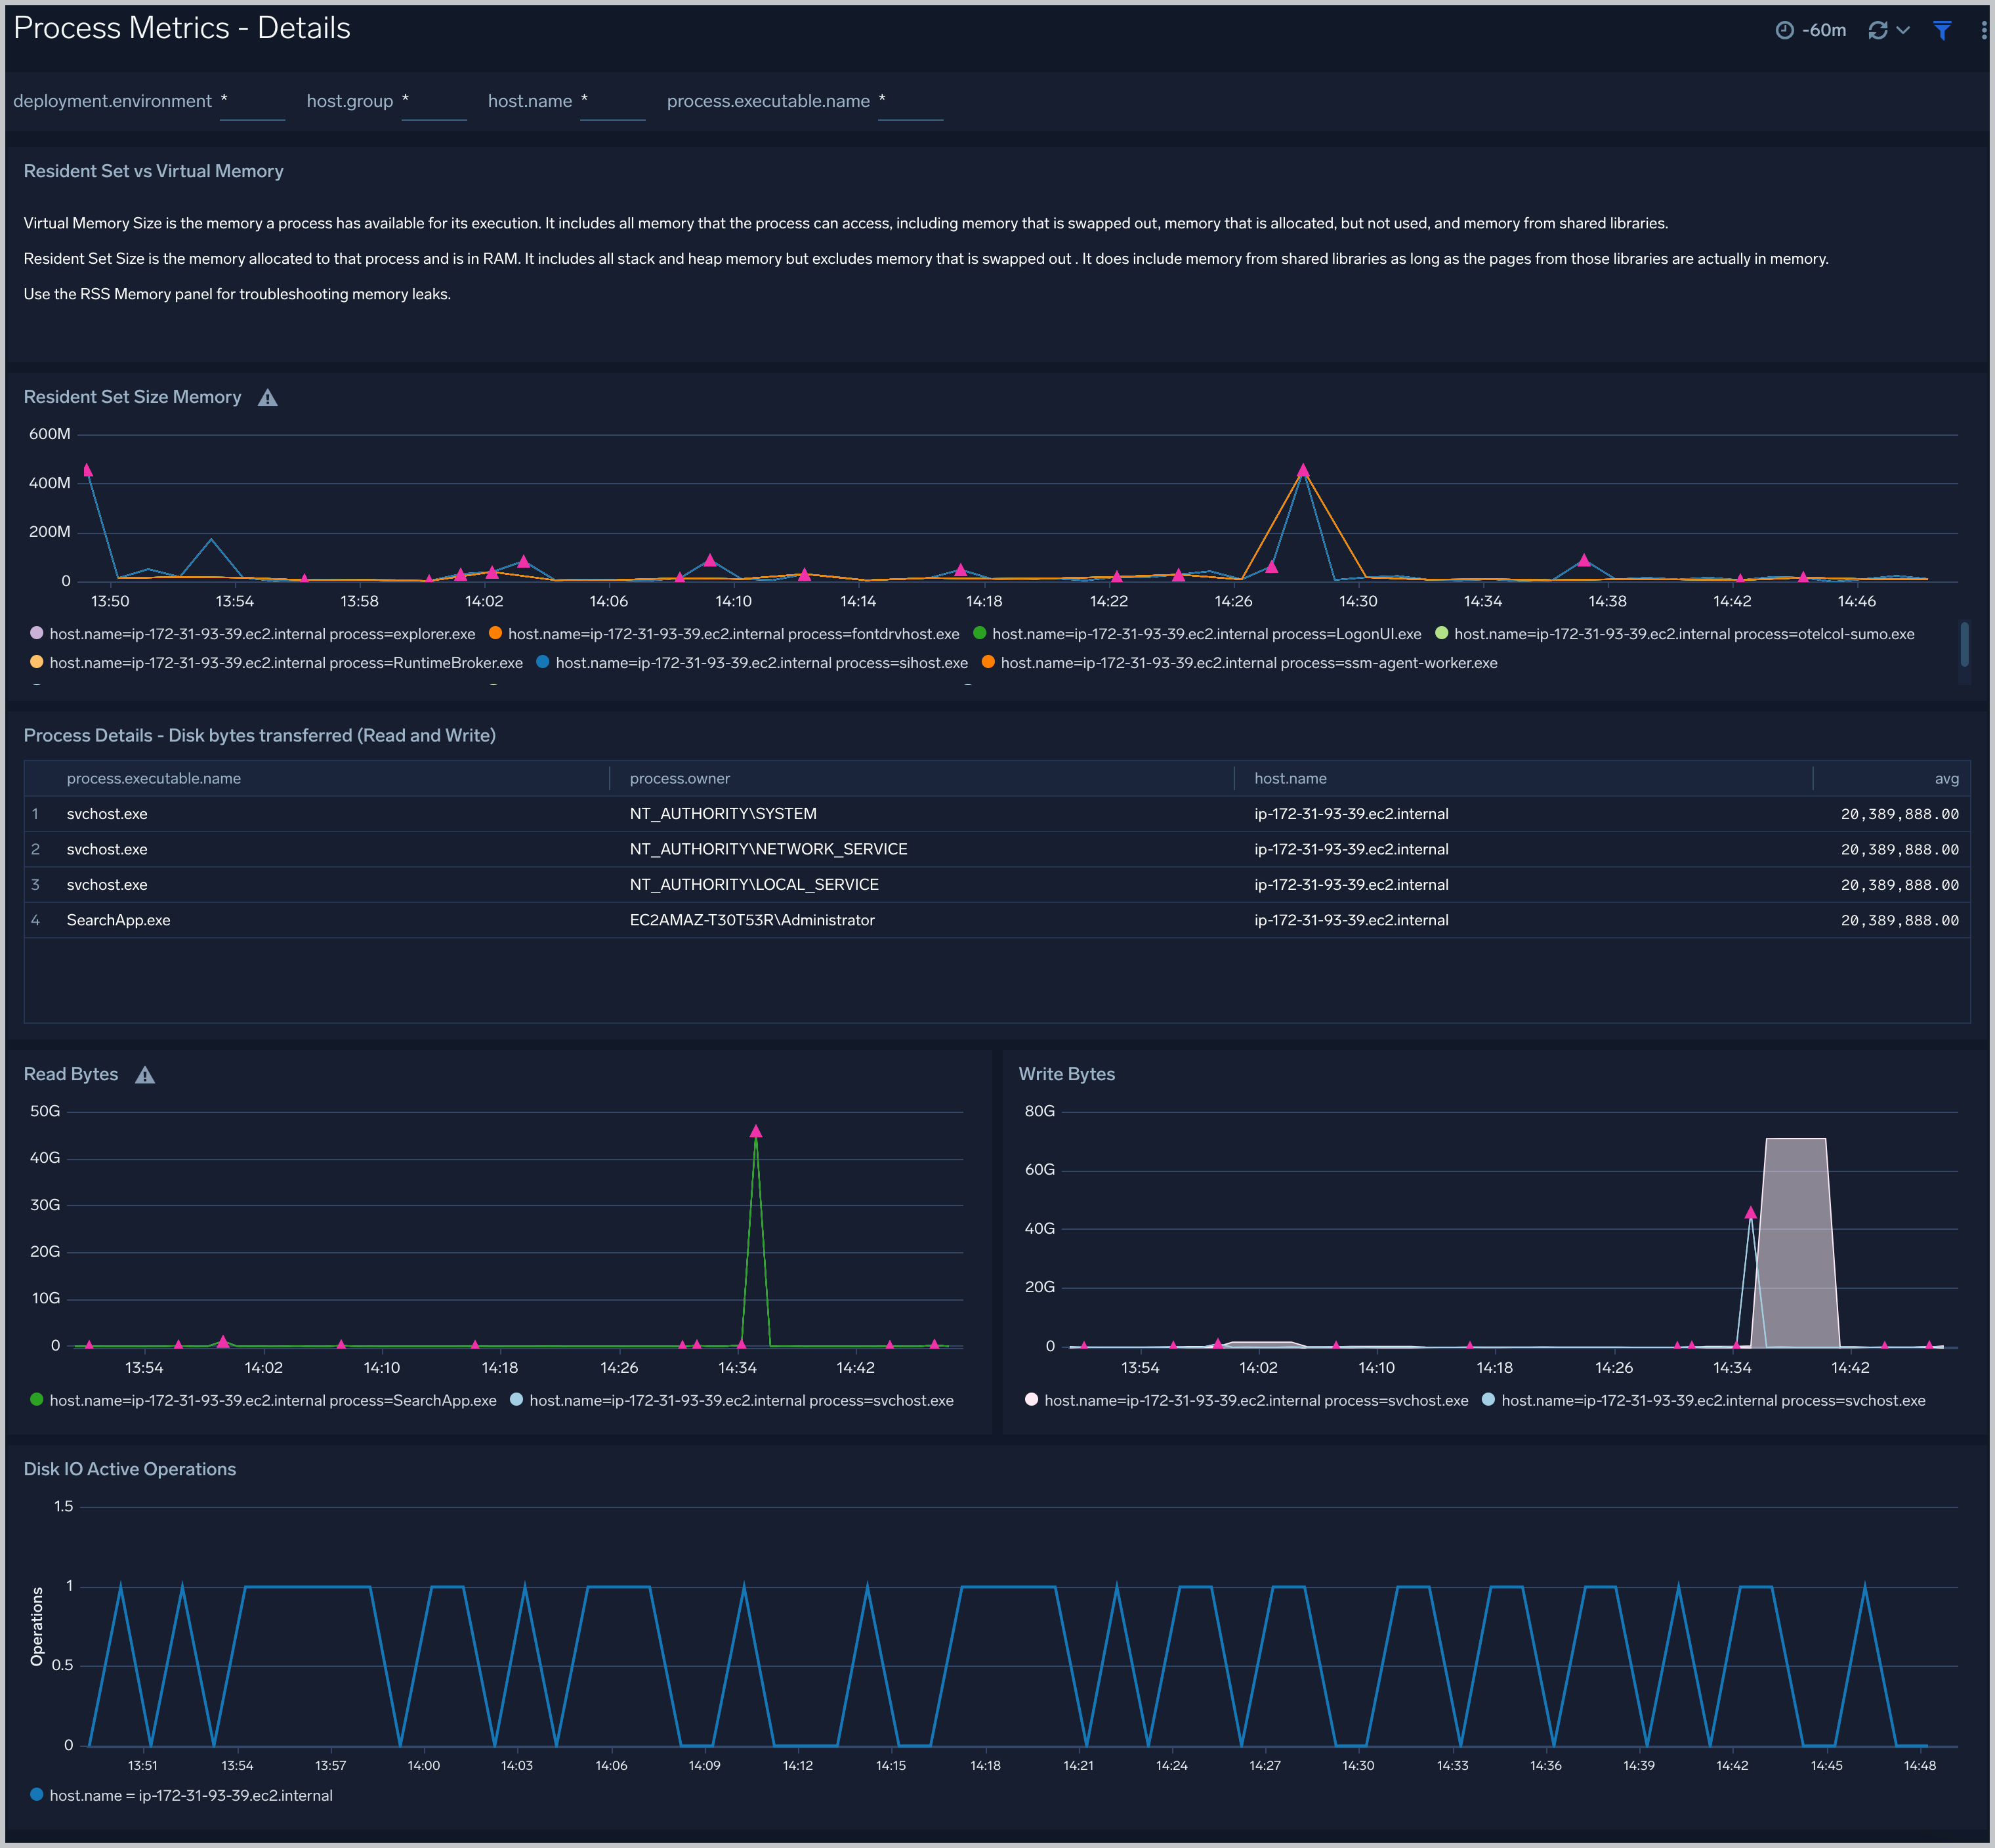
Process Metrics - Details
The Process Metrics - Details dashboard gives you a detailed view of key process related metrics such as CPU and memory utilization, disk read/write throughput, and major/minor page faults.
Use this dashboard to:
- Determine the number of open file descriptors in all hosts. If the number of open file descriptors reaches the maximum file descriptor limits, it can cause IOException errors.
- Identify anomalies in CPU usage, memory usage, major/minor page faults and reads/writes over time.
- Troubleshoot memory leaks using the resident set memory trend chart.
Create monitors for Windows app
From your App Catalog:
- From the Sumo Logic navigation, select App Catalog.
- In the Search Apps field, search for and then select your app.
- Make sure the app is installed.
- Navigate to What's Included tab and scroll down to the Monitors section.
- Click Create next to the pre-configured monitors. In the create monitors window, adjust the trigger conditions and notifications settings based on your requirements.
- Scroll down to Monitor Details.
- Under Location click on New Folder.
note
By default, monitor will be saved in the root folder. So to make the maintenance easier, create a new folder in the location of your choice.
- Enter Folder Name. Folder Description is optional.
tip
Using app version in the folder name will be helpful to determine the versioning for future updates.
- Click Create. Once the folder is created, click on Save.
Windows alerts
| Alert Name | Alert Description and conditions | Alert Condition | Recover Condition |
|---|---|---|---|
Windows - High CPU Utilization Alert | This alert gets triggered when cpu utilization exceeds threshold. | Count > 80 | Count < = 80 |
Windows - High FileSystem Utilization Alert | This alert gets triggered when filesystem utilization exceeds threshold. | Count > 80 | Count < = 80 |
Windows - High Memory Utilization Alert | This alert gets triggered when memory utilization exceeds threshold. | Count > 80 | Count < = 80 |