 Meet the new
 Azure Audit
The Azure Audit app allows you to collect data from the Azure Activity Log (formerly known as Azure Audit logs) and monitor the health of your Azure environment. This app provides preconfigured dashboards to monitor Active Directory activity, resource usage, service health, and user activity.
Log type
The Azure Audit app uses the following log:
Collecting logs for the Azure Audit app from Event Hub
In this step, you configure a pipeline for shipping logs from Azure Monitor to an Event Hub.
-
To set up the logs collection in Sumo Logic, refer to Azure Event Hubs Source for Logs.
When you configure the Event Hubs source, plan your source category to simplify querying. A hierarchical approach allows you to make use of wildcards. For example:
Azure/AzureActivity/Logs. -
Push logs from Azure Monitor to Event Hub.
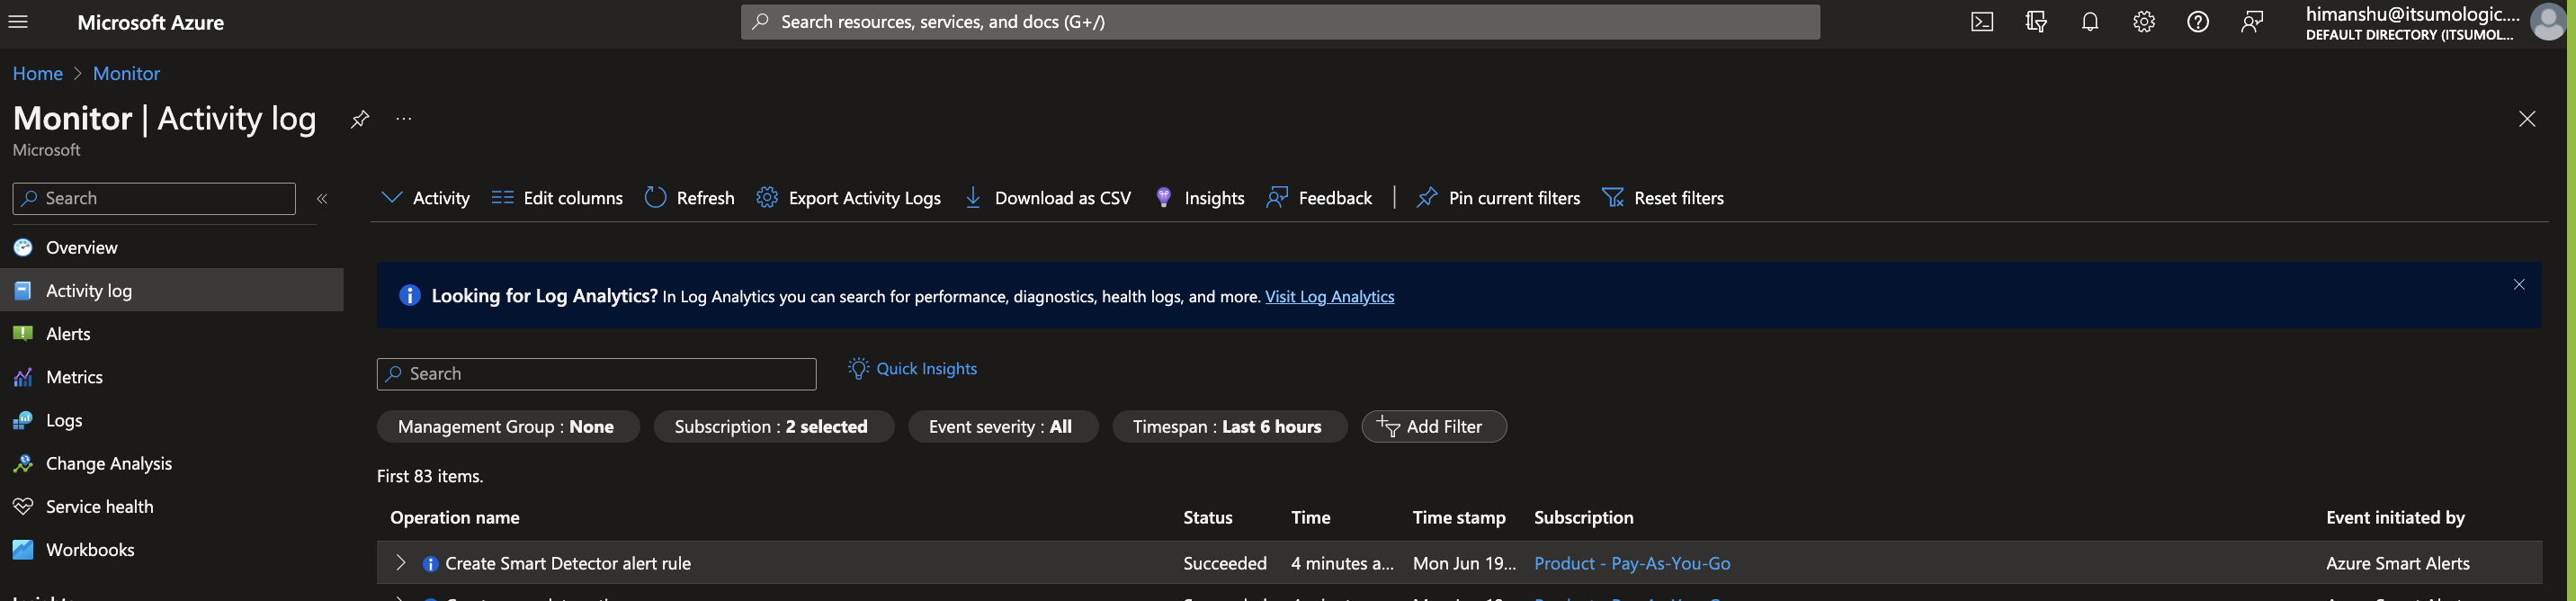
- In the search bar, search and select Activity Log.
- In the Activity Log window, click Export Activity Logs.
- Select the log type in Category details that you want to ingest.
- Select the Stream to an event hub checkbox and then select the following:
- Subscription. Select a subscription.
- Event hub namespace. Select the namespace.
- Event hub name (optional). Select the hub name.
- Event hub policy name. Leave the default policy, RootManageSharedAccessKey, or select another as desired.
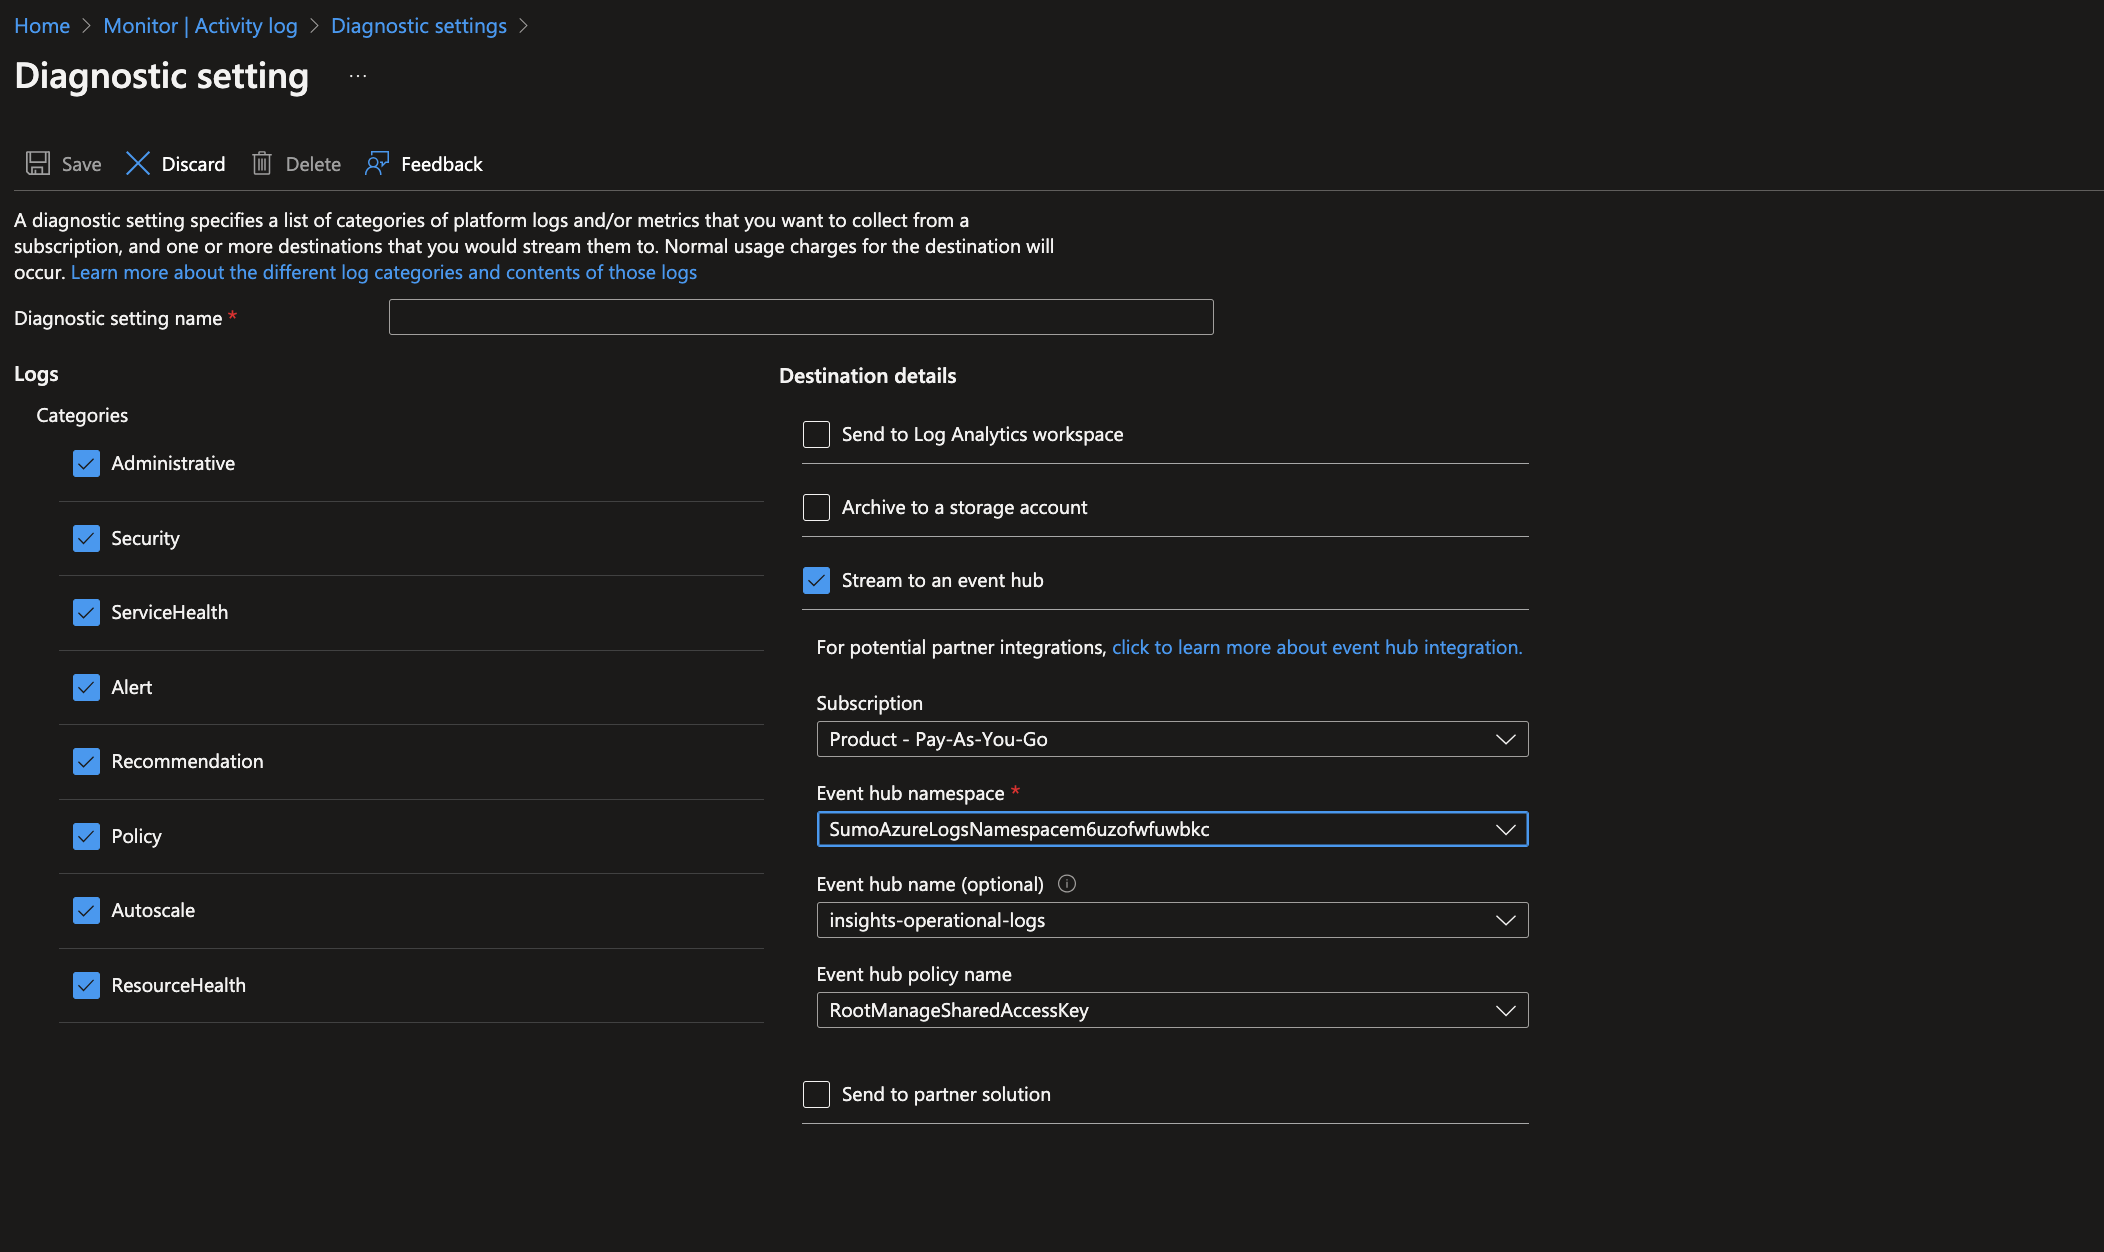
- Click Save.
Installing the Azure Audit app
Now that you have set up collection from the Azure Activity Log (previously known as Azure Audit logs), install the Azure Audit app to use the preconfigured searches and dashboards that provide insight into your data.
To install the app, do the following:
Next-Gen App: To install or update the app, you must be an account administrator or a user with Manage Apps, Manage Monitors, Manage Fields, Manage Metric Rules, and Manage Collectors capabilities depending upon the different content types part of the app.
- Select App Catalog.
- In the 🔎 Search Apps field, run a search for your desired app, then select it.
- Click Install App.
note
Sometimes this button says Add Integration.
- Click Next in the Setup Data section.
- In the Configure section of your respective app, complete the following fields.
- Field Name. If you already have collectors and sources set up, select the configured metadata field name (eg _sourcecategory) or specify other custom metadata (eg: _collector) along with its metadata Field Value.
- Click Next. You will be redirected to the Preview & Done section.
Post-installation
Once your app is installed, it will appear in your Installed Apps folder, and dashboard panels will start to fill automatically.
Each panel slowly fills with data matching the time range query received since the panel was created. Results will not immediately be available but will be updated with full graphs and charts over time.
Viewing Azure Audit dashboards
All dashboards have a set of filters that you can apply to the entire dashboard. Use these filters to drill down and examine the data to a granular level.
- You can change the time range for a dashboard or panel by selecting a predefined interval from a drop-down list, choosing a recently used time range, or specifying custom dates and times. Learn more.
- You can use template variables to drill down and examine the data on a granular level. For more information, see Filtering Dashboards with Template Variables.
- Most Next-Gen apps allow you to provide the scope at the installation time and are comprised of a key (
_sourceCategoryby default) and a default value for this key. Based on your input, the app dashboards will be parameterized with a dashboard variable, allowing you to change the dataset queried by all panels. This eliminates the need to create multiple copies of the same dashboard with different queries.
Overview
Use this dashboard to get a high-level view of Azure activity by location, along with event details.
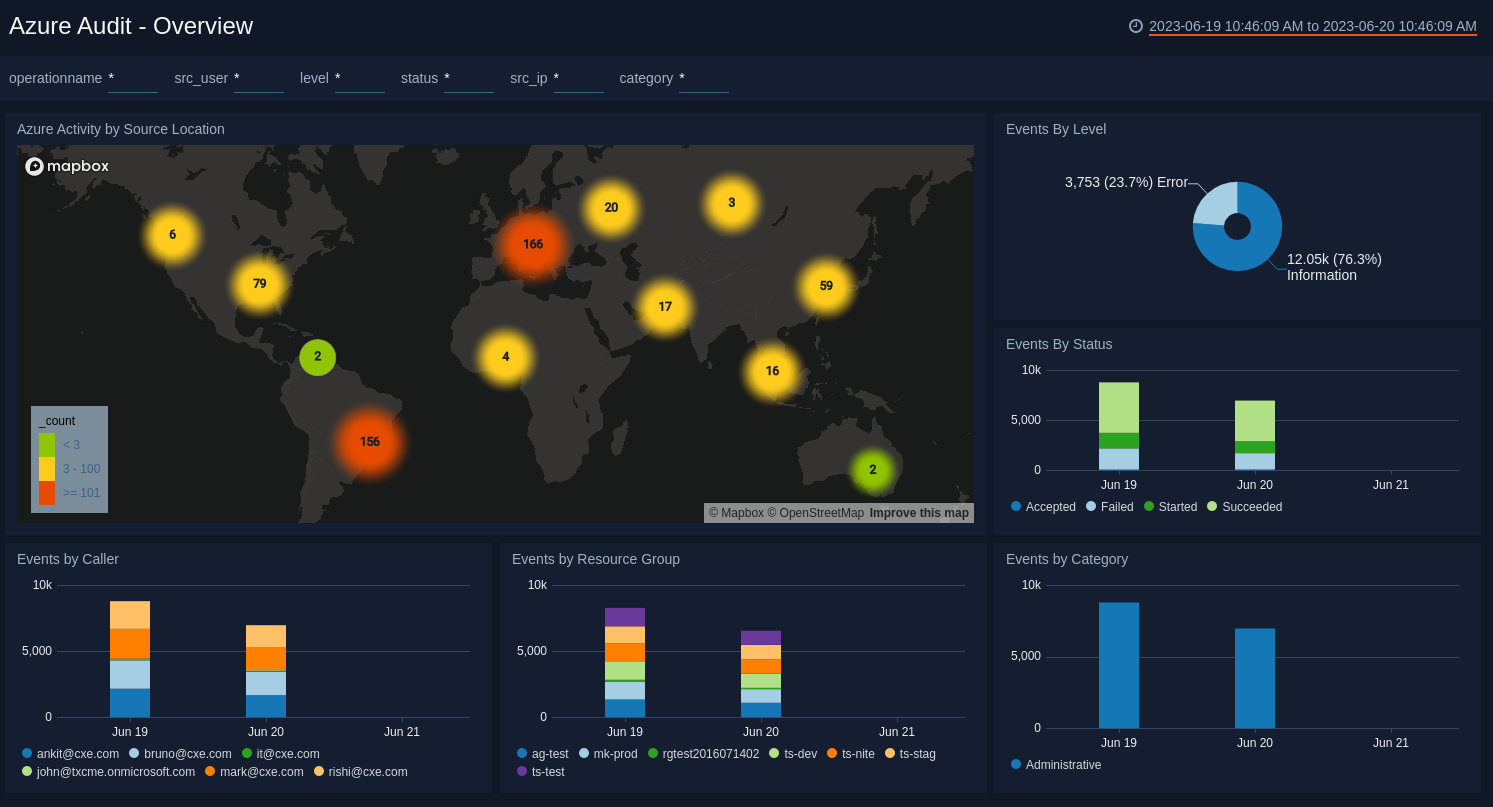
Azure Activity by Source Location. Performs a geo lookup to display the location of Azure activity by Source location on a world map for the last seven days.
Events by Level. Displays events by level in a pie chart for the last seven days.
Events by Status. Shows event details by status in a stacked column chart on a timeline for the last 7 days.
Events by Caller. Provides details on events by caller in a stacked column chart on a timeline for the last seven days.
Events by Resource Group. Displays event details by Resource Group in a stacked column chart on a timeline for the last 7 days.
Events by Category. Shows event details by category in a stacked column chart on a timeline for the last seven days.
Resource Usage
Use this dashboard to view details on resource groups and resource providers.
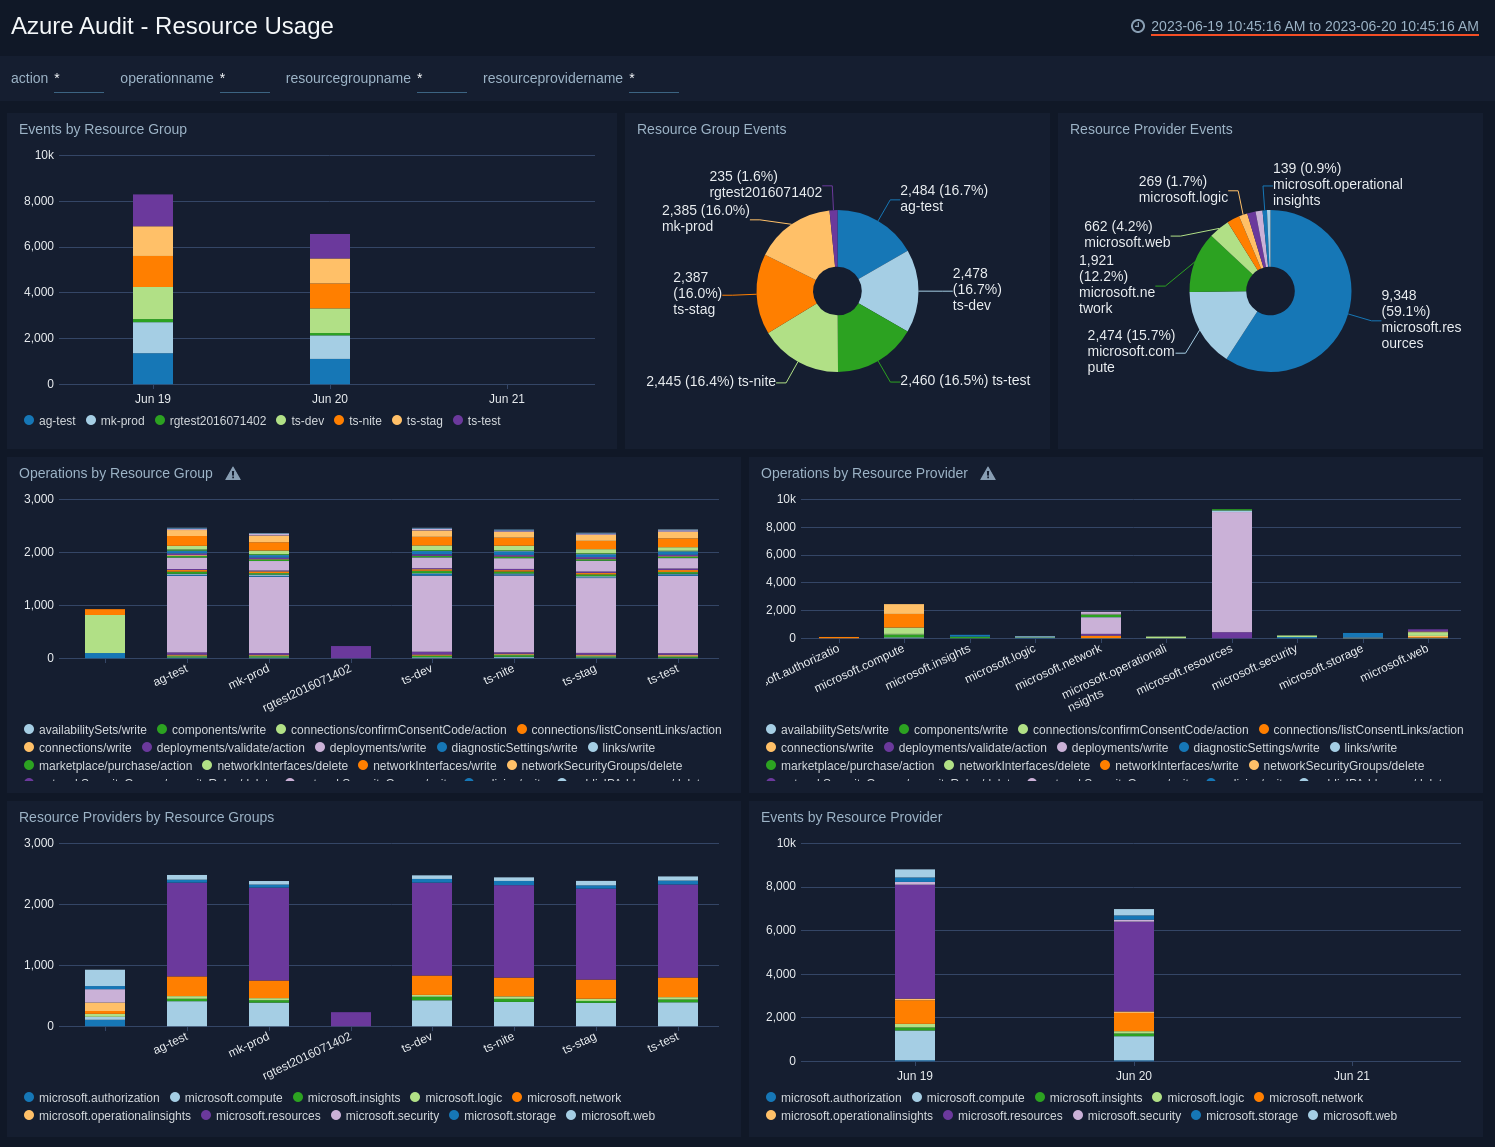
Events by Resource Group. Displays event details by Resource Group over time in a stacked column chart on a timeline for the last 7 days.
Resource Group Events. Shows Resource Group events in a pie chart for the last seven days.
Resource Provider Events. Shows Resource Provider events in a pie chart for the last seven days.
Operations by Resource Group. Shows details on operations by Resource Group by name and count in a stacked column chart for the last seven days.
Operations by Resource Provider. Shows details on operations by Resource Provider by name and count for the last seven days.
Resource Providers by Resource Group. Displays details on Resource Providers by Resource Group by name and count in a stacked column chart for the last seven days.
Events by Resource Provider. Displays event details by Resource Provider over time in a stacked column chart on a timeline for the last seven days.
Service Health
Use this dashboard to view details about Azure service health, including level, status, and events.
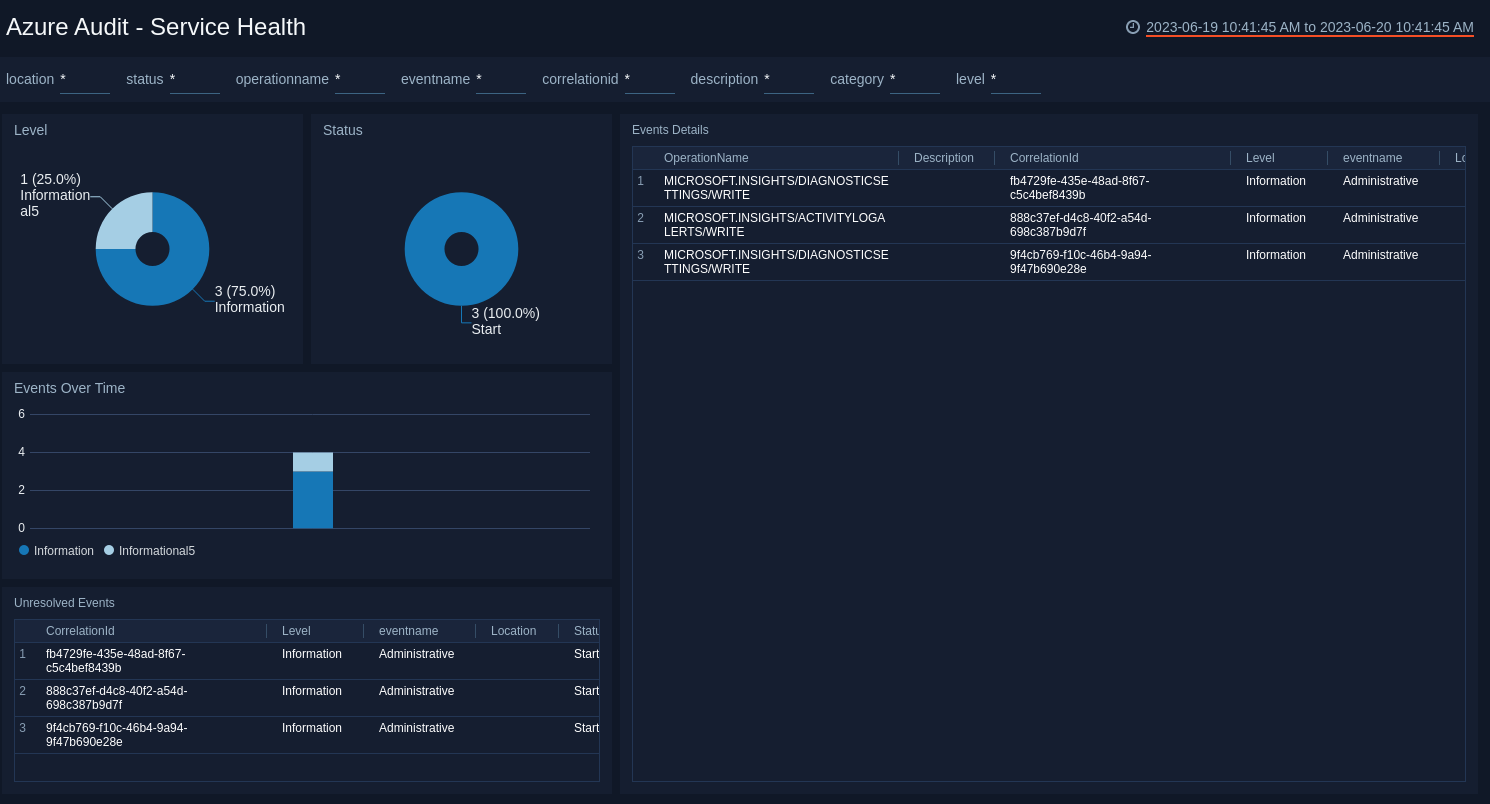
Level. Displays information by level in a pie chart for the last seven days.
Status. Shows status information as a pie chart for the last seven days.
Events Details. Provides information on Azure service health events in a table, including operation name, description, level, correlation ID, event name, location, status, and time for the last seven days.
Events Over Time. Displays events over time in a column chart on a timeline for the last seven days.
Unresolved Events. Provides information on unresolved service health events in a table chart, including details on correlation ID, level, event name, location, status, and time for the last 30 days.
User Activity
Use this dashboard to see the details on events, resources, and users.
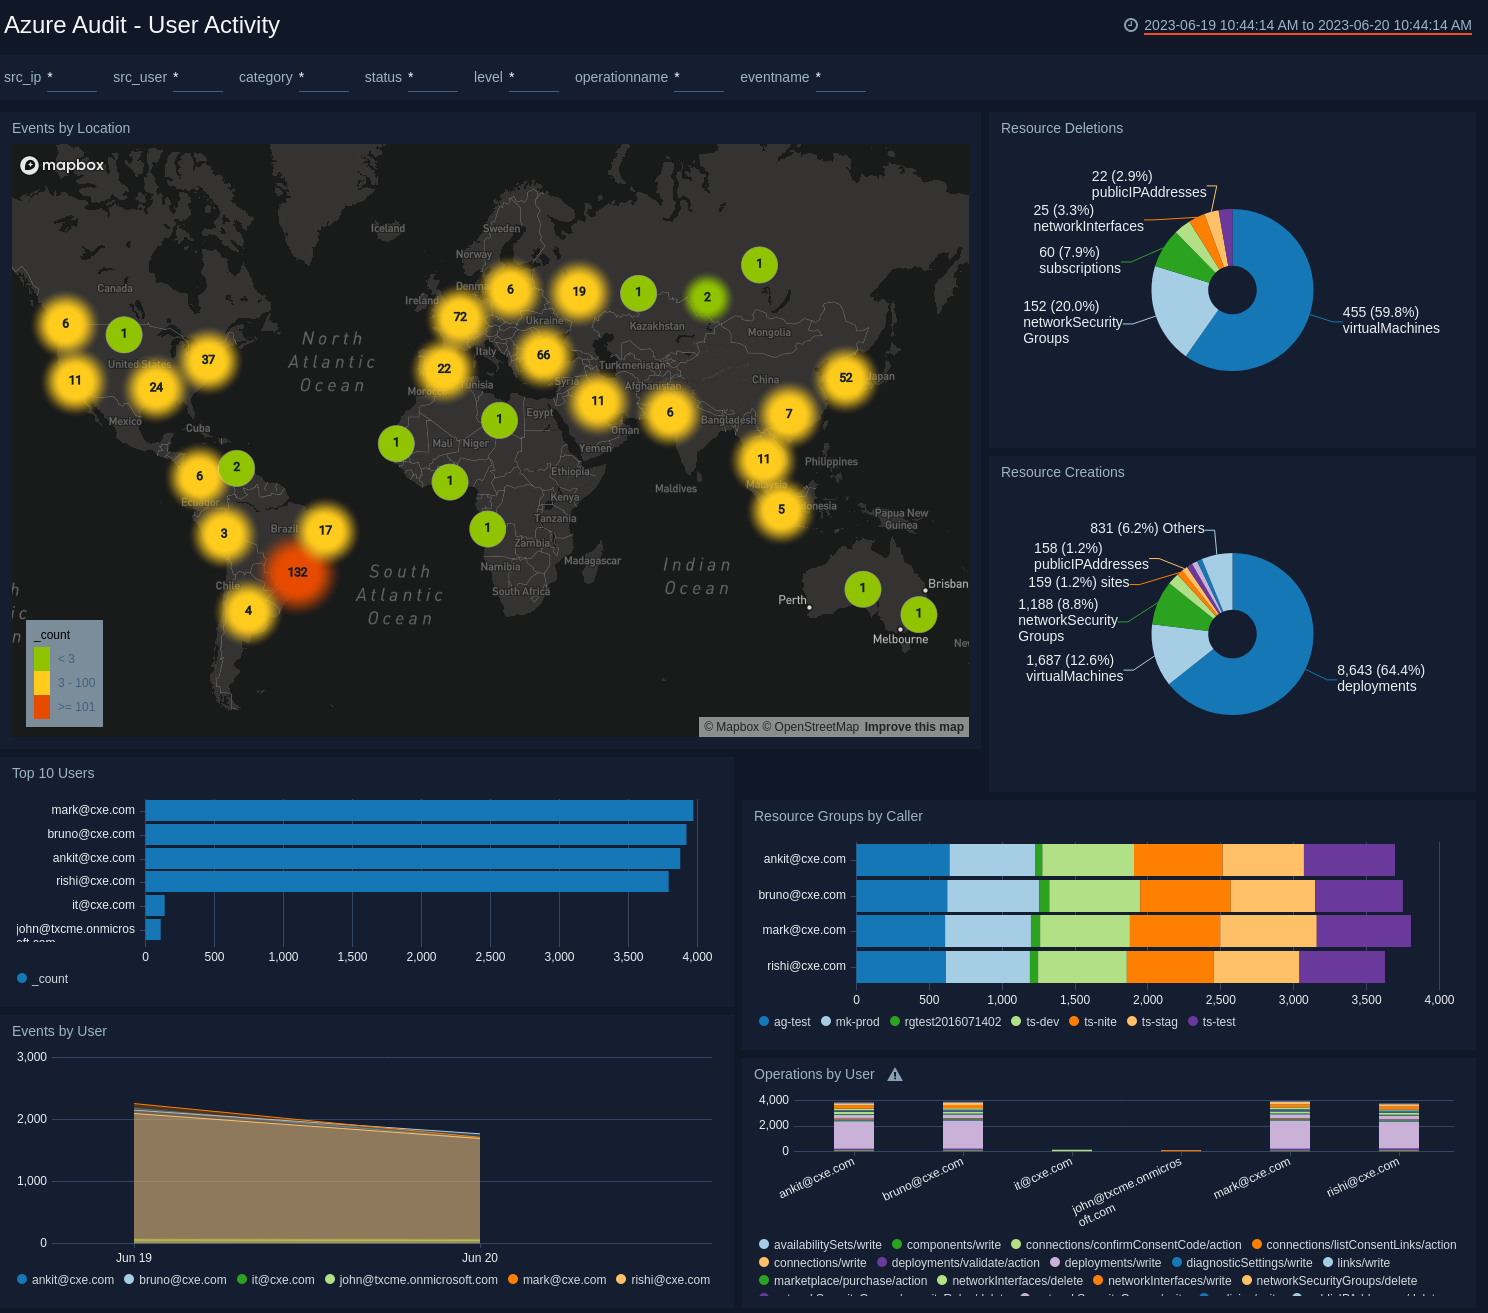
Events by Location. Performs a geo lookup to display user activity events by IP address location on a world map for the last 7 days.
Resource Deletions. Displays resource deletions in a pie chart for the last seven days.
Resource Creations. Provides a pie chart of resource creations for the last seven days.
Top 10 Users. Displays the top 10 users by name and event count in a bar chart for the last seven days.
Resource Groups by Caller. Shows Resource Groups by caller in a stacked bar chart by name and count for the last seven days.
Events by User. Provides details on events per user in an area chart on a timeline for the last seven days.
Operations by User. Displays operations by user in a stacked column chart by name and count for the last seven days.
Create monitors for the Azure Audit app
From your App Catalog:
- From the Sumo Logic navigation, select App Catalog.
- In the Search Apps field, search for and then select your app.
- Make sure the app is installed.
- Navigate to What's Included tab and scroll down to the Monitors section.
- Click Create next to the pre-configured monitors. In the create monitors window, adjust the trigger conditions and notifications settings based on your requirements.
- Scroll down to Monitor Details.
- Under Location click on New Folder.
note
By default, monitor will be saved in the root folder. So to make the maintenance easier, create a new folder in the location of your choice.
- Enter Folder Name. Folder Description is optional.
tip
Using app version in the folder name will be helpful to determine the versioning for future updates.
- Click Create. Once the folder is created, click on Save.
Azure Audit alerts
| Name | Description | Alert Condition | Recover Condition |
|---|---|---|---|
Azure Audit - Critical or Error Events Detected | This alert is triggered when Azure Activity Log events with Critical or Error severity level are detected. These events indicate significant operational failures, resource provisioning errors, or service-level problems that require immediate investigation. | Count > 0 | Count < = 0 |
Azure Audit - Mass Resource Deletion | This alert is triggered when a high volume of resource deletion operations are detected within a short time window. Mass deletions may indicate a compromised account being used to destroy infrastructure, ransomware activity, or an accidental bulk deletion event that requires immediate response. | Count > 0 | Count < = 0 |
Azure Audit - Service Health Incident | This alert is triggered when Azure Service Health reports a Critical or Error-level incident. These events indicate active Azure platform issues such as service outages, degraded performance, or planned maintenance that may affect your workloads and require attention or mitigation. | Count > 0 | Count < = 0 |
Azure Audit - Network Security Group Rule Changed | This alert is triggered when Network Security Group (NSG) rules are created, modified, or deleted. Unauthorized changes to NSG rules can expose resources to the internet, open sensitive ports, or weaken network segmentation, potentially leading to unauthorized access or data exfiltration. | Count > 0 | Count < = 0 |
Azure Audit - Policy Assignment Deleted | This alert is triggered when an Azure Policy assignment is deleted. Policy assignments enforce compliance rules across resources. Deleting them may weaken the organization's security posture, allow non-compliant resource configurations, or indicate an attacker removing guardrails before making malicious changes. | Count > 0 | Count < = 0 |
Azure Audit - Resource Lock Removed | This alert is triggered when a resource lock (CanNotDelete or ReadOnly) is removed from an Azure resource. Resource locks prevent accidental or malicious deletion of critical infrastructure. Their removal may be a precursor to unauthorized resource destruction or indicate a compromised privileged account. | Count > 0 | Count < = 0 |
Azure Audit - Excessive Failed Operations | This alert is triggered when a high number of failed Azure operations are detected from a single user or IP address. A sudden spike in failures may indicate misconfigured automation, unauthorized access attempts, permission escalation probing, or a brute-force attack against Azure resource management APIs. | Count > 0 | Count < = 0 |
Azure Audit - Excessive Resource Creation | This alert is triggered when a high volume of resource creation (WRITE) operations are detected from a single user or IP address. Excessive resource creation may indicate cryptomining deployment, unauthorized infrastructure provisioning, cost abuse, or a compromised service principal spinning up attacker-controlled resources. | Count > 0 | Count < = 0 |
Azure Audit - Key Vault Access Policy Changed | This alert is triggered when Azure Key Vault access policies are modified. Key Vaults store secrets, certificates, and encryption keys. Unauthorized changes to access policies can grant attackers access to sensitive credentials, enable data decryption, or facilitate lateral movement across the environment. | Count > 0 | Count < = 0 |
Upgrade/Downgrade the Azure Audit app (Optional)
To update the app, do the following:
Next-Gen App: To install or update the app, you must be an account administrator or a user with Manage Apps, Manage Monitors, Manage Fields, Manage Metric Rules, and Manage Collectors capabilities depending upon the different content types part of the app.
- Select App Catalog.
- In the Search Apps field, search for and then select your app.
Optionally, you can identify apps that can be upgraded in the Upgrade available section. - To upgrade the app, select Upgrade from the Manage dropdown.
- If the upgrade does not have any configuration or property changes, you will be redirected to the Preview & Done section.
- If the upgrade has any configuration or property changes, you will be redirected to the Setup Data page.
- In the Configure section of your respective app, complete the following fields.
- Field Name. If you already have collectors and sources set up, select the configured metadata field name (eg _sourcecategory) or specify other custom metadata (eg: _collector) along with its metadata Field Value.
- Click Next. You will be redirected to the Preview & Done section.
Post-update
Your upgraded app will be installed in the Installed Apps folder and dashboard panels will start to fill automatically.
See our Release Notes changelog for new updates in the app.
To revert the app to a previous version, do the following:
- Select App Catalog.
- In the Search Apps field, search for and then select your app.
- To version down the app, select Revert to < previous version of your app > from the Manage dropdown.
Uninstalling the Azure Audit app (Optional)
To uninstall the app, do the following:
- Select App Catalog.
- In the 🔎 Search Apps field, run a search for your desired app, then select it.
- Click Uninstall.