Azure SQL Managed Instance

Azure SQL Managed Instance is a scalable cloud database service that's always running on the latest stable version of the Microsoft SQL Server database engine and a patched OS with 99.99% built-in high availability, offering close to 100% feature compatibility with SQL Server. This integration helps in monitoring resource usage and tracking database events of your managed instances.
Log and metric types
For Azure SQL Managed Instance, you can collect the following logs and metrics:
- Resource usage statistics
- DevOps operations audit logs
- SQL security audit event
Azure SQL Managed Instance metrics are available in the Microsoft.Sql/managedInstances namespace. For more details on Azure SQL Managed Instance logs and metrics, refer to the Azure documentation.
Setup
Azure service sends monitoring data to Azure Monitor, which can then stream data to an Eventhub. Sumo Logic supports:
- Logs collection from Azure Monitor using our Azure Eventhubs source.
- Activity logs collection from Azure Monitor using our Azure Eventhubs source. We recommend you create a separate source for activity logs. If you are already collecting these logs, you can skip this step.
- Metrics collection using our Azure Metrics Source.
You must explicitly enable diagnostic settings for each Azure SQL Managed Instance that you want to monitor. You can forward logs to the same Eventhub provided they satisfy the limitations and permissions as described here.
When you configure the Eventhubs source or Azure metrics source, plan your source category to ease the querying process. A hierarchical approach allows you to make use of wildcards. For example: Azure/SQLManagedInstance/Logs, Azure/SQLManagedInstance/ActivityLogs, and Azure/SQLManagedInstance/Metrics.
Configure collector
Create a hosted collector if not already configured and tag the tenant_name field. You can get the tenant name using the instructions here. Make sure you create the required sources in this collector. 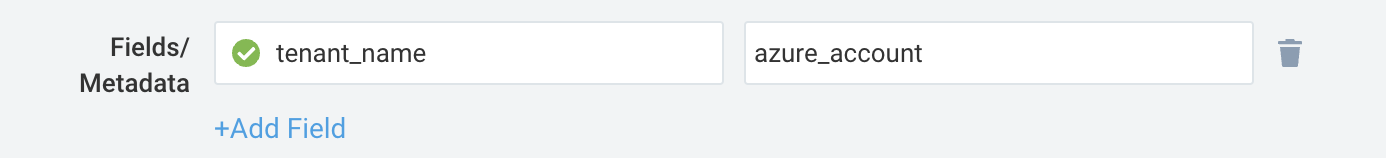
Configure metrics collection
To set up the Azure Metrics source in Sumo Logic, refer to Azure Metrics Source.
Configure logs collection
Diagnostic logs
In this section, you will configure a pipeline for shipping diagnostic logs from Azure Monitor to an Eventhub.
- To set up the Azure Eventhubs source in Sumo Logic, refer to Azure Eventhubs Source for Logs.
- To create the diagnostic settings in Azure portal, refer to the Azure documentation. Perform below steps for each Azure SQL Managed Instance that you want to monitor.
- Choose
Stream to an Eventhubas the destination. - Select
allLogs. - Use the Eventhub namespace and Eventhub name configured in previous step in destination details section. You can use the default policy
RootManageSharedAccessKeyas the policy name.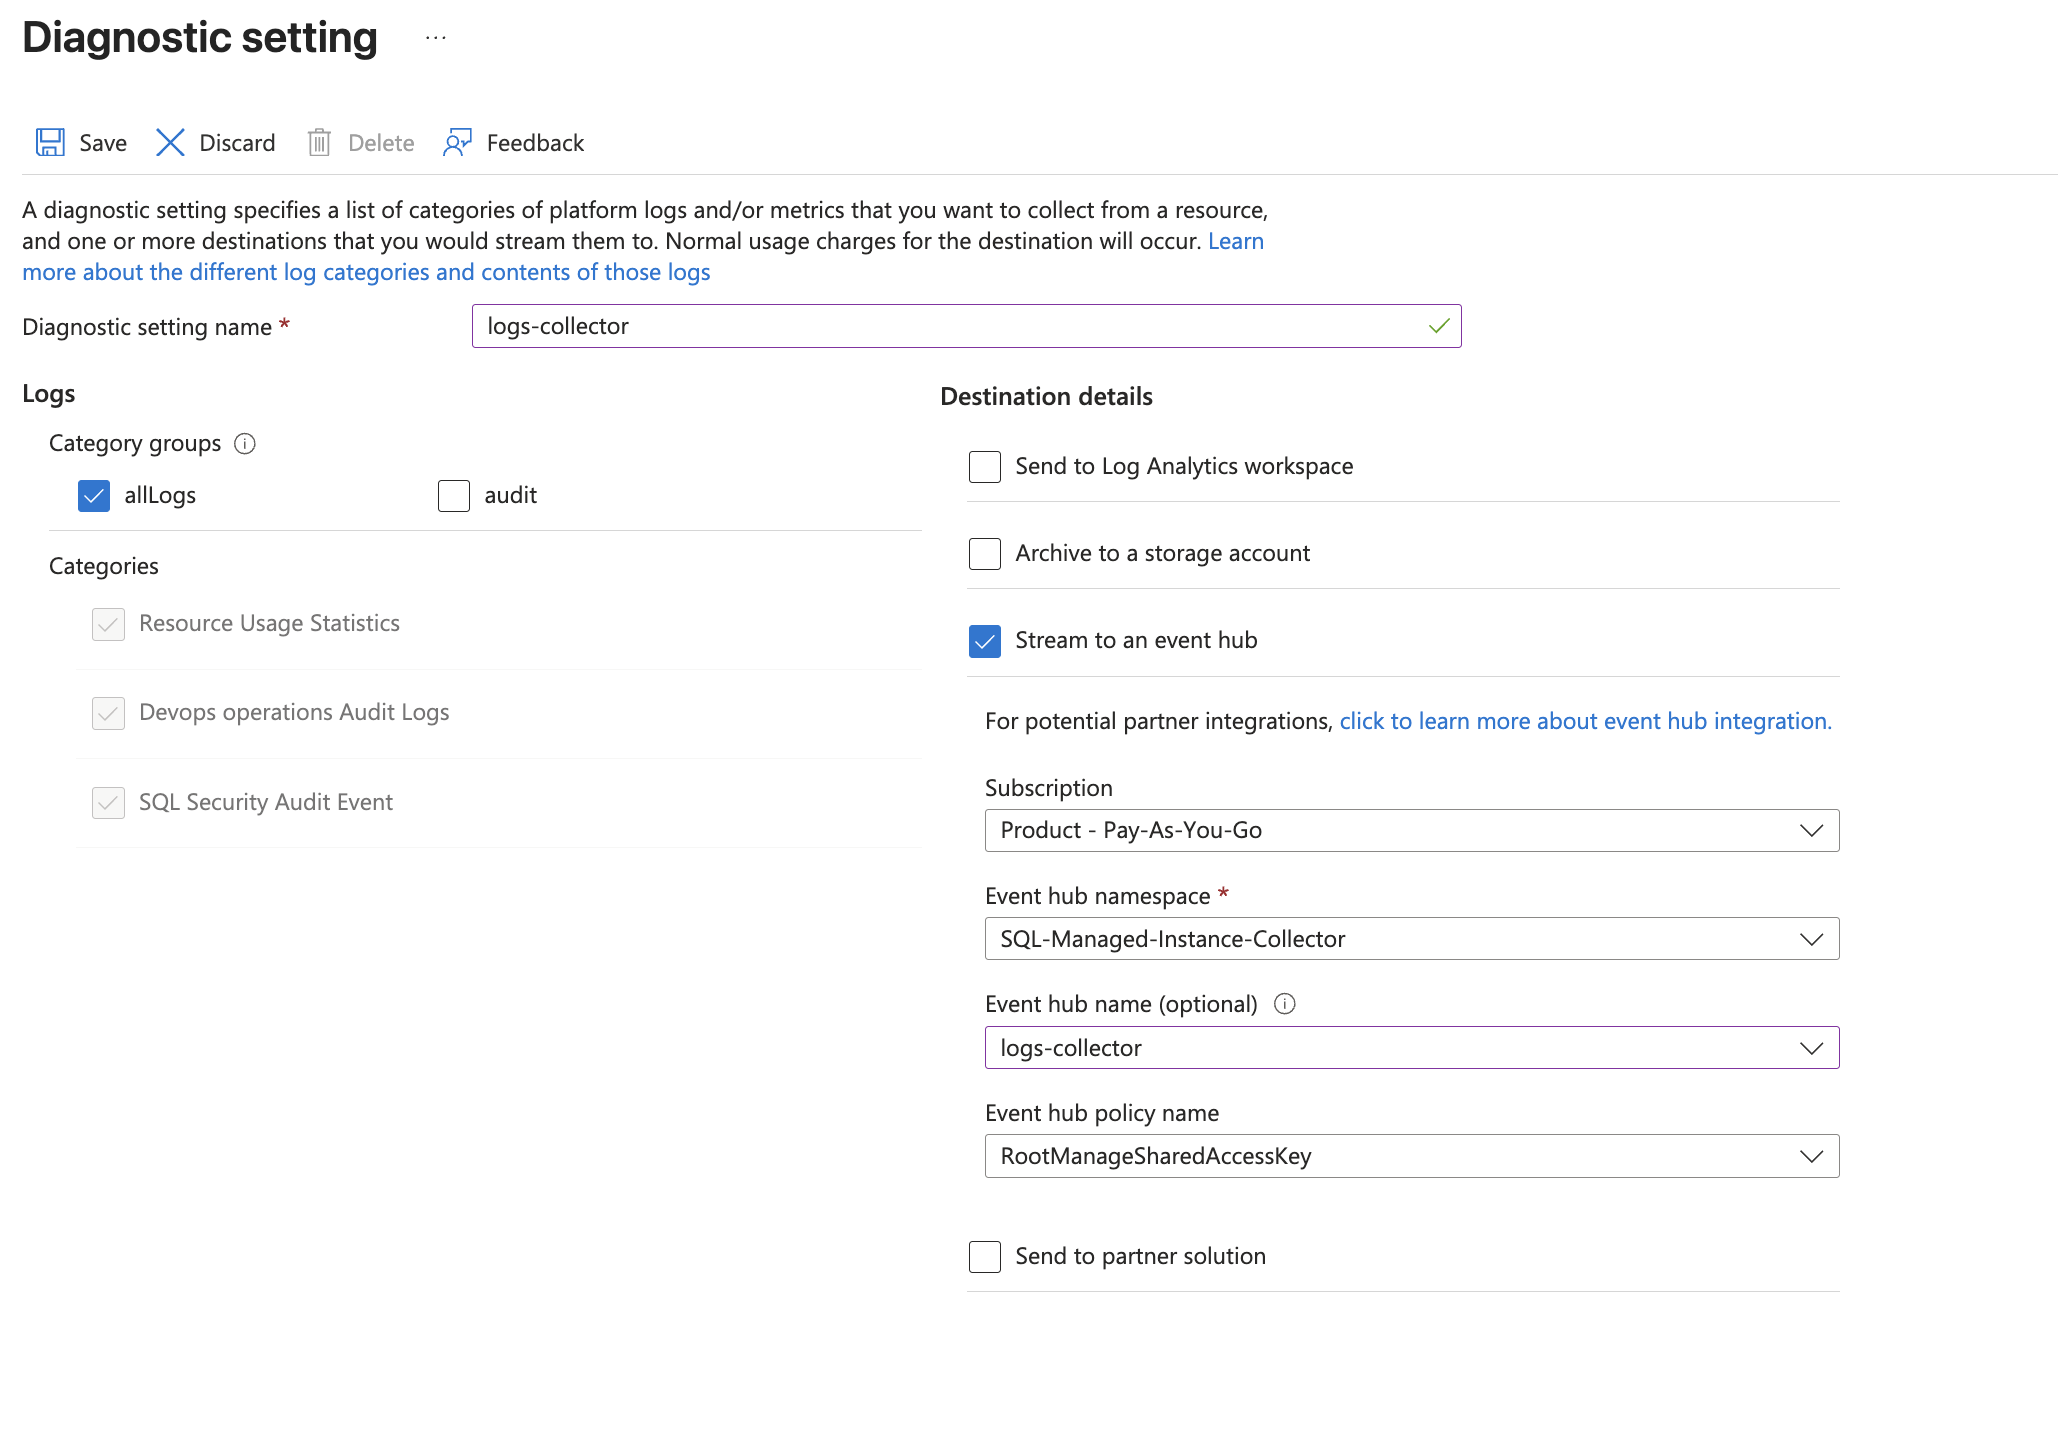
- Choose
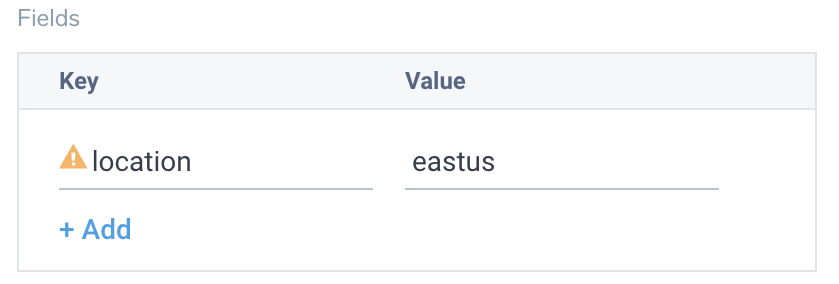
- Tag the location field in the source with right location value.
Activity logs (optional)
To collect activity logs, follow the instructions here. If you are already collecting activity logs for a subscription, you can skip this step.
Since this source includes logs from multiple regions, do not tag it with the location tag.