Azure SQL Managed Instance

Azure SQL Managed Instance is a scalable cloud database service that's always running on the latest stable version of the Microsoft SQL Server database engine and a patched OS with 99.99% built-in high availability, offering close to 100% feature compatibility with SQL Server. This integration helps monitor resource usage and track database events for your managed instances.
Log and metric types
For Azure SQL Managed Instance, you can collect the following logs and metrics:
- Errors. Contains error event data for managed instance databases, including error number, severity, state, and affected database context.
- DatabaseWaitStatistics. Contains wait statistics events recording wait type, wait time, signal wait time, and task count per database.
- QueryStoreRuntimeStatistics. Contains query runtime statistics events including CPU time, duration, logical I/O reads and writes, and execution counts per query hash.
- SQLSecurityAuditEvents. Contains SQL security audit events recording authentication, DML, DDL, and permission events with principal, client application, and host information.
- DevOpsOperationsAudit. Contains DevOps operations audit events that record control-plane operations, such as session changes, server-level configuration changes, and policy events.
- Timeouts. Contains timeout event data for queries that exceeded execution time limits.
- ResourceUsageStats. Contains resource usage statistics events for CPU, storage, and I/O utilization at the instance level.
Azure SQL Managed Instance metrics are available in the Microsoft.Sql/managedInstances namespace. For more details on Azure SQL Managed Instance logs and metrics, refer to the Azure documentation.
Setup
Azure service sends monitoring data to Azure Monitor, which can then stream data to an Event Hub. Sumo Logic supports:
- Logs collection from Azure Monitor using our Azure Event Hubs source.
- Activity logs collection from Azure Monitor using our Azure Event Hubs source. We recommend you create a separate source for activity logs. If you are already collecting these logs, you can skip this step.
- Metrics collection using our Azure Metrics Source.
You must explicitly enable diagnostic settings for each Azure SQL Managed Instance that you want to monitor. You can forward logs to the same Event Hub, provided they satisfy the limitations and permissions as described here.
When you configure the Event Hubs source or the Azure Metrics source, plan your source category to simplify querying. A hierarchical approach allows you to make use of wildcards. For example: Azure/SQLManagedInstance/Logs, Azure/SQLManagedInstance/ActivityLogs, and Azure/SQLManagedInstance/Metrics.
Configure collector
Create a hosted collector if not already configured and tag the tenant_name field. You can get the tenant name using the instructions here. Make sure you create the required sources in this collector. 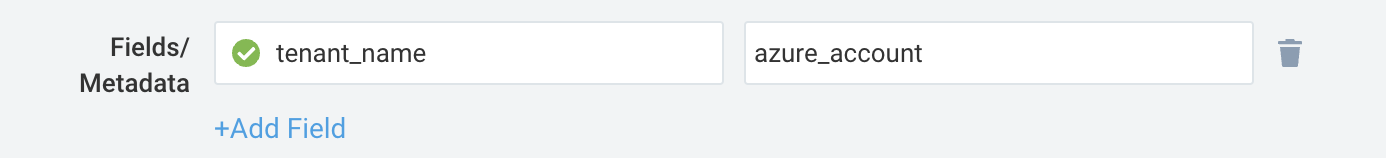
Configure metrics collection
To set up the Azure Metrics source in Sumo Logic, refer to Azure Metrics Source.
Configure logs collection
Diagnostic logs
In this section, you will configure a pipeline for shipping diagnostic logs from Azure Monitor to an Event Hub.
- To set up the Azure Event Hubs source in Sumo Logic, refer to Azure Event Hubs Source for Logs.
- To create the diagnostic settings in the Azure portal, refer to the Azure documentation. Perform the following steps for each Azure SQL Managed Instance that you want to monitor.
- Choose
Stream to an event hubas the destination. - Select
allLogs.- Use the Event Hub namespace and Event Hub name configured in the previous step in the destination details section. You can use the default policy
RootManageSharedAccessKeyas the policy name.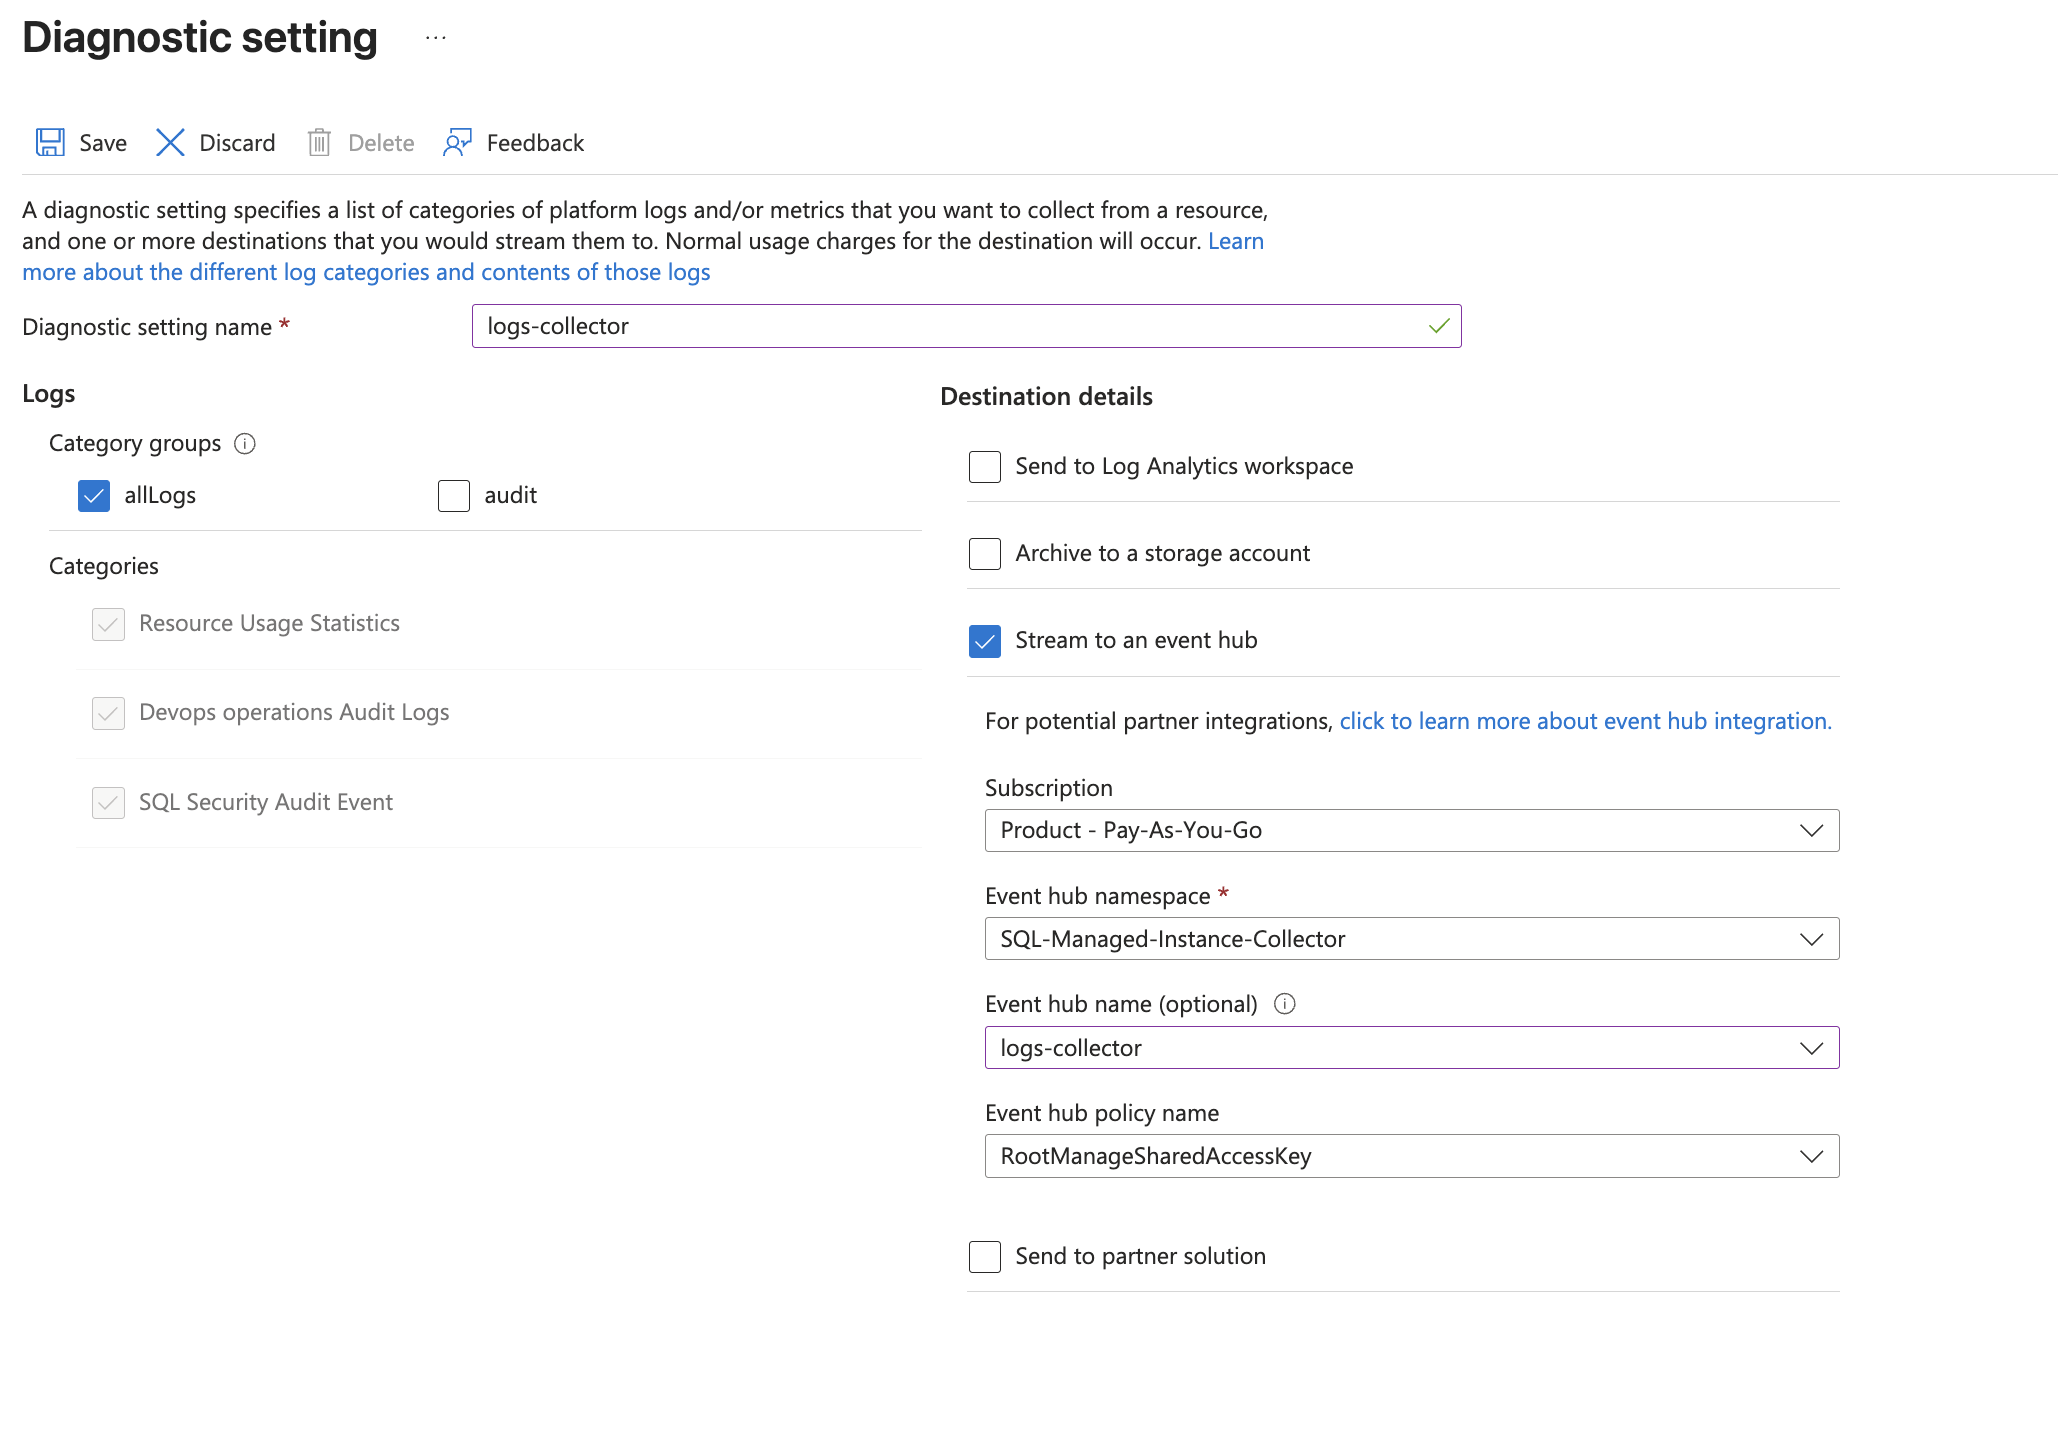
- Use the Event Hub namespace and Event Hub name configured in the previous step in the destination details section. You can use the default policy
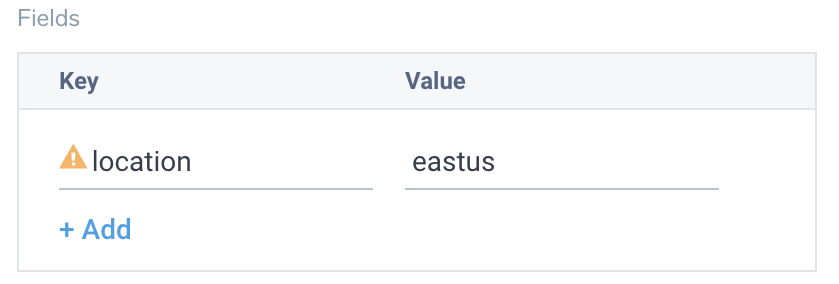
- Tag the location field in the source with the right location value.
Activity logs (optional)
To collect activity logs, follow the instructions here. If you are already collecting activity logs for a subscription, you can skip this step.
Since this source includes logs from multiple regions, do not tag it with the location tag.
Installing the Azure SQL Managed Instance app
This section provides instructions for installing the Azure SQL Managed Instance app for Sumo Logic and descriptions of each of the pre-configured dashboards.
To install the app, do the following:
Next-Gen App: To install or update the app, you must be an account administrator or a user with Manage Apps, Manage Monitors, Manage Fields, Manage Metric Rules, and Manage Collectors capabilities depending upon the different content types part of the app.
- Select App Catalog.
- In the 🔎 Search Apps field, run a search for your desired app, then select it.
- Click Install App.
note
Sometimes this button says Add Integration.
- Click Next in the Setup Data section.
- In the Configure App section of your respective app, complete the following field.
- Index. Specify value for _index if the collection is configured with custom partition. Learn more. Default value is set to
sumologic_default(default partition)
- Index. Specify value for _index if the collection is configured with custom partition. Learn more. Default value is set to
- Click Next. You will be redirected to the Preview & Done section.
Post-installation
Once your app is installed, it will appear in your Installed Apps folder, and dashboard panels will start to fill automatically.
Each panel slowly fills with data matching the time range query received since the panel was created. Results will not immediately be available but will be updated with full graphs and charts over time.
As part of the app installation, the following fields will be created by default:
tenant_name. This is a collector-level field set during collector configuration. Its value is the name of your Azure tenant.location. The region to which the resource name belongs.subscription_id. ID associated with a subscription where the resource is present.resource_group. The resource group name where the Azure resource is present.provider_name. Azure resource provider name (for example, Microsoft.Sql).resource_type. Azure resource type (for example, managedInstances).resource_name. The name of the resource (for example, managed instance name).service_type. The type of service that can be accessed with an Azure resource.service_name. Services that can be accessed with an Azure resource.
As part of the app installation process, the following FERs will be created by default:
Azure location extraction FER
Rule Name: AzureLocationExtractionFER
Applied at: Ingest Time
Scope (Specific Data): tenant_name=*
json "location", "properties.resourceLocation", "properties.region" as location, resourceLocation, service_region nodrop
| replace(toLowerCase(resourceLocation), " ", "") as resourceLocation
| if (!isBlank(resourceLocation), resourceLocation, location) as location
| if (!isBlank(service_region), service_region, location) as location
| if (isBlank(location), "global", location) as location
| fields location
Resource ID extraction FER
Rule Name: AzureResourceIdExtractionFER
Applied at: Ingest Time
Scope (Specific Data): tenant_name=*
json "resourceId", "ResourceId" as resourceId1, resourceId2 nodrop
| if (isBlank(resourceId1), resourceId2, resourceId1) as resourceId
| toUpperCase(resourceId) as resourceId
| parse regex field=resourceId "/SUBSCRIPTIONS/(?<subscription_id>[^/]+)" nodrop
| parse field=resourceId "/RESOURCEGROUPS/*/" as resource_group nodrop
| parse regex field=resourceId "/PROVIDERS/(?<provider_name>[^/]+)" nodrop
| parse regex field=resourceId "/PROVIDERS/[^/]+(?:/LOCATIONS/[^/]+)?/(?<resource_type>[^/]+)/(?<resource_name>.+)" nodrop
| parse regex field=resource_name "(?<parent_resource_name>[^/]+)(?:/PROVIDERS/[^/]+)?/(?<service_type>[^/]+)/?(?<service_name>.+)" nodrop
| if (isBlank(parent_resource_name), resource_name, parent_resource_name) as resource_name
| fields subscription_id, location, provider_name, resource_group, resource_type, resource_name, service_type, service_name
Viewing the Azure SQL Managed Instance dashboards
All dashboards have a set of filters that you can apply to the entire dashboard. Use these filters to drill down and examine the data to a granular level.
- You can change the time range for a dashboard or panel by selecting a predefined interval from a drop-down list, choosing a recently used time range, or specifying custom dates and times. Learn more.
- You can use template variables to drill down and examine the data on a granular level. For more information, see Filtering Dashboards with Template Variables.
- Many of the Next-Gen apps allow you to provide the Index at the installation time and a default value for this key (sumologic_default). Based on your input, the app dashboards will be parameterized with a dashboard variable, allowing you to change the data partition queried by all panels. This restricts the query scope of all the dashboard queries to a specific data partition.
Overview
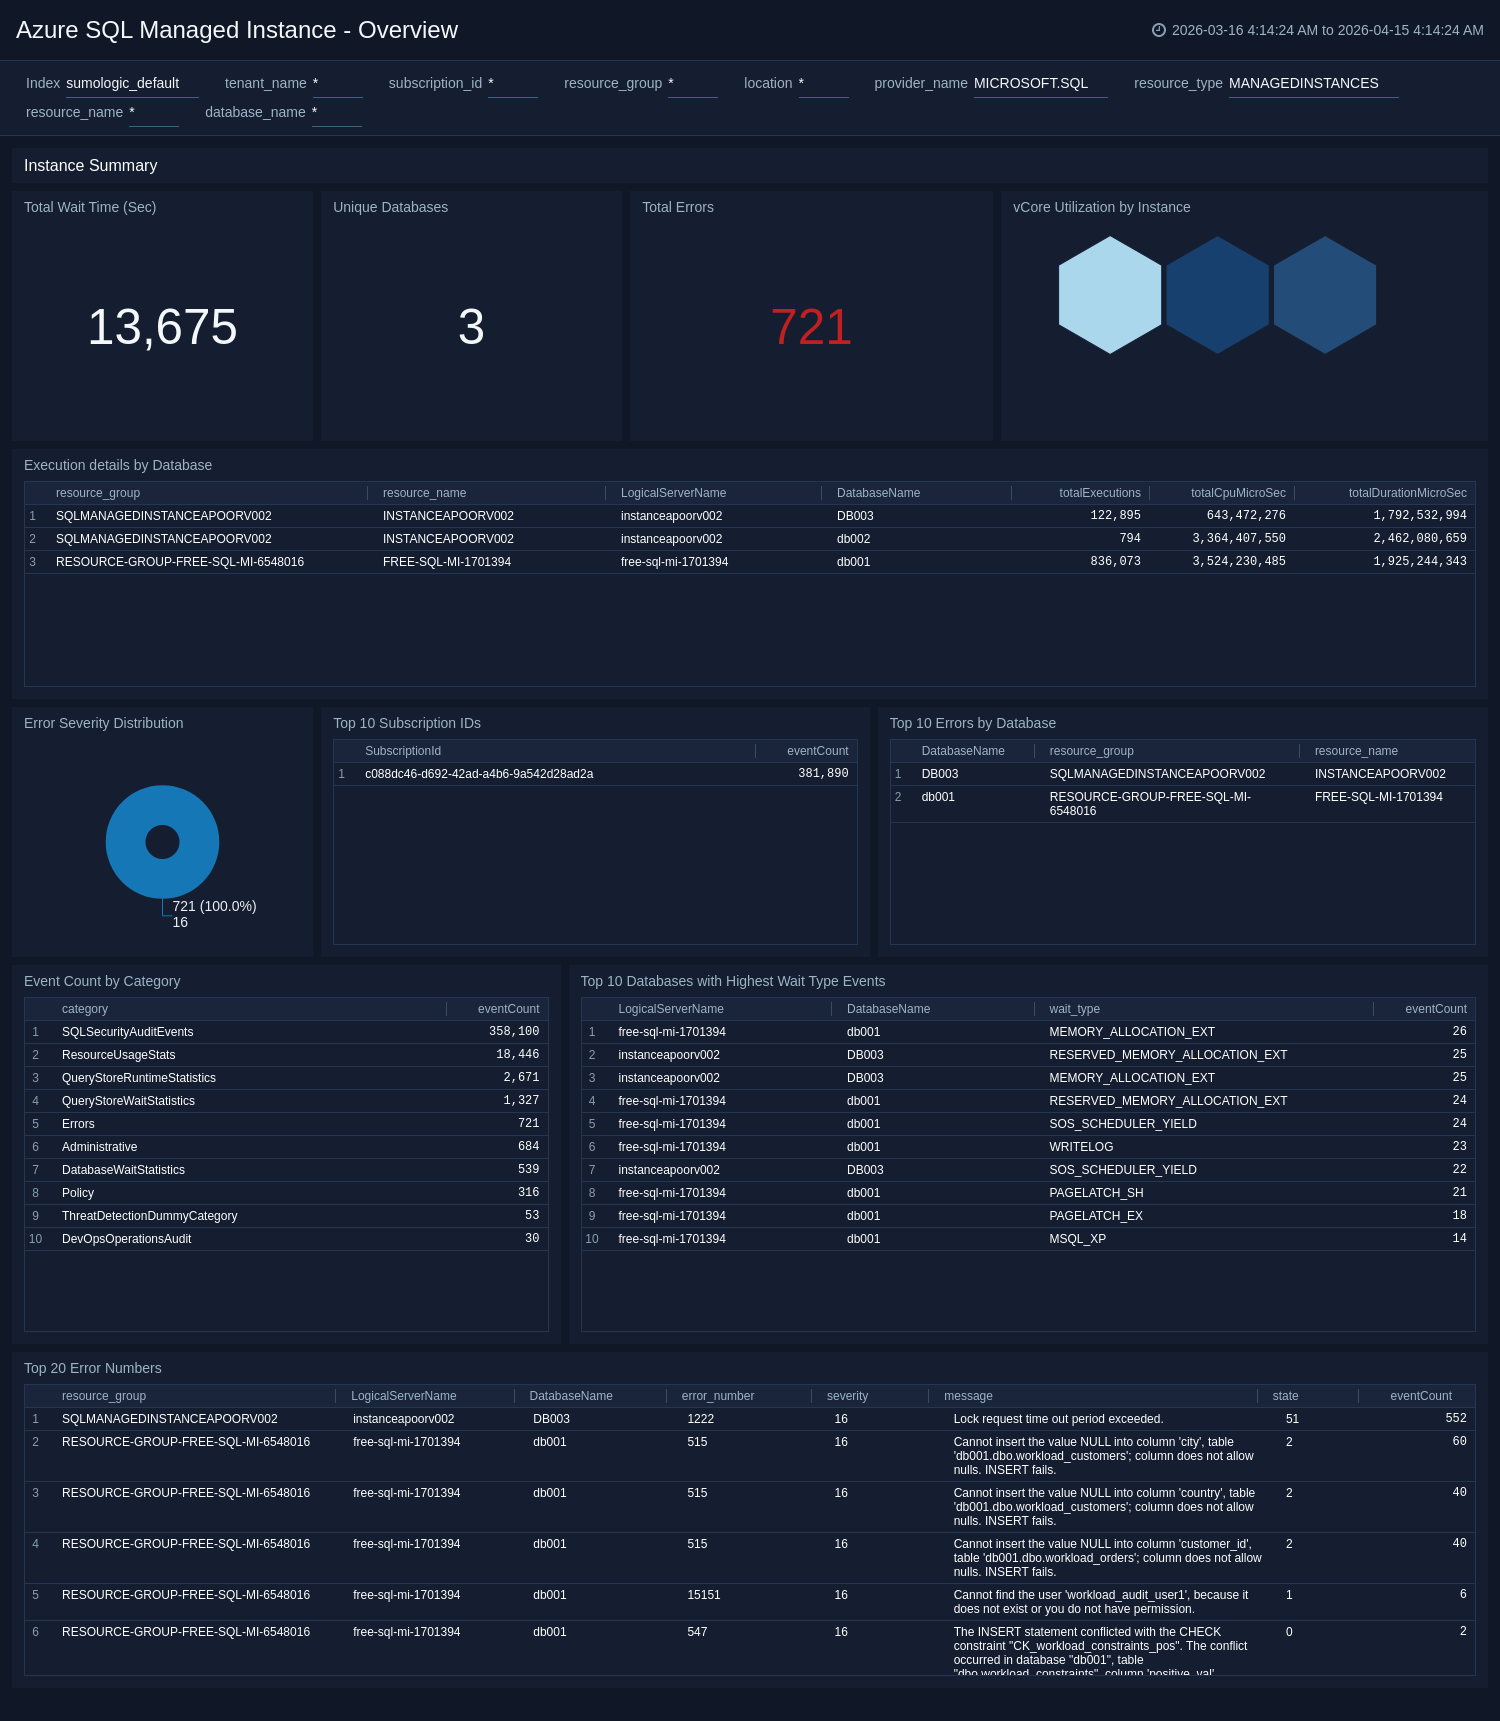
The Azure SQL Managed Instance - Overview dashboard provides a high-level summary of managed instance counts, error activity, audit event volume, query activity, and resource utilization across all instances.
Use this dashboard to:
- Monitor total managed instance count, error totals, audit events, and unique active databases at a glance.
- Identify the top 10 most active databases and highest-volume instances to prioritize operational attention.
- Track vCore utilization, event volume by category, and error distribution by database to assess overall health.
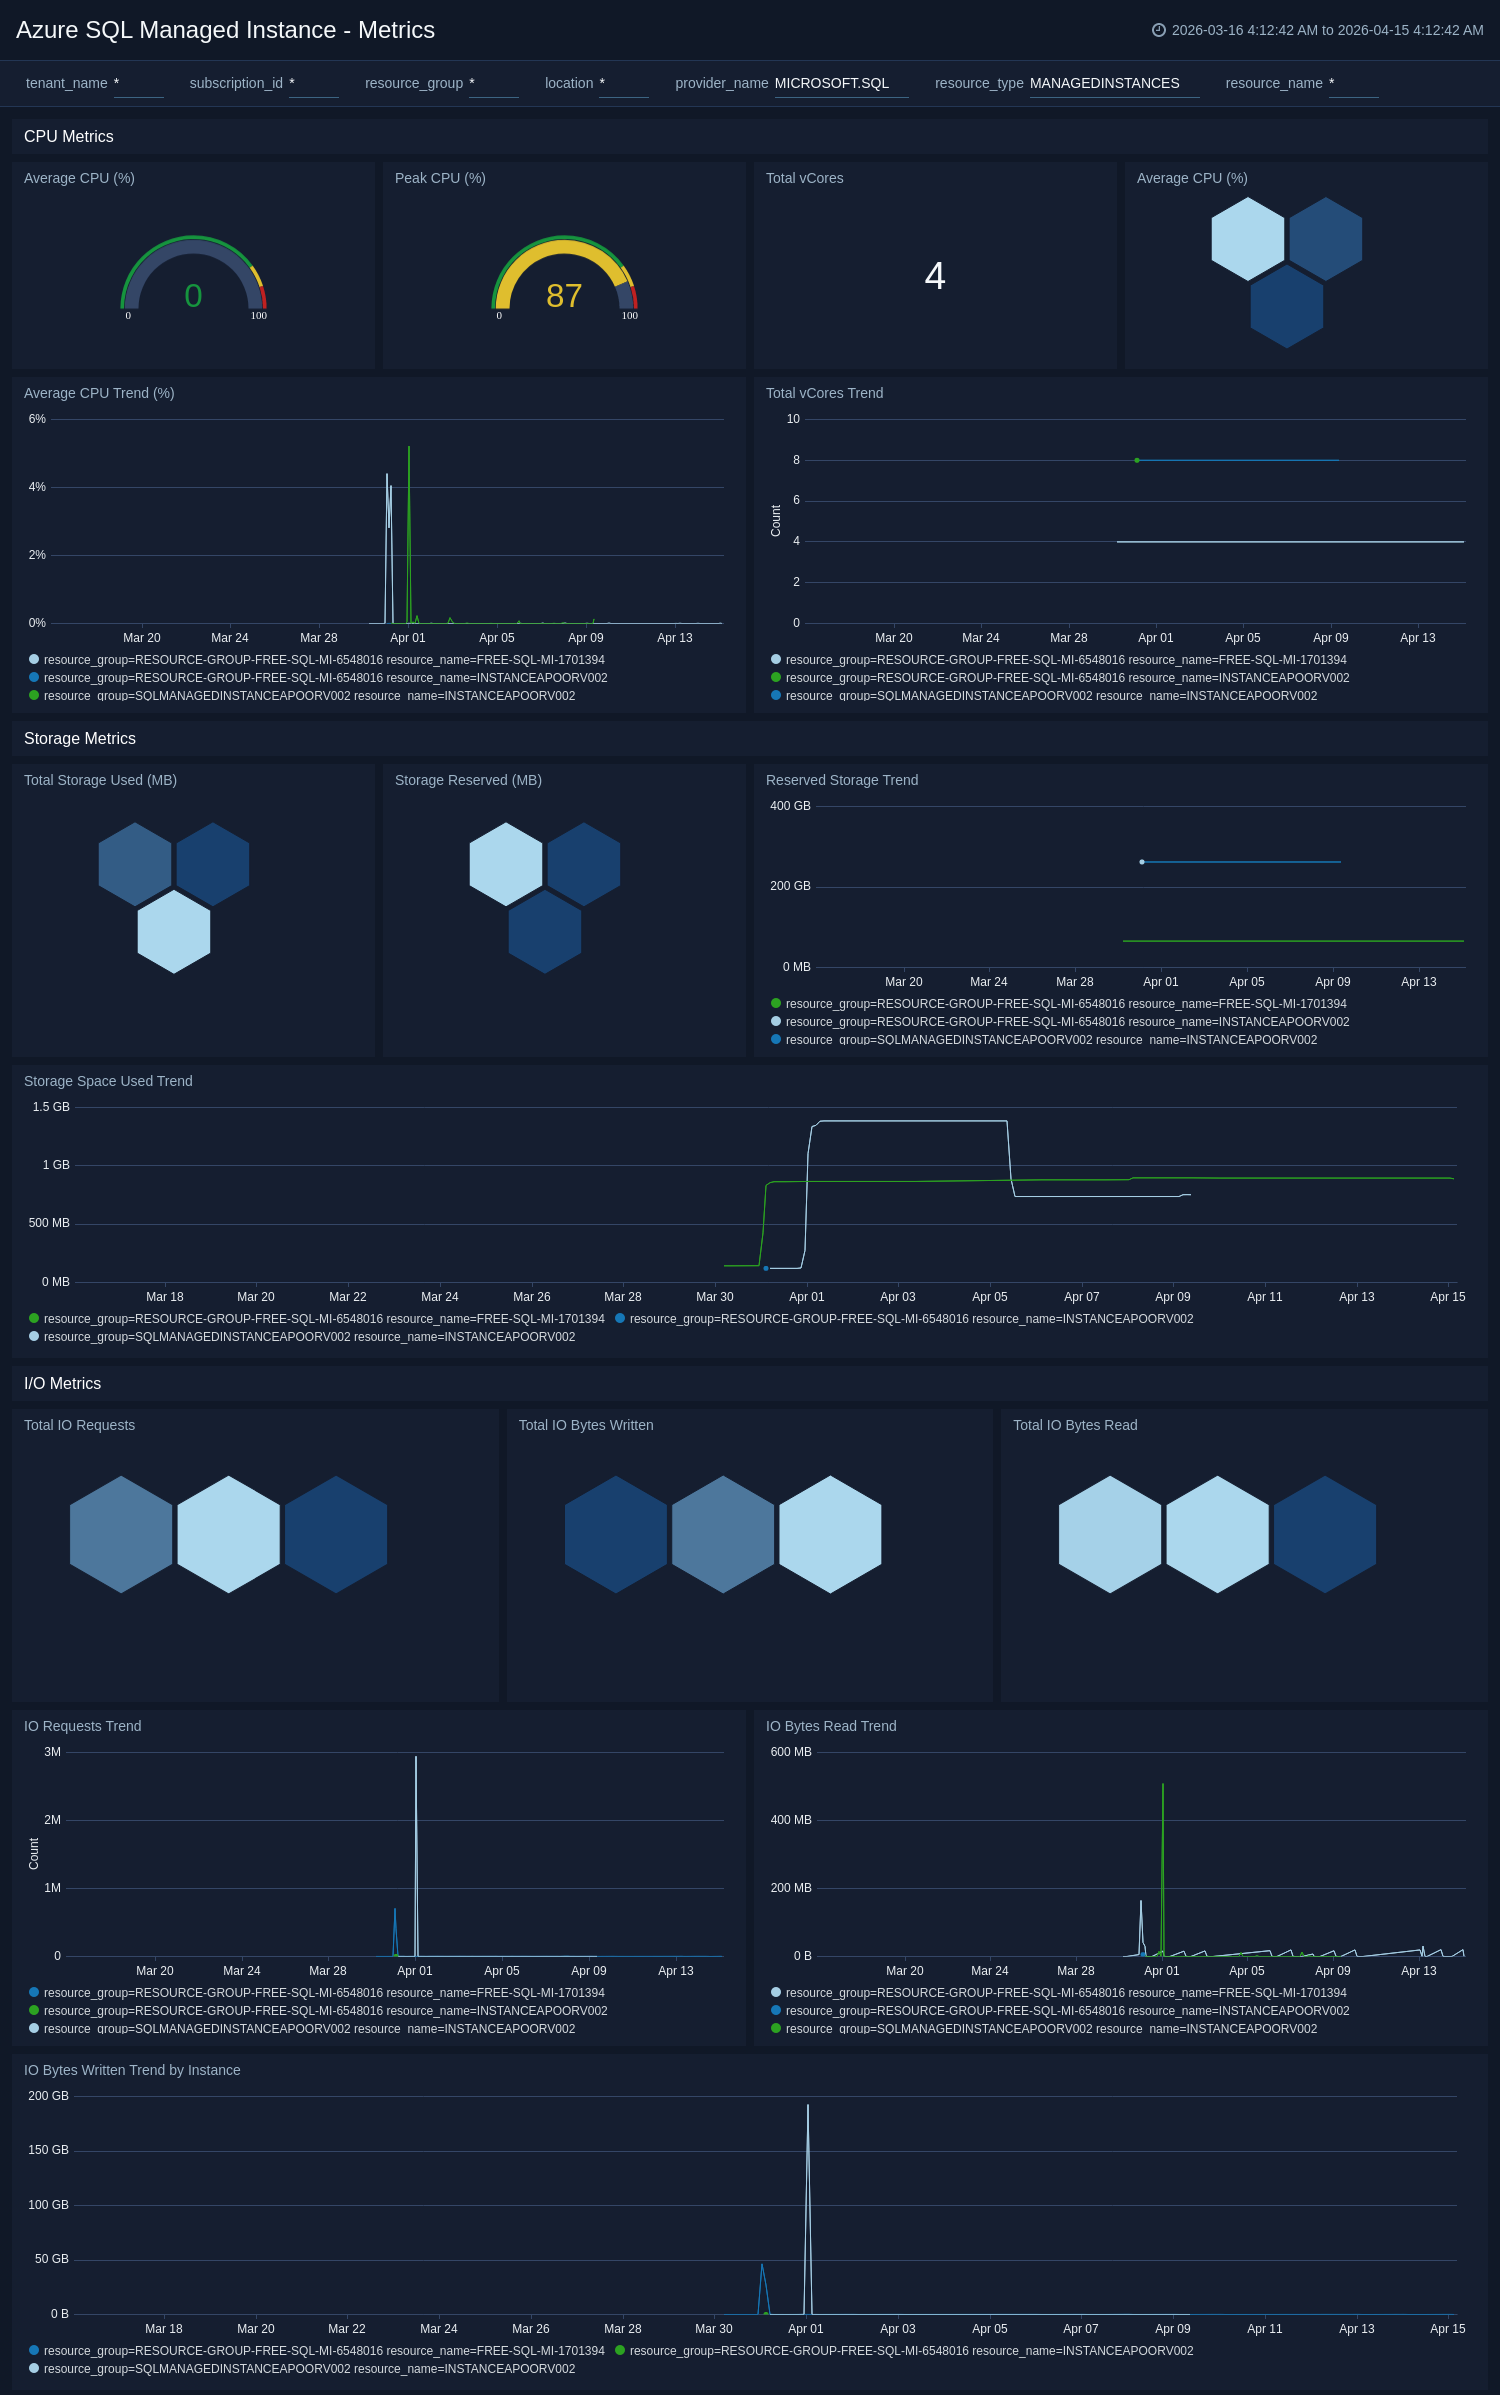
Metrics
The Azure SQL Managed Instance - Metrics dashboard provides visibility into CPU utilization, storage capacity, and I/O throughput across managed instances.
Use this dashboard to:
- Monitor average and peak CPU utilization and total vCore allocation across all instances.
- Track storage space used and reserved storage trends to plan capacity.
- Analyze I/O request counts, bytes read, and bytes written to identify throughput bottlenecks.
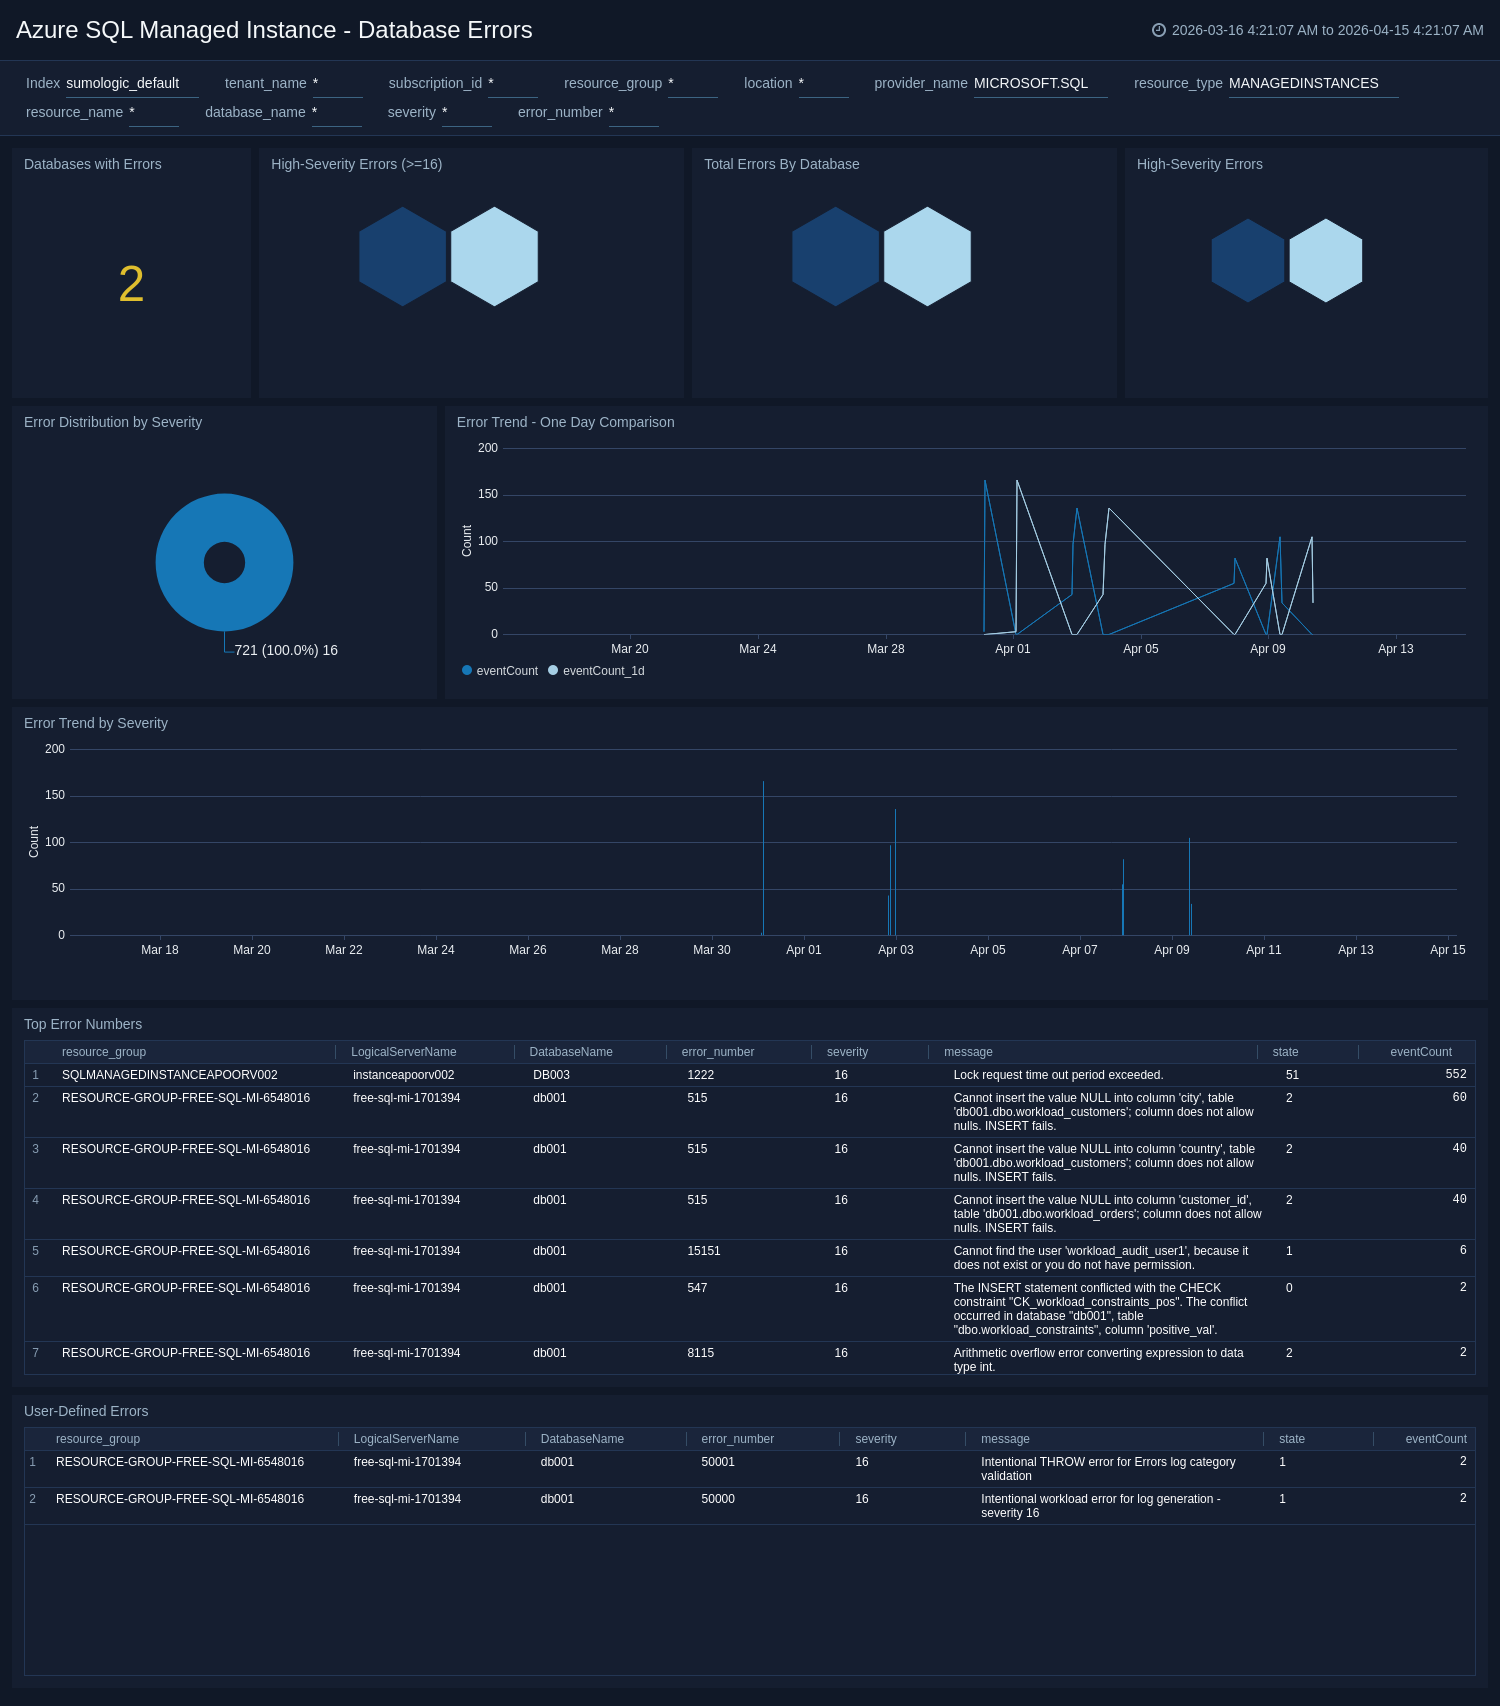
Database Errors
The Azure SQL Managed Instance - Database Errors dashboard tracks error counts, severity distribution, affected databases, and top error patterns over time.
Use this dashboard to:
- Monitor total errors, user-defined errors, and unique error numbers to assess database stability.
- Identify the top 10 error numbers and messages to prioritize investigation and resolution.
- Analyze severity distribution and one-day error comparison trends to detect regressions quickly.
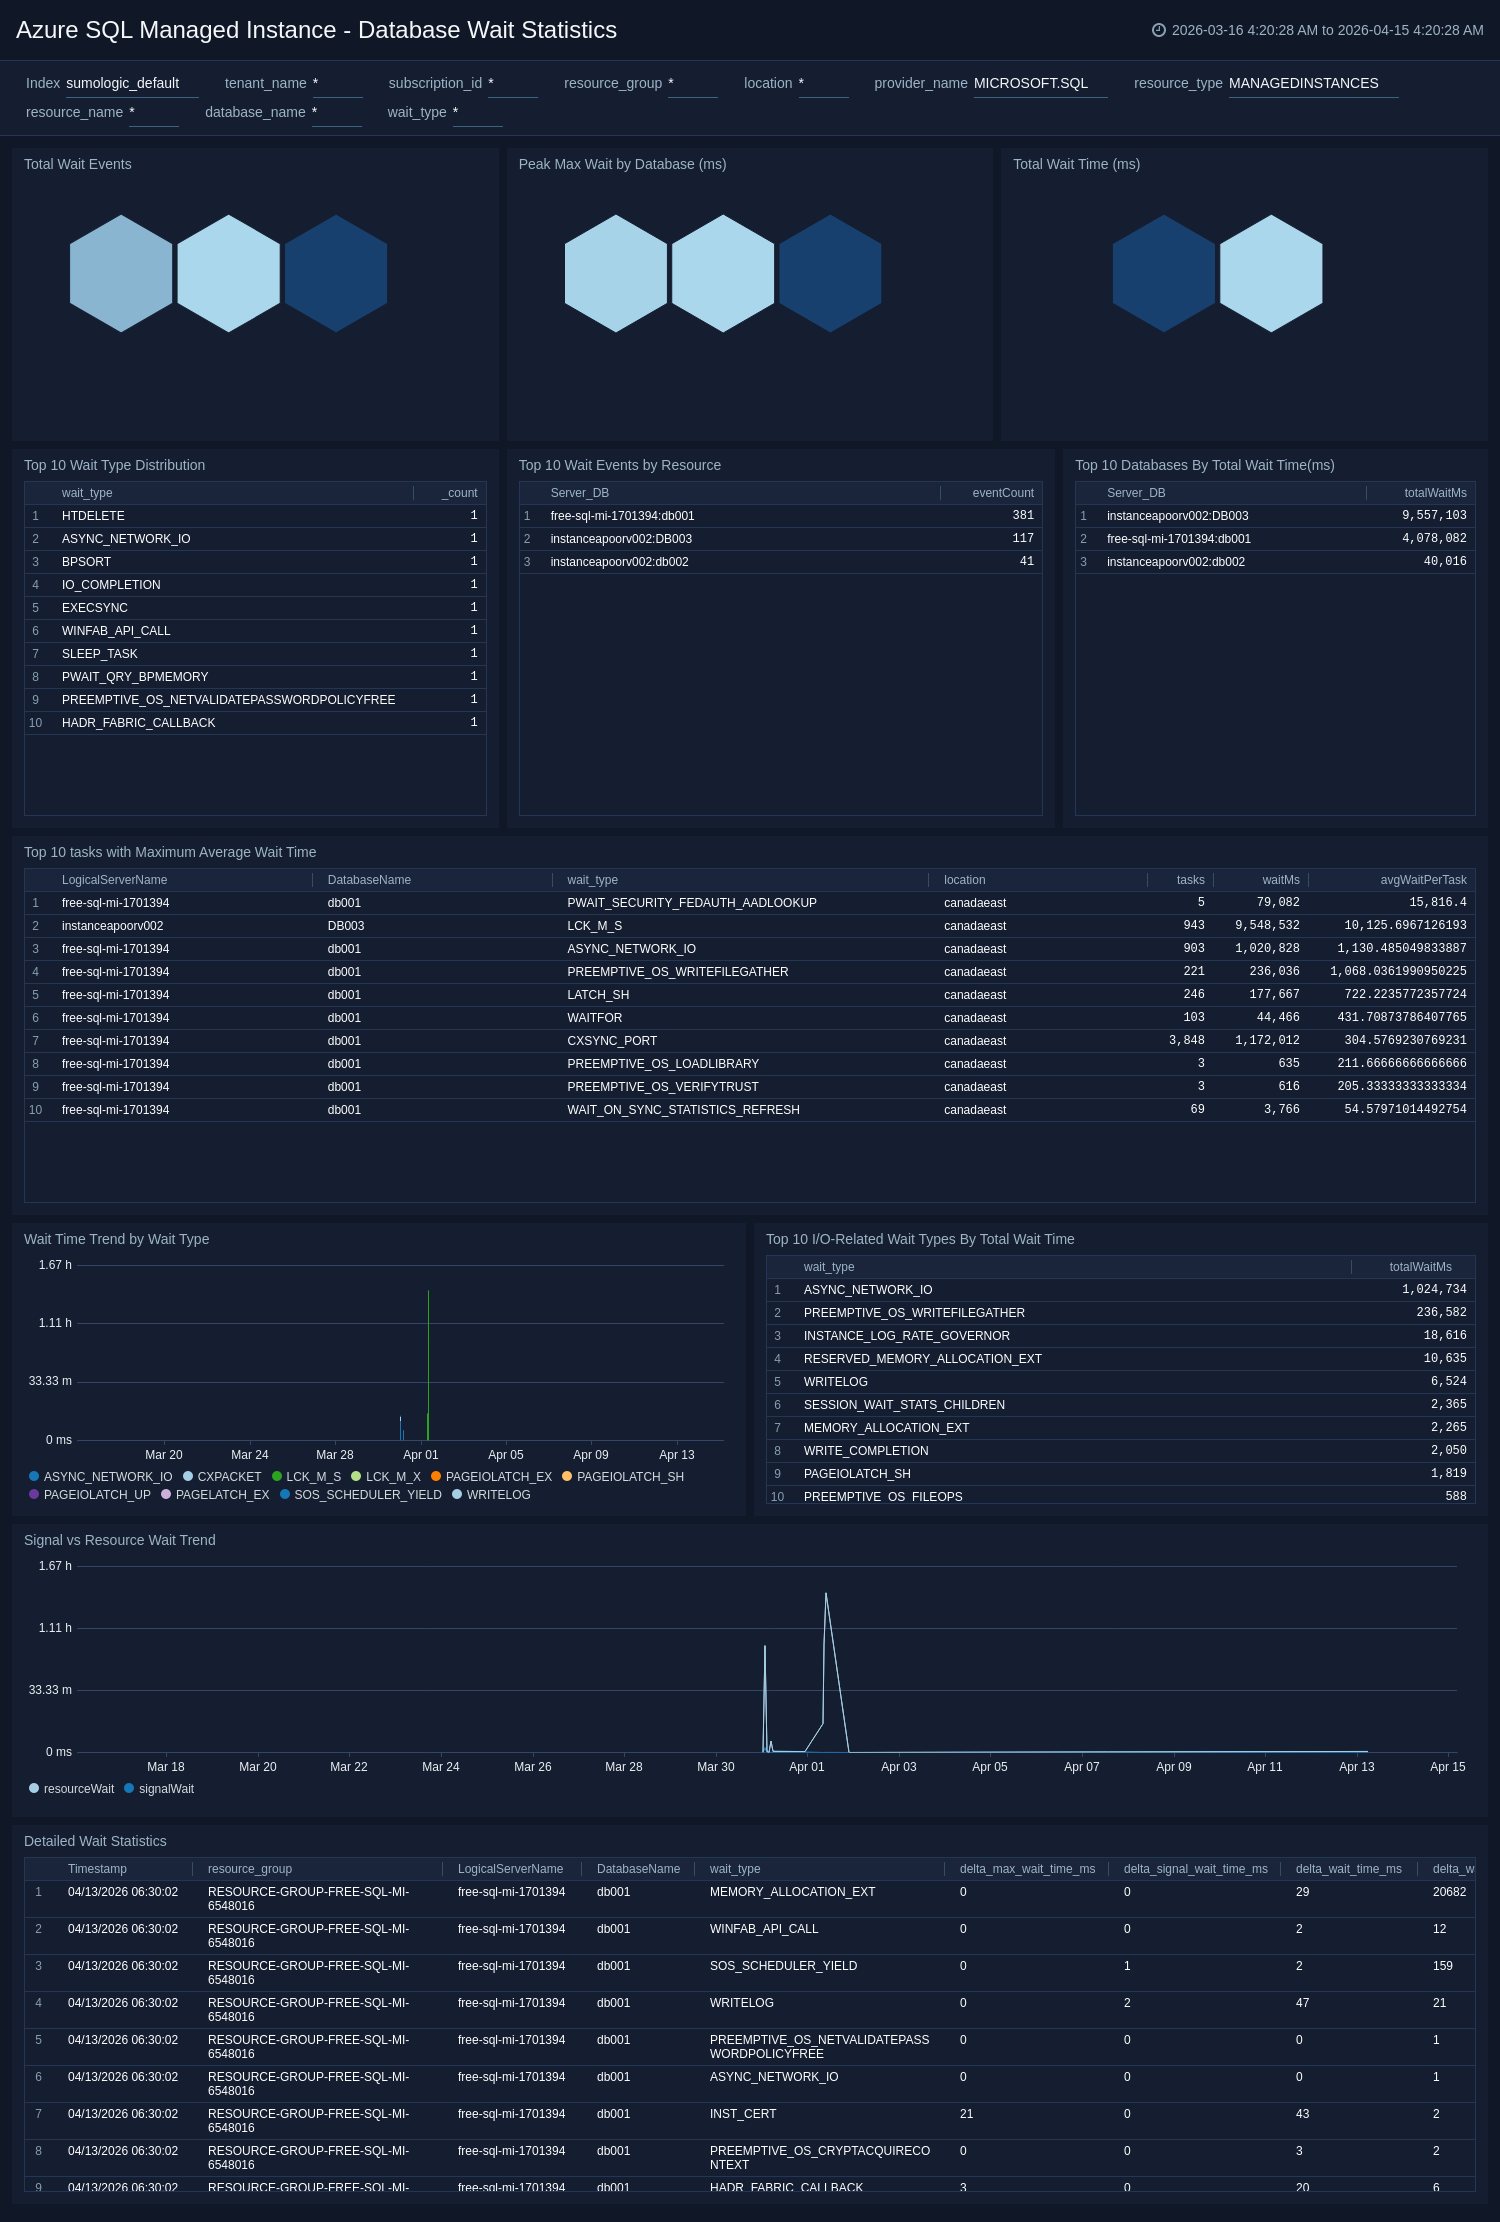
Database Wait Statistics
The Azure SQL Managed Instance - Database Wait Statistics dashboard provides insights into wait patterns, wait-type distribution, signal versus resource waits, and per-database wait-time analysis.
Use this dashboard to:
- Monitor total wait events, total wait time, and peak maximum wait to identify blocking and scheduling issues.
- Analyze wait type distribution and heatmaps to distinguish between I/O, locking, CPU scheduling, and memory waits.
- Track signal versus resource wait ratios and average wait time per task to diagnose root causes of latency.
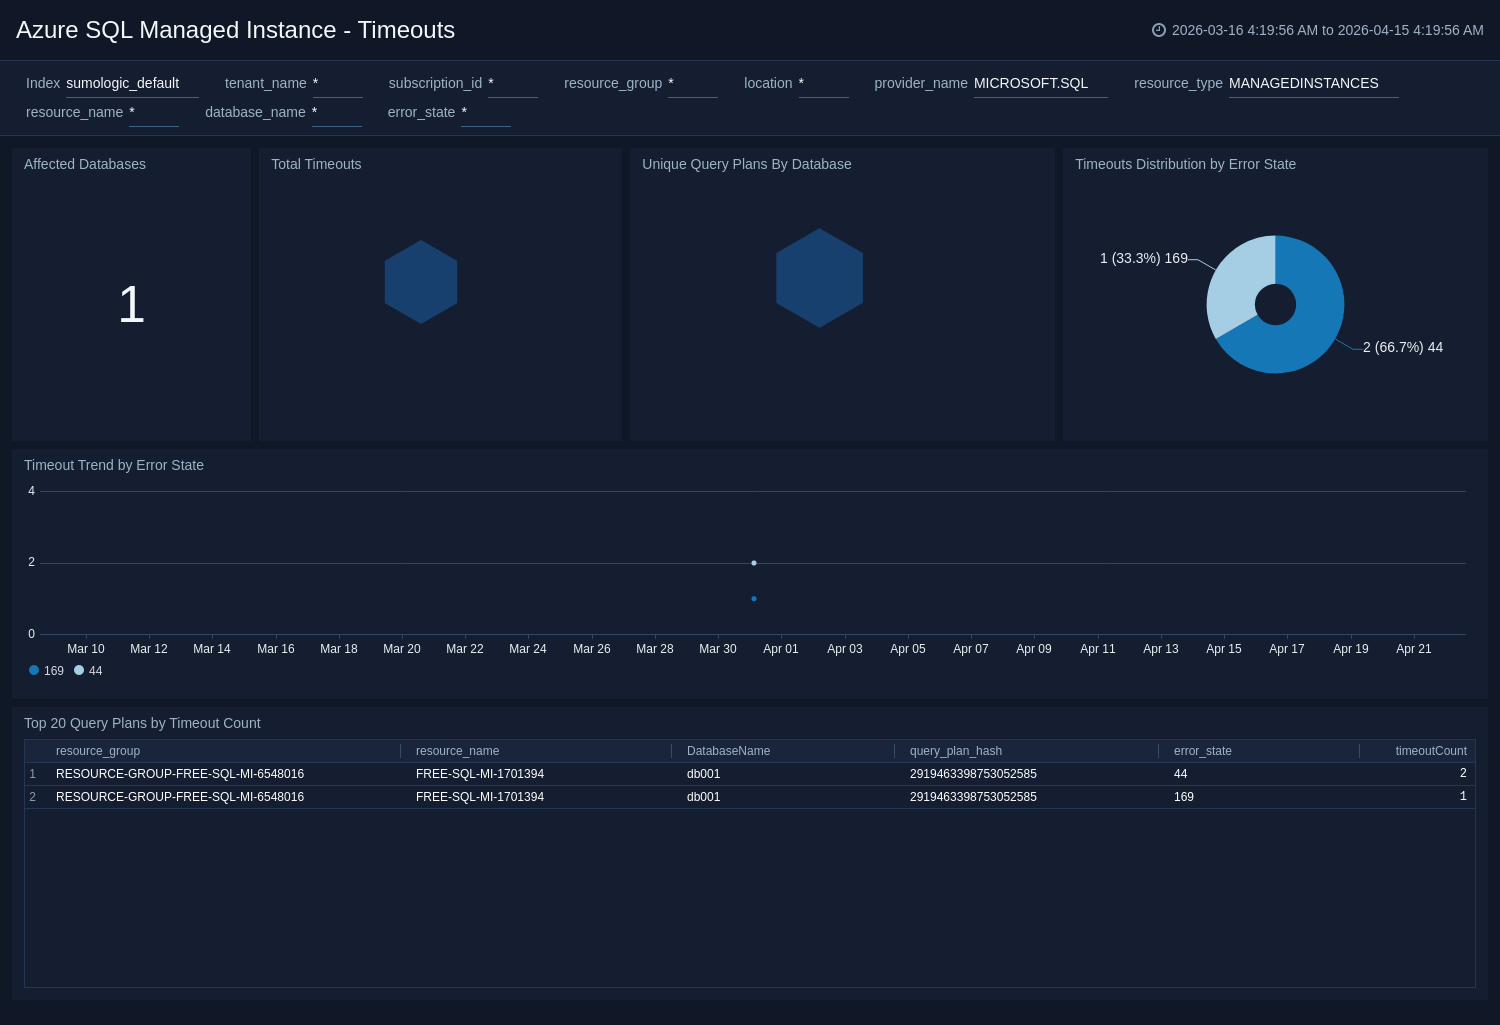
Timeouts
The Azure SQL Managed Instance - Timeouts dashboard provides analysis of timeout events, including counts, affected databases, error state distribution, query plan correlation, and trends over time.
Use this dashboard to:
- Monitor total timeout counts by instance and identify the most affected databases.
- Analyze timeout distribution by error state and track trends over time to detect recurring patterns.
- Identify the top query plans contributing to timeouts and unique query plans per database.
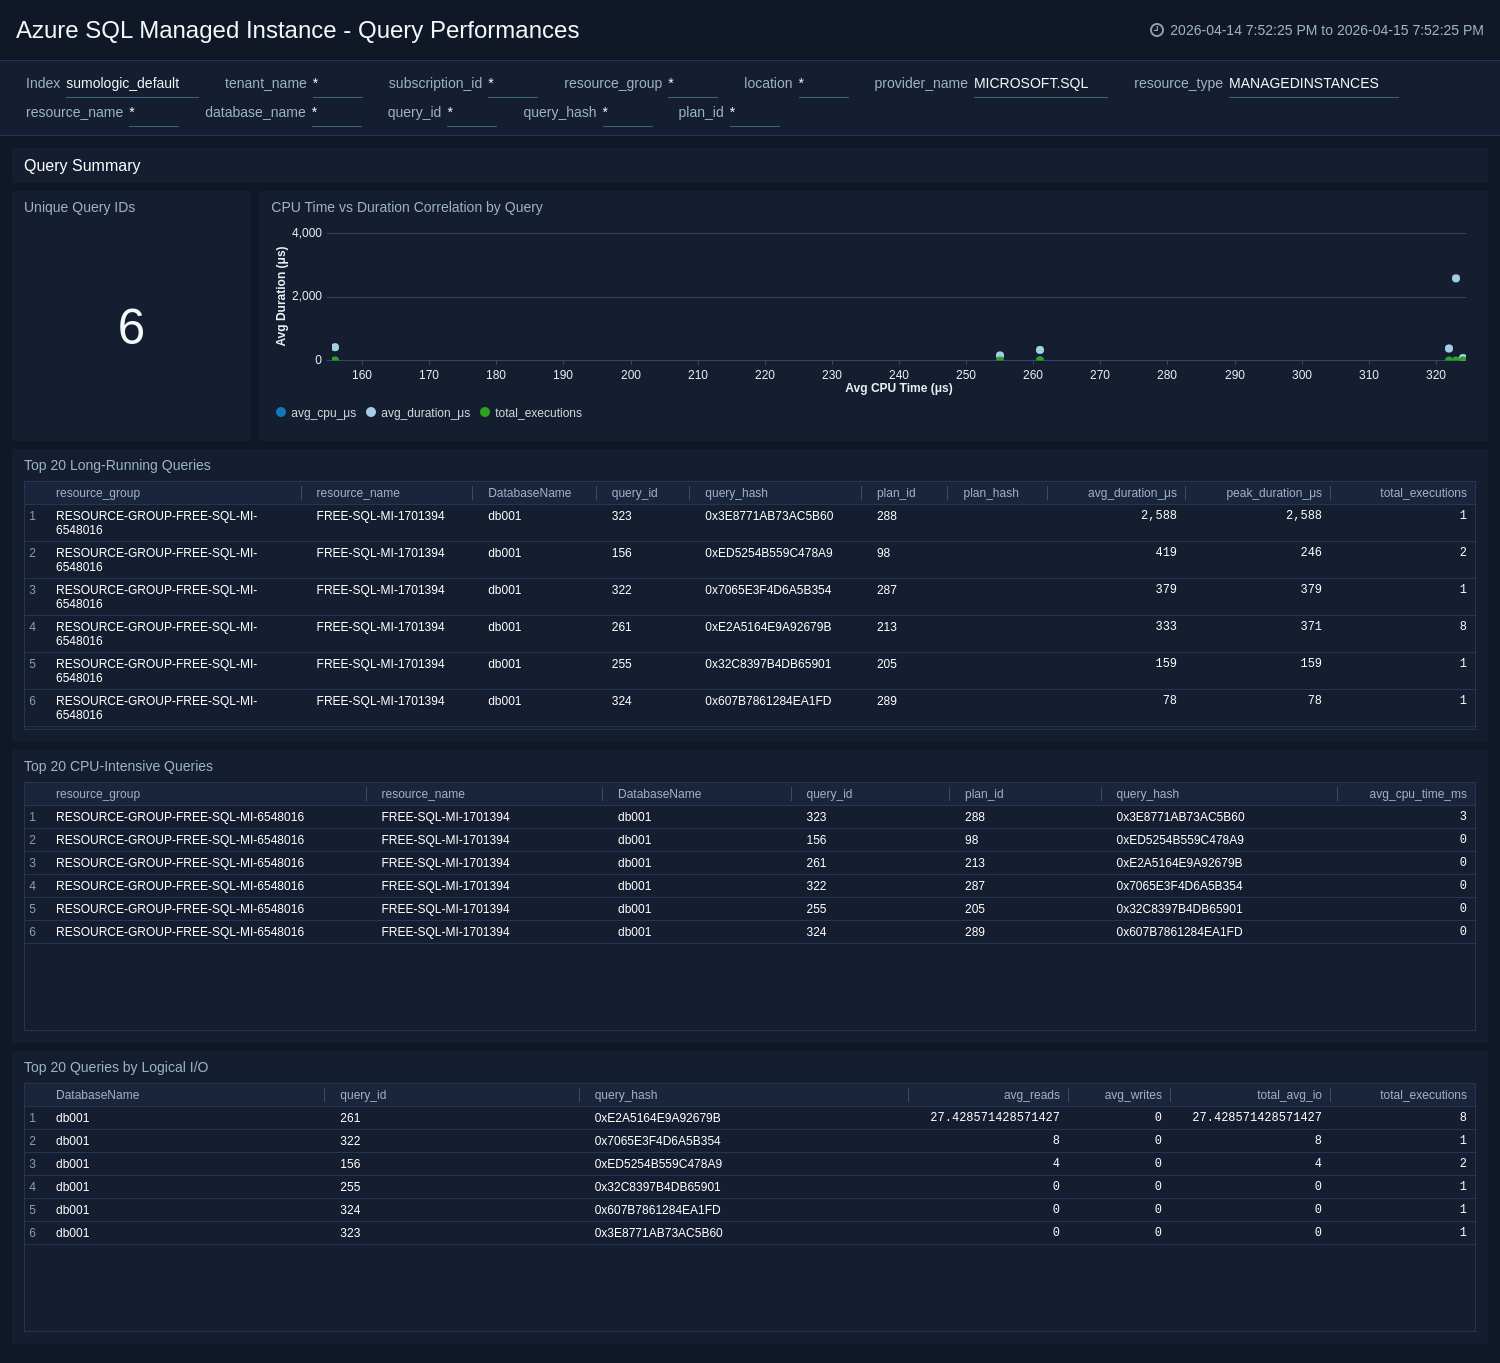
Query Performances
The Azure SQL Managed Instance - Query Performances dashboard monitors query CPU consumption, execution duration, I/O usage, and memory grants across databases.
Use this dashboard to:
- Track total query executions, CPU time, and maximum duration to identify the most expensive workloads.
- Identify the top queries by CPU and execution count using query hash to target optimization efforts.
- Analyze logical I/O reads and writes and memory consumption by the database to detect resource-intensive patterns.
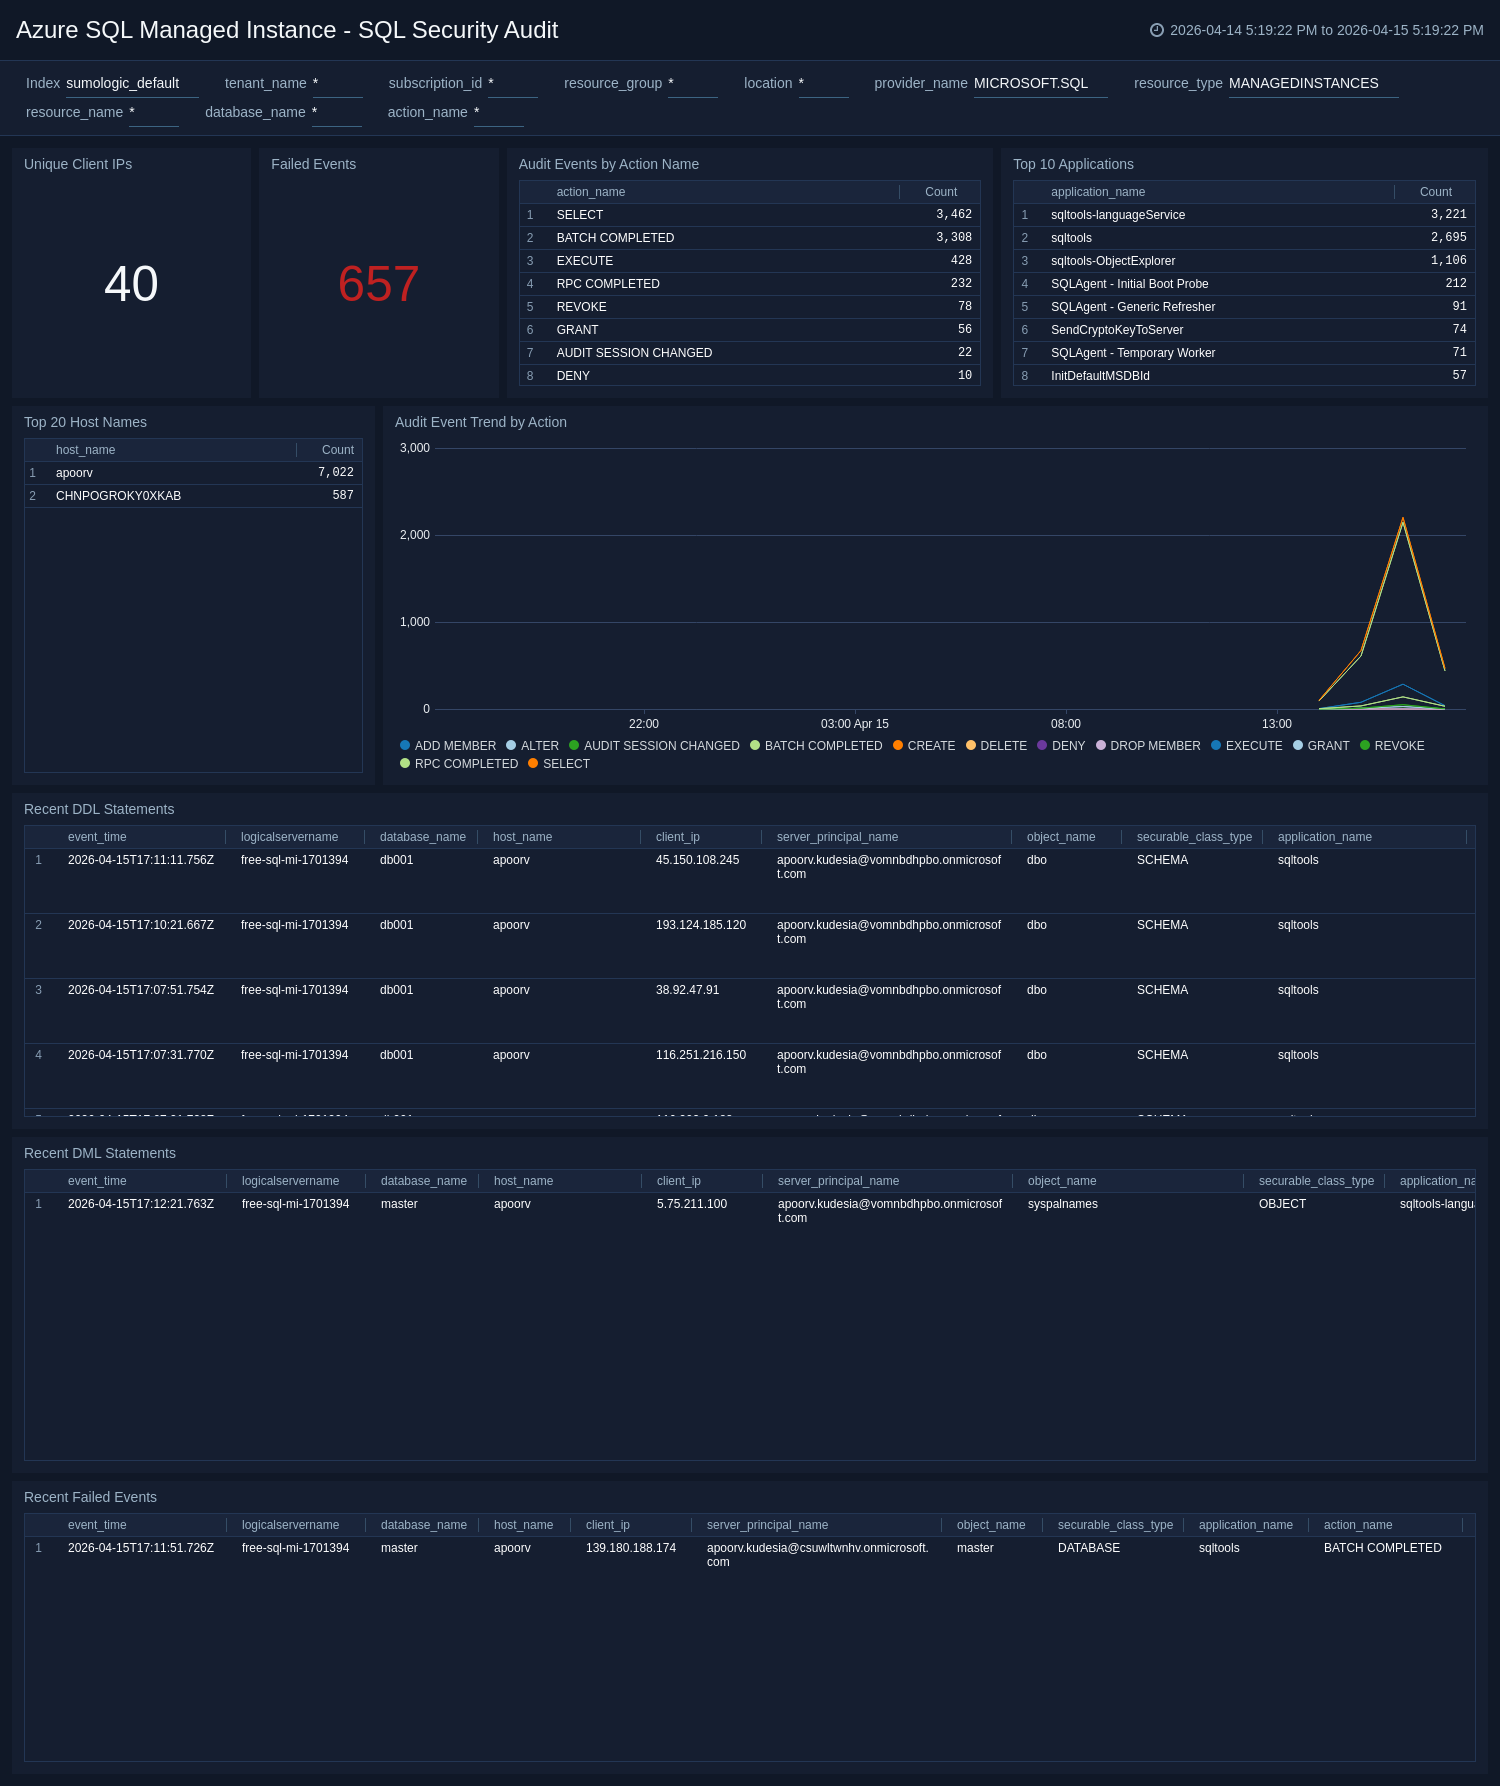
SQL Security Audit
The Azure SQL Managed Instance - SQL Security Audit dashboard provides comprehensive visibility into authentication events, DML/DDL activity, client connection patterns, and privilege usage across all managed instance databases.
Use this dashboard to:
- Monitor successful and failed authentication events and event distribution by action type for threat detection.
- Identify top principals, client hosts, applications, and source IPs generating audit events.
- Review recent DDL, DML, and failed events to support compliance investigation and incident response.
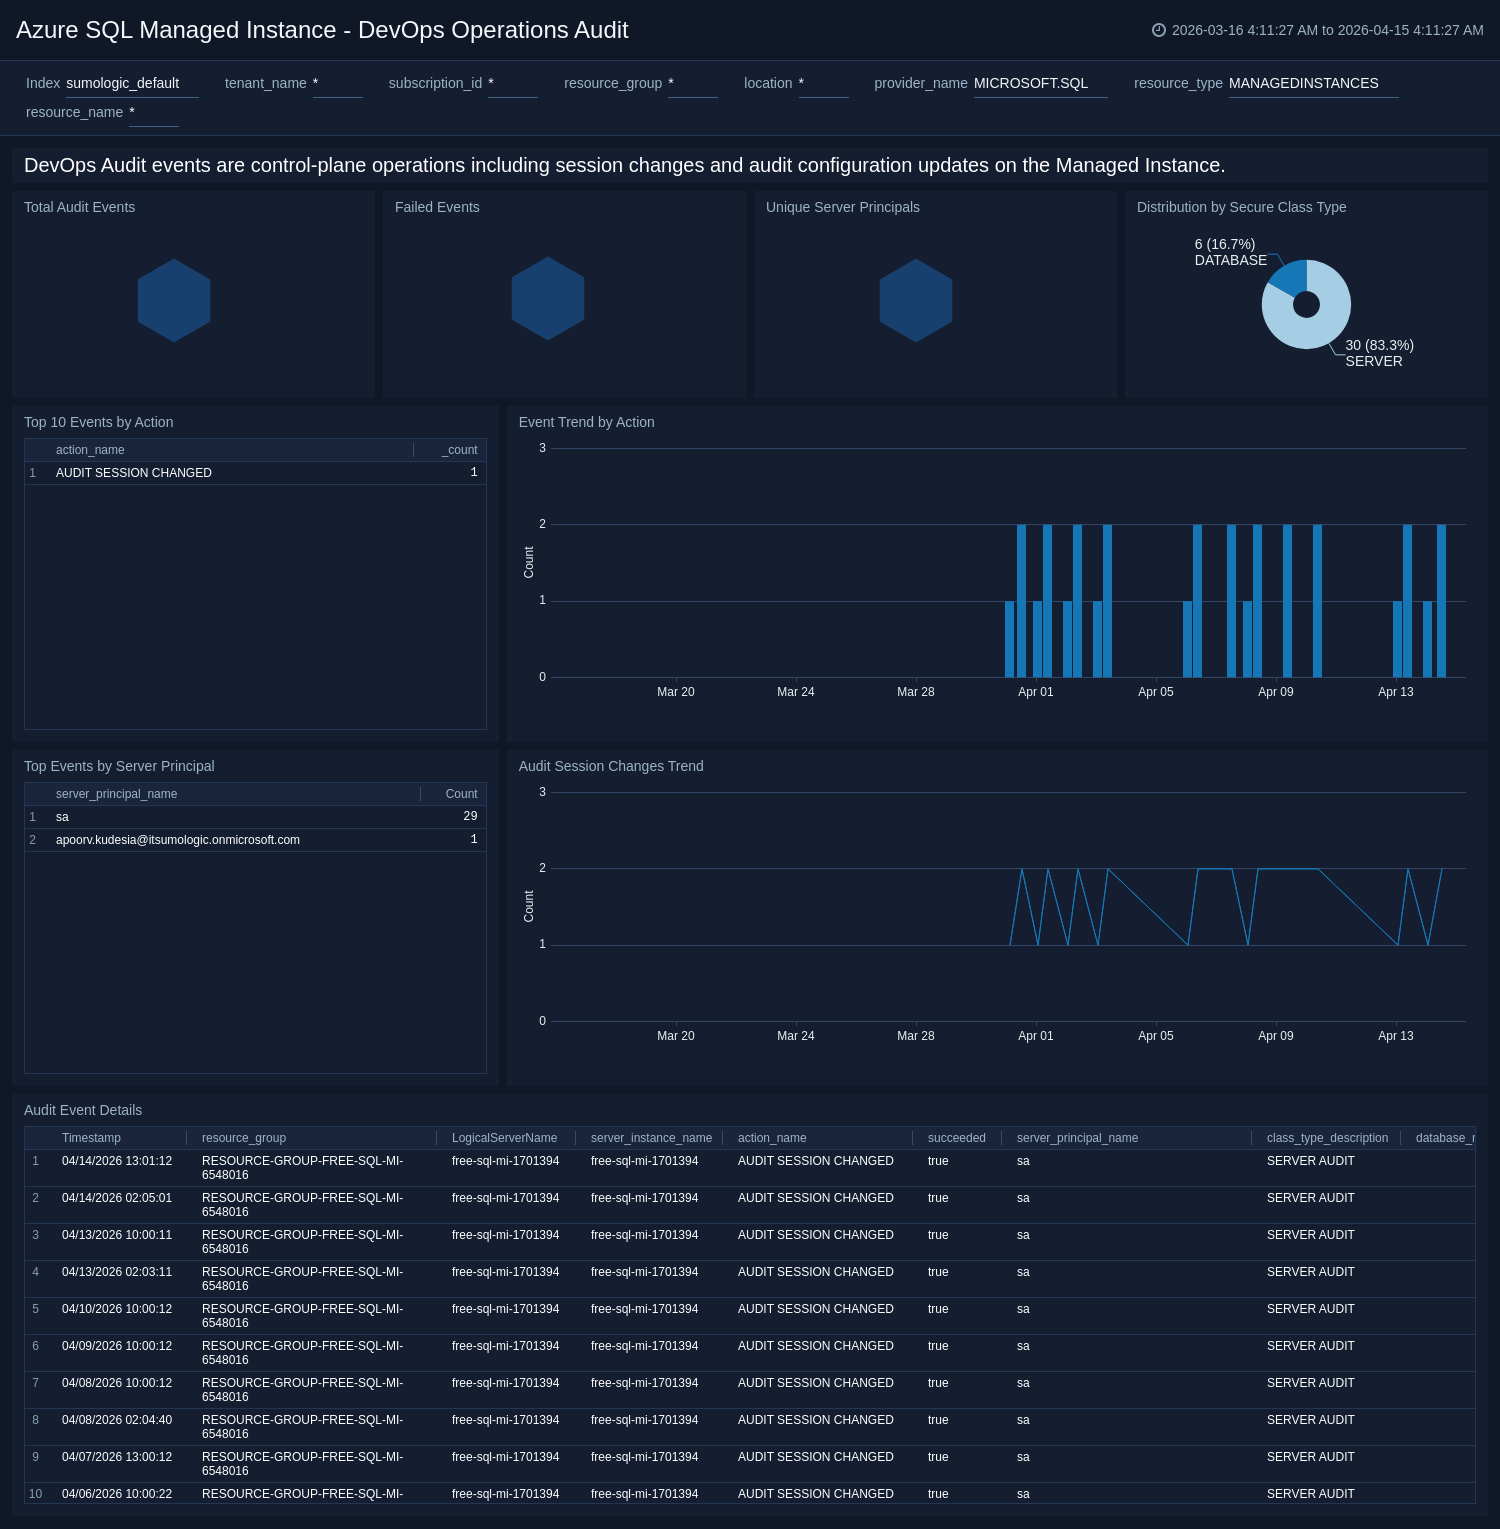
DevOps Operations Audit
The Azure SQL Managed Instance - DevOps Operations Audit dashboard covers control-plane audit events, including session changes, server-level operations, and configuration events at the managed instance level.
Use this dashboard to:
- Monitor total, successful, and failed control-plane events and track trends over time.
- Identify top principals and event classes generating the highest operational activity.
- Analyze session changes and server-level configuration event details for administrative oversight.
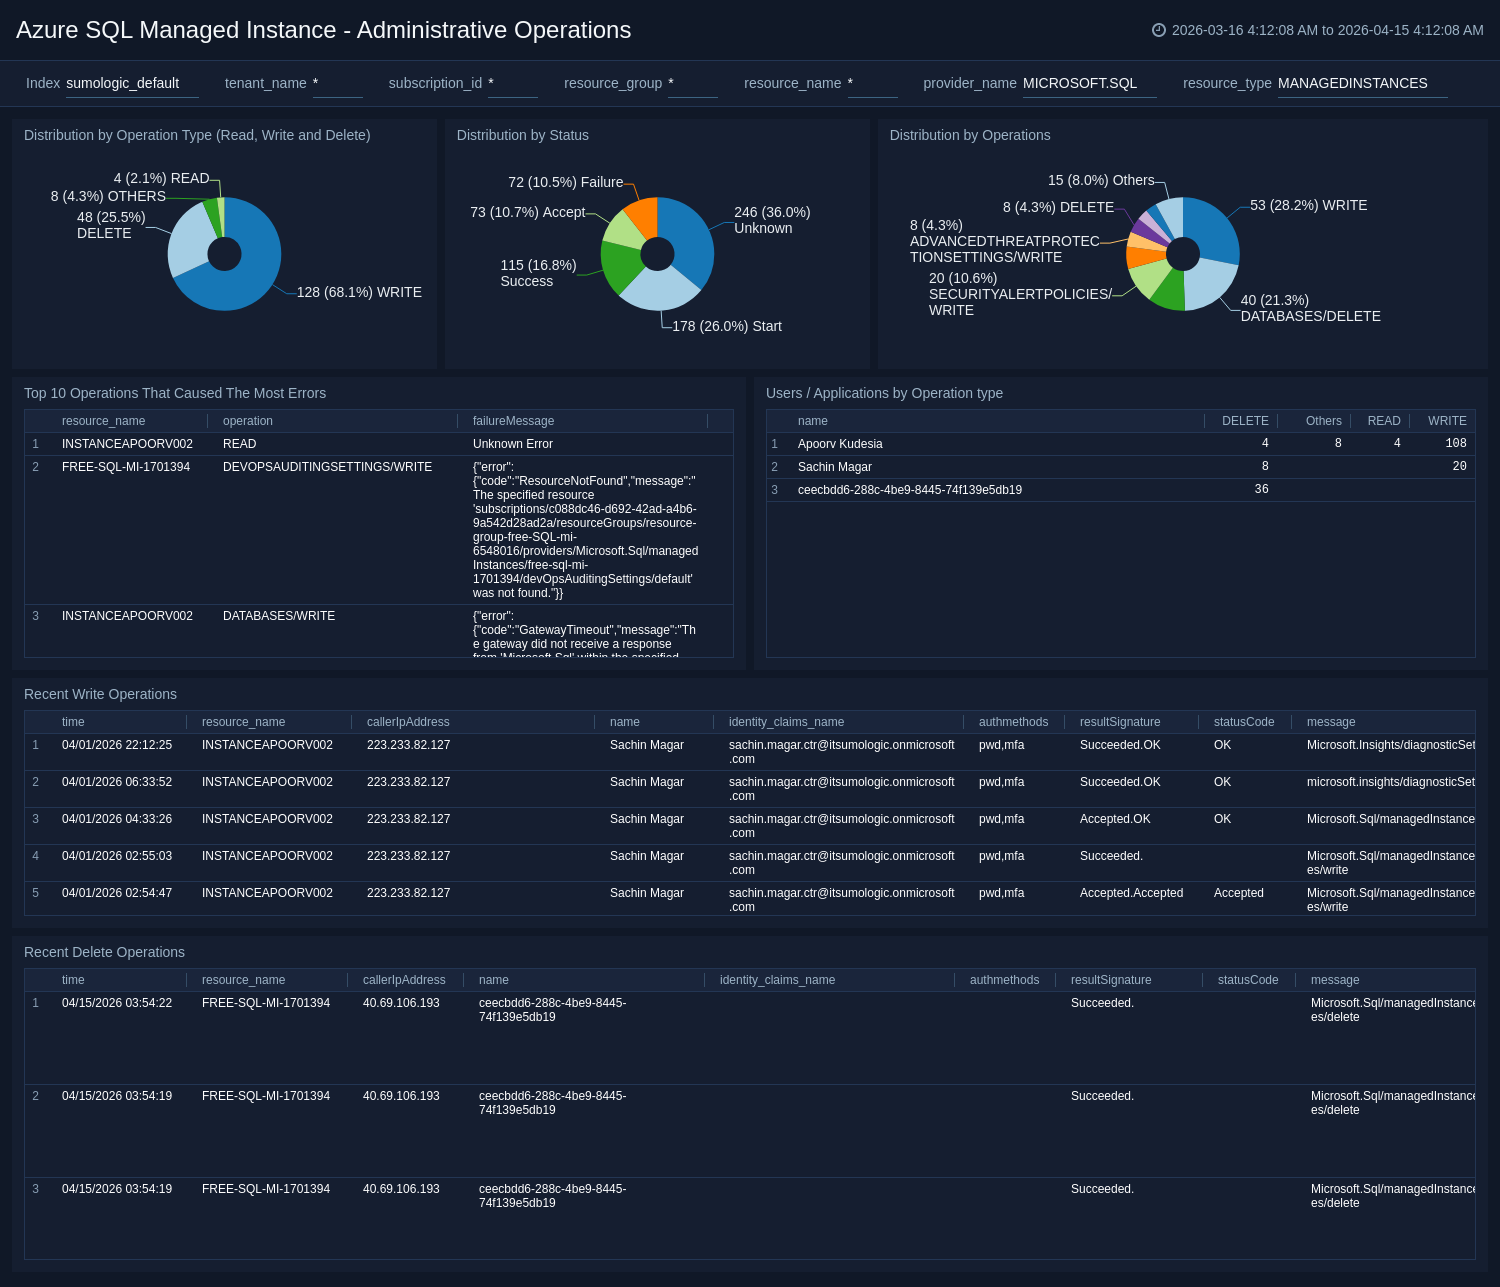
Administrative Operations
The Azure SQL Managed Instance - Administrative Operations dashboard provides details on operational activities, including operation type distribution, status breakdown, and recent write and delete operations.
Use this dashboard to:
- Monitor the distribution of read, write, and delete operation types and their success rates across managed instances.
- Identify top operations causing errors and correlate them with specific users or applications.
- Track recent write and delete operations to maintain an audit trail of configuration changes.
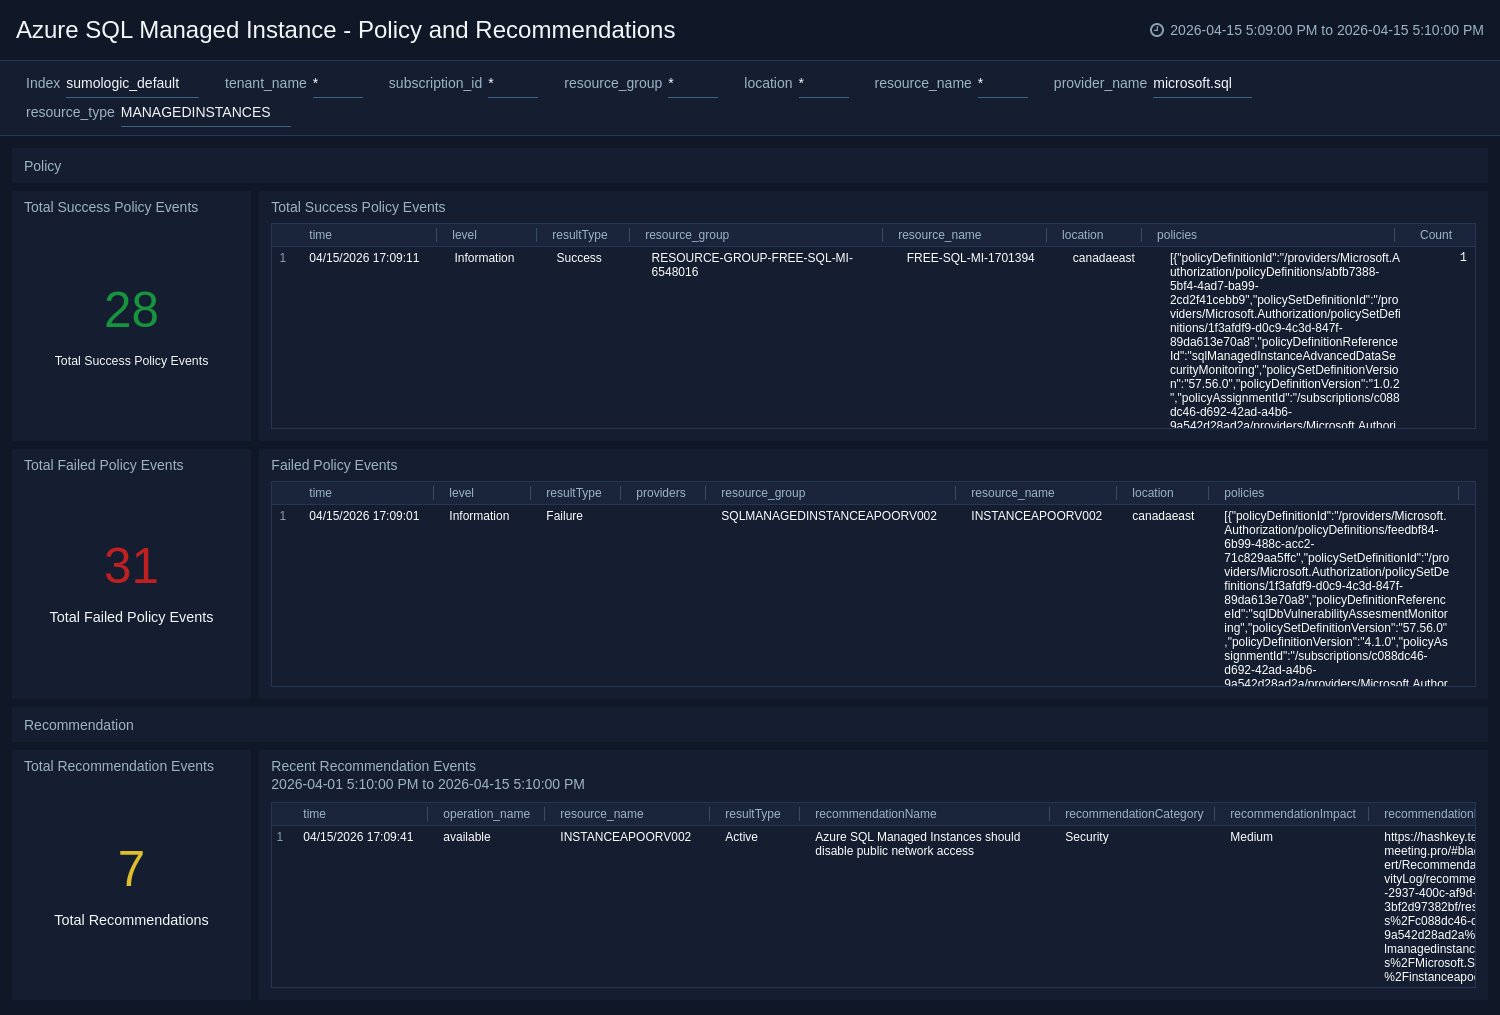
Policy and Recommendations
The Azure SQL Managed Instance - Policy and Recommendations dashboard provides visibility into policy event success and failure rates and recent recommendation events for managed instances.
Use this dashboard to:
- Monitor total successful and failed policy events to ensure proper configuration and compliance.
- Track recent recommendations by category, impact, and resource to improve performance and security.
- Identify trends in policy events and recommendations over time to proactively address potential issues.
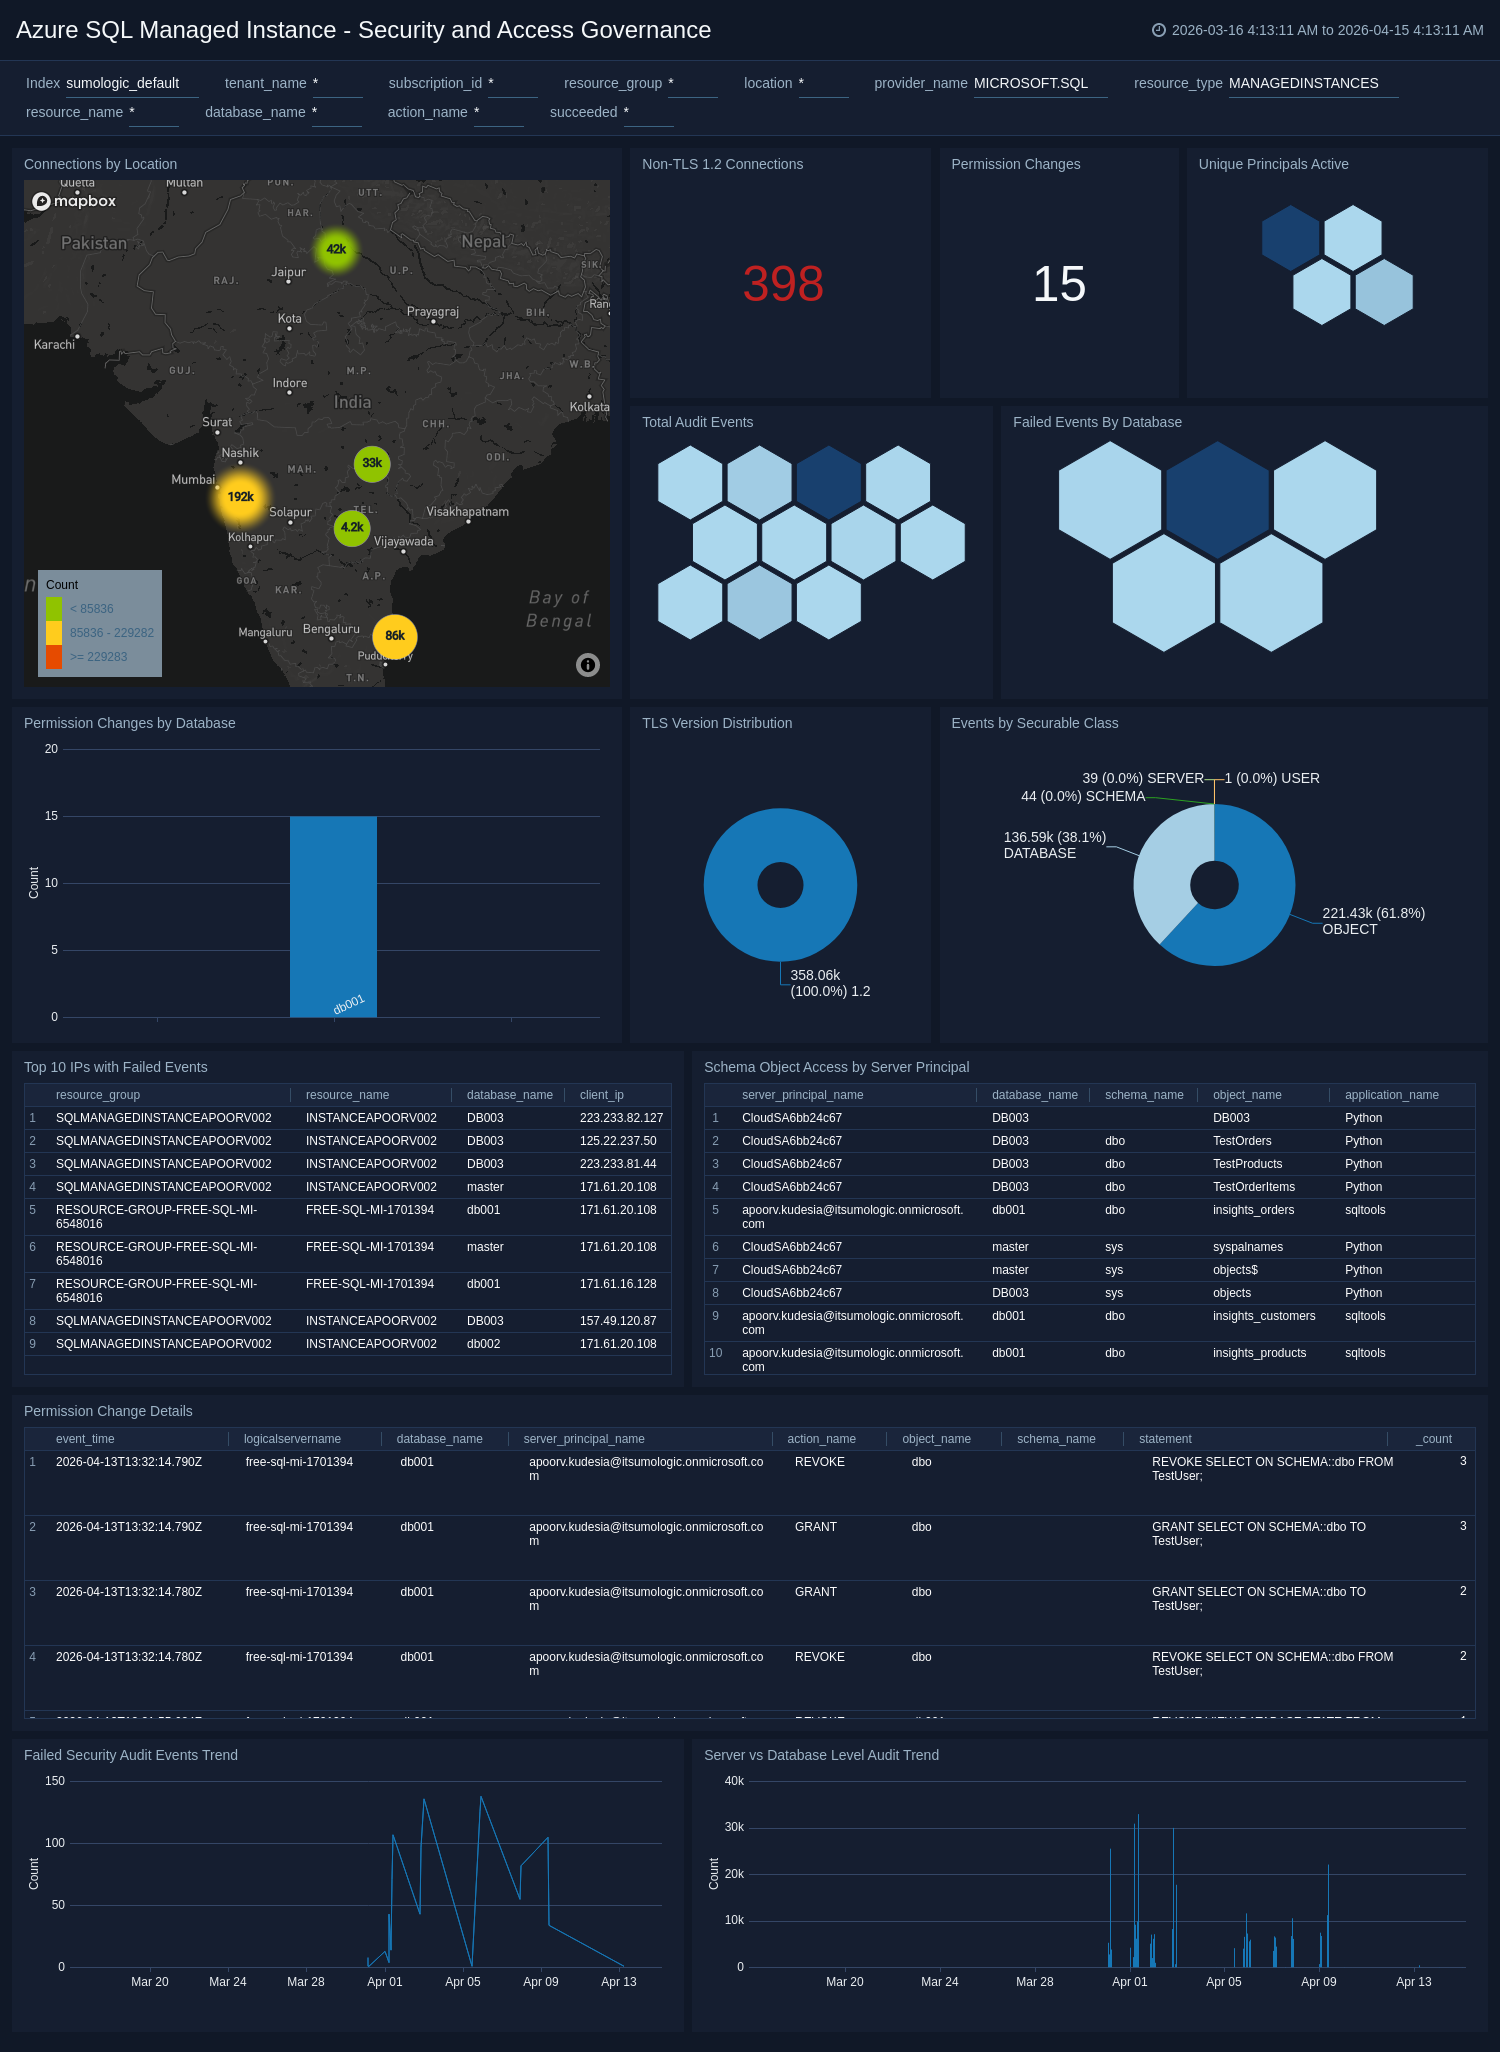
Security and Access Governance
The Azure SQL Managed Instance - Security and Access Governance dashboard monitors privilege escalations, permission changes, TLS compliance, and schema access patterns across managed instances.
Use this dashboard to:
- Track permission changes by database, failed events by source IP, and non-TLS 1.2 connections for governance compliance.
- Analyze securable class distribution, success versus failure trends, and server versus database audit event ratios.
- Review schema access by principal and TLS version distribution to identify unauthorized or insecure access patterns.
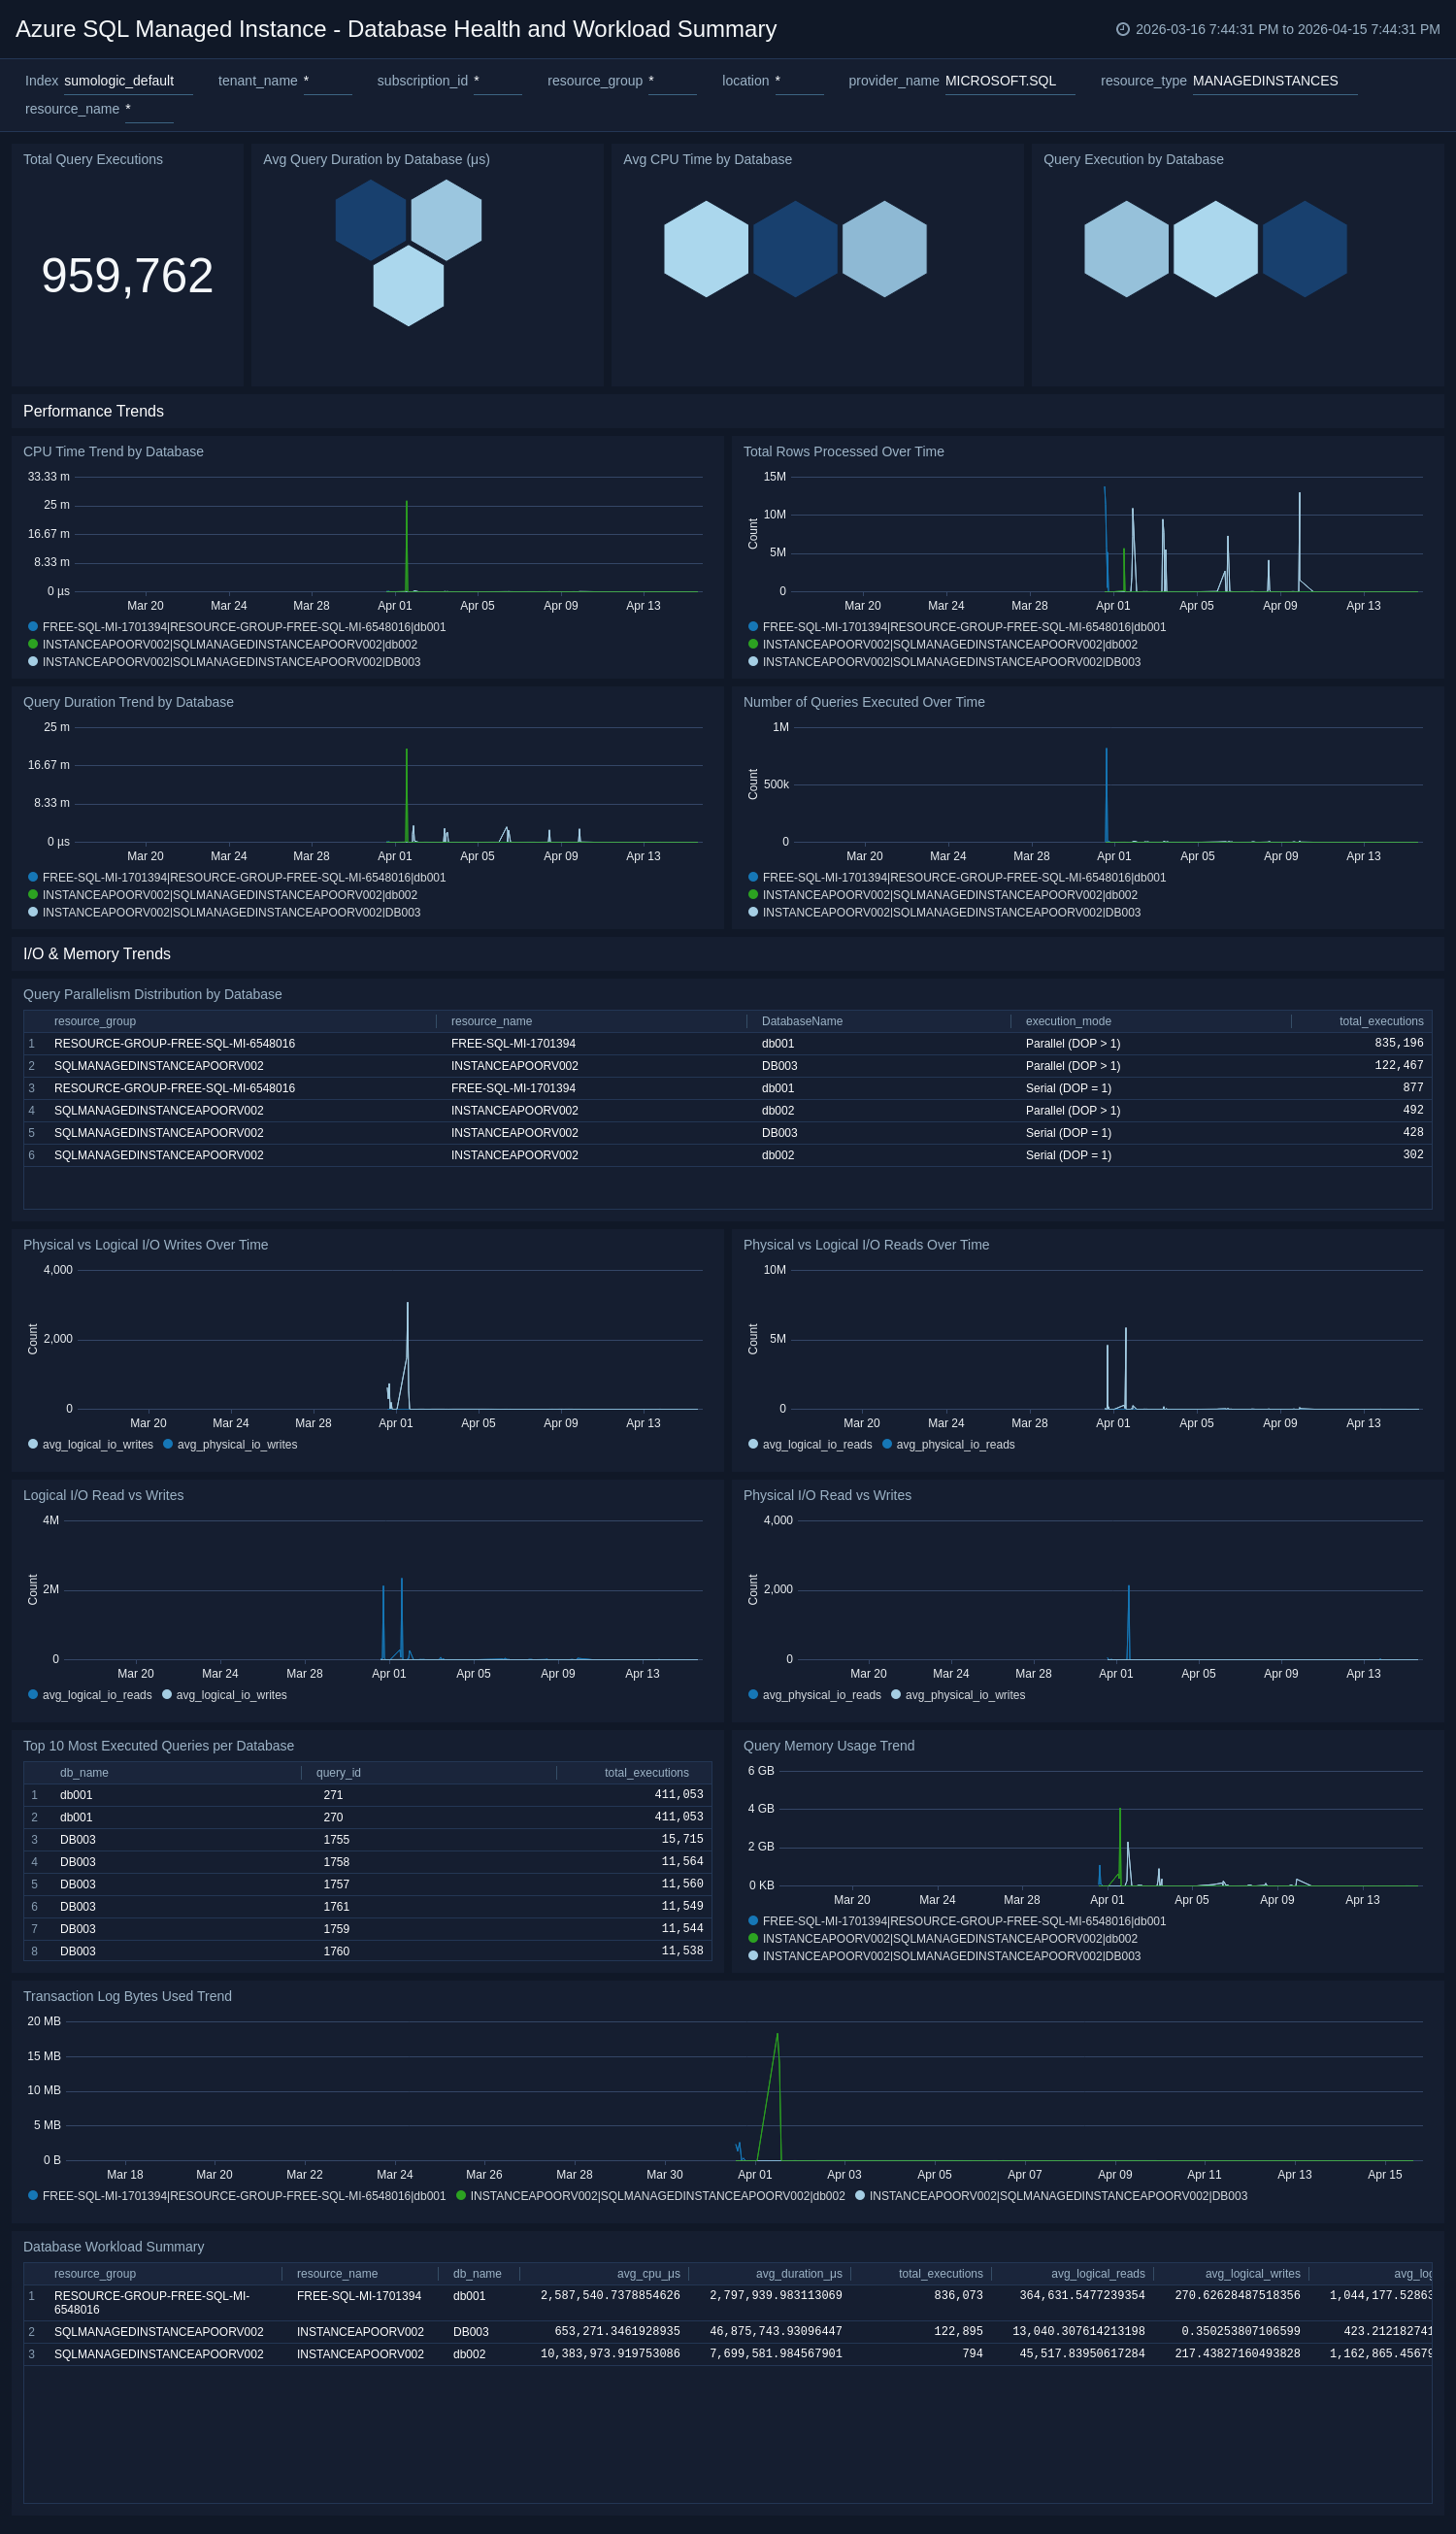
Database Health and Workload Summary
The Azure SQL Managed Instance - Database Health and Workload Summary dashboard provides a combined health view that integrates error counts, wait statistics, and query performance metrics for each database.
Use this dashboard to:
- Identify databases with active errors and high-severity error counts for immediate remediation prioritization.
- Correlate error severity heatmaps, wait time by database, and top wait types for holistic workload health assessment.
- Track query execution and CPU trends alongside combined workload details to understand performance trajectory.
Create monitors for Azure SQL Managed Instance
From your App Catalog:
- From the Sumo Logic navigation, select App Catalog.
- In the Search Apps field, search for and then select your app.
- Make sure the app is installed.
- Navigate to What's Included tab and scroll down to the Monitors section.
- Click Create next to the pre-configured monitors. In the create monitors window, adjust the trigger conditions and notifications settings based on your requirements.
- Scroll down to Monitor Details.
- Under Location click on New Folder.
note
By default, monitor will be saved in the root folder. So to make the maintenance easier, create a new folder in the location of your choice.
- Enter Folder Name. Folder Description is optional.
tip
Using app version in the folder name will be helpful to determine the versioning for future updates.
- Click Create. Once the folder is created, click on Save.
Azure SQL Managed Instance alerts
These alerts are metric-based and will work for all Azure SQL Managed Instances.
| Alert Name | Alert Description and Conditions | Alert Condition | Recover Condition |
|---|---|---|---|
Azure SQL Managed Instance - Average CPU percentage | This alert is triggered when Average CPU percentage becomes greater than 80%. Also Warning alert is triggered when Average CPU percentage becomes greater than 70%. | Critical: > 80Warning: > 70 | Critical: <= 80Warning: <= 70 |
Azure SQL Managed Instance - Average IO Bytes Written | This alert is triggered when average IO bytes written is greater than 1000000 Bytes. | Critical: > 1000000 | Critical: <= 1000000 |
Azure SQL Managed Instance - IO requests count | This alert is triggered when IO requests count is greater than 1000. | Critical: > 1000 | Critical: <= 1000 |
Azure SQL Managed Instance - Storage Space Reserved | This alert is triggered when average storage space reserved is less than 10000000 MB. | Critical: < 10000000 | Critical: >= 10000000 |
Azure SQL Managed Instance - Storage Space Used | This alert is triggered when storage space used is greater than 6442450 MB. | Critical: > 6442450 | Critical: <= 6442450 |
Upgrade/Downgrade the Azure SQL Managed Instance app (Optional)
To update the app, do the following:
Next-Gen App: To install or update the app, you must be an account administrator or a user with Manage Apps, Manage Monitors, Manage Fields, Manage Metric Rules, and Manage Collectors capabilities depending upon the different content types part of the app.
- Select App Catalog.
- In the Search Apps field, search for and then select your app.
Optionally, you can identify apps that can be upgraded in the Upgrade available section. - To upgrade the app, select Upgrade from the Manage dropdown.
- If the upgrade does not have any configuration or property changes, you will be redirected to the Preview & Done section.
- If the upgrade has any configuration or property changes, you will be redirected to the Setup Data page.
- In the Configure section of your respective app, complete the following fields.
- Field Name. If you already have collectors and sources set up, select the configured metadata field name (eg _sourcecategory) or specify other custom metadata (eg: _collector) along with its metadata Field Value.
- Click Next. You will be redirected to the Preview & Done section.
Post-update
Your upgraded app will be installed in the Installed Apps folder and dashboard panels will start to fill automatically.
See our Release Notes changelog for new updates in the app.
To revert the app to a previous version, do the following:
- Select App Catalog.
- In the Search Apps field, search for and then select your app.
- To version down the app, select Revert to < previous version of your app > from the Manage dropdown.
Uninstalling the Azure SQL Managed Instance app (Optional)
To uninstall the app, do the following:
- Select App Catalog.
- In the 🔎 Search Apps field, run a search for your desired app, then select it.
- Click Uninstall.
Troubleshooting
Metrics collection via Azure Metrics Source
To troubleshoot metrics collection via Azure Metrics Source, follow the instructions in Troubleshooting Azure Metrics Source.