Microsoft Foundry
Microsoft Foundry (formerly Azure AI Studio) is an interoperable AI platform that enables developers to build faster and smarter, while organizations gain fleetwide security and governance in a unified portal. It’s never been easier to build, deploy, and scale AI apps and agents that understand your business context and deliver business impact.
Log and metric types
For Microsoft Foundry, you can collect the following logs and metrics:
-
Resource logs. To learn more about the different resource log category types and schemas collected for Microsoft Foundry, refer to Azure documentation.
-
Platform Metrics for Azure Microsoft Foundry. These metrics are available in the namespaces below:
For more information on supported metrics, refer to Azure documentation.
Setup
Azure services send monitoring data to Azure Monitor, which can then stream data to Event Hub. Sumo Logic supports:
- Logs collection from Azure Monitor using our Azure Event Hubs source.
- Metrics collection using our Azure Metrics Source.
You must explicitly enable diagnostic settings for each Microsoft Foundry resource you want to monitor. You can forward logs to the same Event Hub, provided they satisfy the limitations and permissions as described here.
When you configure the event hubs source or HTTP source, plan your source category to ease the querying process. A hierarchical approach allows you to make use of wildcards. For example: Azure/Foundry/Logs, Azure/Foundry/Metrics.
Configure collector
Create a hosted collector if not already configured and tag the tenant_name field. You can get the tenant name using the instructions here. Make sure you create the required sources in this collector. 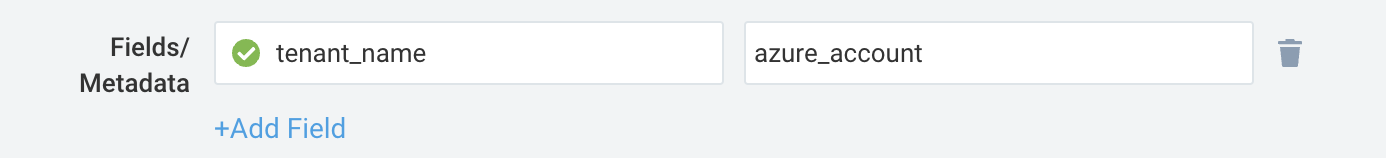
Configure metrics collection
To set up the Azure Metrics source in Sumo Logic, refer to Azure Metrics Source.
Configure logs collection
In this section, you will configure a pipeline for shipping diagnostic logs from Azure Monitor to an Event Hub.
Diagnostic logs
- To set up the Azure Event Hubs source in Sumo Logic, refer to the Azure Event Hubs Source for Logs.
- To create the diagnostic settings in the Azure portal, refer to the Azure documentation. Perform the steps below for each Azure Event Hubs namespace that you want to monitor.
- Choose
Stream to an event hubas the destination. - Select
allLogs. - Use the Event Hub namespace and Event Hub name configured in the previous step in the destination details section. You can use the default policy
RootManageSharedAccessKeyas the policy name.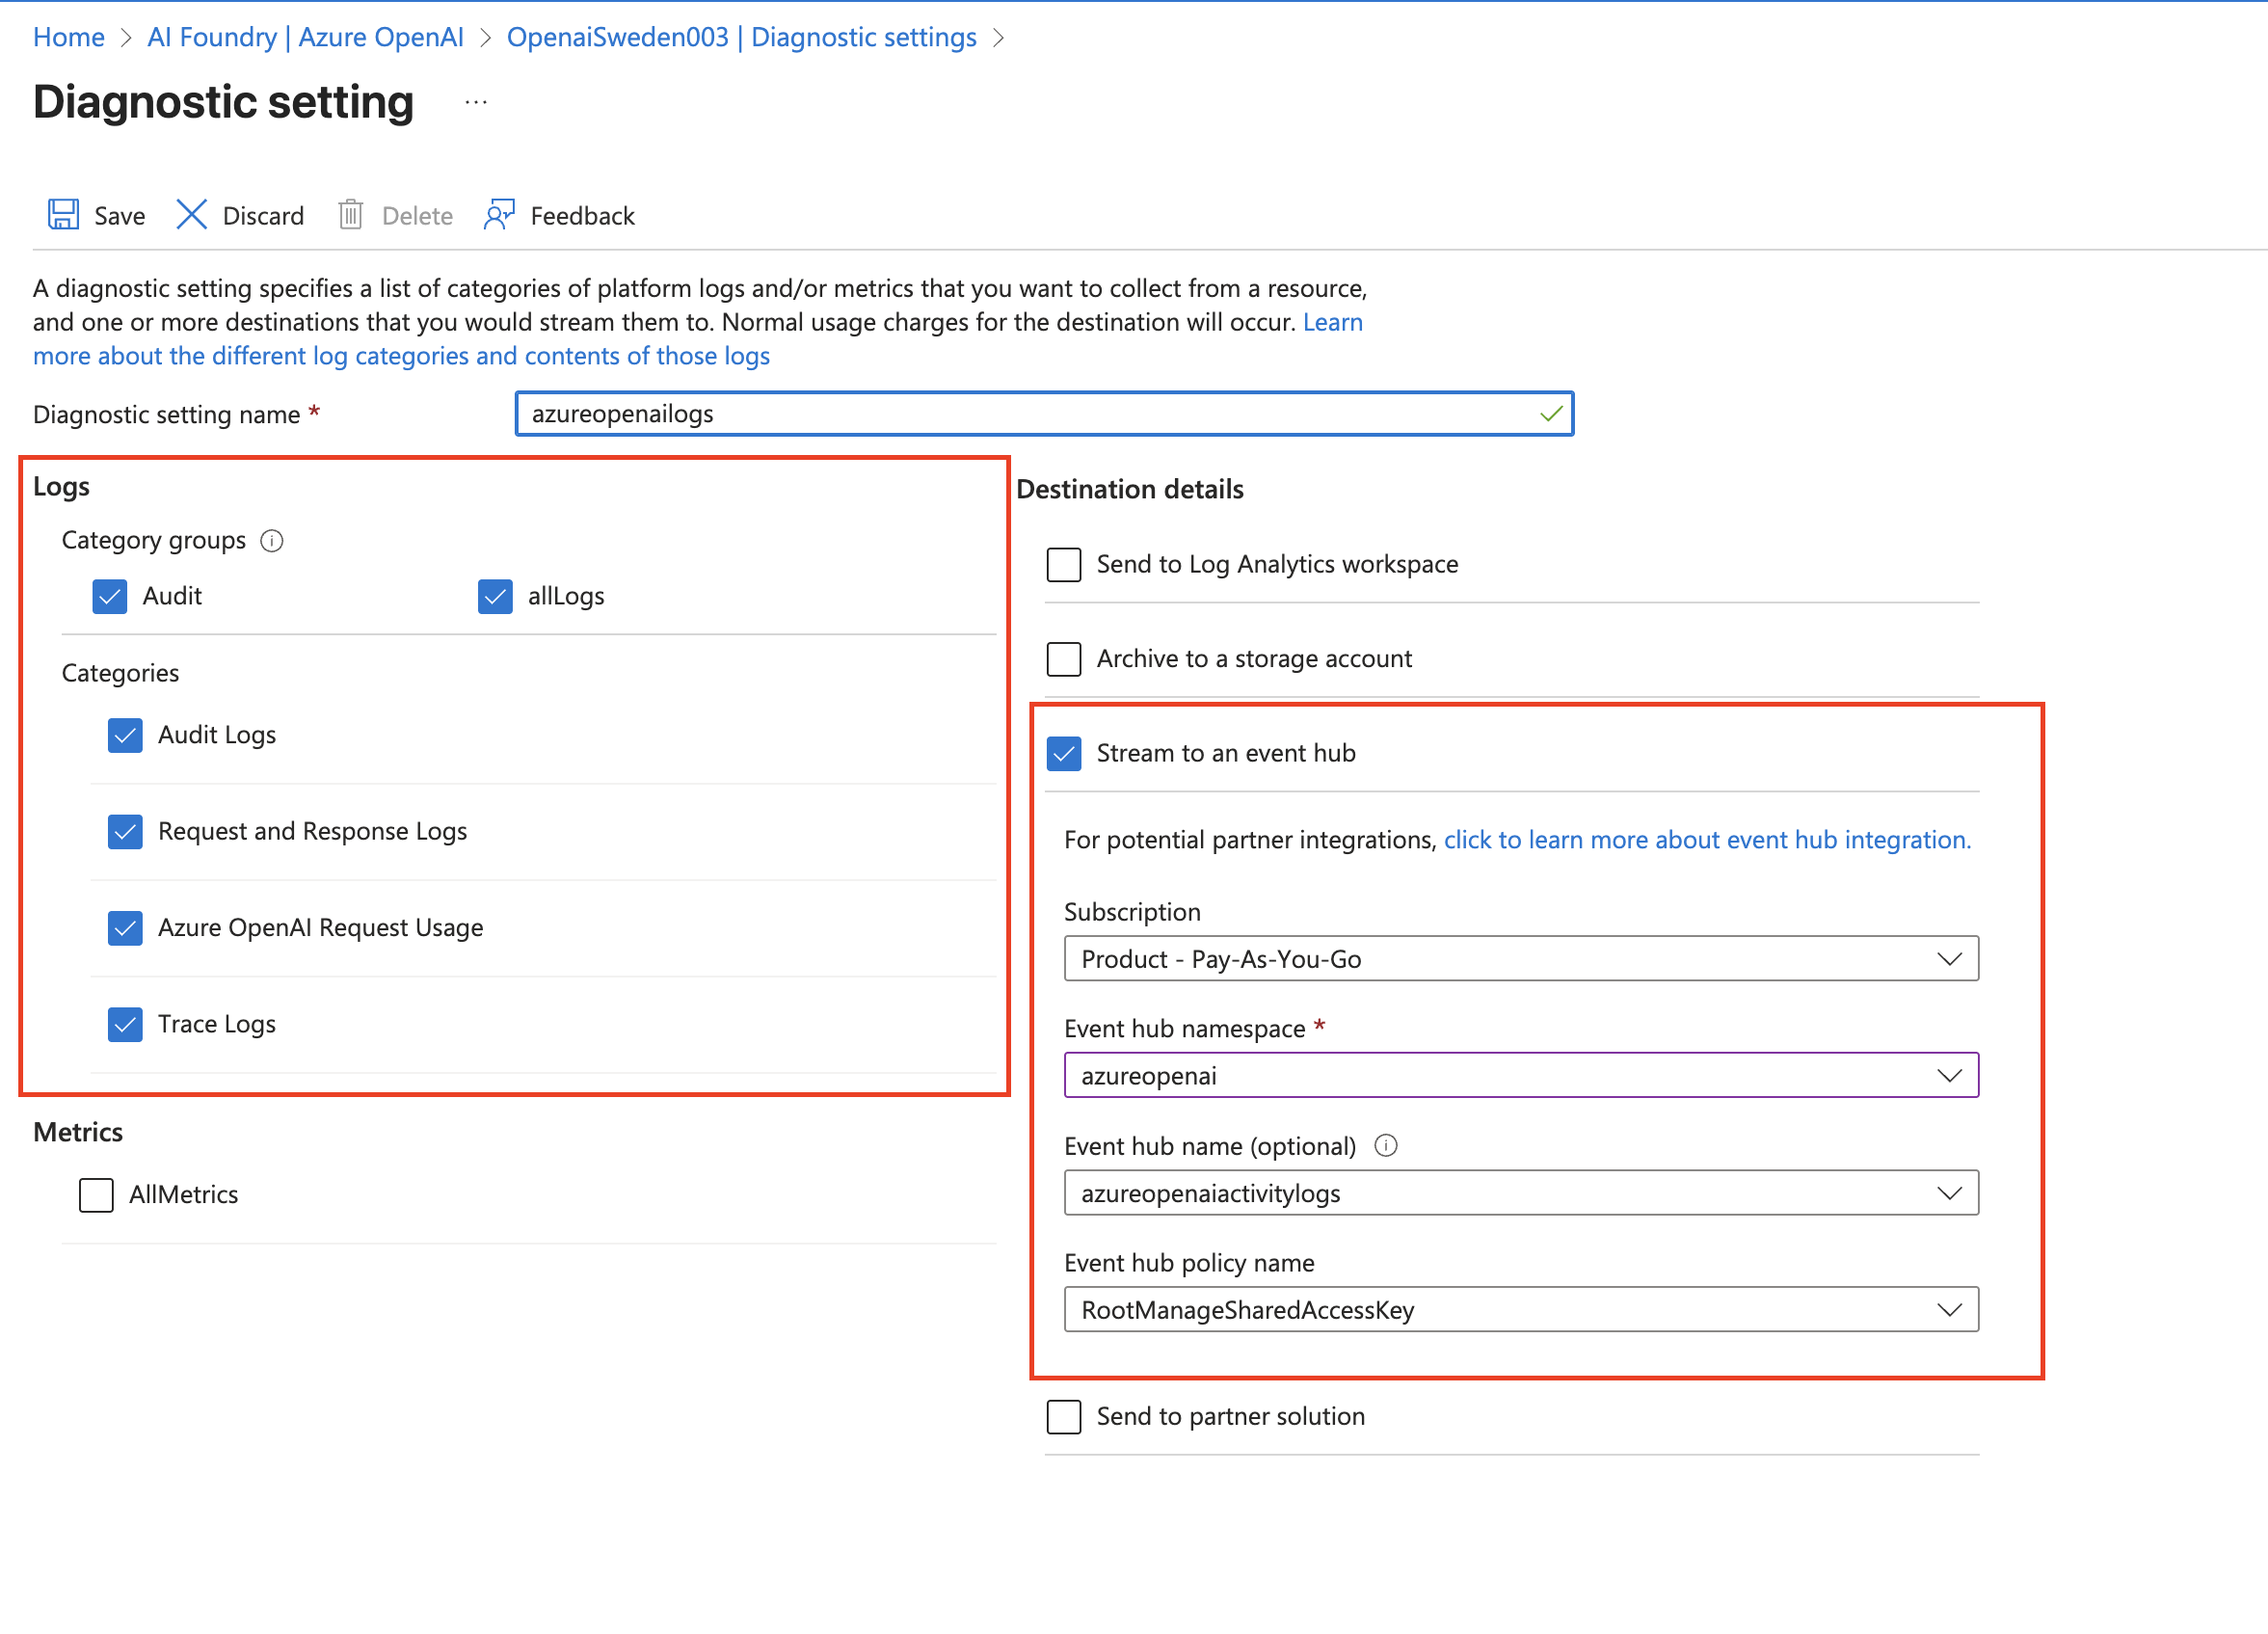
- Choose
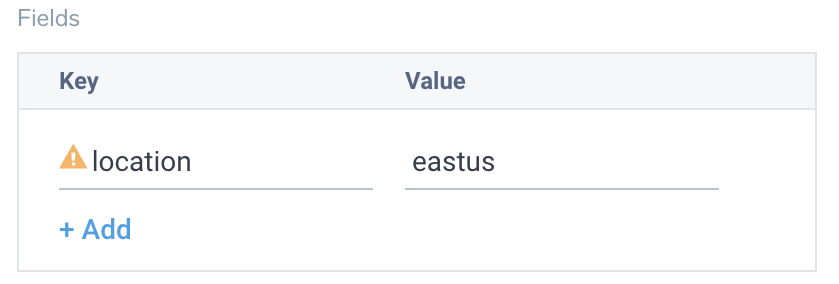
- Tag the location field in the source with the right location value.
Activity logs (optional)
To collect activity logs, follow the instructions here. If you are already collecting activity logs for a subscription, you can skip this step.
Since this source includes logs from multiple regions, do not tag it with the location tag.
Installing the Microsoft Foundry app
To install the app, do the following:
Next-Gen App: To install or update the app, you must be an account administrator or a user with Manage Apps, Manage Monitors, Manage Fields, Manage Metric Rules, and Manage Collectors capabilities depending upon the different content types part of the app.
- Select App Catalog.
- In the 🔎 Search Apps field, run a search for your desired app, then select it.
- Click Install App.
note
Sometimes this button says Add Integration.
- Click Next in the Setup Data section.
- In the Configure App section of your respective app, complete the following field.
- Index. Specify value for _index if the collection is configured with custom partition. Learn more. Default value is set to
sumologic_default(default partition)
- Index. Specify value for _index if the collection is configured with custom partition. Learn more. Default value is set to
- Click Next. You will be redirected to the Preview & Done section.
Post-installation
Once your app is installed, it will appear in your Installed Apps folder, and dashboard panels will start to fill automatically.
Each panel slowly fills with data matching the time range query received since the panel was created. Results will not immediately be available but will be updated with full graphs and charts over time.
As part of the app installation process, the following fields will be created by default:
tenant_name. This field is tagged at the collector level. You can get the tenant name using the instructions here.location. The region the resource name belongs to.subscription_id. ID associated with a subscription where the resource is present.resource_group. The resource group name where the Azure resource is present.provider_name. Azure resource provider name (for example, Microsoft.Network).resource_type. Azure resource type (for example, storage accounts).resource_name. The name of the resource (for example, storage account name).service_type. The type of service that can be accessed with an Azure resource.service_name. Services that can be accessed with an Azure resource. (For example, in Azure Container Instances, the service is Subscriptions.)
Viewing the Microsoft Foundry dashboards
All dashboards have a set of filters that you can apply to the entire dashboard. Use these filters to drill down and examine the data to a granular level.
- You can change the time range for a dashboard or panel by selecting a predefined interval from a drop-down list, choosing a recently used time range, or specifying custom dates and times. Learn more.
- You can use template variables to drill down and examine the data on a granular level. For more information, see Filtering Dashboards with Template Variables.
- Many of the Next-Gen apps allow you to provide the Index at the installation time and a default value for this key (sumologic_default). Based on your input, the app dashboards will be parameterized with a dashboard variable, allowing you to change the data partition queried by all panels. This restricts the query scope of all the dashboard queries to a specific data partition.
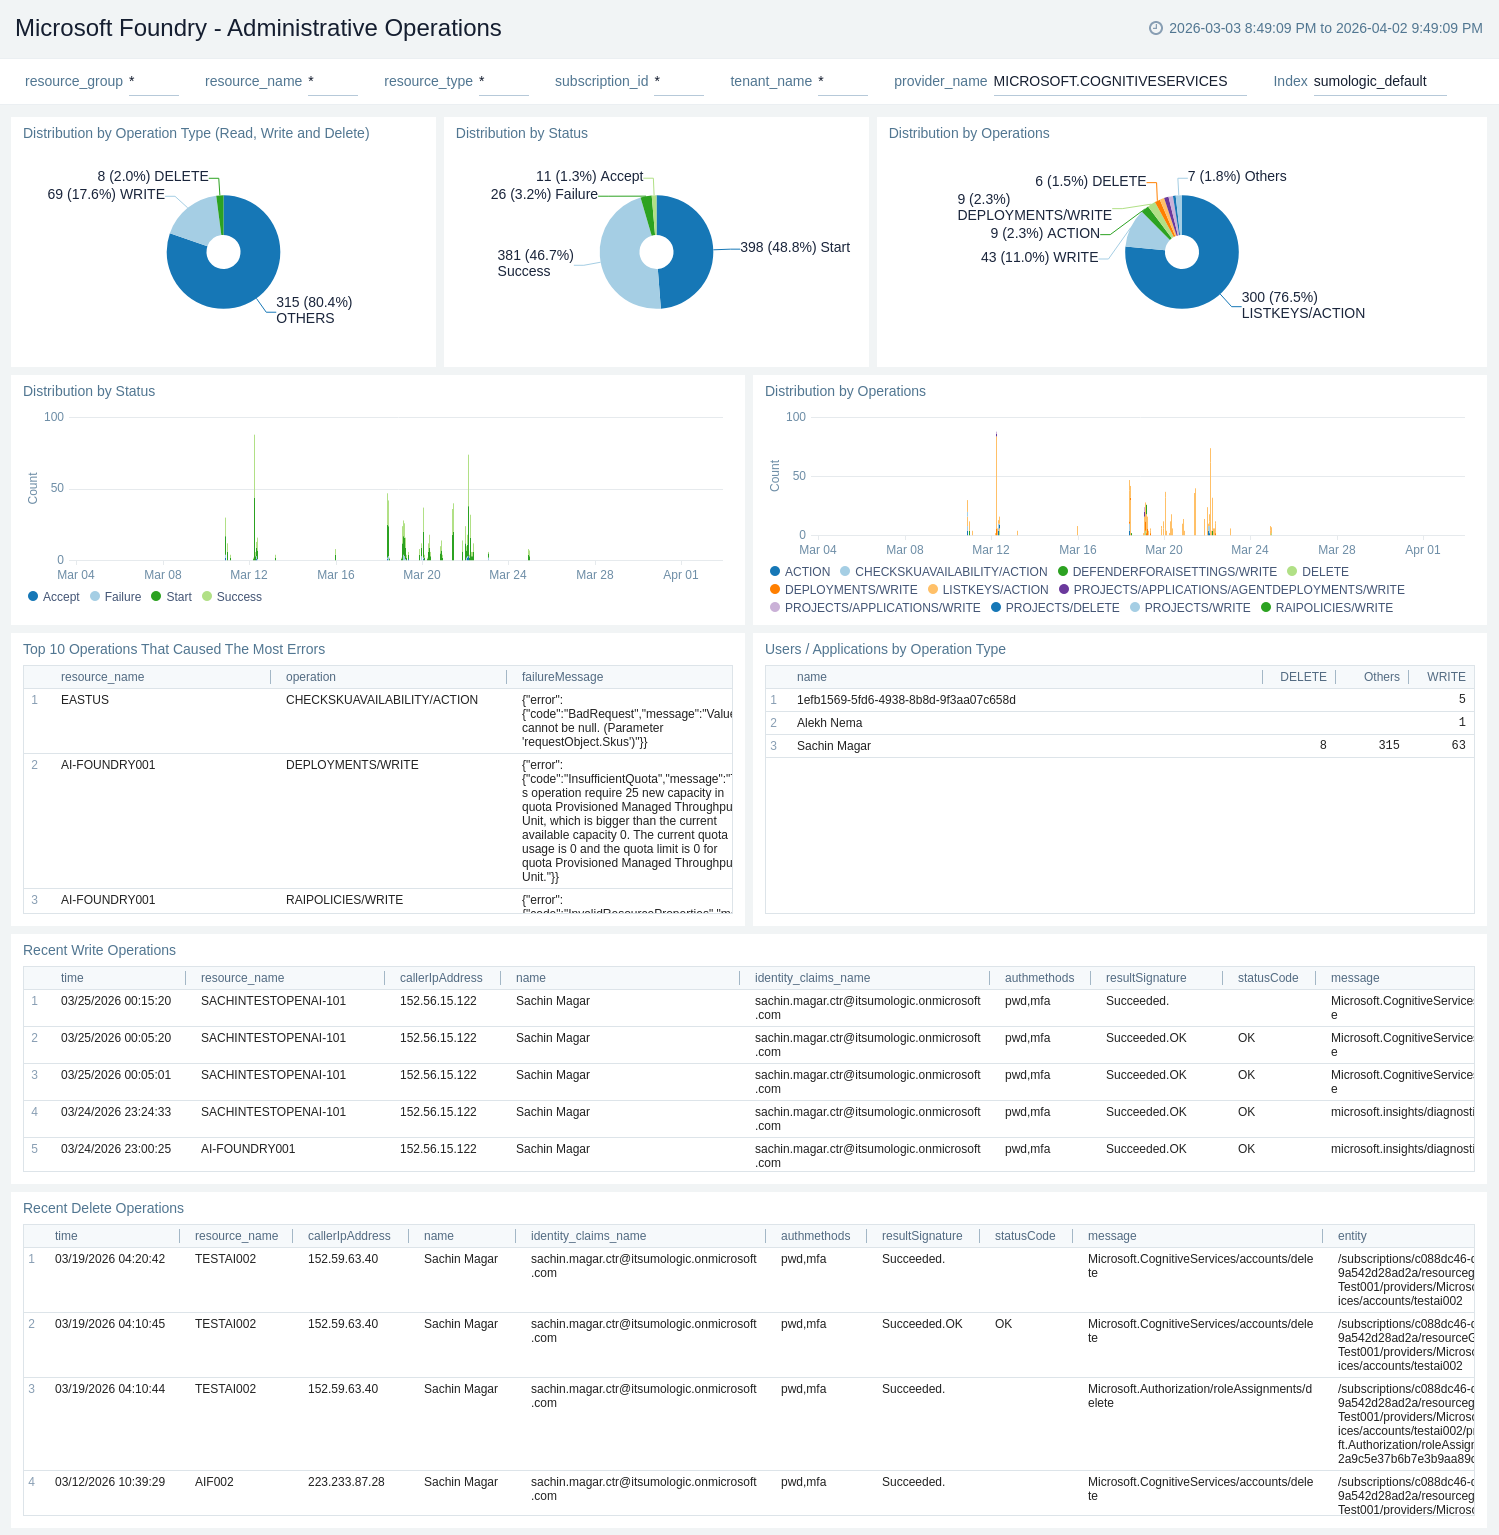
Administrative Operations
The Microsoft Foundry - Administrative Operations dashboard provides insights into the operational activities and status of your Microsoft Foundry resources. Panels display information on operation type distribution, success rates, top operations causing errors, and recent write and delete operations to maintain an audit trail of configuration changes.
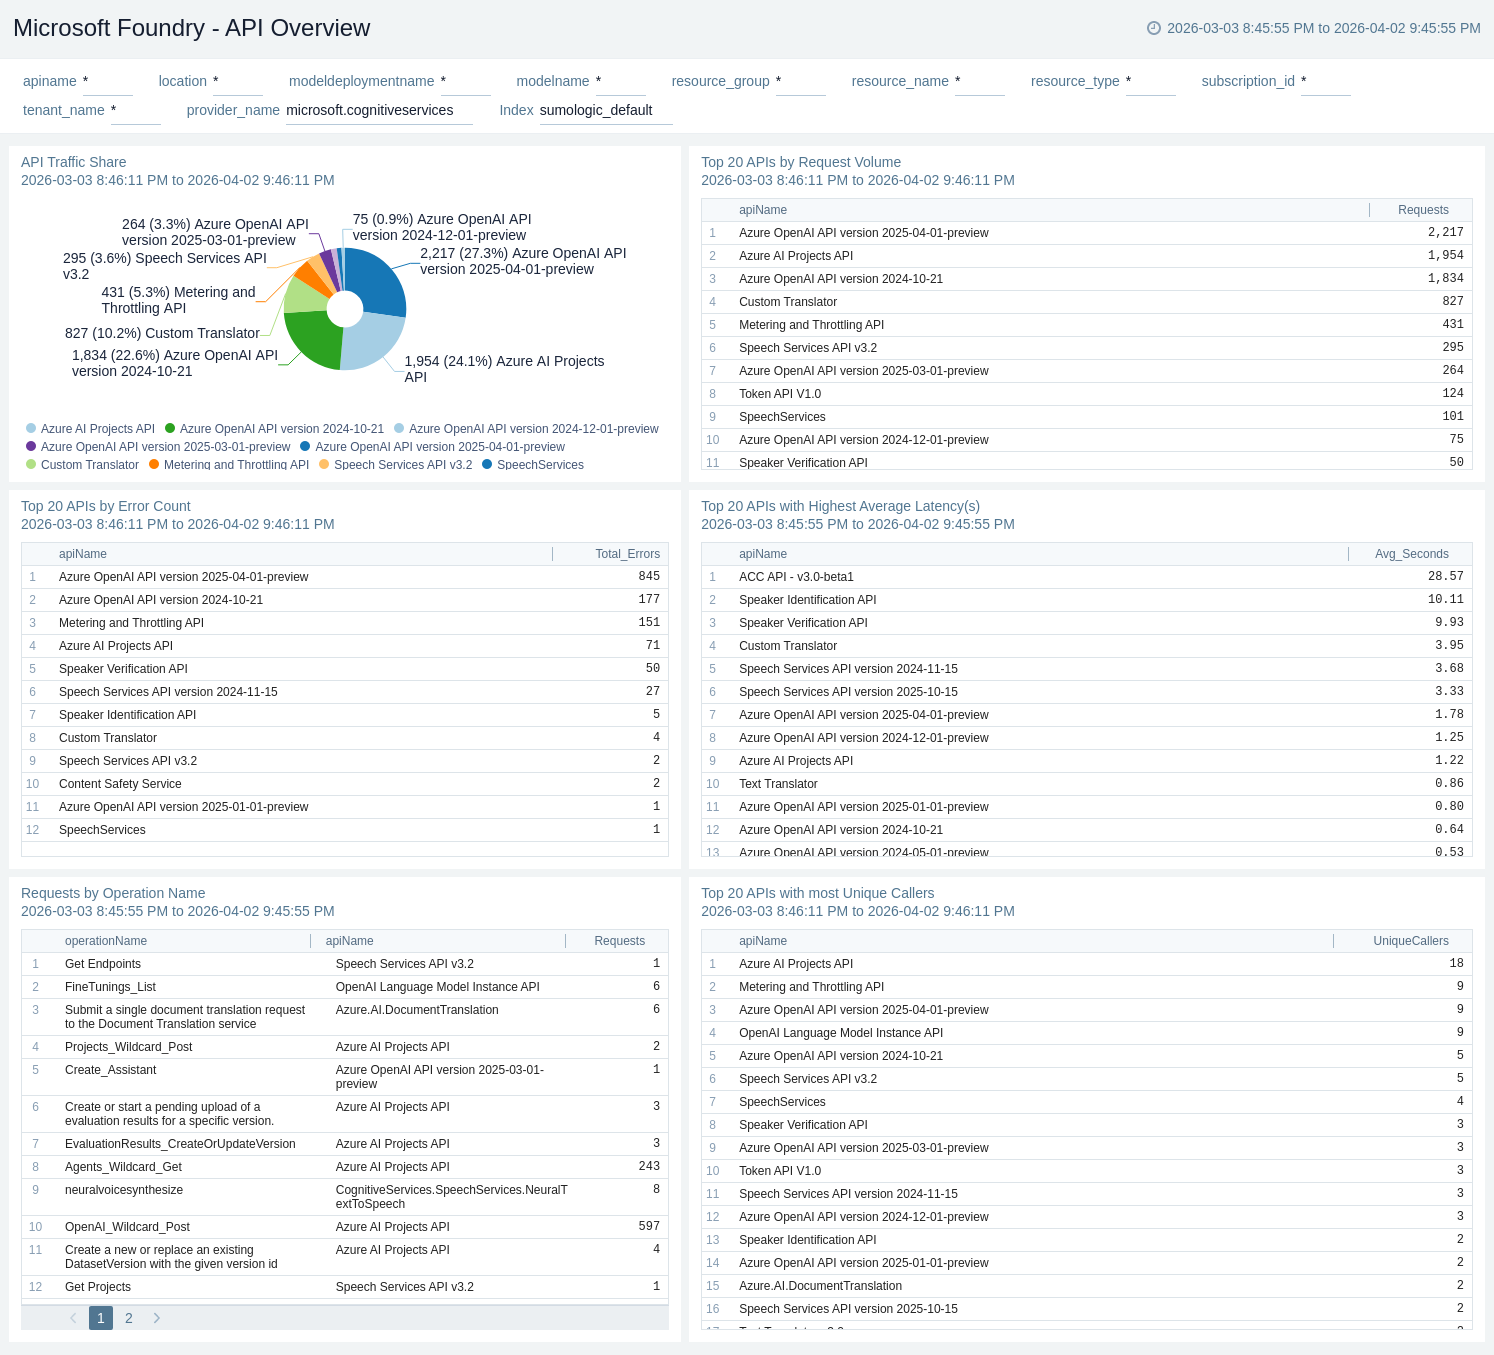
API Overview
The Microsoft Foundry - API Overview dashboard provides a high-level view of the overall health, performance, usage, and safety signals of your Microsoft Foundry service. Panels display information on availability, request activity, token consumption, latency, and moderation events across deployments.
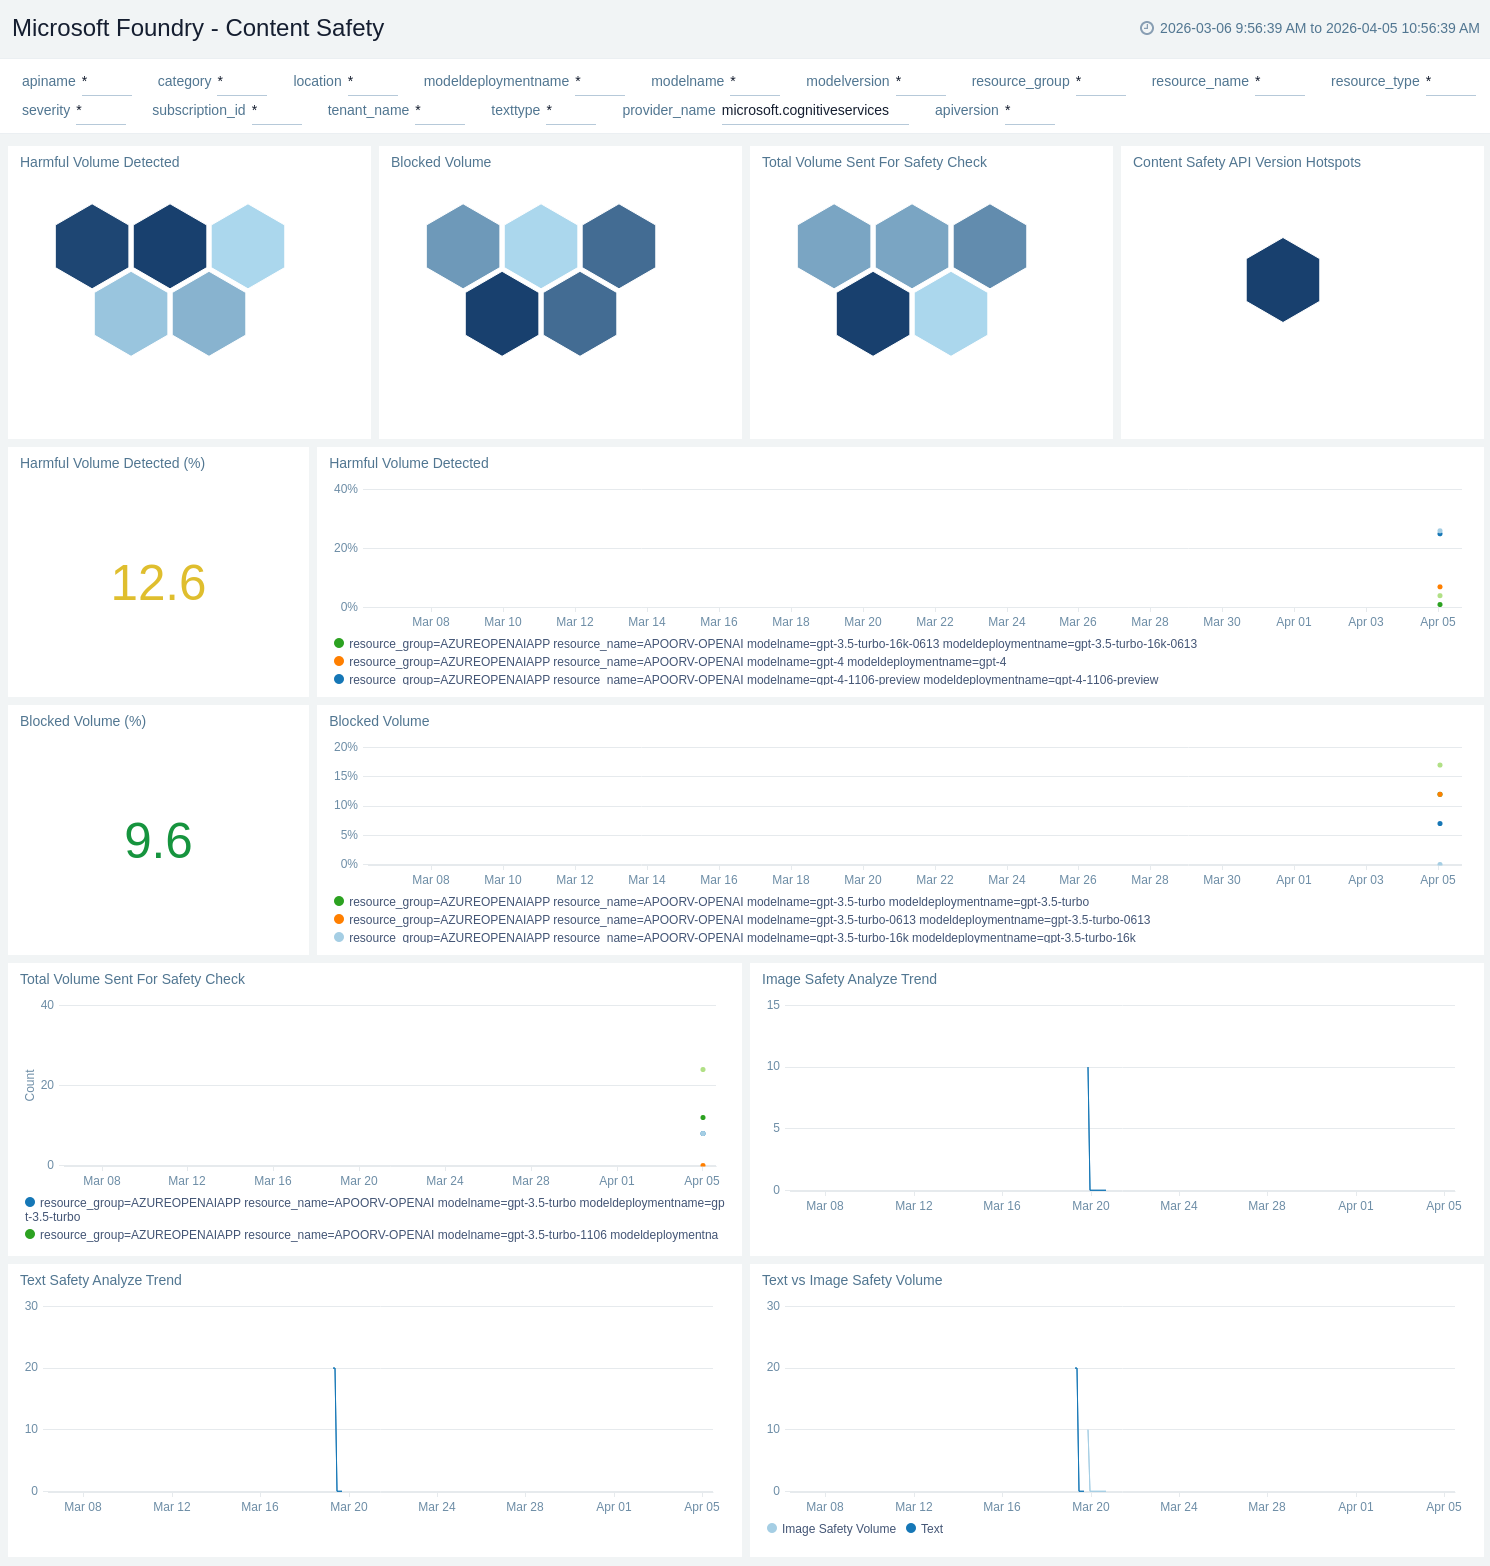
Content Safety
The Microsoft Foundry - Content Safety dashboard provides insights into responsible AI policies and content safety enforcement. Panels display information on harmful content detected, requests blocked by filters, abusive user identification, and system safety events.
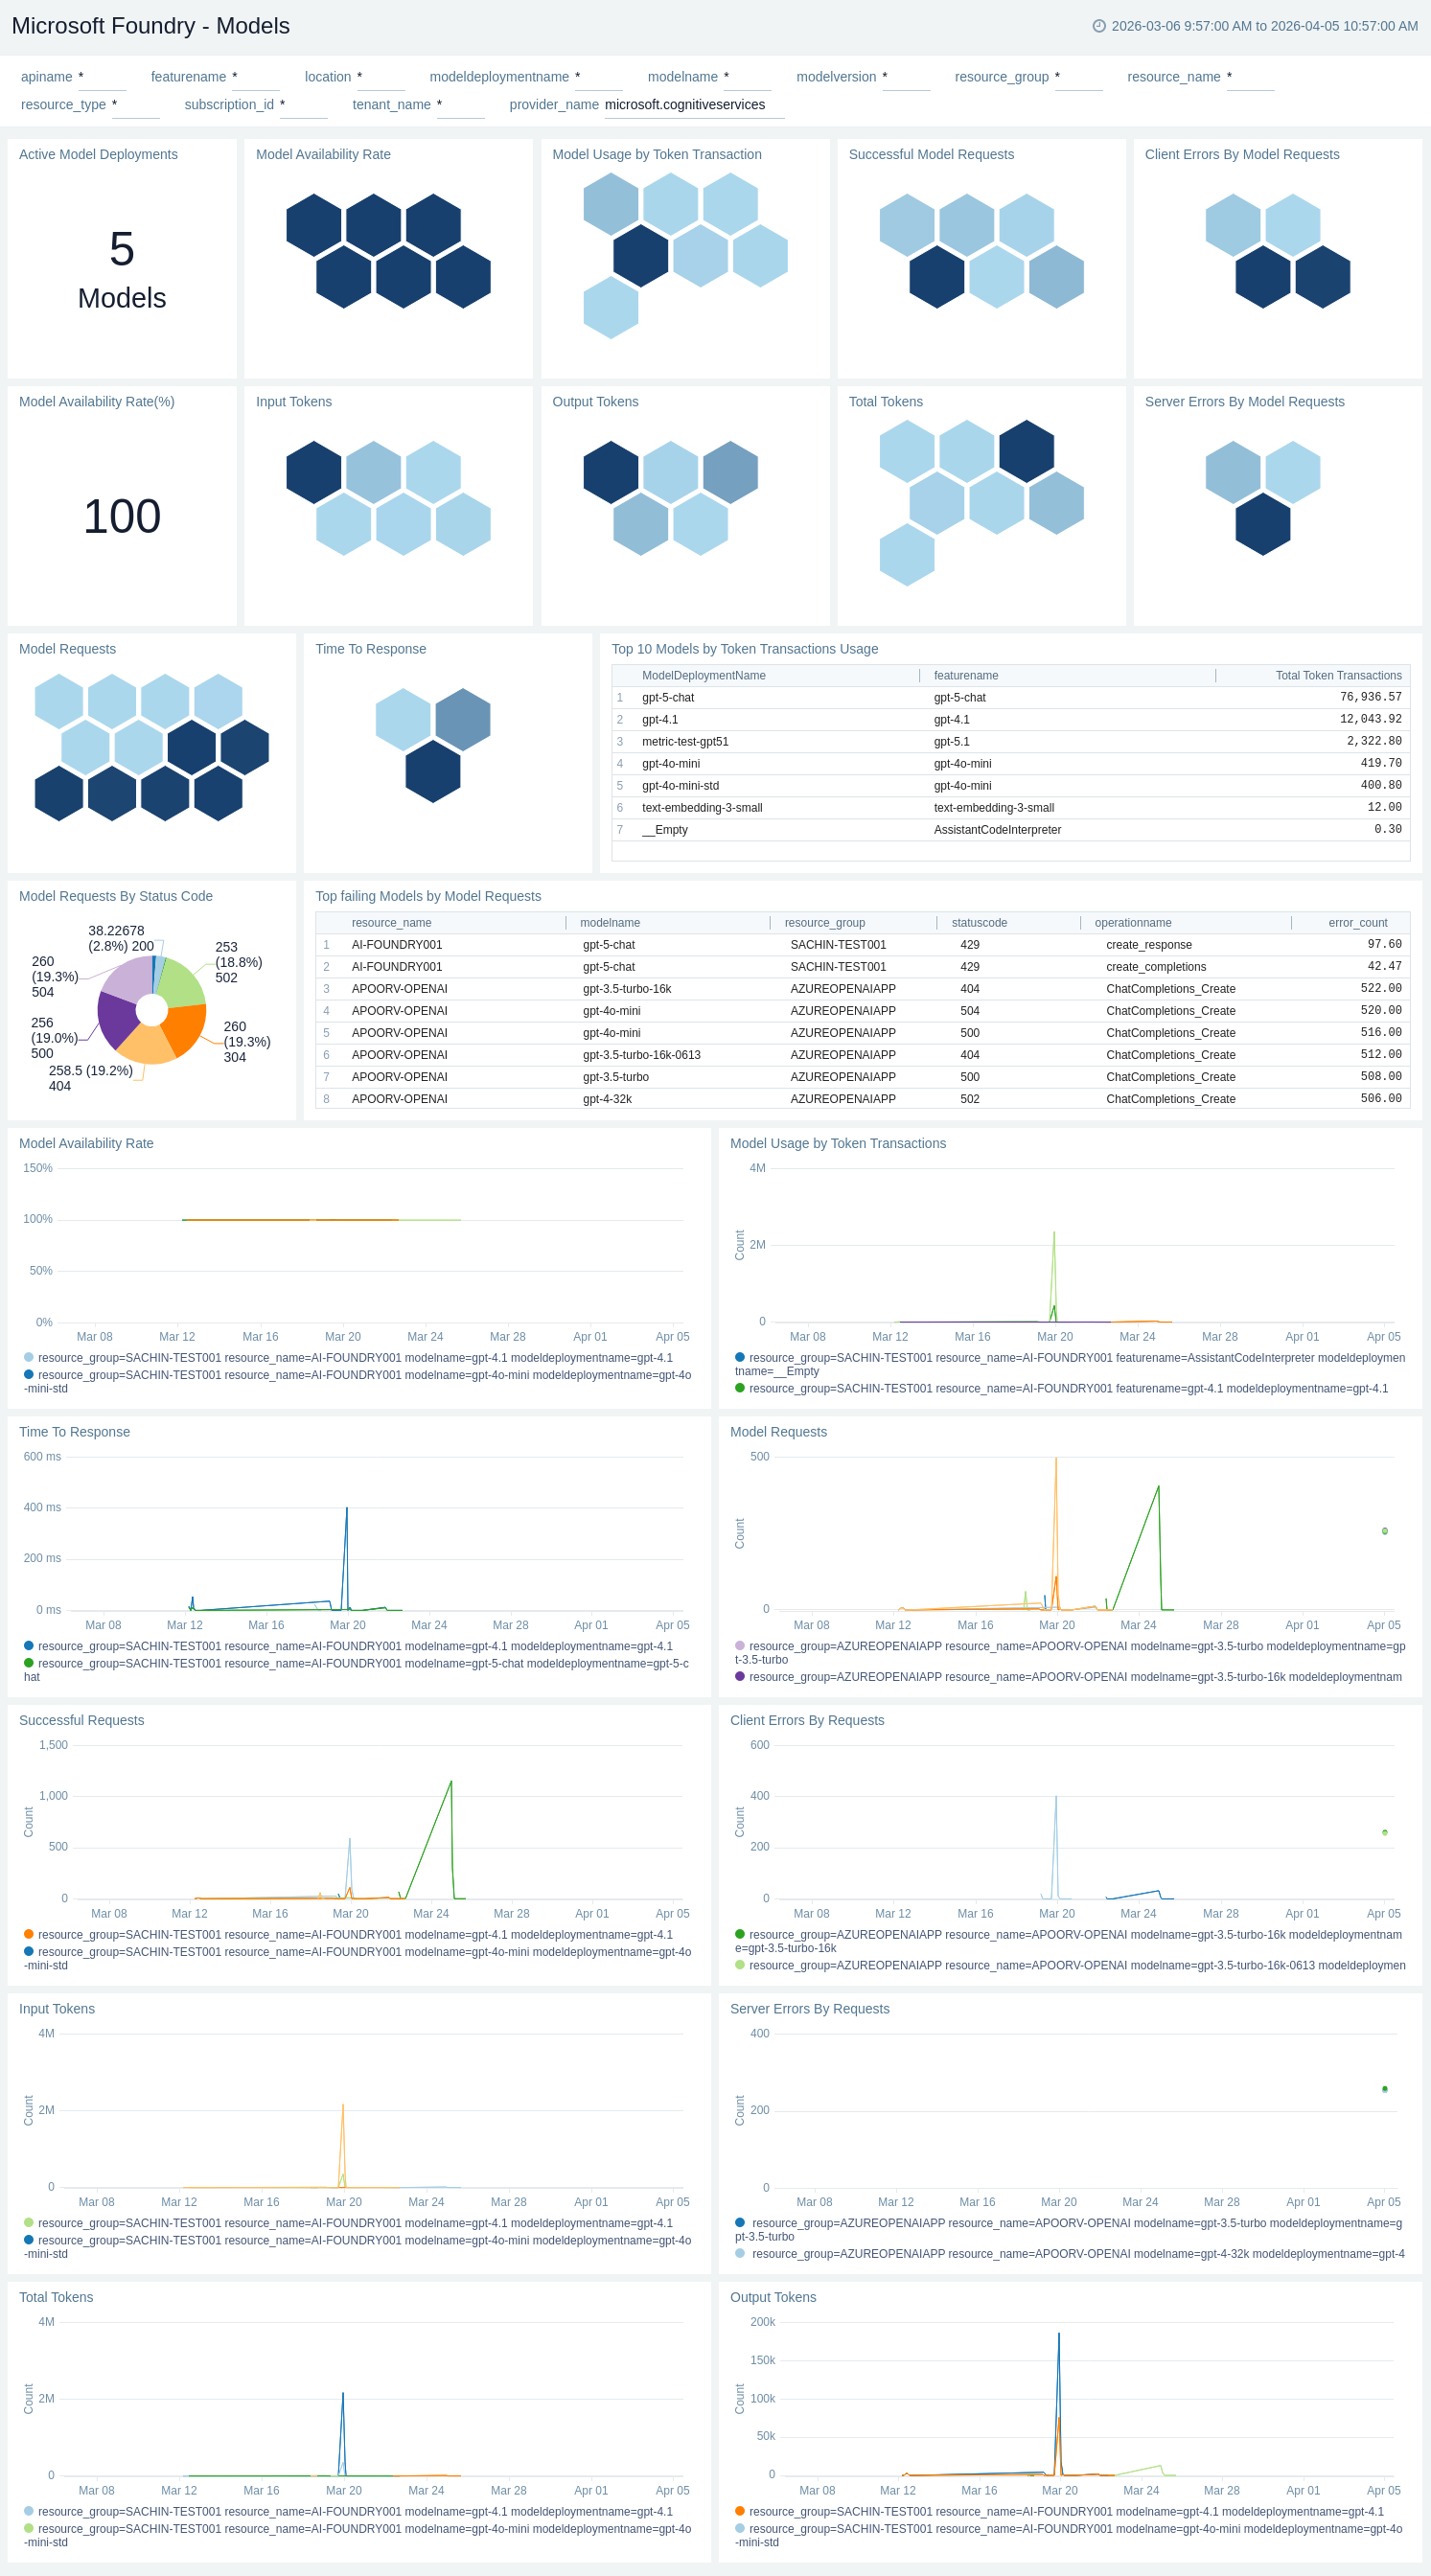
Models
The Microsoft Foundry - Models dashboard provides a deep dive into individual model performance, usage, and health. Panels display information on model availability, request rates, operations, latency, throughput (tokens per second), and usage split by deployment, model name, and resources.
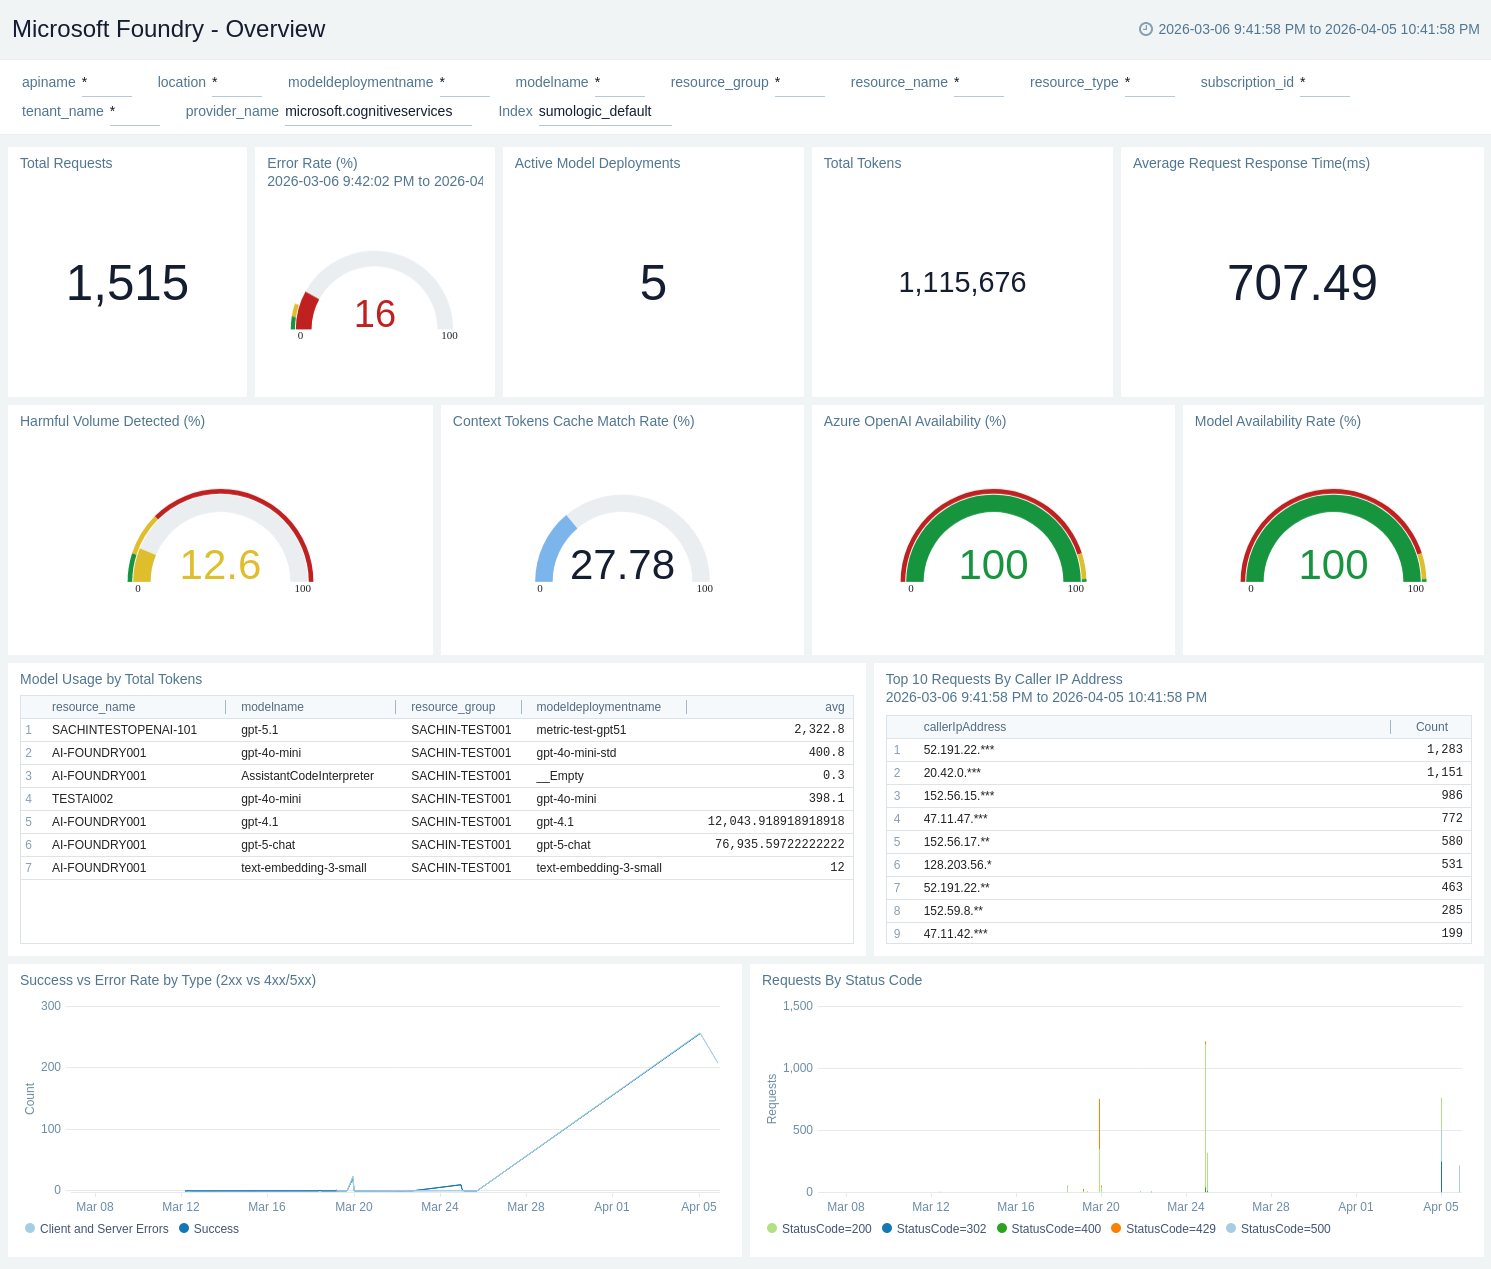
Overview
The Microsoft Foundry - Overview dashboard provides a high-level view of the overall health, performance, usage, and safety signals of your Microsoft Foundry service. Panels display information on availability, request activity, token consumption, latency, and moderation events across deployments.
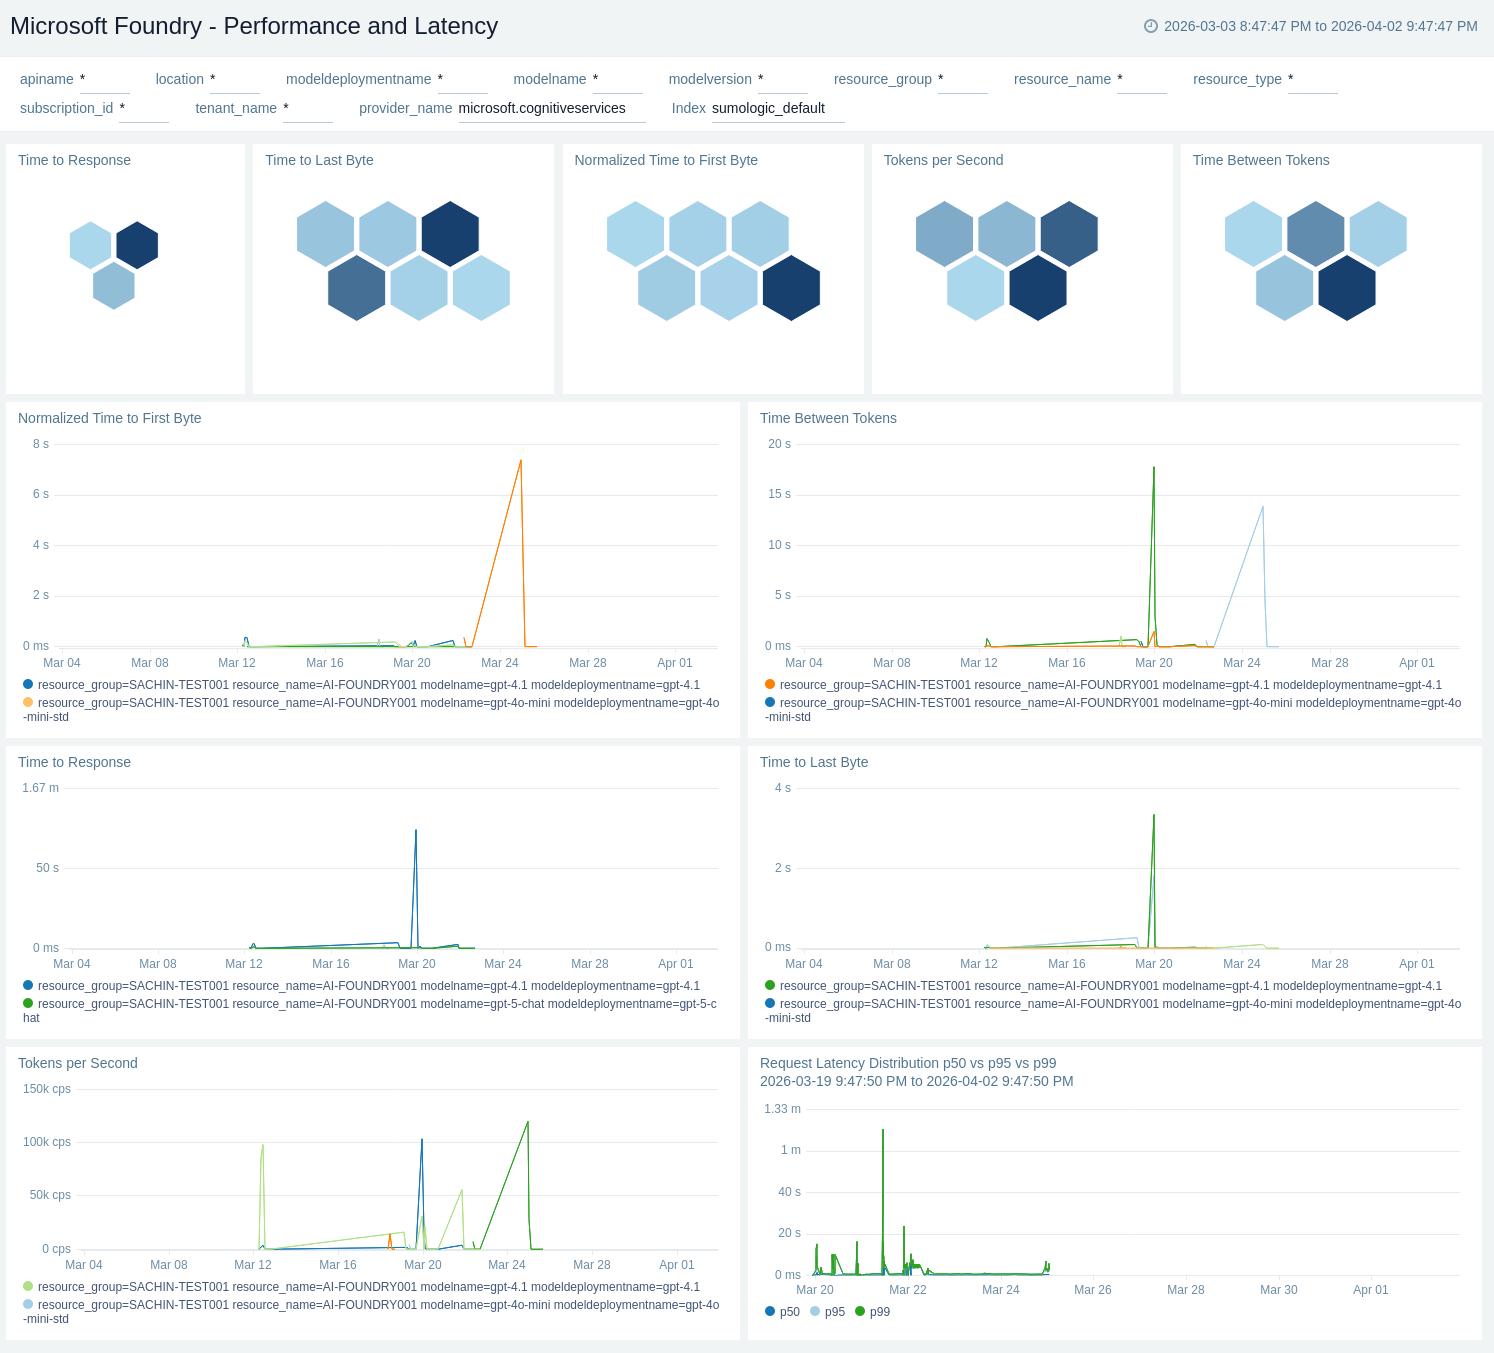
Performance and Latency
The Microsoft Foundry - Performance and Latency dashboard provides insights into the responsiveness of Microsoft Foundry APIs and models. Panels display information on time-to-first-byte (TTFB), time-to-response, time-between-tokens for streaming performance, tokens-per-second speed, and time-to-last-byte across models and deployments.
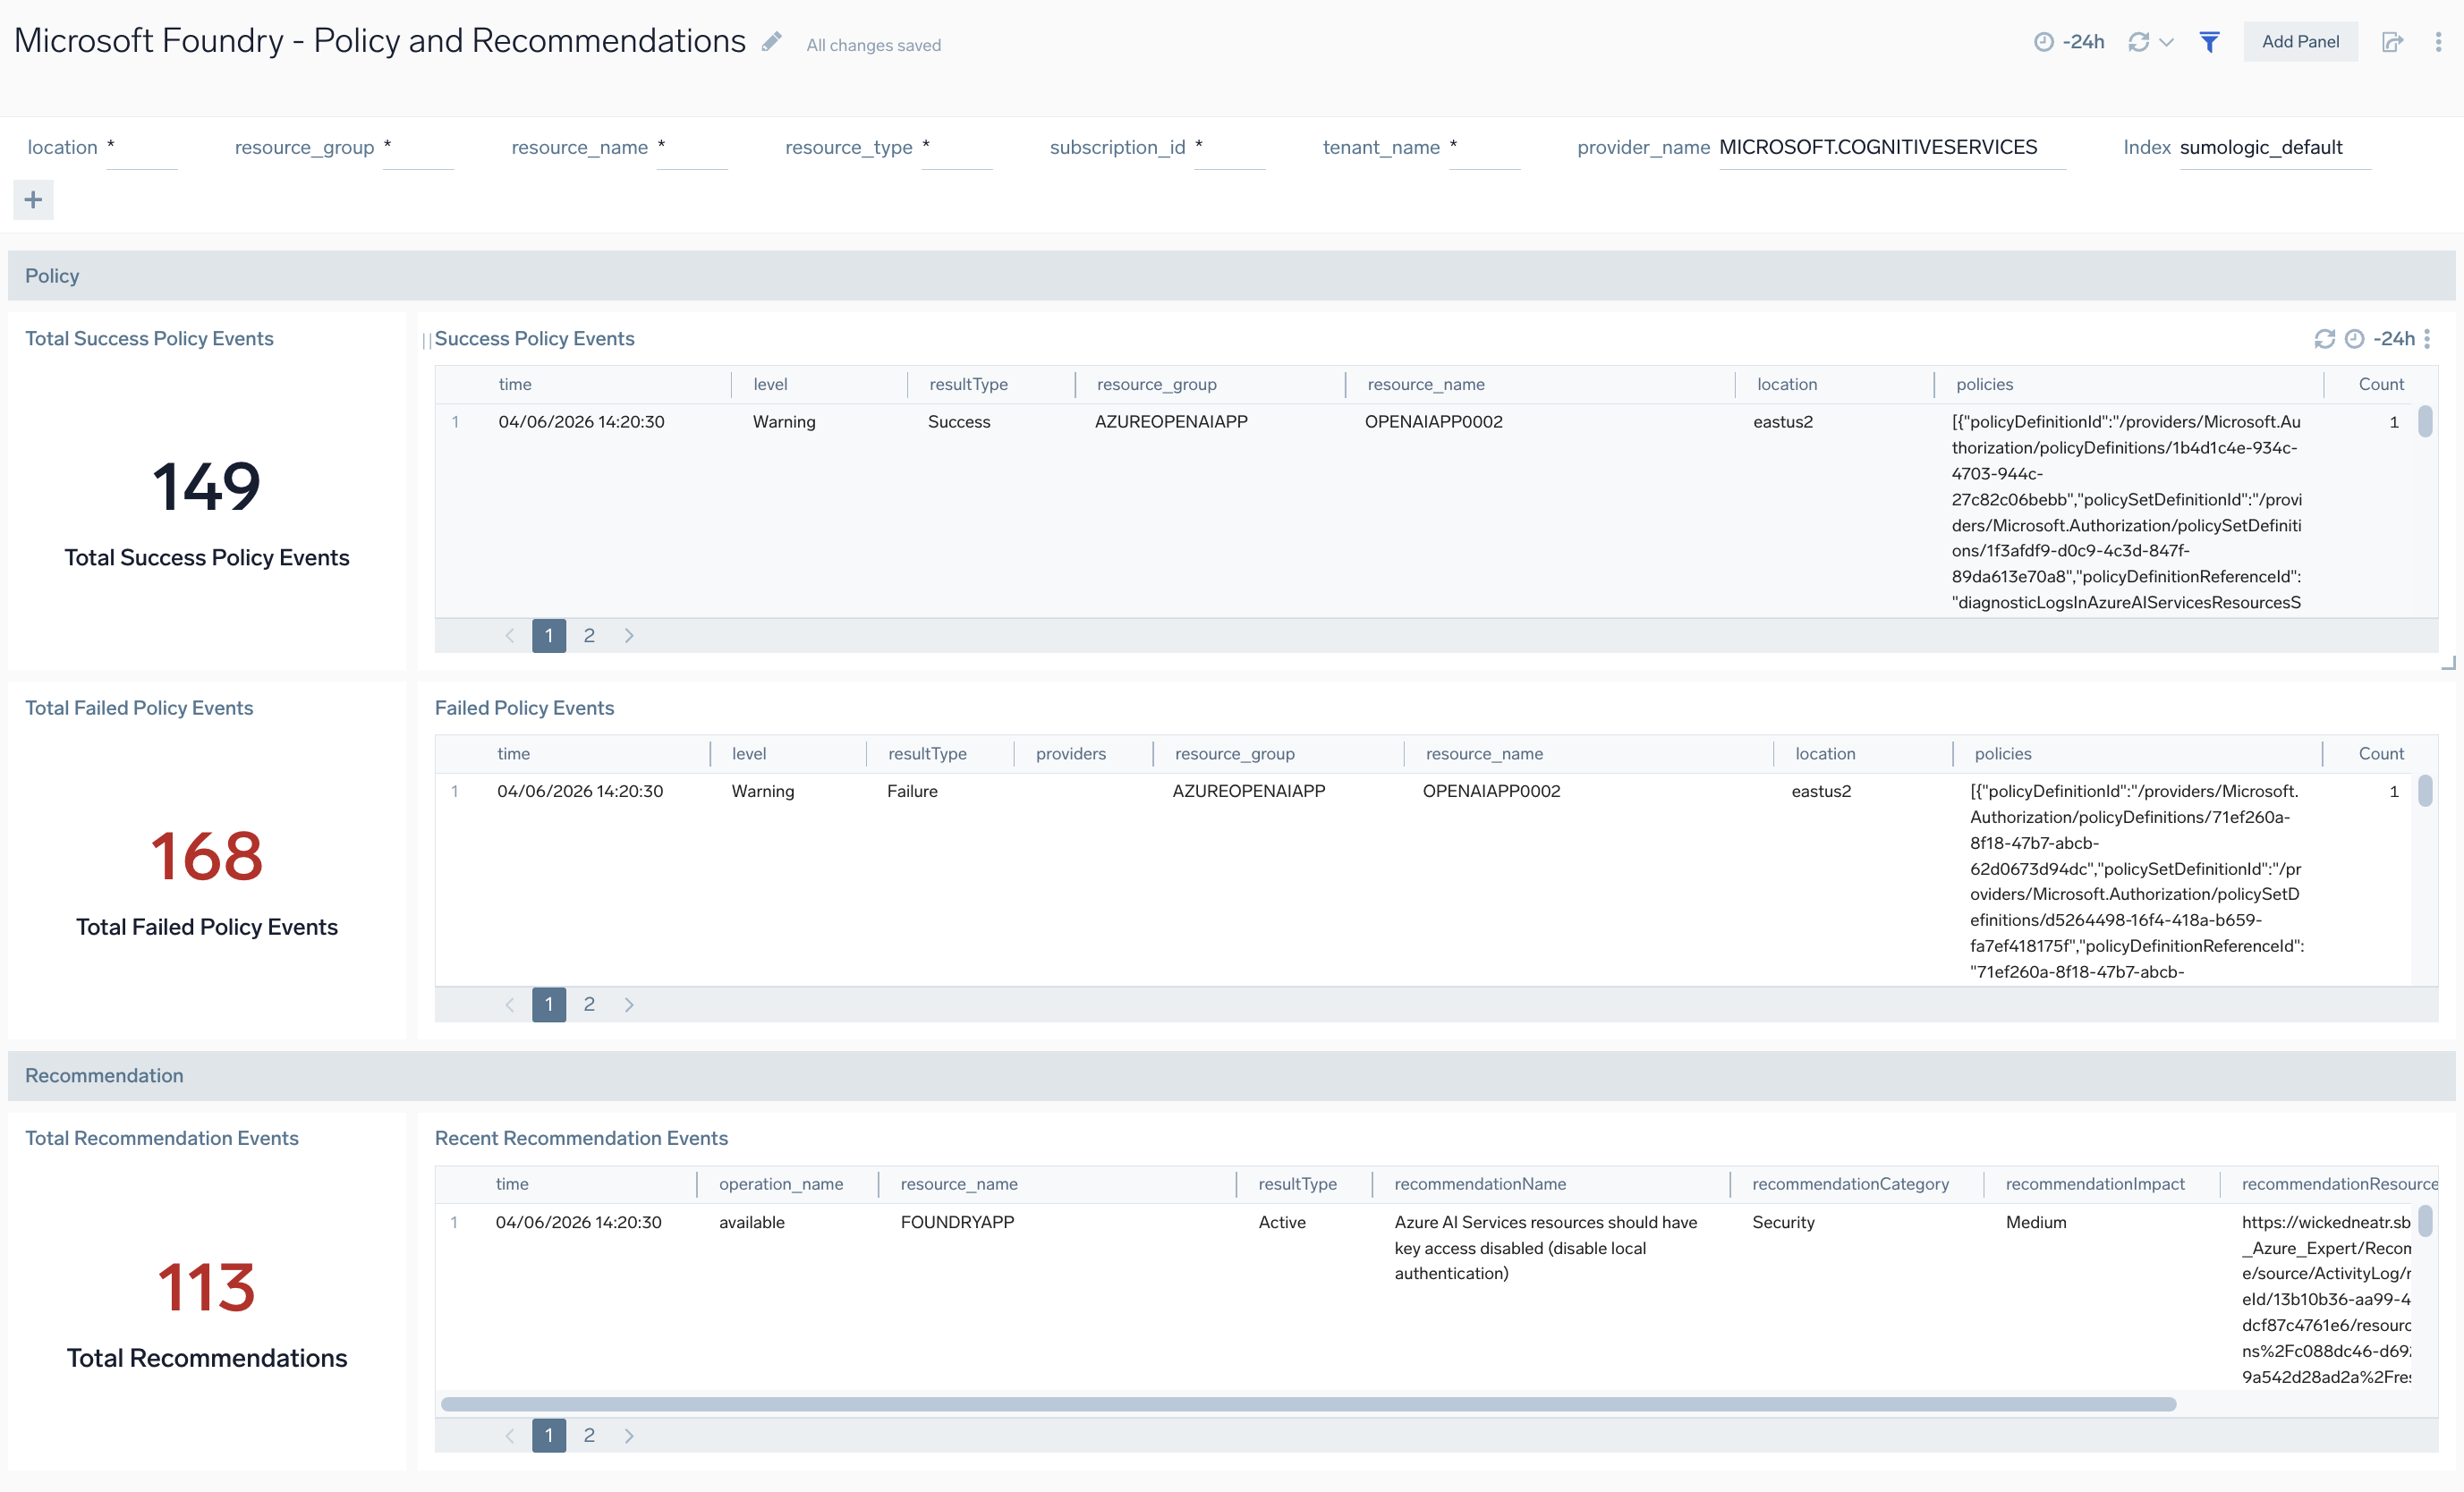
Policy and Recommendations
The Microsoft Foundry - Policy and Recommendations dashboard provides insights into policy events and recommendations for your Microsoft Foundry resources. Panels display information on the success and failure rates of policy events, recent recommendations to improve performance and security, and trends in policy events over time.
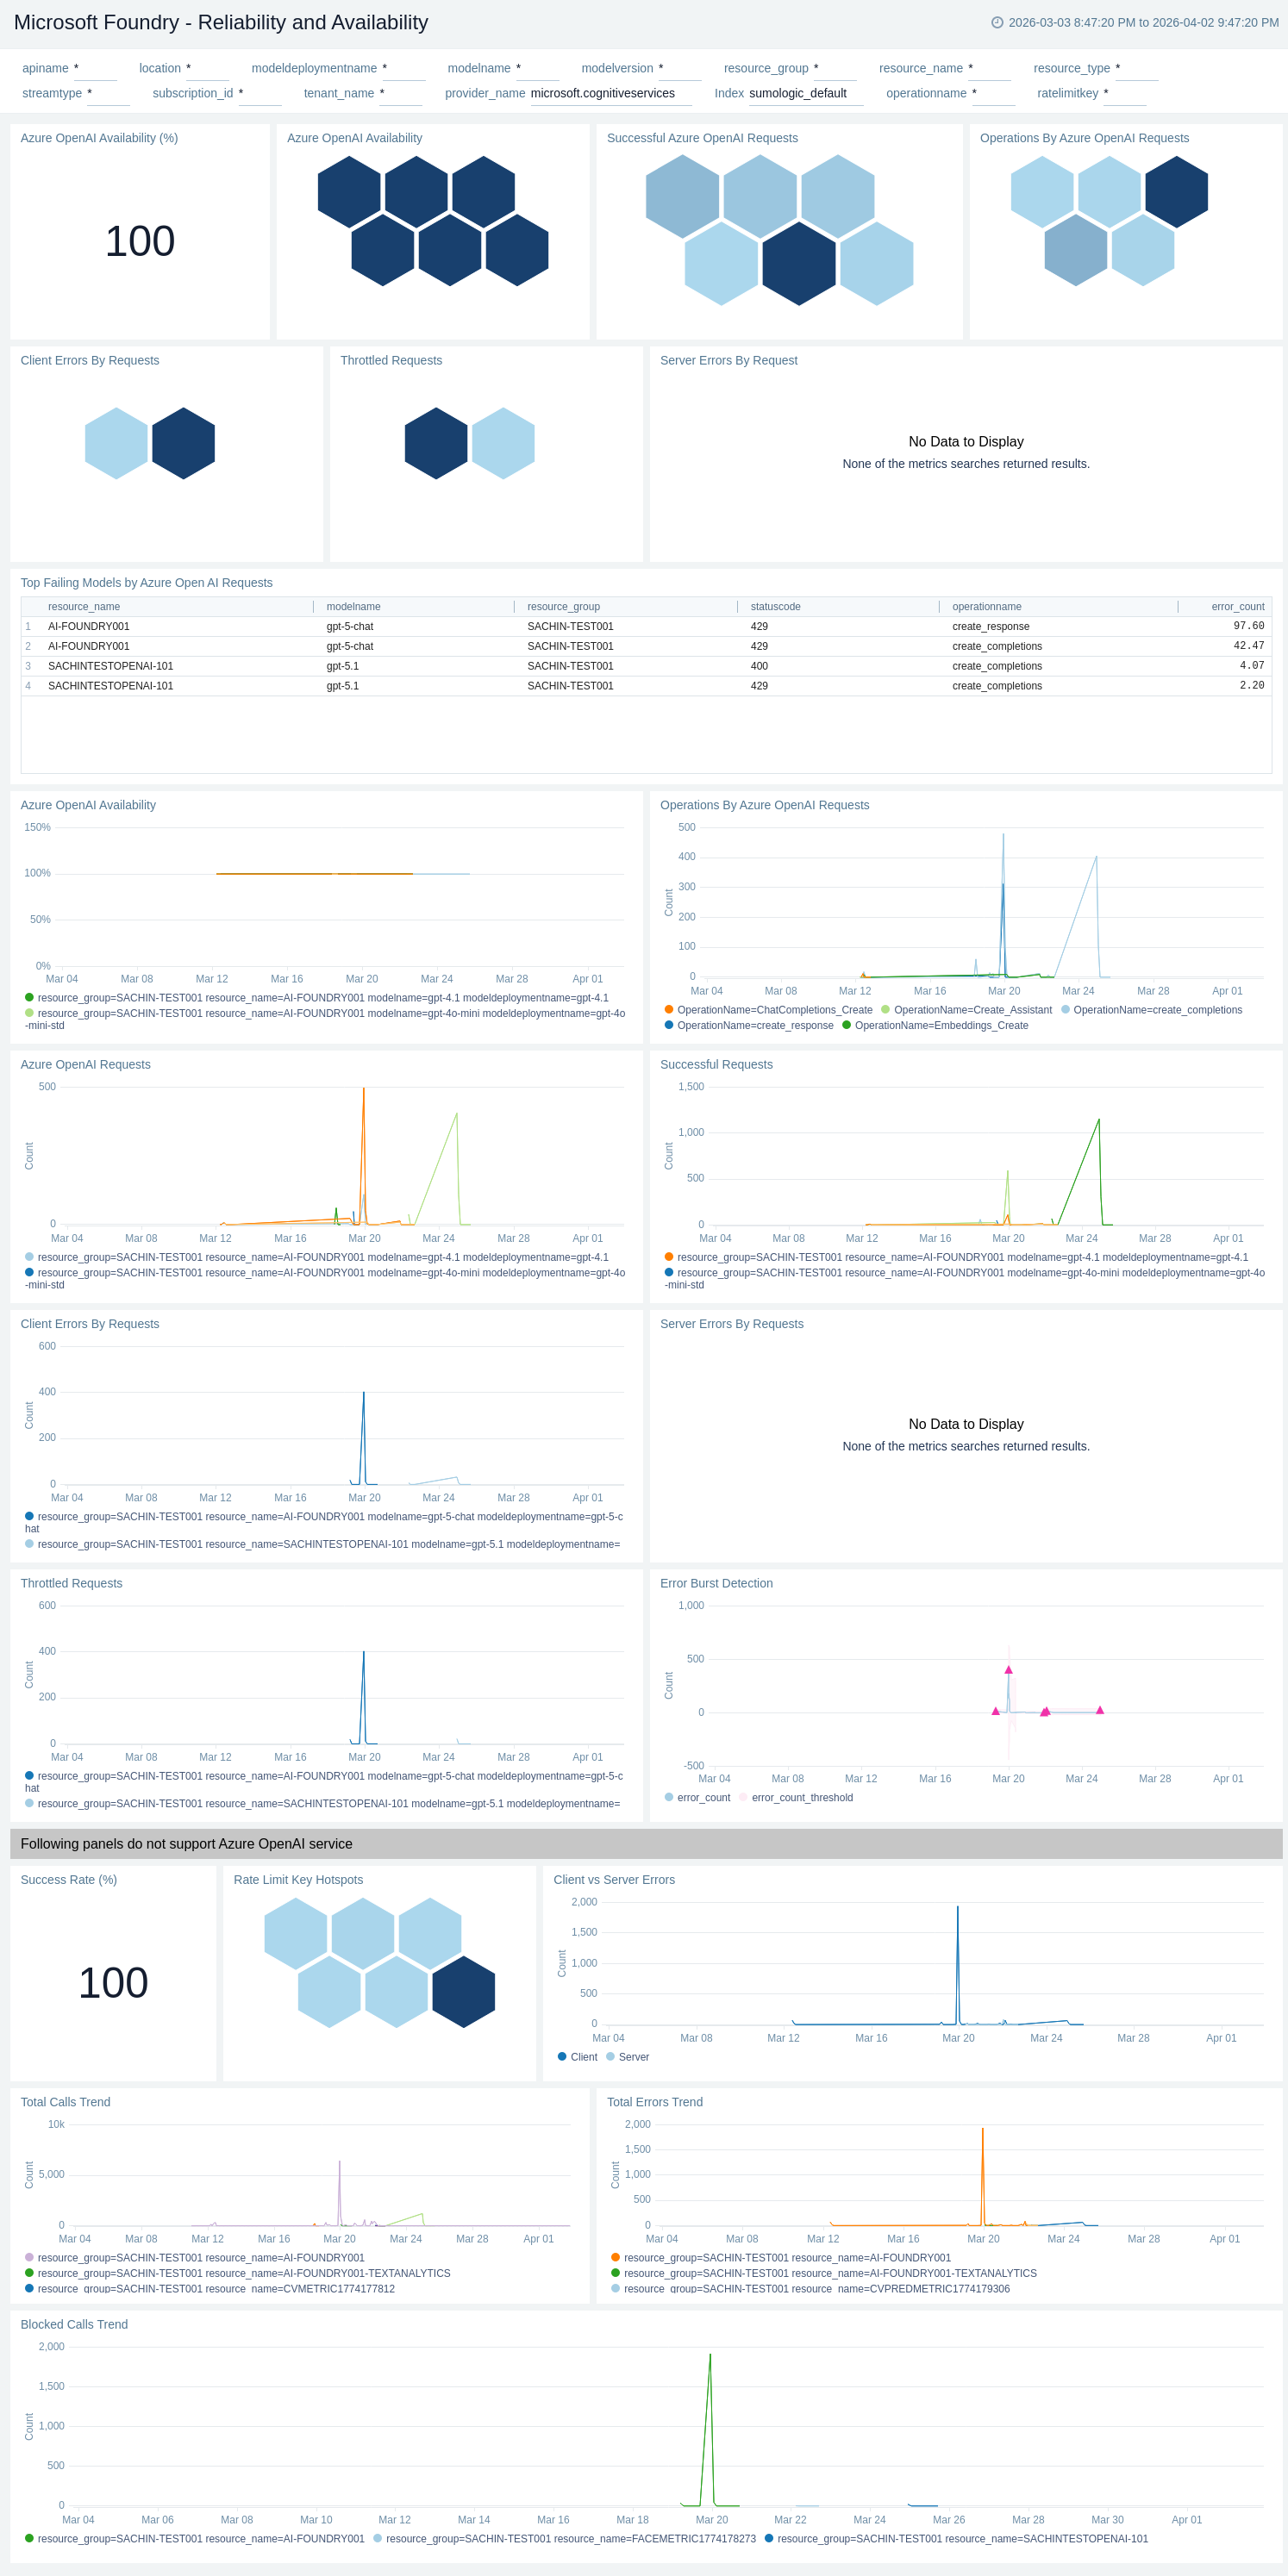
Reliability and Availability
The Microsoft Foundry - Reliability and Availability dashboard provides visibility into the operational health of Microsoft Foundry across deployments and models. Panels display information on overall API availability, request success vs client/server errors, and throttled calls (429) to help identify availability degradation, error spikes, and throttling events.
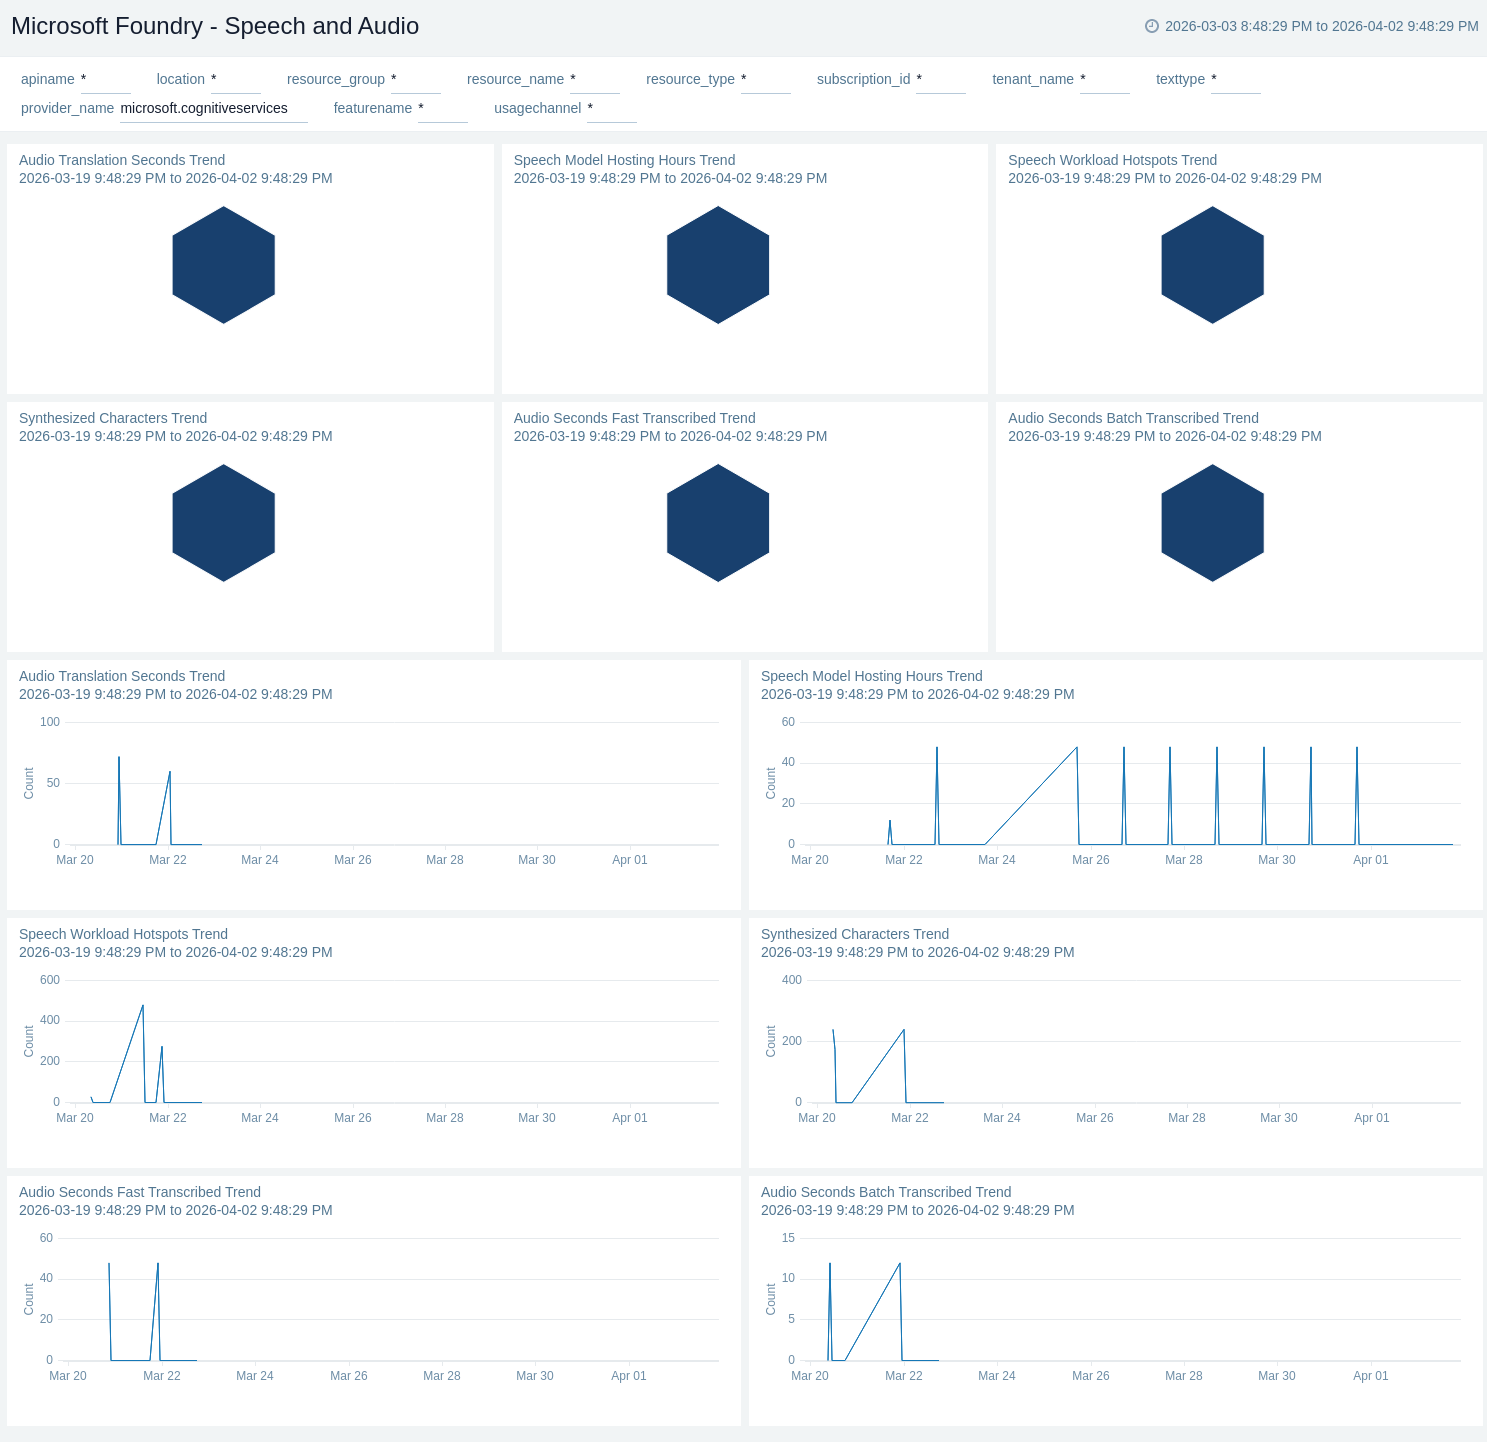
Speech and Audio
The Microsoft Foundry - Speech and Audio dashboard provides insights into speech processing and audio workloads within your Microsoft Foundry resources. Panels display information on audio seconds transcribed, batch and fast transcription trends, audio translation seconds, synthesized characters, and speech workload hotspots across deployments.
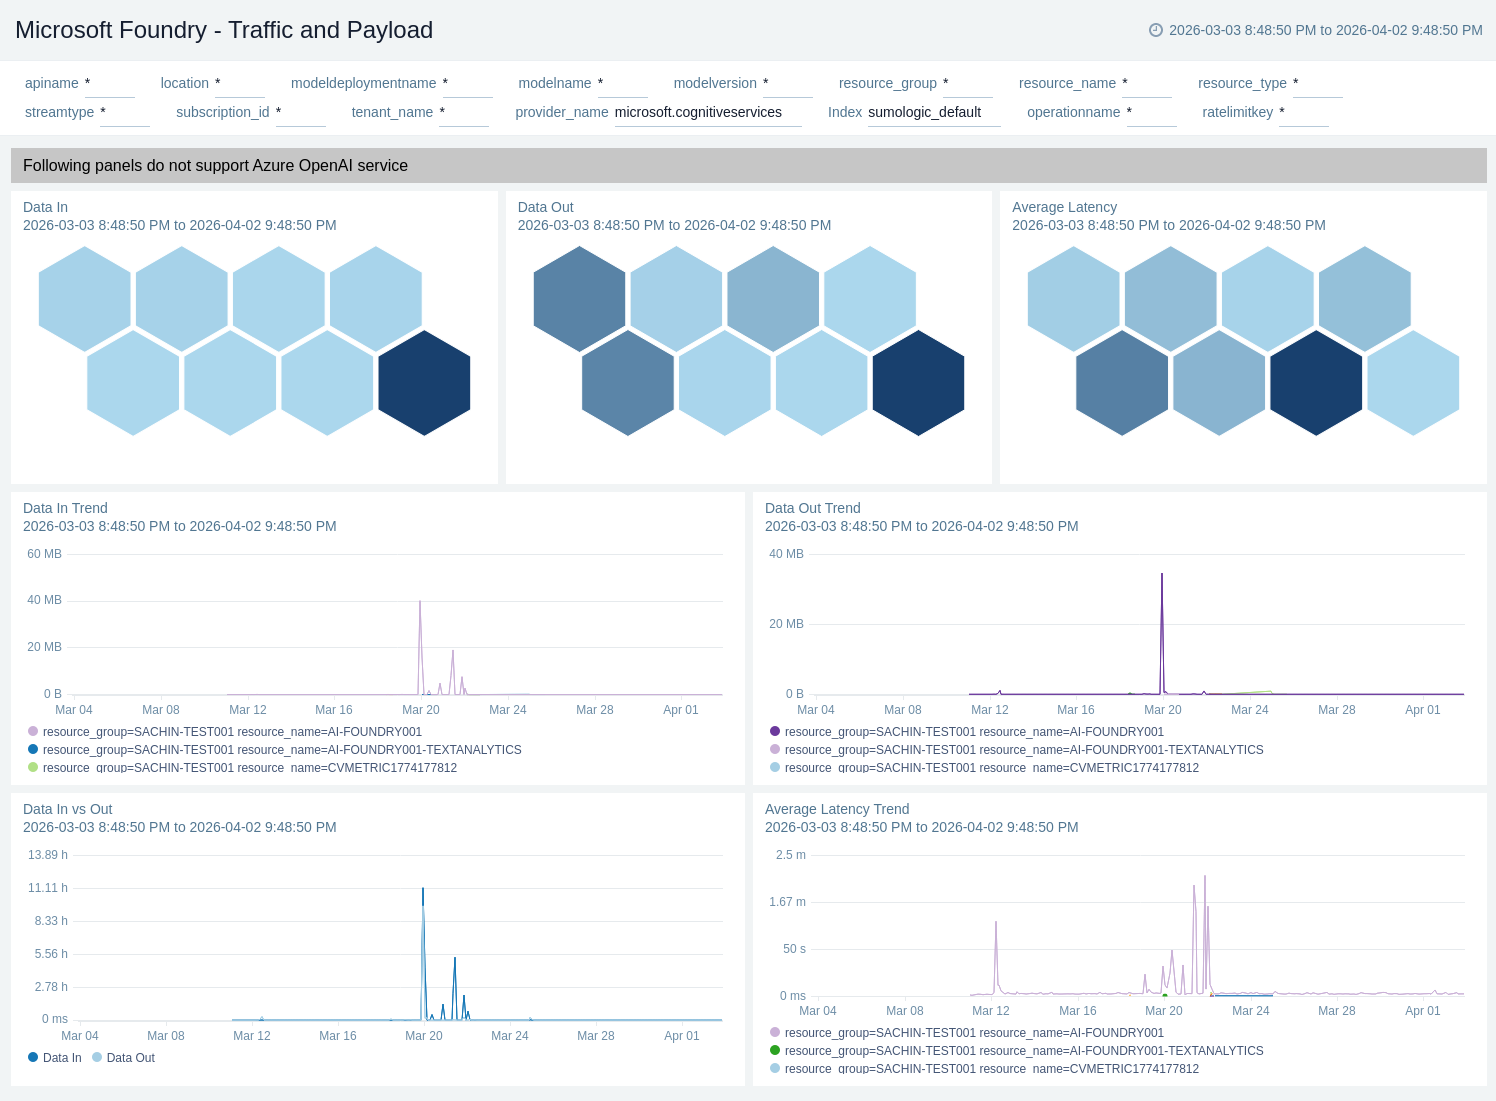
Traffic and Payload
The Microsoft Foundry - Traffic and Payload dashboard provides insights into the data traffic and payload volumes of your Microsoft Foundry service. Panels display information on data in vs out volumes, data ingress and egress trends, average latency, and payload distribution across operations and deployments.
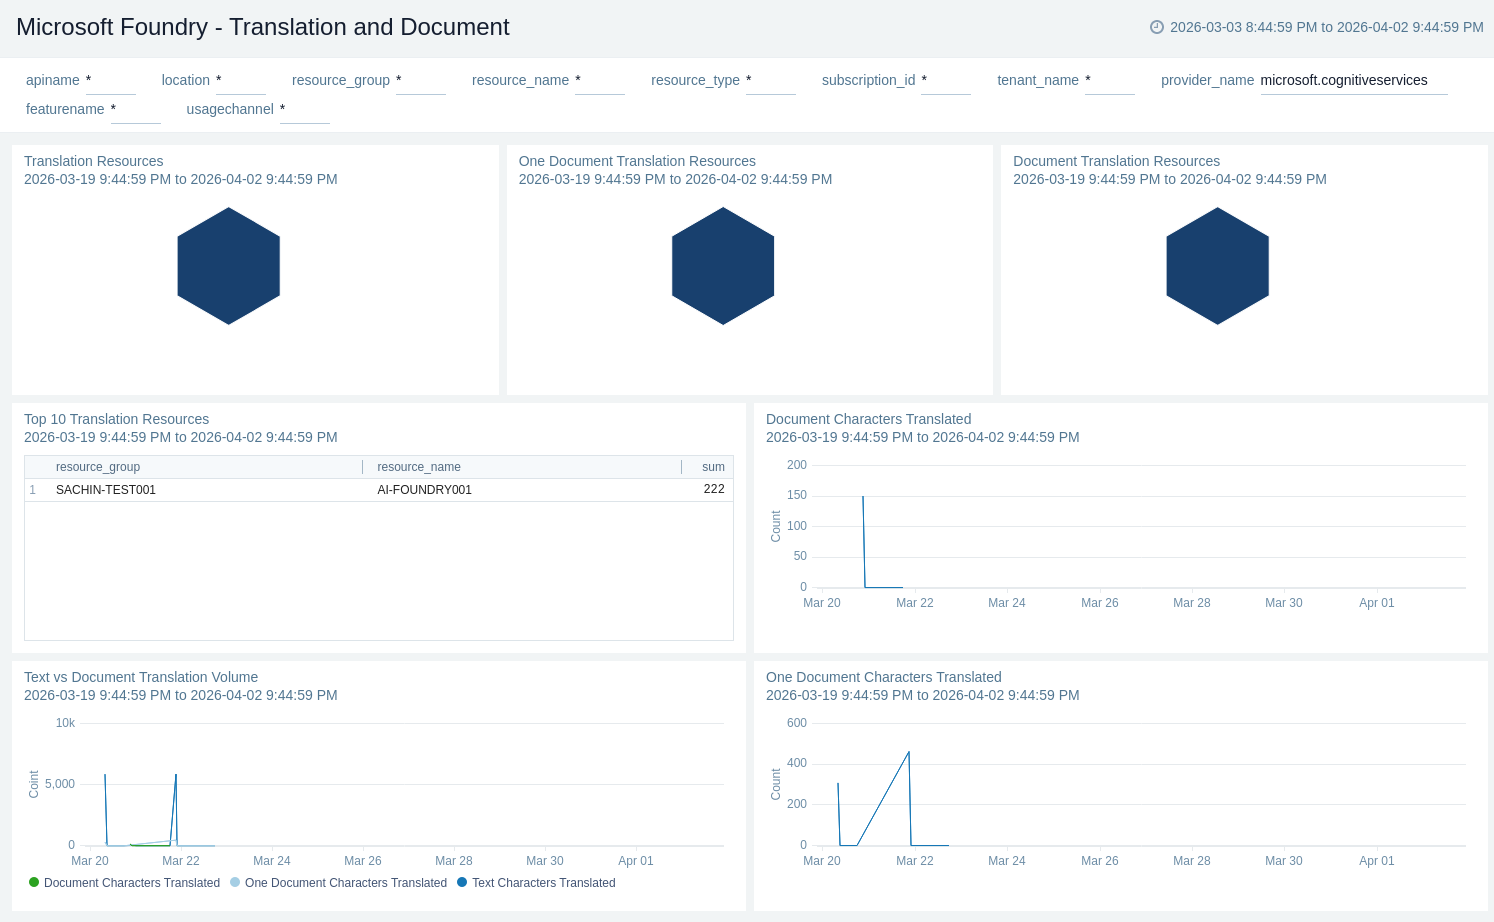
Translation and Document
The Microsoft Foundry - Translation and Document dashboard provides insights into text and document translation workloads within your Microsoft Foundry resources. Panels display information on text characters translated, document characters translated, one-document translation volumes, and translation resource utilization across deployments.
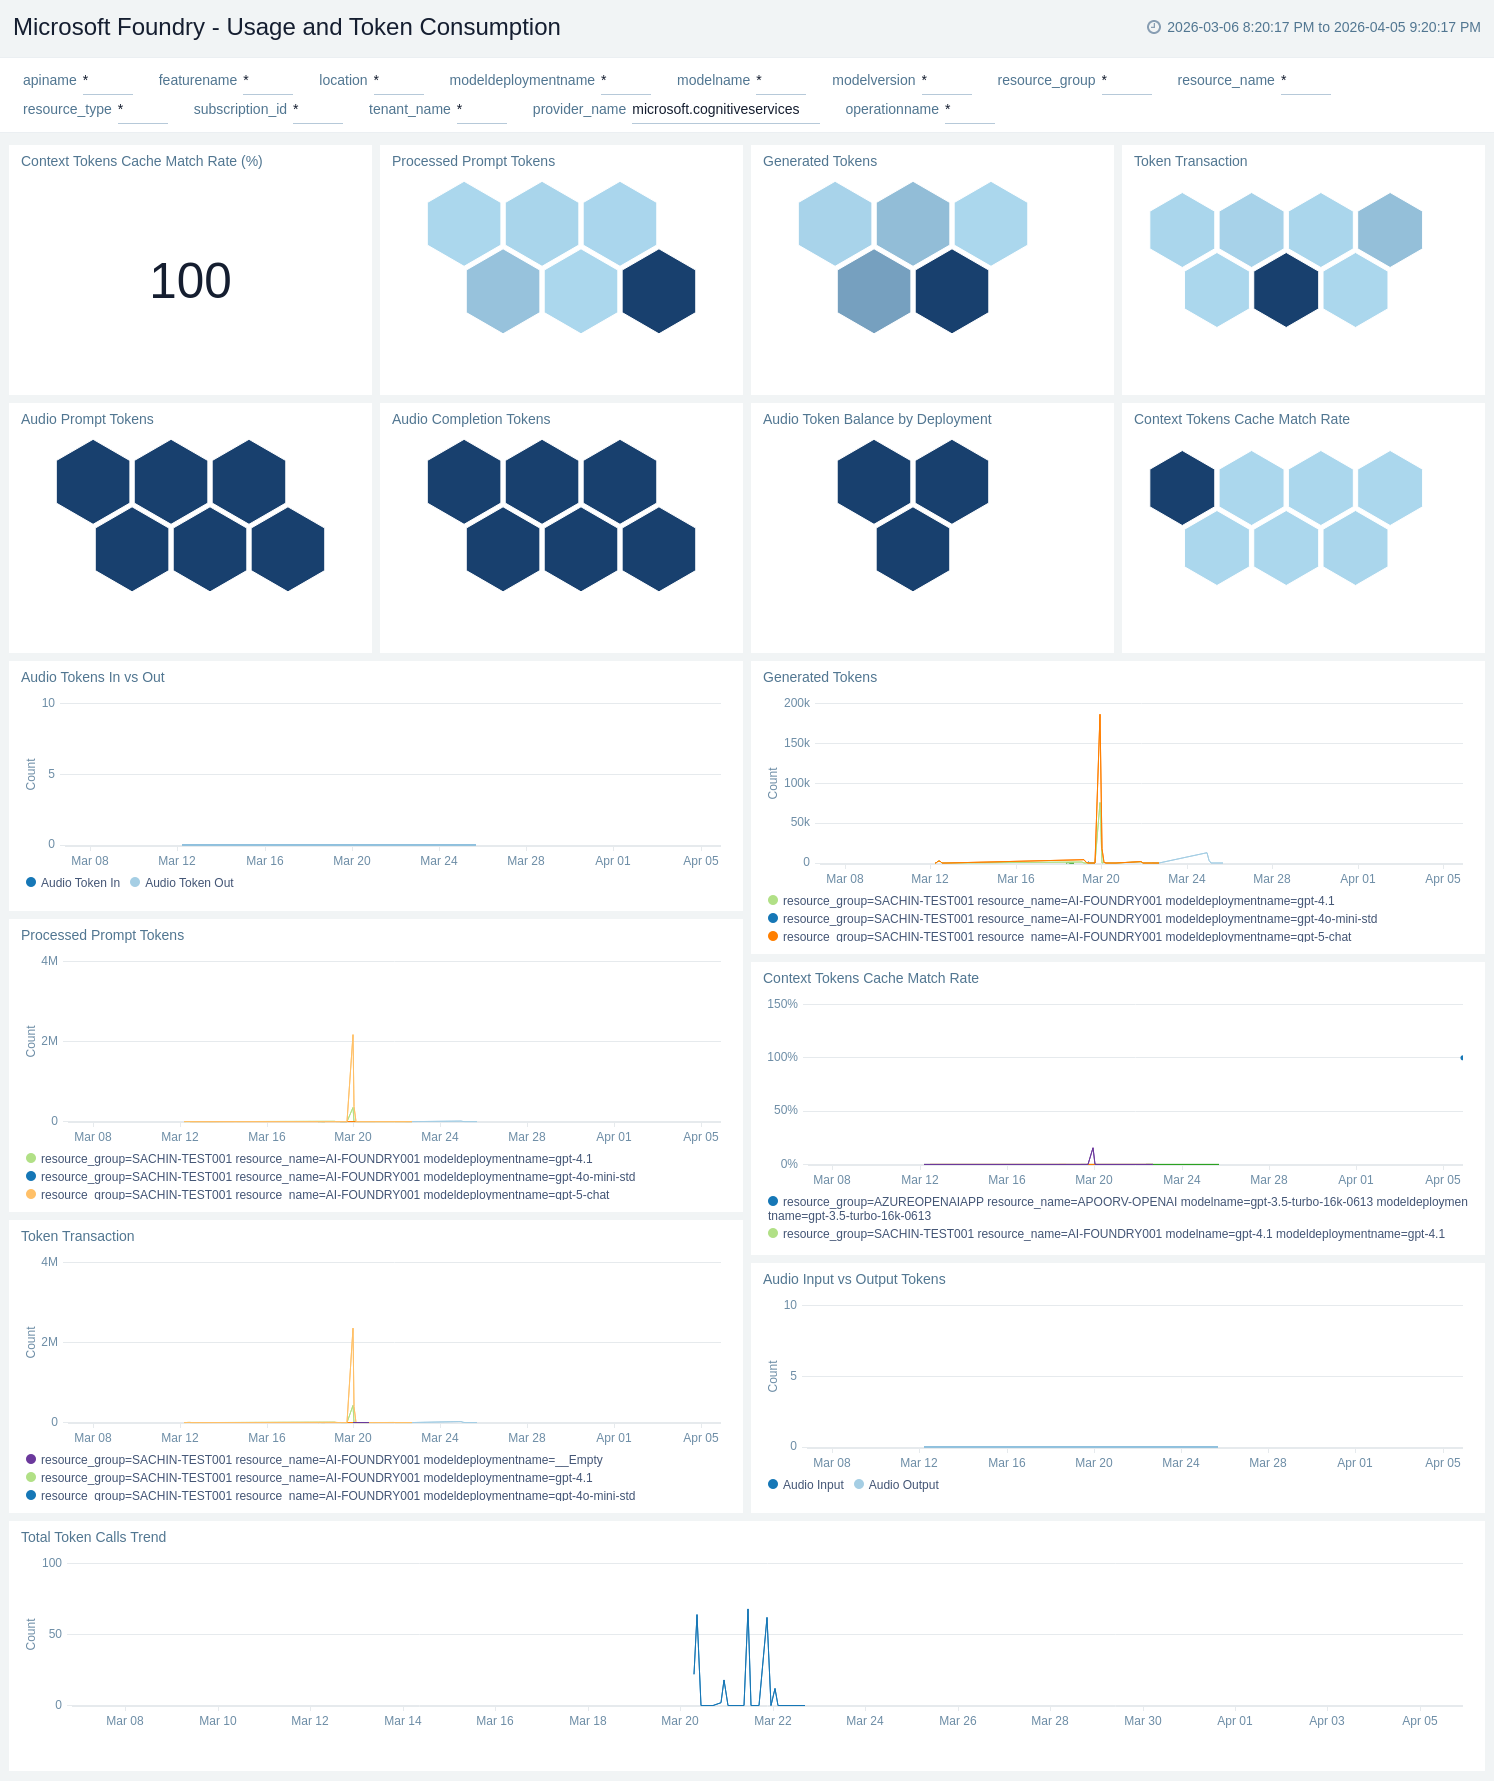
Usage and Token Consumption
The Microsoft Foundry - Usage and Token Consumption dashboard provides insights into model utilization and token consumption across deployments. Panels display information on prompt tokens (input), generated tokens (output), total tokens processed, cache match rates, and workload trends across different models and regions.
Create monitors for Microsoft Foundry
From your App Catalog:
- From the Sumo Logic navigation, select App Catalog.
- In the Search Apps field, search for and then select your app.
- Make sure the app is installed.
- Navigate to What's Included tab and scroll down to the Monitors section.
- Click Create next to the pre-configured monitors. In the create monitors window, adjust the trigger conditions and notifications settings based on your requirements.
- Scroll down to Monitor Details.
- Under Location click on New Folder.
note
By default, monitor will be saved in the root folder. So to make the maintenance easier, create a new folder in the location of your choice.
- Enter Folder Name. Folder Description is optional.
tip
Using app version in the folder name will be helpful to determine the versioning for future updates.
- Click Create. Once the folder is created, click on Save.
Microsoft Foundry alerts
| Alert Name | Alert Description and Conditions | Alert Condition | Recover Condition |
|---|---|---|---|
Microsoft Foundry - Availability | This alert is triggered when the availability of the resource drops below 100%. | Count < 100 | Count >= 100 |
Microsoft Foundry - Azure OpenAI Requests | This alert is triggered when the average Azure OpenAI request count exceeds the threshold. | Count > 1000000 (Warning) / Count > 2000000 (Critical) | Count <= 1000000 (Warning) / Count <= 2000000 (Critical) |
Microsoft Foundry - Latency | This alert is triggered when the average latency exceeds the threshold. | Count > 50000 (Warning) / Count > 60000 (Critical) | Count <= 50000 (Warning) / Count <= 60000 (Critical) |
Microsoft Foundry - Processed Inference Tokens | This alert is triggered when inference token consumption crosses the value of 1000000 tokens. | Count >= 1000000 | Count < 1000000 |
Microsoft Foundry - Total Errors | This alert is triggered when total errors are detected. | Count >= 1 | Count < 1 |
Upgrade/Downgrade the Microsoft Foundry app (optional)
To update the app, do the following:
Next-Gen App: To install or update the app, you must be an account administrator or a user with Manage Apps, Manage Monitors, Manage Fields, Manage Metric Rules, and Manage Collectors capabilities depending upon the different content types part of the app.
- Select App Catalog.
- In the Search Apps field, search for and then select your app.
Optionally, you can identify apps that can be upgraded in the Upgrade available section. - To upgrade the app, select Upgrade from the Manage dropdown.
- If the upgrade does not have any configuration or property changes, you will be redirected to the Preview & Done section.
- If the upgrade has any configuration or property changes, you will be redirected to the Setup Data page.
- In the Configure section of your respective app, complete the following fields.
- Field Name. If you already have collectors and sources set up, select the configured metadata field name (eg _sourcecategory) or specify other custom metadata (eg: _collector) along with its metadata Field Value.
- Click Next. You will be redirected to the Preview & Done section.
Post-update
Your upgraded app will be installed in the Installed Apps folder and dashboard panels will start to fill automatically.
See our Release Notes changelog for new updates in the app.
To revert the app to a previous version, do the following:
- Select App Catalog.
- In the Search Apps field, search for and then select your app.
- To version down the app, select Revert to < previous version of your app > from the Manage dropdown.
Uninstalling the Microsoft Foundry app (optional)
To uninstall the app, do the following:
- Select App Catalog.
- In the 🔎 Search Apps field, run a search for your desired app, then select it.
- Click Uninstall.
Troubleshooting
Metrics collection via Azure Metrics Source
To troubleshoot metrics collection via Azure Metrics Source, follow the instructions in Troubleshooting Azure Metrics Source.