 Meet the new
 Microsoft Office 365

The Microsoft Office 365 App ingests Microsoft Office 365 Audit logs for Azure Active Directory, Exchange, and SharePoint. Preconfigured Dashboards allow you to monitor and analyze your complete Office 365 system for administrator and user activity.
Log types
For information on Microsoft APIs and message types, see Microsoft Office 365 Audit Source.
Sample log messages
{
   "ClientIP":"62.68.137.155",
   "CreationTime":"2017-09-25T22:42:35",
   "Id":"9605876a-1c37-4337-ecbc-08d2409e6e9a",
   "Operation":"FileCopied",
   "OrganizationId":"fa0f55b5-3dac-425b-8e00-c58e5889499c",
   "RecordType":6,
   "UserKey":"i:0h.f|membership|10890000801fe866@live.com",
   "UserType":4,
   "Workload":"SharePoint",
   "ObjectId":"partner.acme.com/shared documents/foo/PurchaseOrder.xls",
   "UserId":"samir@acme.sharepoint.net",
   "EventSource":"SharePoint",
   "ItemType":"Folder",
   "Site":"7520eb33-0a76-4dfc-a56e-a835bb541aa0",
   "UserAgent":"Mozilla/4.0 (compatible; MSIE 7.0; Windows NT 6.3; WOW64; Trident/7.0; .NET4.0E; .NET4.0C; InfoPath.3)",
   "DestinationFileName":"PurchaseOrder.xls",
   "DestinationRelativeUrl":"/my library/",
   "SiteUrl":"partner.acme.com",
   "SourceFileExtension":".xls",
   "SourceFileName":"PurchaseOrder.xls",
   "SourceRelativeUrl":"/shared documents/foo"
}
{
   "CreationTime":"2017-09-25T22:37:35",
   "Id":"0df04c72-d3e1-4016-70ab-09f3333de0ca",
   "Operation":"FolderBind",
   "OrganizationId":"fa0f27b5-3dac-425b-8e00-c58e5889499c",
   "RecordType":2,
   "ResultStatus":"Succeeded",
   "UserKey":"10037FFE8EDD1D69",
   "UserType":2,
   "Workload":"Exchange",
   "UserId":"",
   "ClientIPAddress":"146.139.54.184",
   "ClientInfoString":"Client=WebServices;10.5.2.0ES10;",
   "ExternalAccess":false,
   "InternalLogonType":0,
   "LogonType":1,
   "LogonUserSid":"S-1-5-21-802669544-745651041-3938370137-2862061",
   "MailboxGuid":"6f541602-34c4-4846-9d98-40ce28ff6dc2",
   "MailboxOwnerSid":"S-1-5-21-802669544-745651041-3938370137-2707171",
   "MailboxOwnerUPN":"john@acme.com",
   "OrganizationName":"ACME.com",
   "OriginatingServer":"BLUPR02MB327 (15.02.0396.020)\r\n",
   "Item":{
      "Id":"LgCDEFCvDwkeofbHT4Xu0aodZZIMAQBaMVsTsKq8RIhghXhDomkECDEFAAEUBCEB",
      "ParentFolder":{
         "Id":"LgCDEFCvDwkeofbHT4Xu0aodZZIMAQBaMVsTsKq8RIhghXhDomkECDEFAAEUBCEB",
         "Path":"\\Recoverable Items\\Deletions"
      }
  }
Sample queries
=O365* CreationTime Workload ("\"Workload\":\"SharePoint\"" or "\"Workload\":\"OneDrive\"")
| json "Operation", "Workload"
| where Workload in ("SharePoint", "OneDrive")
| timeslice by 1h
| count _timeslice, operation
| transpose row _timeslice column operation
=O365* Workload Operation "ResultStatus" fail*
| json "Workload", "ResultStatus", "Operation"
| where resultstatus matches "*fail*" or resultstatus matches "*Fail*"
| timeslice 1h
| count _timeslice, workload
| transpose row _timeslice column workload
Collecting logs for the Office 365 App
This section provides instructions for configuring log collection for the Microsoft Office 365 App, as well as providing sample log messages and queries.
To collect logs for the Microsoft Office 365 App, do the following:
- One Hosted Collector.
- One Microsoft Office 365 Audit Source for each content type you want to collect logs for. For example:
- Office 365 Azure AD logs
- Office 365 Exchange logs
- Office 365 SharePoint logs
- Office 365 General logs
- Office 365 Data Loss Prevention (DLP) event logs
For complete details, see Microsoft Office 365 Audit Source.
We recommend the following Source Category naming convention:
- Azure AD. O365/Azure
- Exchange. O365/Exchange
- SharePoint. O365/SharePoint
- General. O365/General
- DLP. O365/DLP
Installing the Microsoft Office 365 app
Now that you have configured Office 365, install the Sumo Logic App for Microsoft Office 365 to leverage preconfigured searches and dashboards for analyzing your data.
To install the app, do the following:
Next-Gen App: To install or update the app, you must be an account administrator or a user with Manage Apps, Manage Monitors, Manage Fields, Manage Metric Rules, and Manage Collectors capabilities depending upon the different content types part of the app.
- Select App Catalog.
- In the 🔎 Search Apps field, run a search for your desired app, then select it.
- Click Install App.
note
Sometimes this button says Add Integration.
- Click Next in the Setup Data section.
- In the Configure section of your respective app, complete the following fields.
- Field Name. If you already have collectors and sources set up, select the configured metadata field name (eg _sourcecategory) or specify other custom metadata (eg: _collector) along with its metadata Field Value.
- Click Next. You will be redirected to the Preview & Done section.
Post-installation
Once your app is installed, it will appear in your Installed Apps folder, and dashboard panels will start to fill automatically.
Each panel slowly fills with data matching the time range query received since the panel was created. Results will not immediately be available but will be updated with full graphs and charts over time.
Viewing Microsoft Office 365 dashboards
All dashboards have a set of filters that you can apply to the entire dashboard. Use these filters to drill down and examine the data to a granular level.
- You can change the time range for a dashboard or panel by selecting a predefined interval from a drop-down list, choosing a recently used time range, or specifying custom dates and times. Learn more.
- You can use template variables to drill down and examine the data on a granular level. For more information, see Filtering Dashboards with Template Variables.
- Most Next-Gen apps allow you to provide the scope at the installation time and are comprised of a key (
_sourceCategoryby default) and a default value for this key. Based on your input, the app dashboards will be parameterized with a dashboard variable, allowing you to change the dataset queried by all panels. This eliminates the need to create multiple copies of the same dashboard with different queries.
Overview
Shows details of successful and failed Office 365 activities, as well as SharePoint, Exchange, and Azure operations.
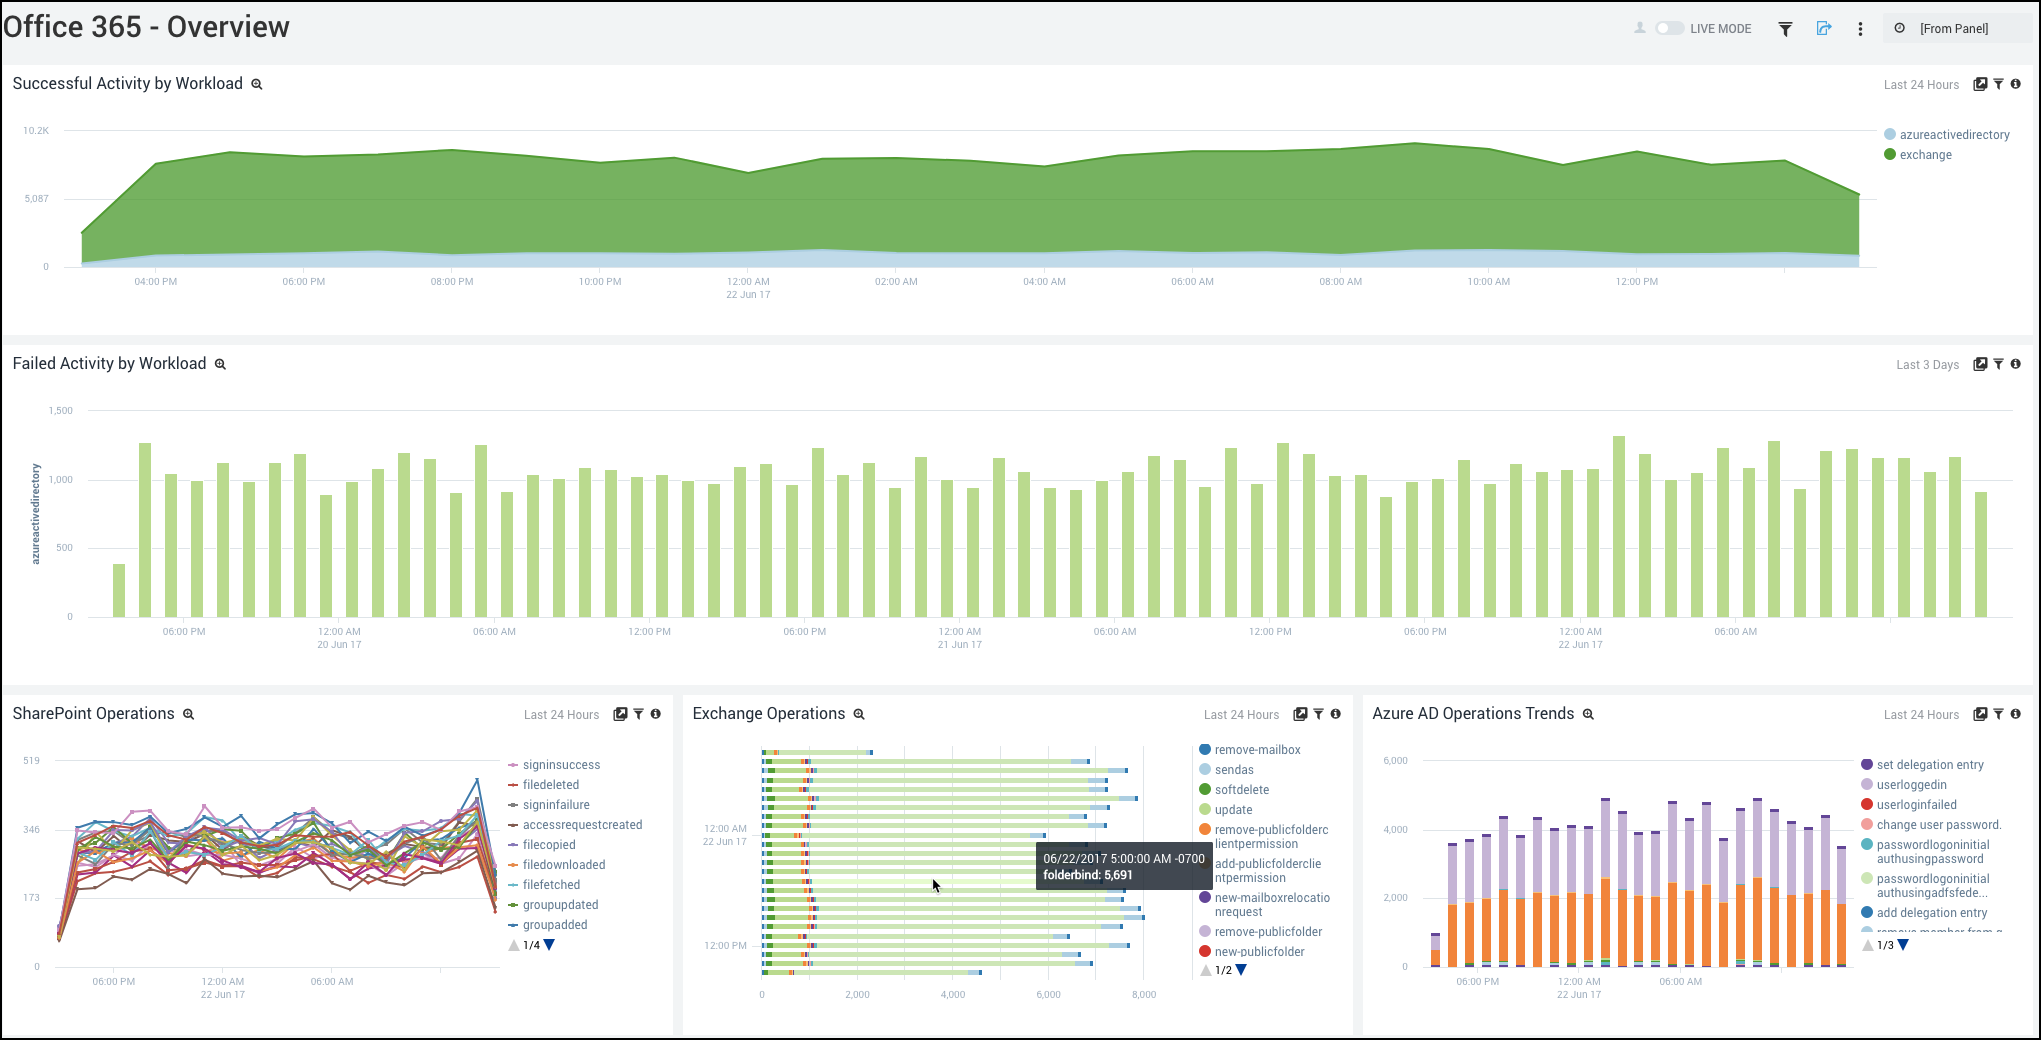
Successful Activity by Workload. Compare your overall Office 365 workload activity by service as an area chart on a timeline for the last 24 hours.
Failed Activity by Workload. See any failed activity by Office 365 workload as a column chart on a timeline for the last three days.
SharePoint Operations. See a line chart of all SharePoint operations by name for the last 24 hours.
Exchange Operations. See the Exchange operations activity by name and count on a stacked bar chart for the last 24 hours.
Azure AD Operations Trends. See the Azure AD operations activity by action and count as a stacked column chart on a timeline for the last 24 hours.
General
Usage by Location
Shows Office 365, Azure Active Directory, Exchange, SharePoint, and OneDrive transactions by location.
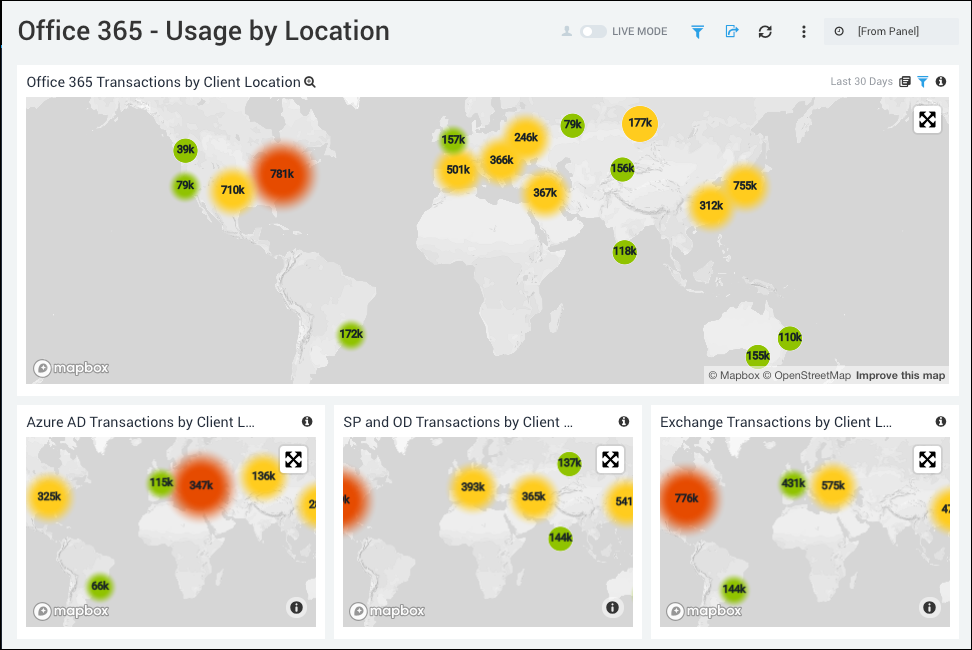
Office 365 Transactions by Client Location. Performs a geo lookup and displays Office 365 transactions by client location on a world map for the last 30 days.
Azure AD Transactions by Client Location. Performs a geo lookup and provides Azure AD transactions by client location on a world map for the last 30 days.
SP and OD Transactions by Client Location. Performs a geo lookup and displays SharePoint and OneDrive transactions by client location on a world map for the last 30 days.
Exchange Transactions by Client Location. Performs a geo lookup and displays Exchange transactions by client location on a world map for the last 30 days.
Azure Active Directory
Active Directory - Login Locations
Shows the failed and successful logins by location.
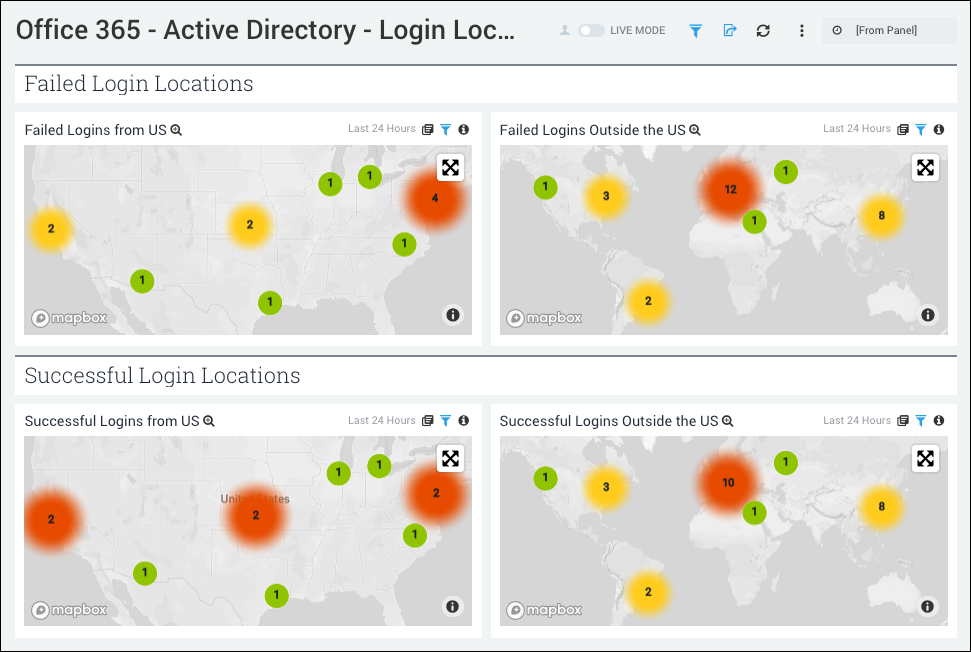
Failed Logins from the US. See the US map showing failed logins in the last 24 hours.
Failed Logins Outside the US. See the world map showing failed logins in the last 24 hours.
Successful Logins from the US. See the US map showing successful logins in the last 24 hours.
Successful Logins Outside the US. See the world map showing successful logins in the last 24 hours.
Active Directory - Login Monitoring
Shows details such as count, client IP, and errors for failed and successful logins.
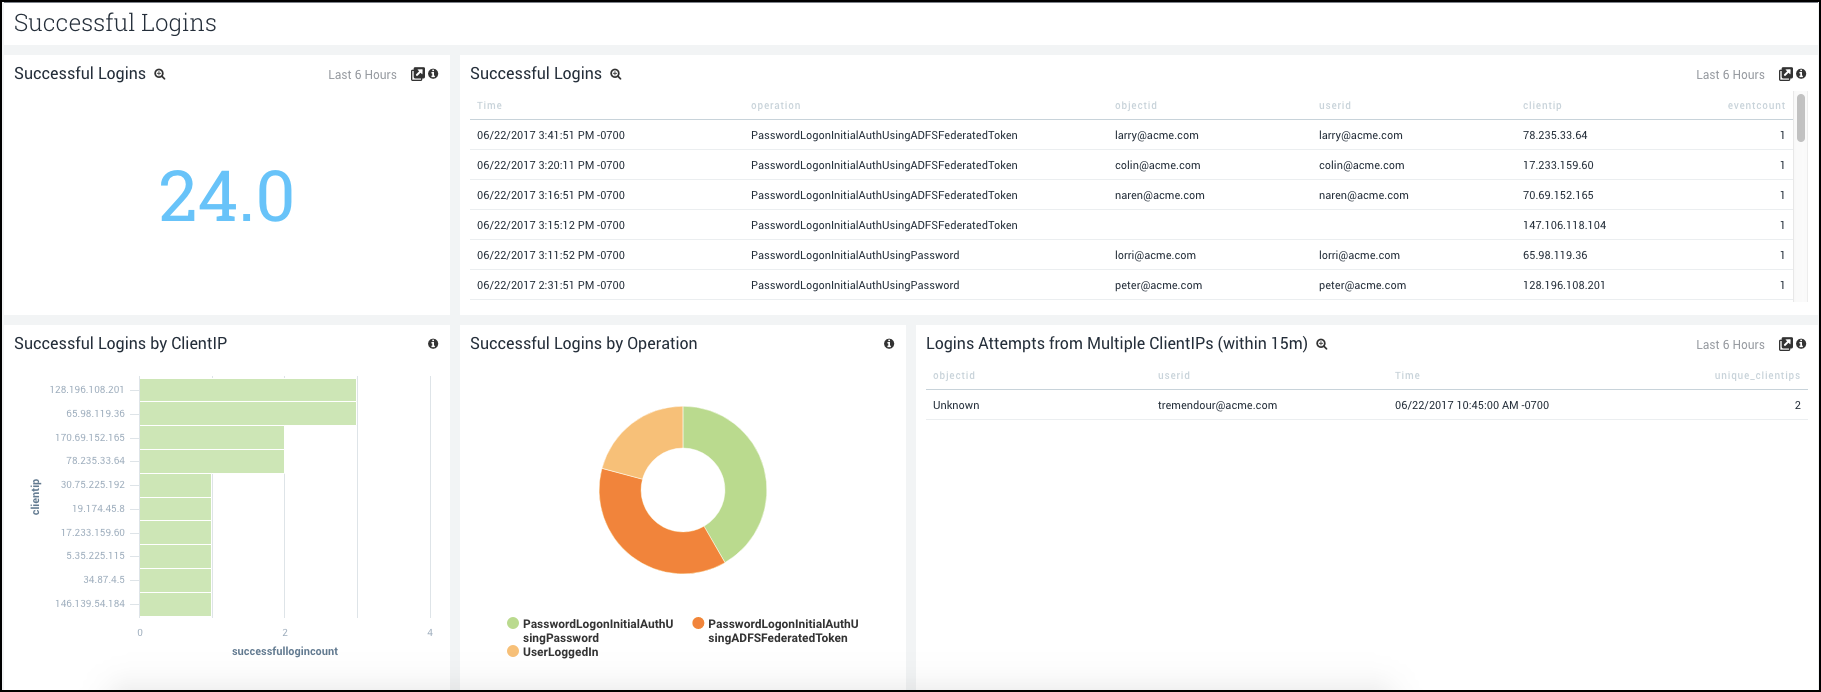
Successful Logins. See the count of successful logins in the last 6 hours.
Successful Logins. See a table with details of successful logins, including time, operation, object ID, User ID, Client IP, and event count for the last 6 hours.
Successful Logins by ClientIP. See a bar chart showing successful logins by Client IP and count over the last 6 hours.
Successful Logins by Operation. See a pie chart with the operations that resulted in successful logins in the last 6 hours.
Logins Attempts from Multiple Client IPs (within 15m). See a table of login attempts from multiple Client IPs within 15 minutes, including object ID, user ID, time, and the count of unique client IPs.
Failed Logins
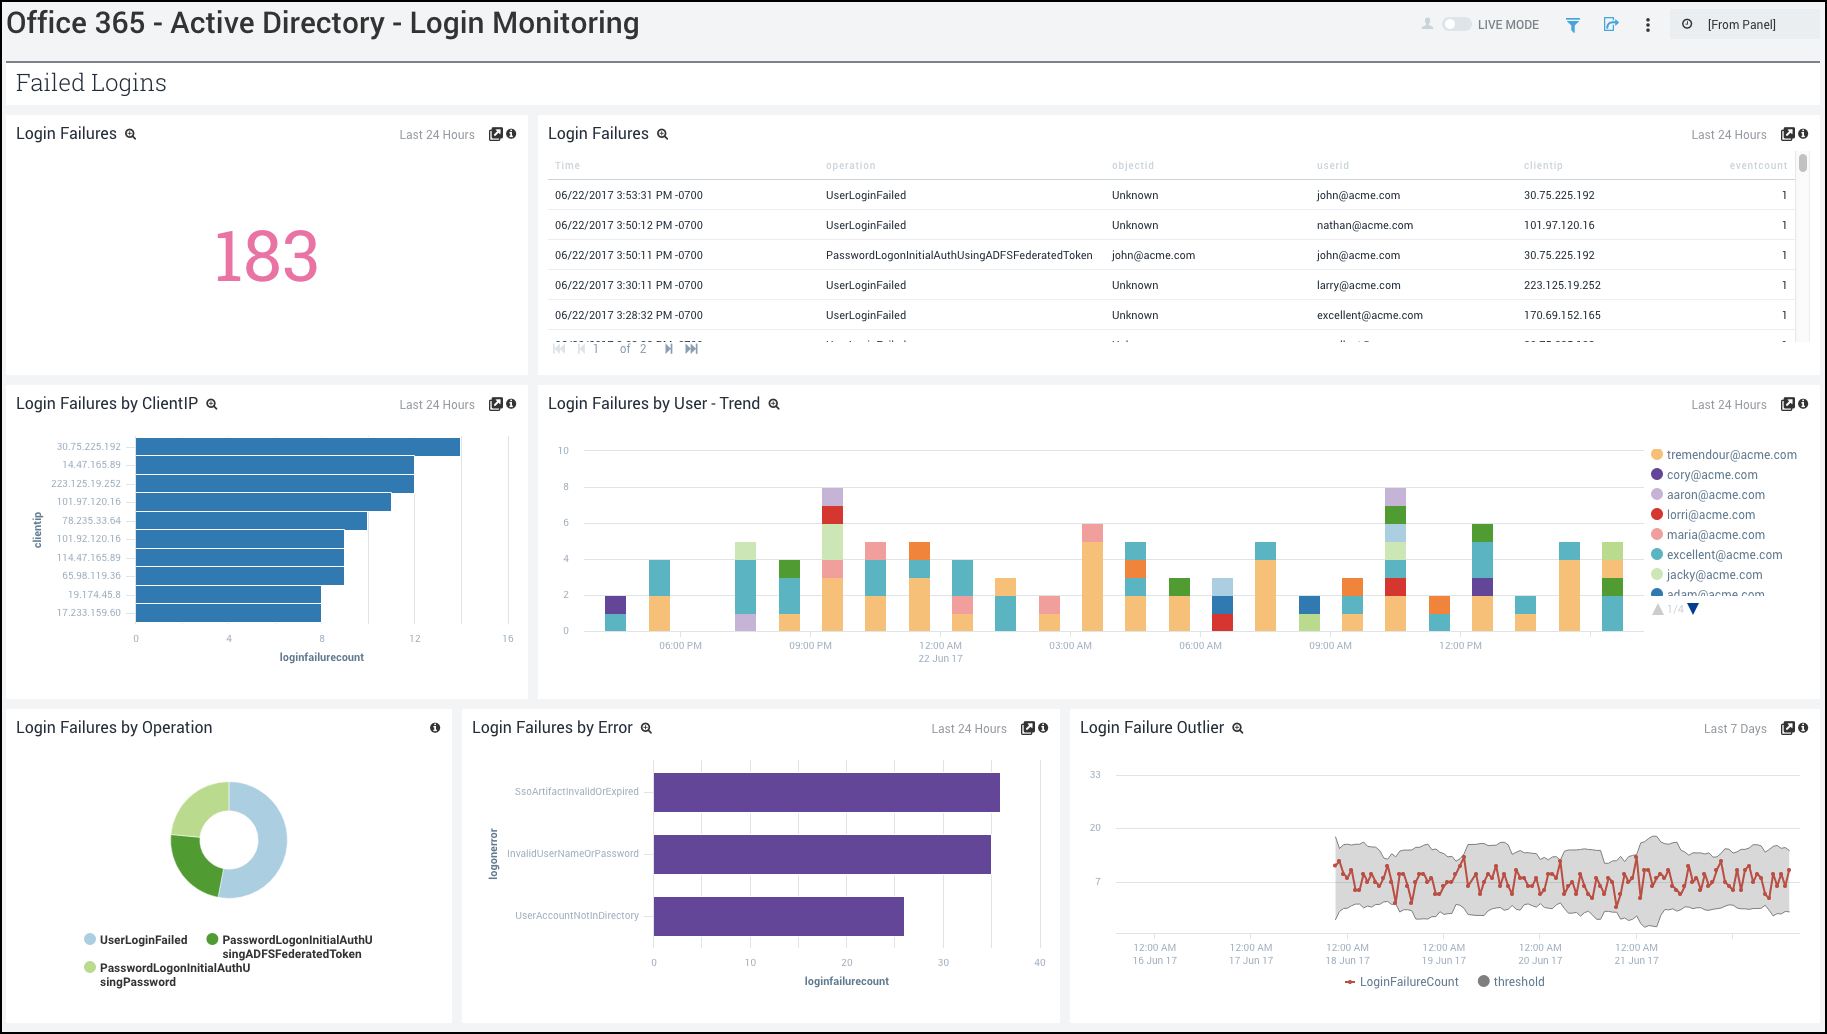
Login Failures. See the count of login failures in the last 24 hours.
Login Failures. See a table of login failures, including time, operation, object ID, User ID, Client IP, and event count for the last 24 hours.
Login Failures by Client IP. See a bar chart showing login failures by Client IP and count over the last 24 hours.
Login Failures by User - Trend. See a stacked bar chart with the count of login failures per user every hour over the last 24 hours.
Login Failures by Operation. See a pie chart with the operations that caused login failures in the last 24 hours.
Login Failures by Error. See a bar chart of login failures over the last 24 hours, with counts.
Login Failure Outlier. See a line chart of login failure counts by hour over the last 7 days, along with the threshold values.
Active Directory - User, Account Monitoring
Shows details of Added and Deleted Users, Password Resets and Changes, and Added or Removed Members from Group.
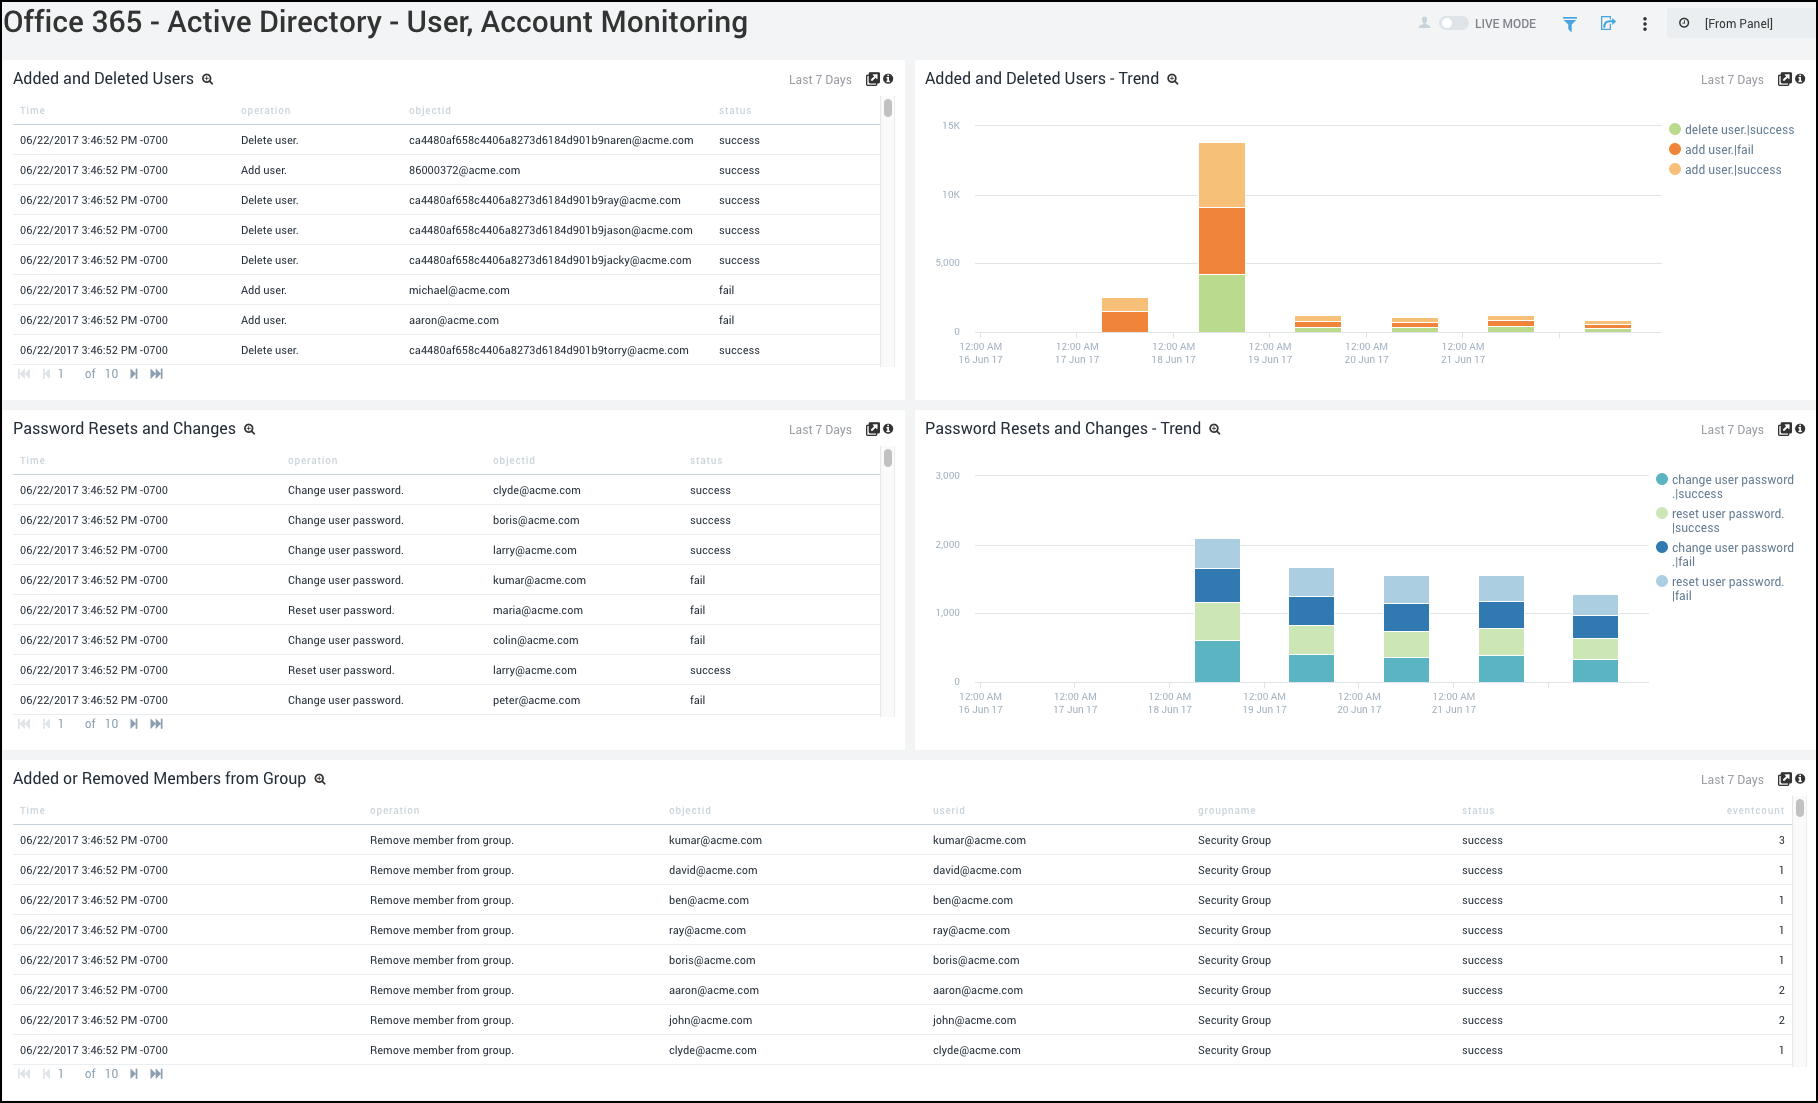
Added and Deleted Users. See a table detailing added and deleted users in the last 7 days, including time, operation, object ID, and status.
Added and Deleted Users - Trend. See a stacked column chart showing the counts of delete and add user operations, along with their success/failure statuses, over the last 7 days.
Password Resets and Changes. See a table of password change and reset operations, along with the time, object ID, and status, for the last 7 days.
Password Resets and Changes - Trend. See a stacked column chart showing the counts of password reset and change operations, along with their success/failure statuses, over the last 7 days.
Added or Removed Members from Group. See a table with the details of member addition and removal from a group, such as the time, object ID, user ID, group name, status, and event count, for the last 7 days.
Active Directory Activity
Shows details such as admin activity, transactions by client location, operations, client IPs, and failed activity over time.
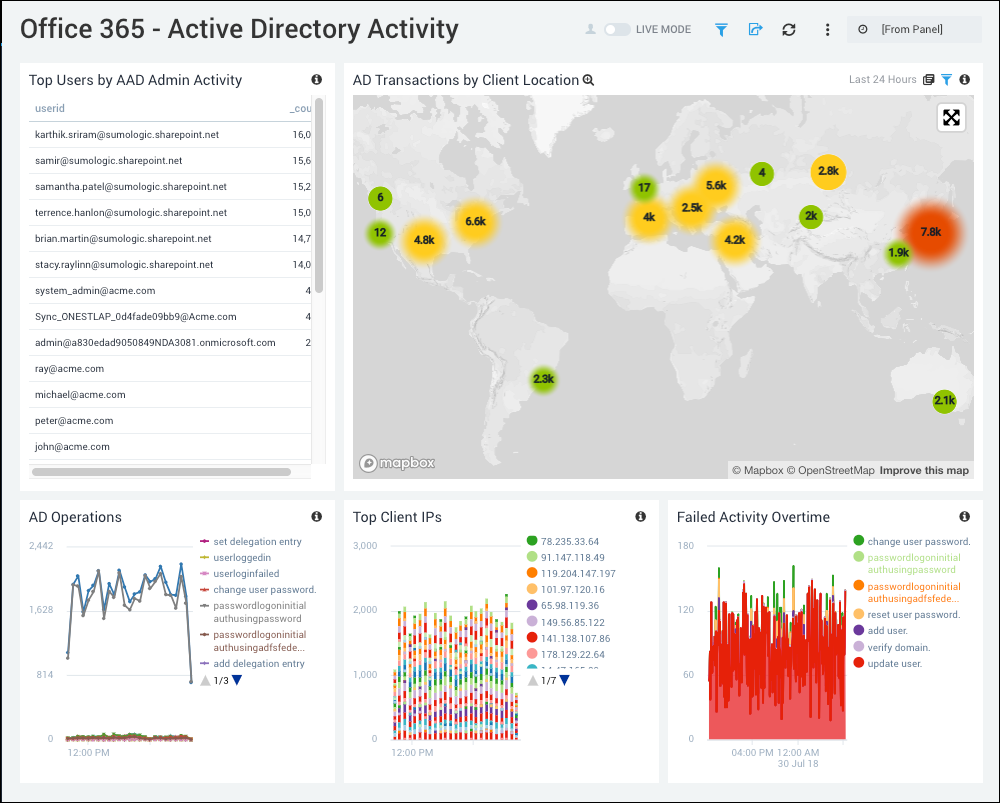
Top Users by AAD Admin Activity. See the top users by Azure AD administrator activity in a table chart, including user ID and count for the last 24 hours.
AD Transactions by Client Location. Uses a geo lookup operation to display AD transactions by client location on a world map for the last 24 hours.
AD Operations. See the AD operations activities by name and count as a line chart on a timeline for the last 24 hours.
Top Client IPs. See the details on the top client IP address in a stacked column chart on a timeline for the last 24 hours.
Failed Activity Over Time. See failed activities on an area chart over the last 24 hours.
Exchange
Exchange - Admin Audit
Shows details of operations, user types, and configuration changes in Exchange.
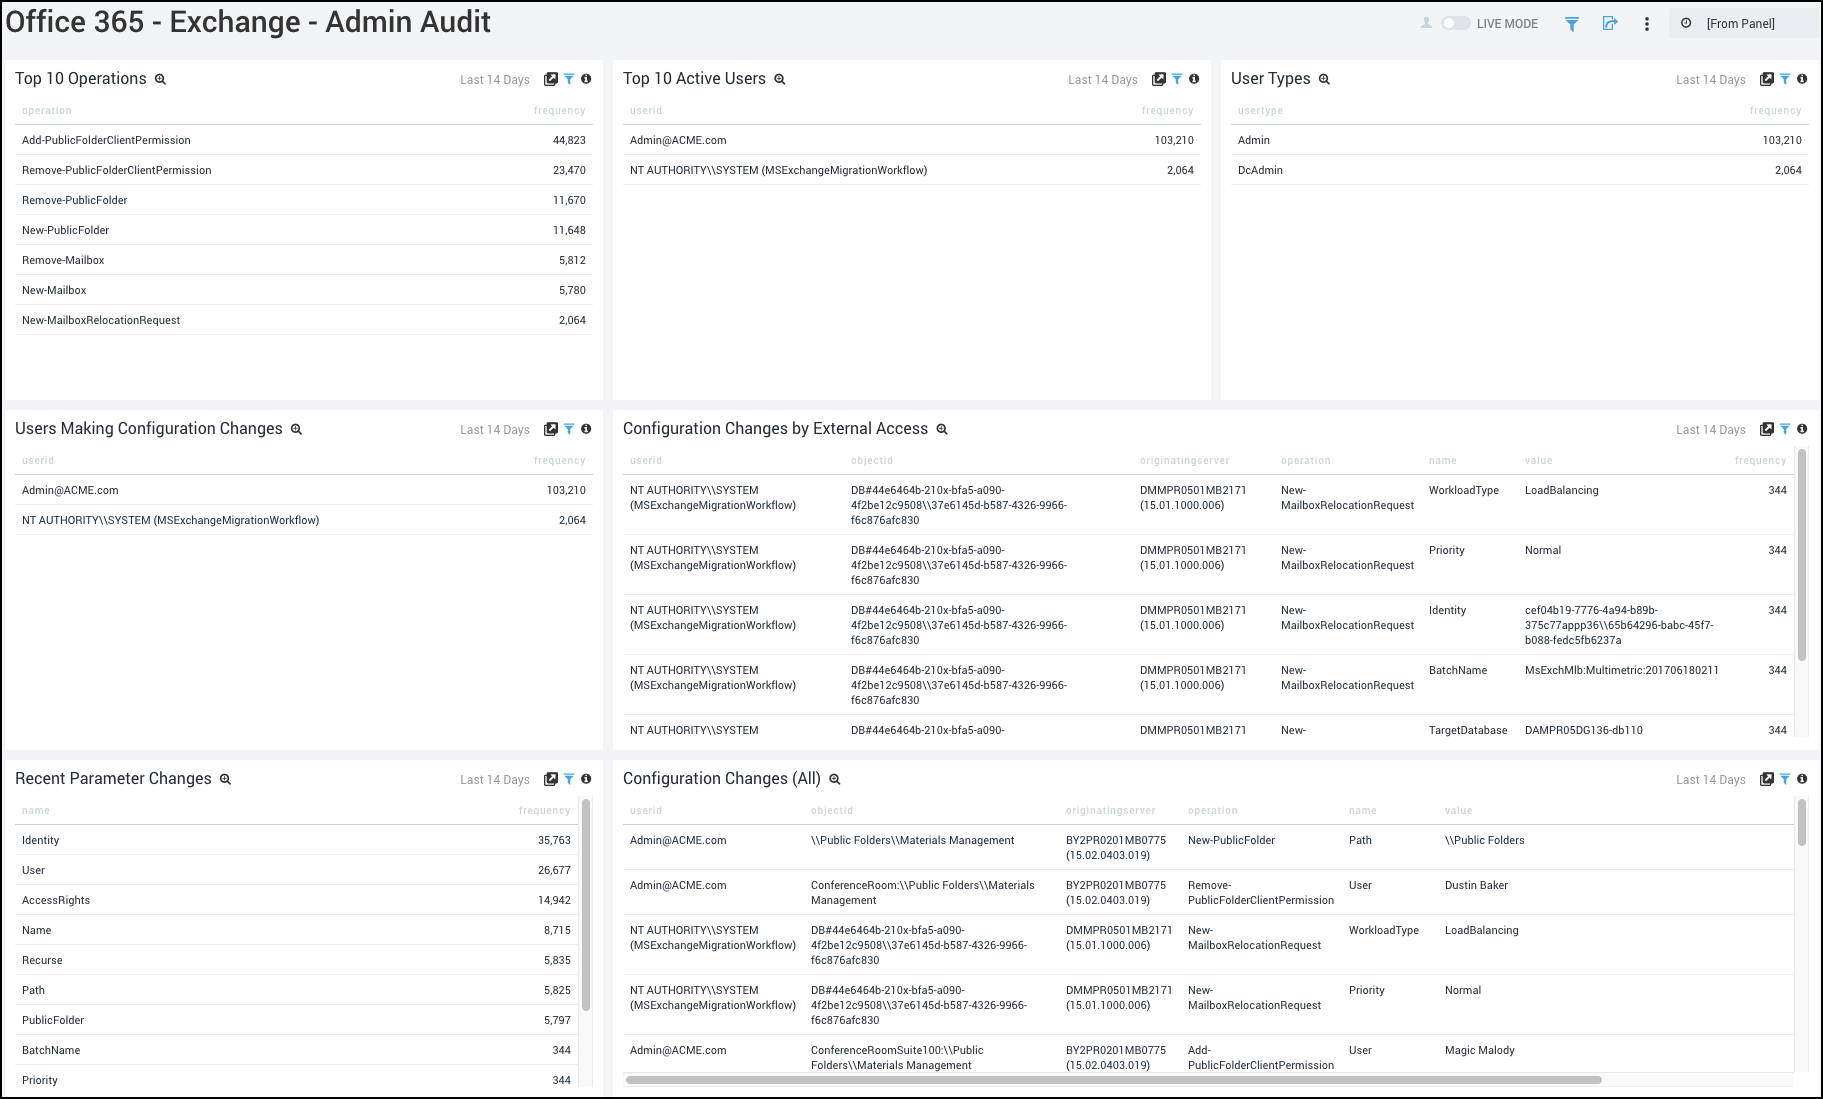
Top 10 Operations. See the top 10 operations in a table chart, including details on each operation and its frequency for the last 14 days.
Top 10 Active Users. See the top 10 active users in a table chart, including user ID and frequency for the last 14 days.
User Types. See the user type information in a table chart, including details on each user type and its frequency for the last 14 days.
Users Making Configuration Changes. See all users making configuration changes in a table chart, including user ID and frequency over the last 14 days.
Configuration Changes by External Access. See a table detailing the configuration changes made via external access, including user ID, object ID, originating server, operation, name, value, and frequency for the last 14 days.
Recent Parameter Changes. See the details of recent parameter changes in a table, including the name and frequency for the last 14 days.
Configuration Changes (All). See the details of all configuration changes in a table, including user ID, object ID, originating server, operation, name, value, and frequency for the last 14 days.
Exchange - Group Audit
Shows the active users, operations, folders, and recent activities.
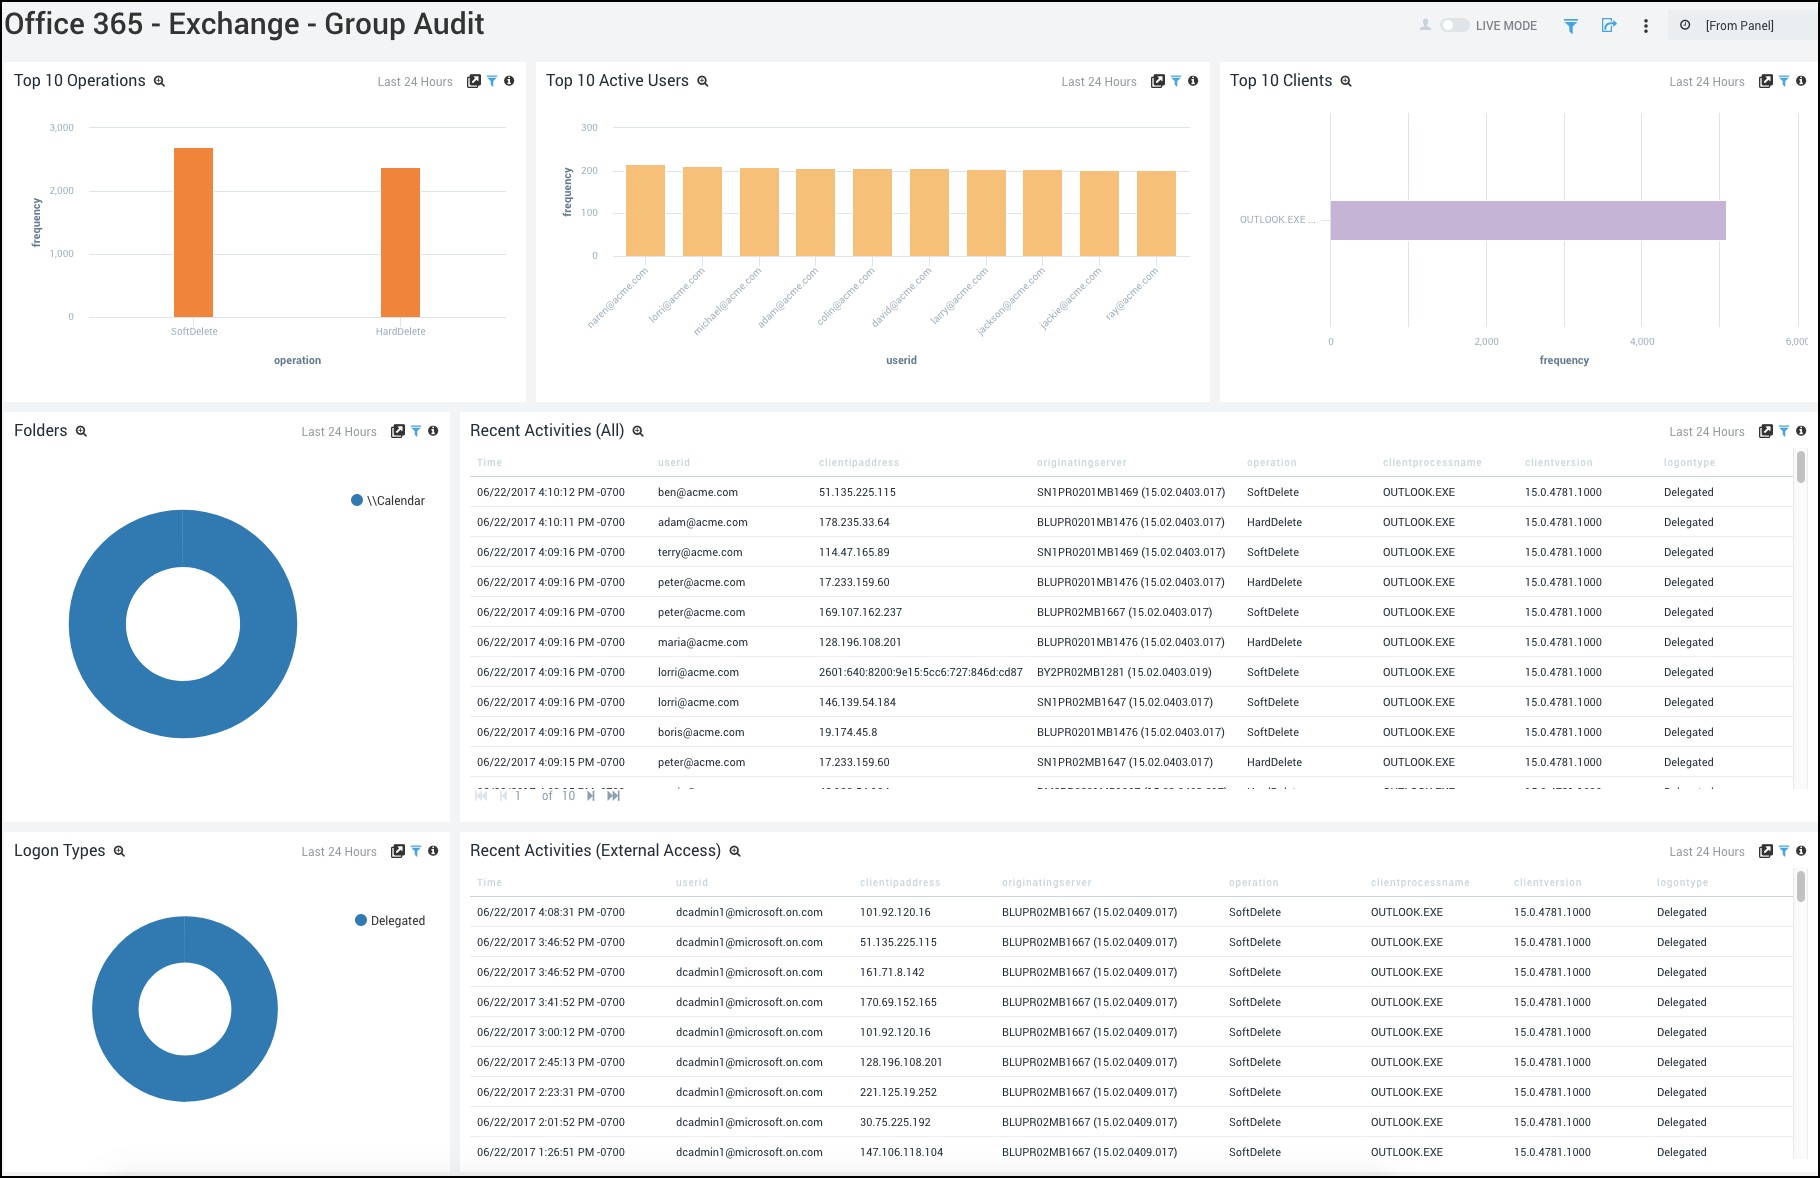
Top 10 Operations. See the top 10 operations by name and frequency in a column chart for the last six hours.
Top 10 Active Users. See the top 10 active users by user ID and frequency in a column chart for the last six hours.
Top 10 Clients. See the details on the top 10 clients by name and frequency in a bar chart for the last six hours.
Folders. See the folders accessed in a pie chart for the last six hours.
Recent Activities (All). See all recent activity in a table chart including details on time, user ID, client IP address, originating server, operation, client process name, client version, and logon type for the last six hours.
Logon Types. See information on logon types in a pie chart for the last six hours.
Recent Activities (External Access). See a table of details for recent activities via external access, including time, user ID, client IP, originating server, operation, client process name, client version, and logon type.
Exchange - Mailbox Audit
Shows details on users, operations, IPs, clients, logon types, and external access.
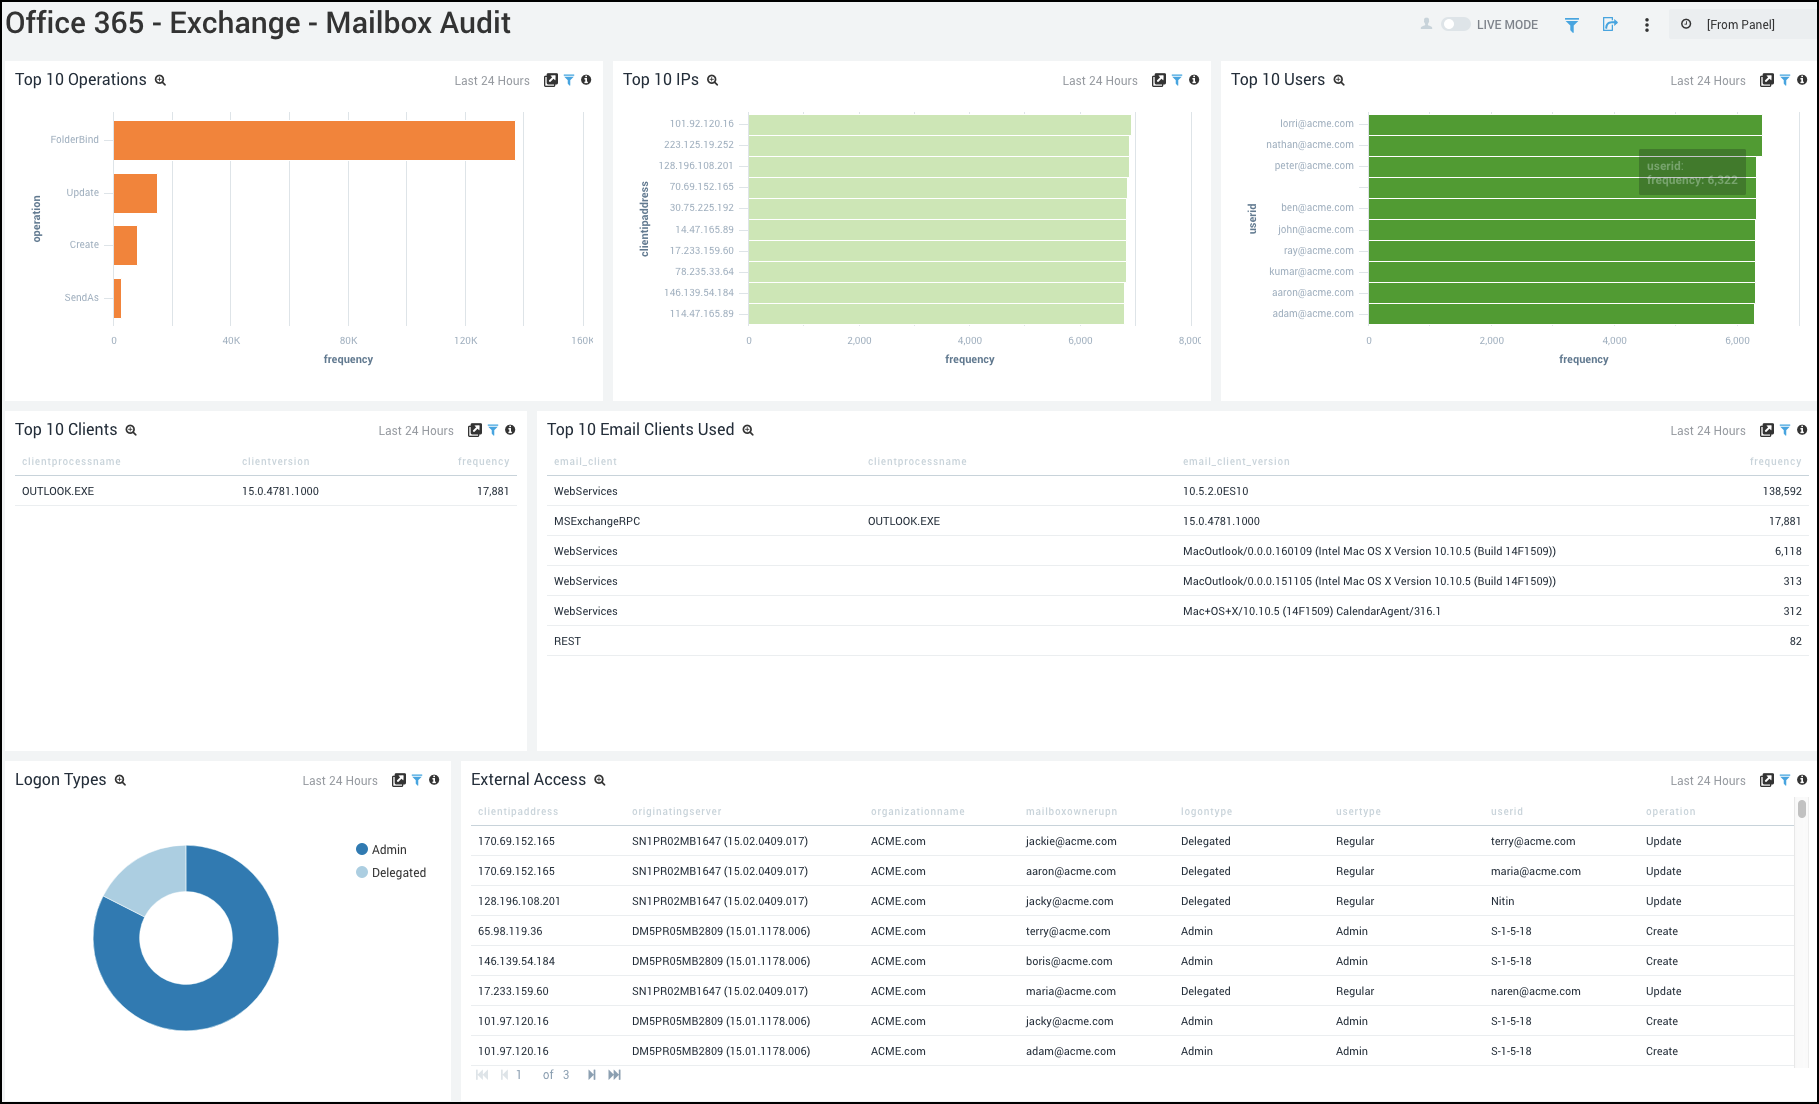
Top 10 Operations. See the top 10 operations by operation name and frequency in a bar chart for the last 24 hours.
Top 10 IPs. See the top 10 IP addresses by IP and frequency in a bar chart for the last 24 hours.
Top 10 Users. See the details on the top 10 users by user ID and frequency in a bar chart for the last 24 hours.
Top 10 Clients. See the top 10 clients accessed in a table, including details on the client process name, client version, and frequency over the last 24 hours.
Top 10 Email Clients Used. See information on the top 10 email clients used in a table, including details on each client, version, and frequency for the last 24 hours.
Logon Types. See logon types in a pie chart for the last 24 hours.
External Access. See a table with details on external access such as client IP address, originating server, Organization name, Mailbox owner UPN, logon type, user type, user ID, and operation.
Exchange - Mailbox Audit - Client Locations
Shows the clients by location and over time.
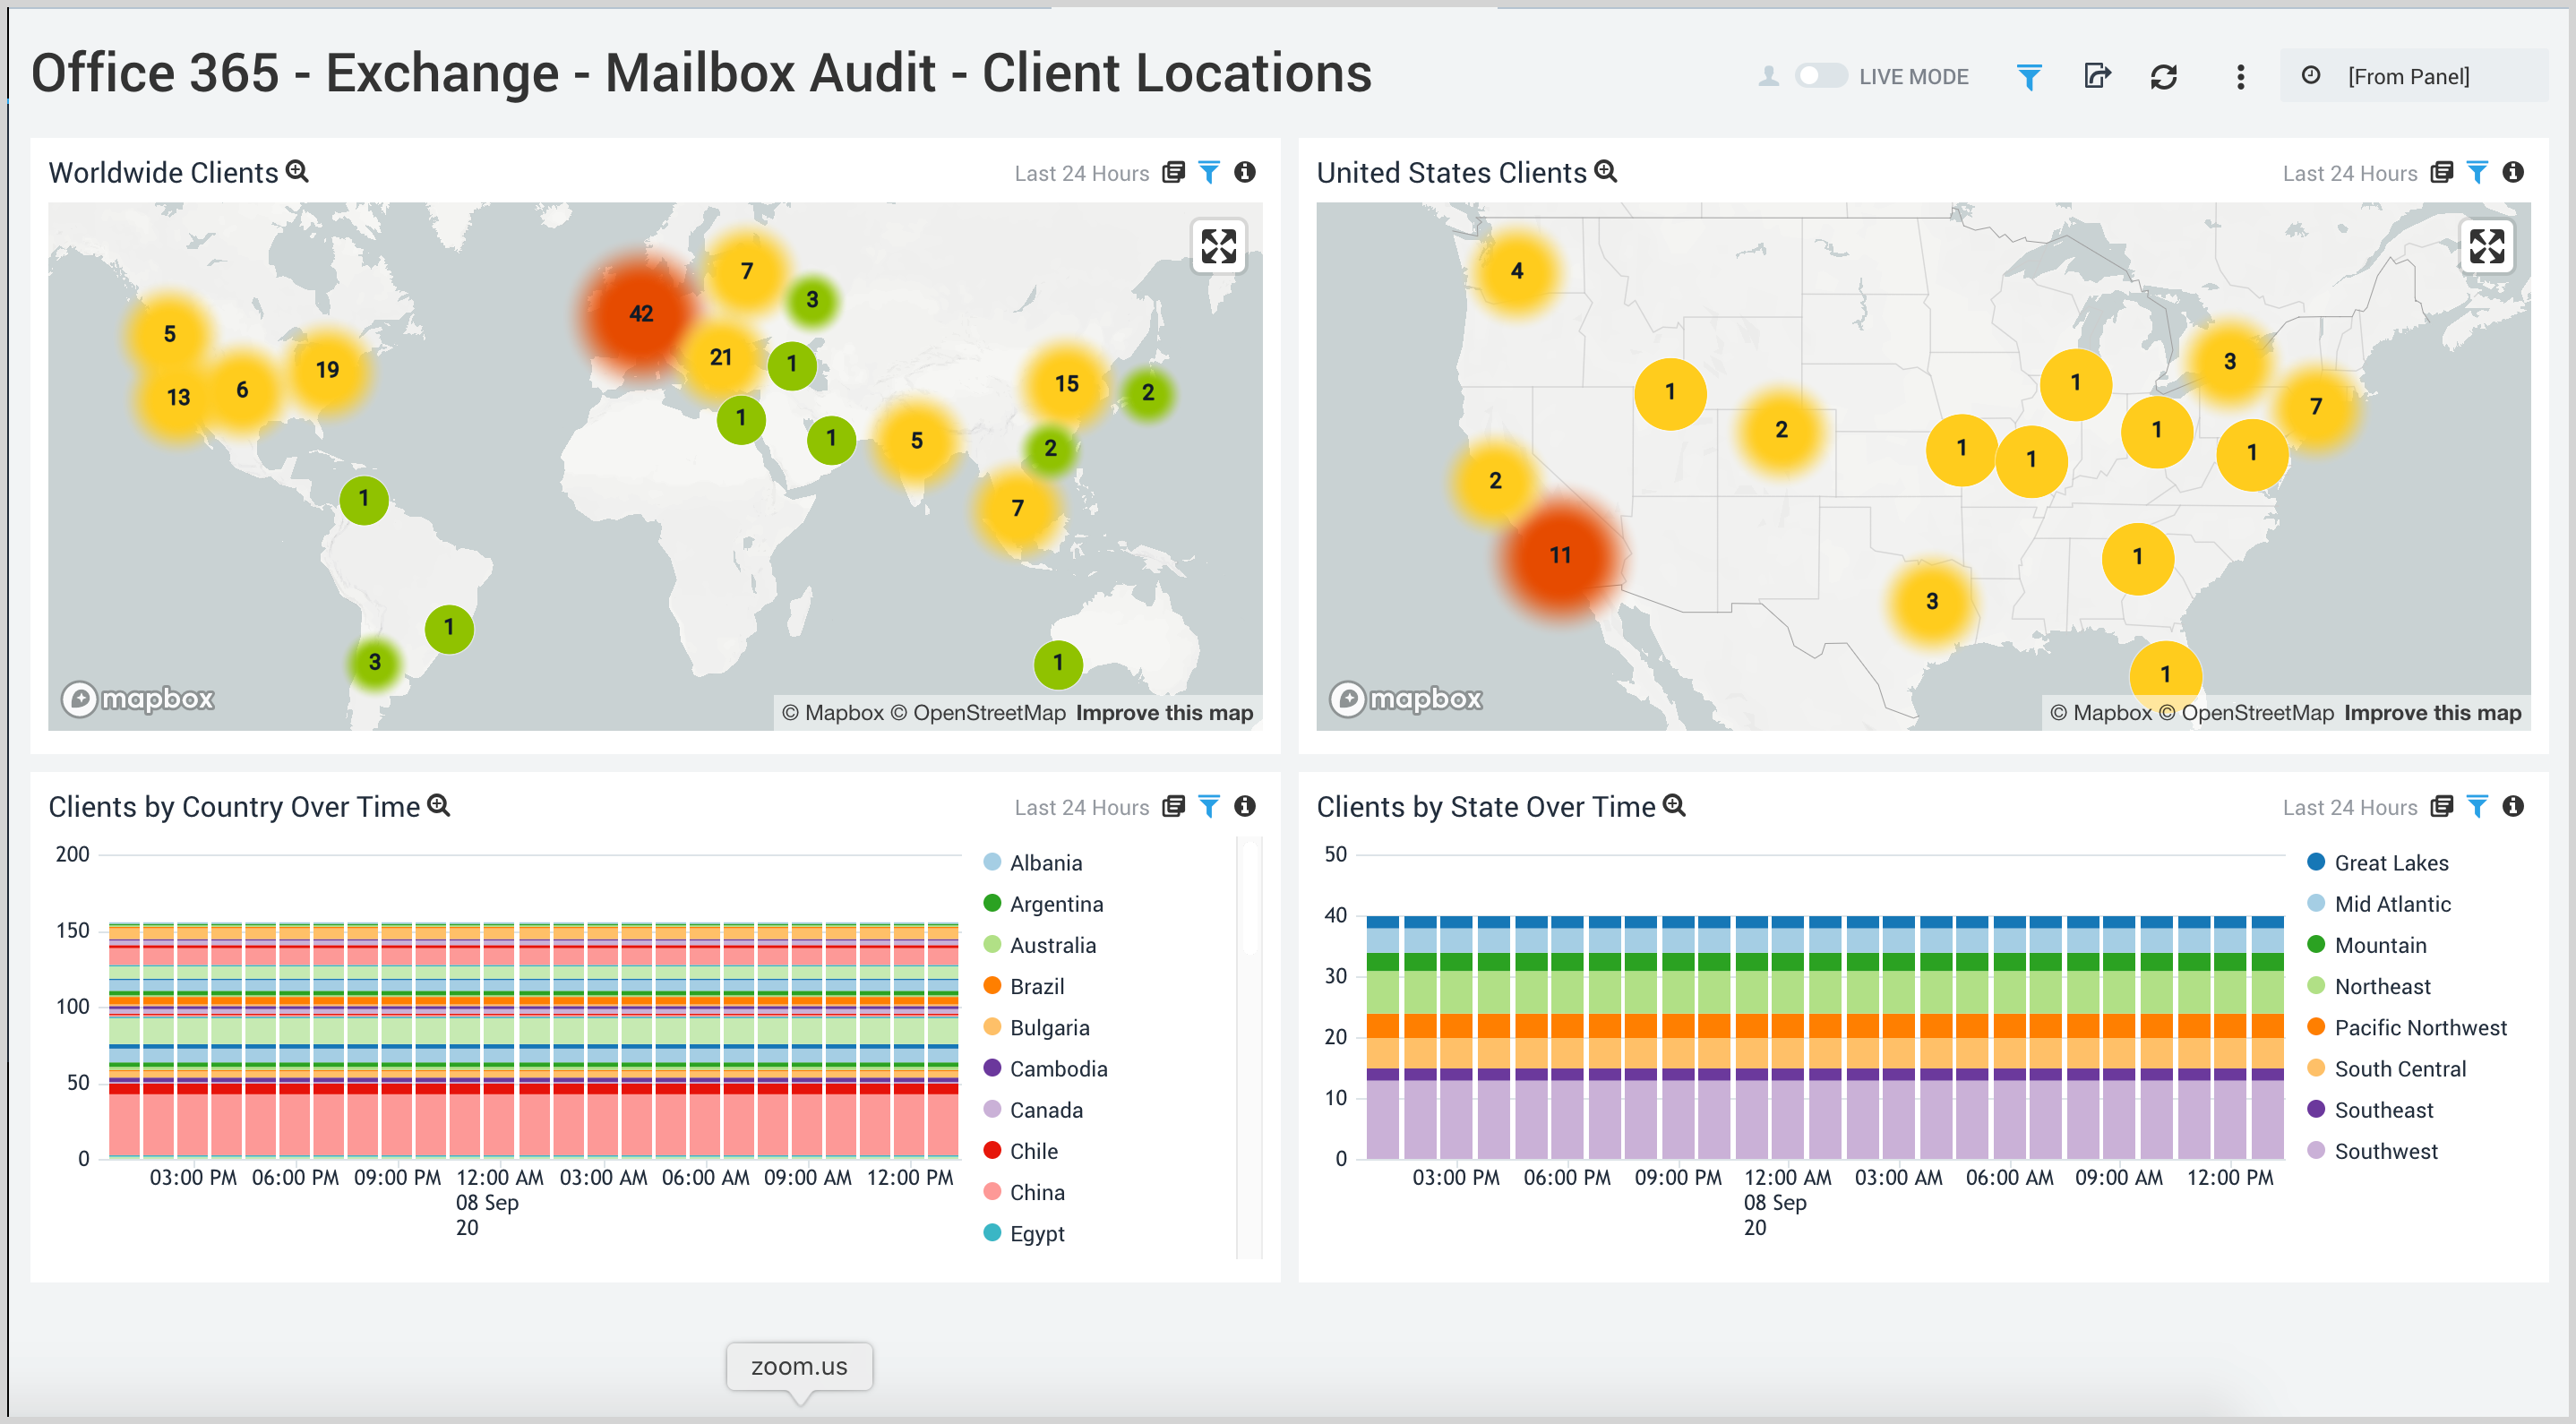
Worldwide Clients. Performs a geo lookup to display worldwide client IP addresses on a world map for the last 24 hours.
United States Clients. Performs a geo lookup to display United States client IP addresses on a world map for the last 24 hours.
Clients by Country Over Time. See clients by country in a stacked column chart on a timeline for the last 24 hours.
Clients by State Over Time. See clients by state in a stacked column chart on a timeline for the last 24 hours.
SharePoint
SharePoint - Content Insight
Shows details of URLs accessed, downloaded, uploaded, viewed, checked in, and checked out content.
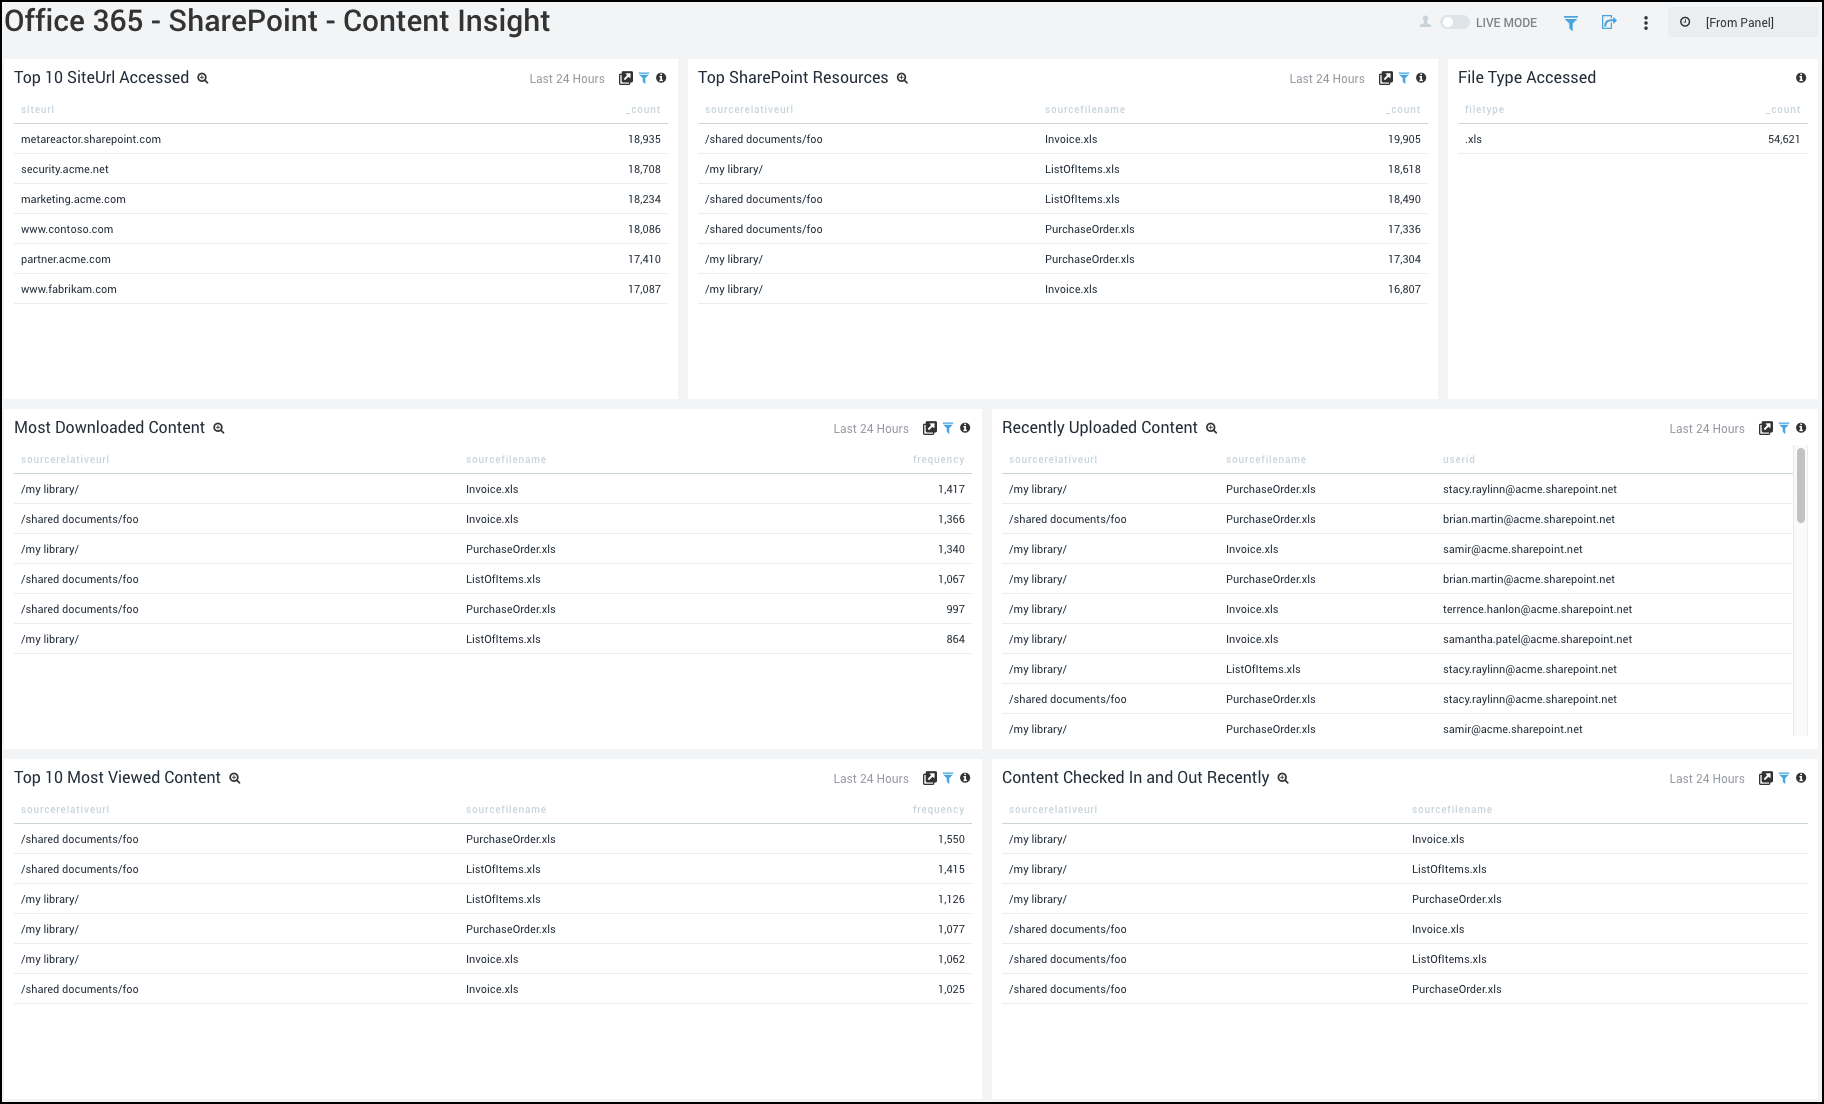
Top 10 SiteUrls Accessed. See the top 10 SiteUrls accessed in a table, including details on each SiteUrl and its count for the last 24 hours.
Top SharePoint Resources. See the top SharePoint resources accessed in a table chart, including details on the source relative URL, source file name, and count for the last 24 hours.
File Type Accessed. See the file type breakdown in a table, including the file type and count for the last 24 hours.
Most Downloaded Contents. See the most-downloaded content in a table, including details on the source relative URL, source file name, and frequency for the last 24 hours.
Recently Uploaded Contents. See the recently uploaded content in a table chart, including details on the source relative URL, source file name, and user ID for the last 24 hours.
Top 10 Most-Viewed Content. See the top 10 most-viewed content in a table chart, including source relative URL, source file name, and frequency for the last 24 hours.
Contents CheckedIn-CheckedOut Recently. See the information on content that was checked in and checked out recently in a table, including details on the source relative URL and source file name for the last 24 hours.
SharePoint - Shared Content Non-Domain Activities
Shows details of non-domain users' accesses, uploads, downloads, and views.
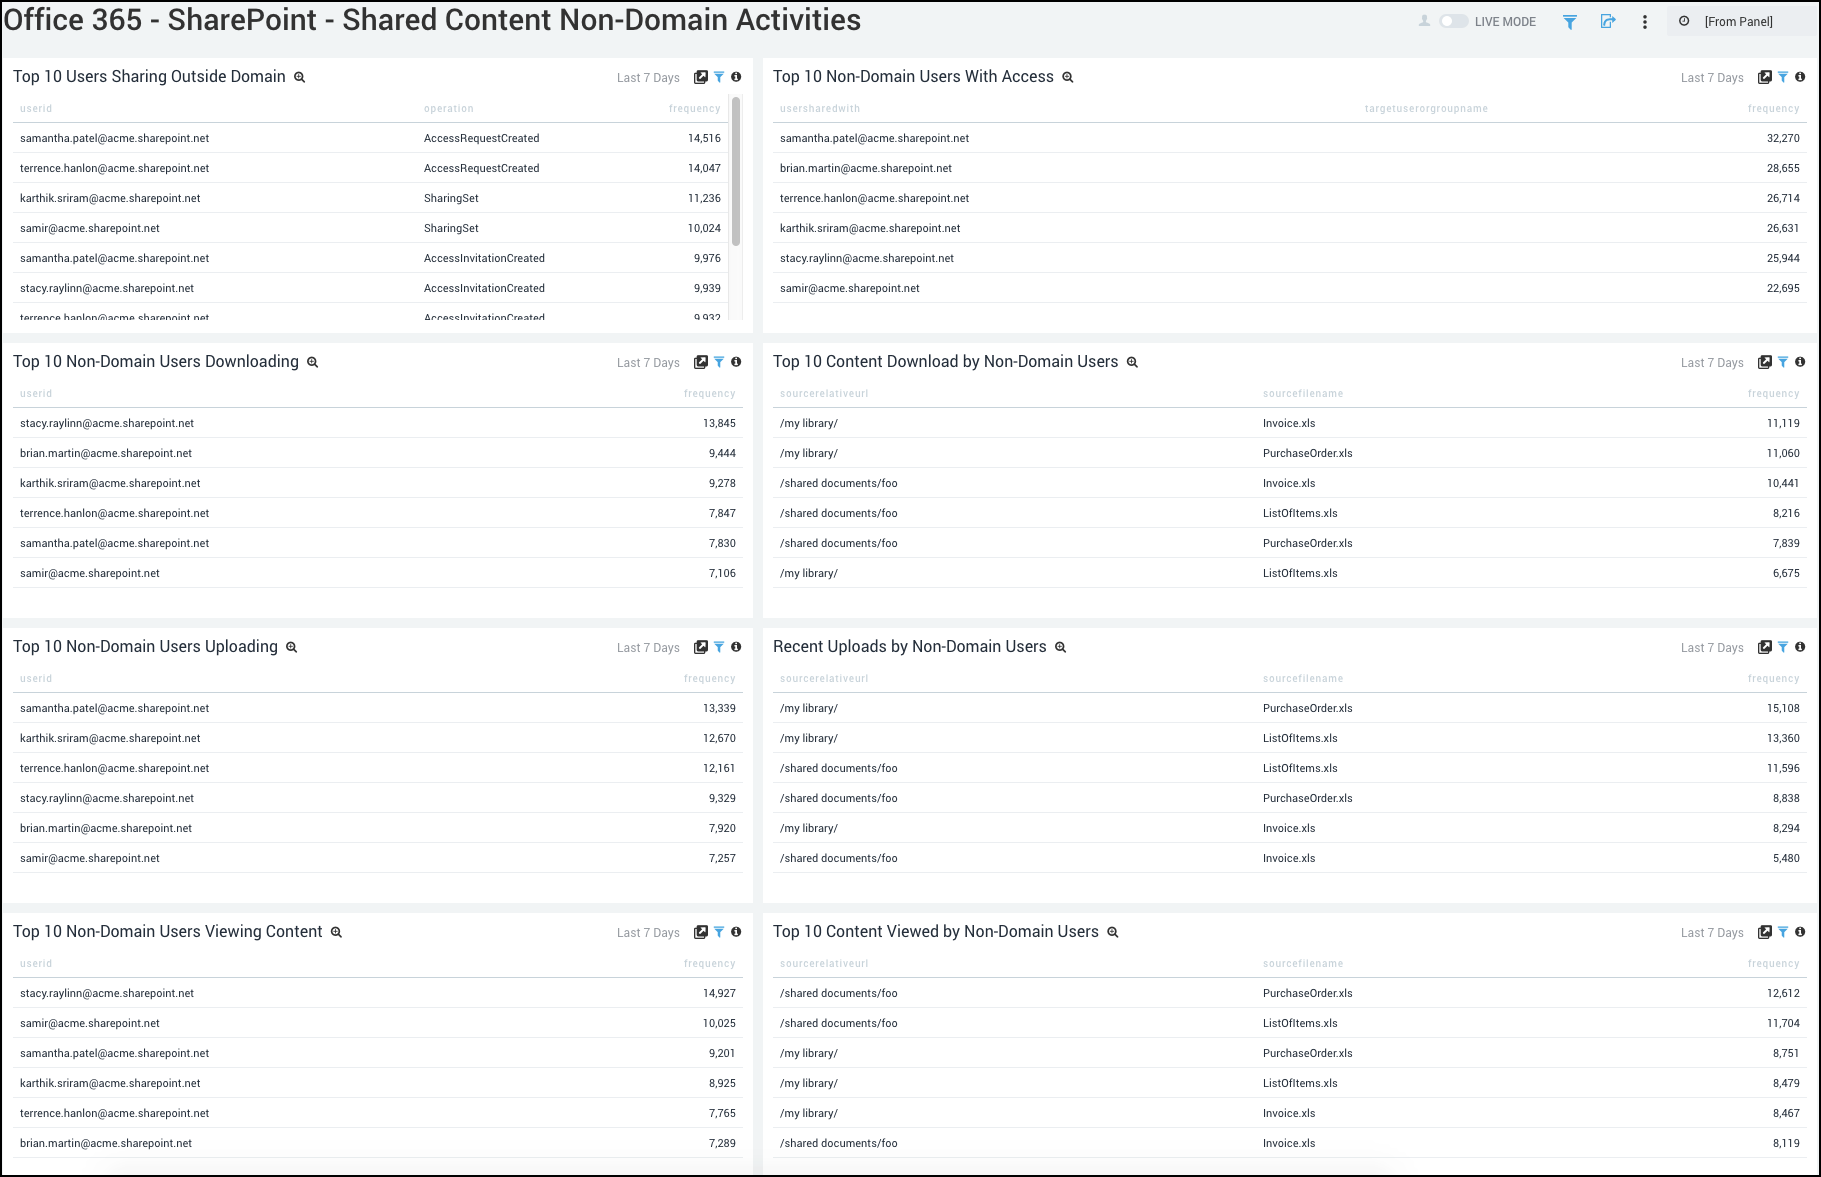
To see your data in this dashboard, open the queries for each panel and add your domain to them as mentioned here.
Top 10 Users Sharing Outside Domain. See the top 10 users sharing content outside the domain in a table chart, including user ID and frequency for the last 7 days.
Top 10 Non-Domain Users With Access. See the information on the top 10 non-domain users with access in a table chart, including details on the user shared with and frequency for the last seven days.
Top 10 Non-Domain Users Downloading. See information on the top 10 non-domain users downloading content in a table chart, including user ID and frequency for the last seven days.
Top 10 Contents Downloaded by Non-Domain Users. See the top 10 contents downloaded by non-domain users in a table, including details on the source relative URL, source file name, and frequency over the last 7 days.
Top 10 Non-Domain Users Uploading. See the top 10 non-domain users uploading content in a table chart, including user ID and frequency for the last seven days.
Recent Uploads by Non-Domain Users. See details on recent uploads by non-domain users in a table chart, including source relative URL and source file name for the last seven days.
Top 10 Non-Domain Users Viewing Content. See the top 10 non-domain users who have viewed content in a table chart, including user ID and frequency for the last 7 days.
Top 10 Contents Viewed by Non-Domain Users. See the top 10 content items viewed by non-domain users in a table chart, including details on the source relative URL, source file name, and frequency over the last 7 days.
SharePoint - User Activity
Shows details of active users, active IPs, and the count of users sharing content.
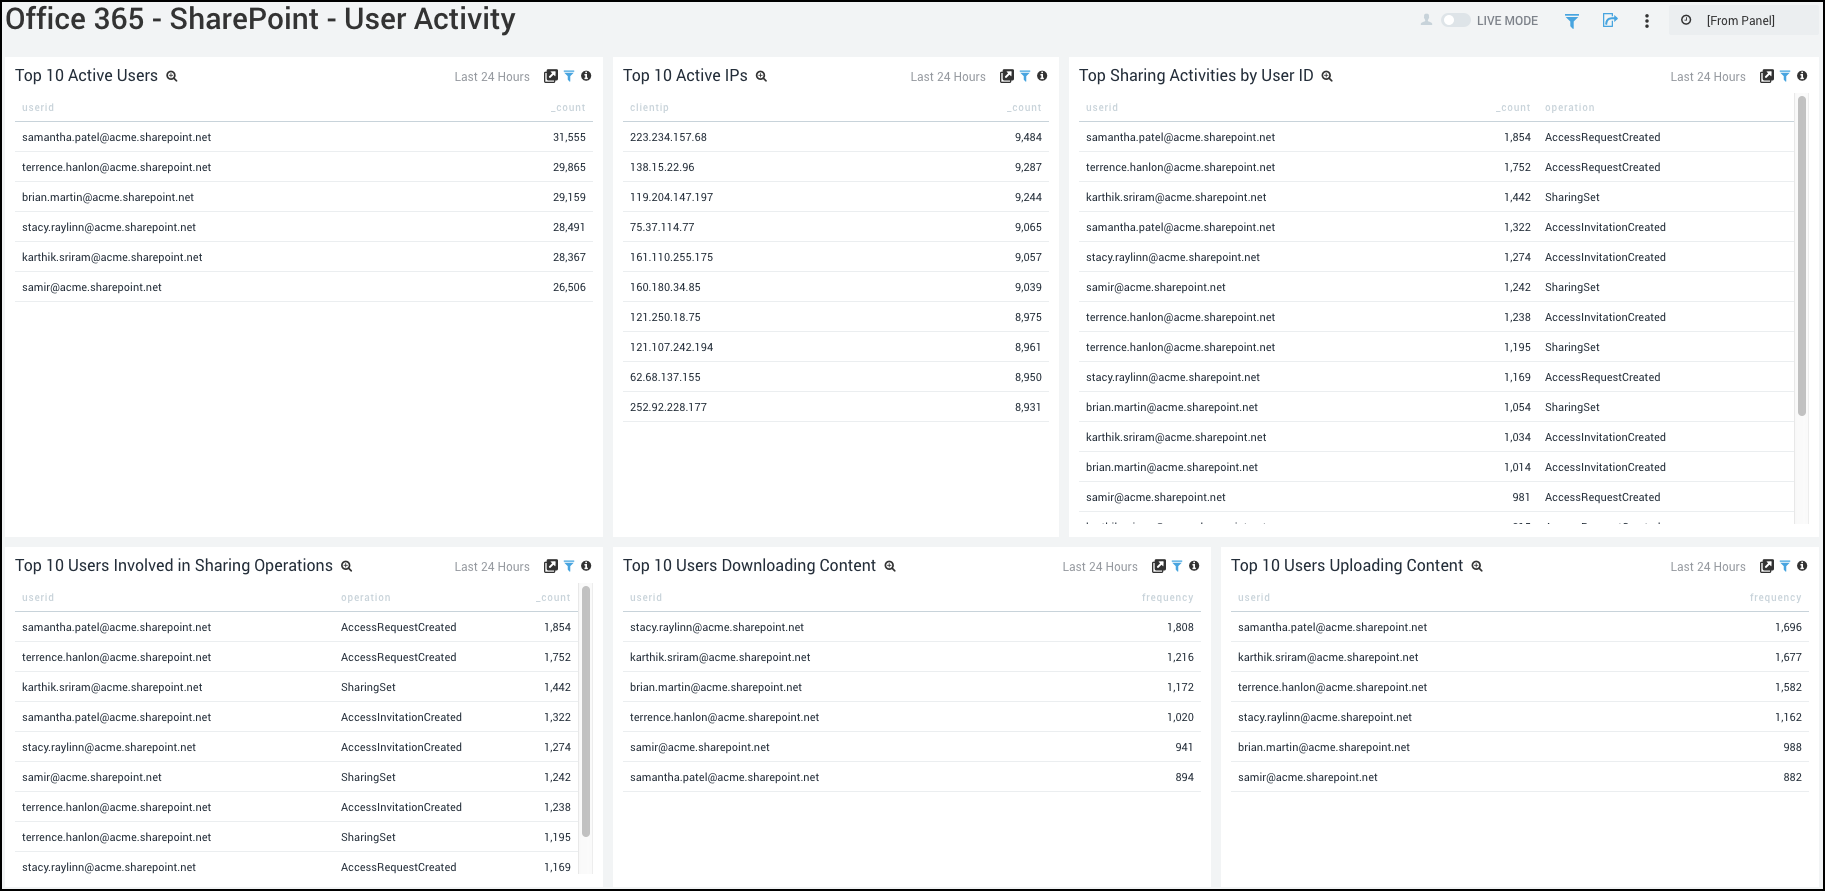
Top 10 Active Users. See the top 10 active users in a table chart, including details on user ID and count for the last 24 hours.
Top 10 Active IPs. See the top 10 active IP addresses in a table, including client IP addresses and counts for the last 24 hours.
Top Sharing Activities by User ID. See the top sharing activities by user ID in a table chart, including user ID, count, and operation for the last 24 hours.
Top 10 Users Involved in Sharing Operations. See the top 10 users who have performed sharing operations in a table chart, including user ID and the count for the last 24 hours.
Top 10 Users by Content Downloads. See the top 10 users who have downloaded content in a table chart, including user ID and download frequency for the last 24 hours.
Top 10 Users Uploading Content. See the top 10 users who have uploaded content in a table chart, including user ID and frequency for the last 24 hours.
SharePoint - Visitor Locations
Shows visitor details for SharePoint by location and over time.
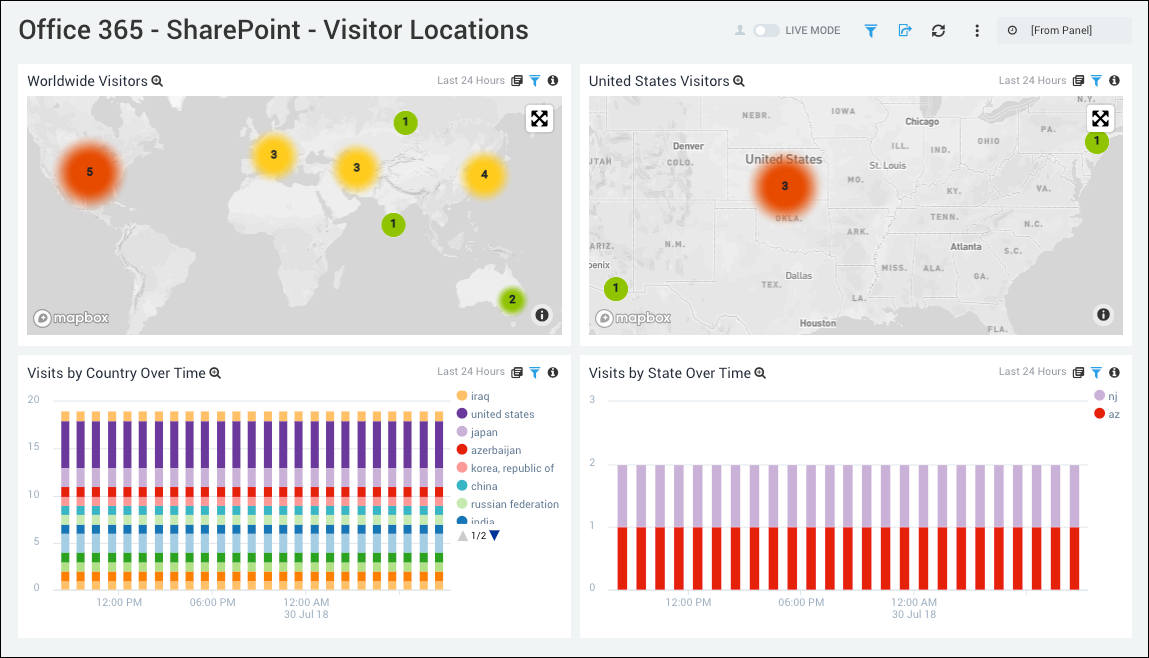
Worldwide Visitors. Performs a geo lookup to display worldwide client IP addresses on a world map for the last 24 hours.
United States Visitors. Performs a geo lookup to display United States client IP addresses on a world map for the last 24 hours.
Visits by Country Over Time. Displays visitors by country in a stacked column chart on a timeline for the last 24 hours.
Visits by State Over Time. Shows clients by state in a stacked column chart on a timeline for the last 24 hours.
Searches
To use the following searches, you will need to edit the search query to add the specific IP address or user email as needed.
Demo - Geo Lookup on Suspicious IP. Performs a geo lookup operation on a suspicious IP address that you specify.
Demo - Honing on Suspicious User. Provides information on a suspicious user that you identify.
Demo - LogReduce® on Suspicious IP. Performs a LogReduce operation on a suspicious IP address that you specify.
Demo - Outlier. Performs an outlier operation on an IP address that you specify.
Create monitors for the Microsoft Office 365 app
From your App Catalog:
- From the Sumo Logic navigation, select App Catalog.
- In the Search Apps field, search for and then select your app.
- Make sure the app is installed.
- Navigate to What's Included tab and scroll down to the Monitors section.
- Click Create next to the pre-configured monitors. In the create monitors window, adjust the trigger conditions and notifications settings based on your requirements.
- Scroll down to Monitor Details.
- Under Location click on New Folder.
note
By default, monitor will be saved in the root folder. So to make the maintenance easier, create a new folder in the location of your choice.
- Enter Folder Name. Folder Description is optional.
tip
Using app version in the folder name will be helpful to determine the versioning for future updates.
- Click Create. Once the folder is created, click on Save.
Microsoft Office 365 alerts
| Name | Description | Alert Condition | Recover Condition |
|---|---|---|---|
Office 365 - Excessive Failed Logins | This alert is triggered when a single user has more than 10 failed login attempts within 15 minutes. This may indicate a brute-force attack or credential stuffing attempt against the user's account. | Count > 0 | Count < = 0 |
Office 365 - Login from Risky Country | This alert is triggered when a successful login is detected from a country identified as high-risk or embargoed. This helps identify potential unauthorized access from restricted geographic locations. | Count > 0 | Count < = 0 |
Office 365 - User Account Deleted | This alert is triggered when a user account is deleted in Azure Active Directory. This could indicate an insider threat, a compromised admin account, or unauthorized administrative activity. | Count > 0 | Count < = 0 |
Office 365 - Exchange Configuration Change by External Entity | This alert is triggered when Exchange admin configuration changes are made via external access. This is a high-risk indicator of unauthorized administrative activity from outside the organization. | Count > 0 | Count < = 0 |
Office 365 - External Mailbox Access | This alert is triggered when a mailbox is accessed externally by a non-owner. This may indicate unauthorized access to email content from outside the organization. | Count > 0 | Count < = 0 |
Office 365 - Mass File Downloads | This alert is triggered when a single user downloads more than 50 files from SharePoint or OneDrive within 15 minutes. This may indicate a data exfiltration attempt or unauthorized bulk data access. | Count > 0 | Count < = 0 |
Office 365 - Anonymous or External Sharing Link Created | This alert is triggered when an anonymous sharing link or external sharing invitation is created in SharePoint or OneDrive. This may indicate potential data exposure to unauthorized external parties. | Count > 0 | Count < = 0 |
Upgrading the Microsoft Office 365 app (Optional)
To update the app, do the following:
Next-Gen App: To install or update the app, you must be an account administrator or a user with Manage Apps, Manage Monitors, Manage Fields, Manage Metric Rules, and Manage Collectors capabilities depending upon the different content types part of the app.
- Select App Catalog.
- In the Search Apps field, search for and then select your app.
Optionally, you can identify apps that can be upgraded in the Upgrade available section. - To upgrade the app, select Upgrade from the Manage dropdown.
- If the upgrade does not have any configuration or property changes, you will be redirected to the Preview & Done section.
- If the upgrade has any configuration or property changes, you will be redirected to the Setup Data page.
- In the Configure section of your respective app, complete the following fields.
- Field Name. If you already have collectors and sources set up, select the configured metadata field name (eg _sourcecategory) or specify other custom metadata (eg: _collector) along with its metadata Field Value.
- Click Next. You will be redirected to the Preview & Done section.
Post-update
Your upgraded app will be installed in the Installed Apps folder and dashboard panels will start to fill automatically.
See our Release Notes changelog for new updates in the app.
To revert the app to a previous version, do the following:
- Select App Catalog.
- In the Search Apps field, search for and then select your app.
- To version down the app, select Revert to < previous version of your app > from the Manage dropdown.
Uninstalling the Microsoft Office 365 app (Optional)
To uninstall the app, do the following:
- Select App Catalog.
- In the 🔎 Search Apps field, run a search for your desired app, then select it.
- Click Uninstall.