 Meet the new
 Windows Legacy
The Windows Legacy app provides insight into your Windows system's operation and events so that you can better manage and maintain your environment. The Windows Legacy app consists of predefined searches and dashboards that provide visibility into your environment for real-time analysis of overall usage of Security Status, System Activity, Updates, and User Activity.
Log types
The Windows Legacy app assumes events are coming from Remote Windows Event Log Sources. It does not work with third party logs. Standard Windows event channels include:
- Security
- Application
- System
Custom event channels, such as PowerShell or Internet Explorer are also supported.
Sample log messages
instance of Win32_NTLogEvent
{
    Category = 13571;
    CategoryString = "MPSSVC Rule-Level Policy Change";
    ComputerName = "aphrodite.sumolab.org";
    EventCode = 4957;
    EventIdentifier = 4957;
    EventType = 5;
    InsertionStrings = {"CoreNet-IPHTTPS-In", "Core Networking - IPHTTPS (TCP-In)", "Local Port"};
    Logfile = "Security";
    Message = "Windows Firewall did not apply the following rule:

    Rule Information:
    ID: CoreNet-IPHTTPS-In
    Name: Core Networking - IPHTTPS (TCP-In)

    Error Information:
    Reason: Local Port resolved to an empty set.";
    RecordNumber = 1441653878;
    SourceName = "Microsoft-Windows-Security-Auditing";
    TimeGenerated = "20130411232352.140400-000";
    TimeWritten = "20130411232352.140400-000";
    Type = "Audit Failure";
};
Sample queries
=OS/Windows "Policy Change"
| parse regex "CategoryString = \"(?<category>[^\"]+?)\";[\s\S]+?Logfile = \"Security\""
| count by category
| where category matches "*Policy Change*"
Collecting logs for Windows Legacy
This section provides instructions on configuring log collection for the Windows Legacy app, so that logs are collected from the Microsoft Windows Event Log and ingested into Sumo Logic. A sample log message and example query are also provided.
Windows Performance is considered a separate data type.
Configure a Collector and a Source
To configure a collector and source, do the following:
- Configure an Installed Windows collector through the user interface or from the command line.
- Configure either a local or remote Windows Event Log source. To configure a Windows Event Log source, set Event Format to Collect using legacy format.

Events retain their default text format from Windows.
For more information on local or remote Windows Event Log Source configuration, refer to Local Windows Event Log Source and Remote Windows Event Log Source.
Installing the Windows Legacy app
To install the app, do the following:
Next-Gen App: To install or update the app, you must be an account administrator or a user with Manage Apps, Manage Monitors, Manage Fields, Manage Metric Rules, and Manage Collectors capabilities depending upon the different content types part of the app.
- Select App Catalog.
- In the 🔎 Search Apps field, run a search for your desired app, then select it.
- Click Install App.
note
Sometimes this button says Add Integration.
- Click Next in the Setup Data section.
- In the Configure section of your respective app, complete the following fields.
- Field Name. If you already have collectors and sources set up, select the configured metadata field name (eg _sourcecategory) or specify other custom metadata (eg: _collector) along with its metadata Field Value.
- Click Next. You will be redirected to the Preview & Done section.
Post-installation
Once your app is installed, it will appear in your Installed Apps folder, and dashboard panels will start to fill automatically.
Each panel slowly fills with data matching the time range query received since the panel was created. Results will not immediately be available but will be updated with full graphs and charts over time.
Viewing Windows Legacy dashboards
All dashboards have a set of filters that you can apply to the entire dashboard. Use these filters to drill down and examine the data to a granular level.
- You can change the time range for a dashboard or panel by selecting a predefined interval from a drop-down list, choosing a recently used time range, or specifying custom dates and times. Learn more.
- You can use template variables to drill down and examine the data on a granular level. For more information, see Filtering Dashboards with Template Variables.
- Most Next-Gen apps allow you to provide the scope at the installation time and are comprised of a key (
_sourceCategoryby default) and a default value for this key. Based on your input, the app dashboards will be parameterized with a dashboard variable, allowing you to change the dataset queried by all panels. This eliminates the need to create multiple copies of the same dashboard with different queries.
Overview
The Windows 7+ - 2008 (Legacy) - Overview dashboard shows information about Windows update errors, fatal or warning messages, policy changes, system restarts, and changes to administrative groups.
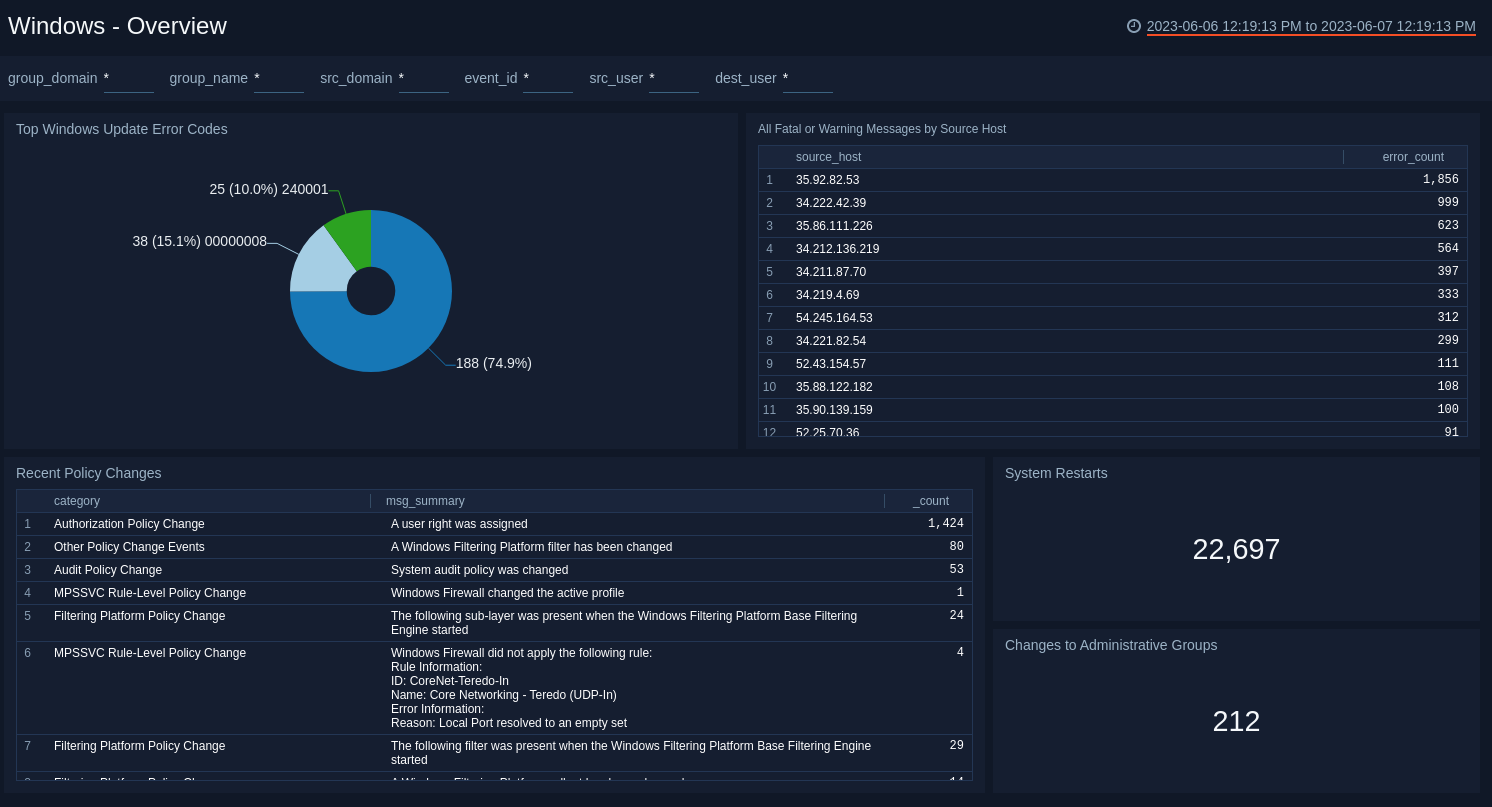
Top Windows Update Error Codes. Displays the top 10 Windows update error codes in a pie chart for the last 24 hours.
All Fatal or Warning Messages by Source Host. Provides details on the number of all fatal or warning messages by source host in an aggregation table for the last 24 hours.
System Restarts. Shows the number of system restarts in a single value chart for the last 24 hours.
Recent Policy Changes. Displays the number of recent policy changes by policy and count in a bar chart for the last 24 hours.
Changes to Administrative Groups. Shows the number of changes to administrative groups in a single value chart for the last 24 hours.
Default
The Windows 7+ - 2008 (Legacy) - Default dashboard shows information about the start and stop operations for Windows services; Windows events; operations events; and errors and warnings.
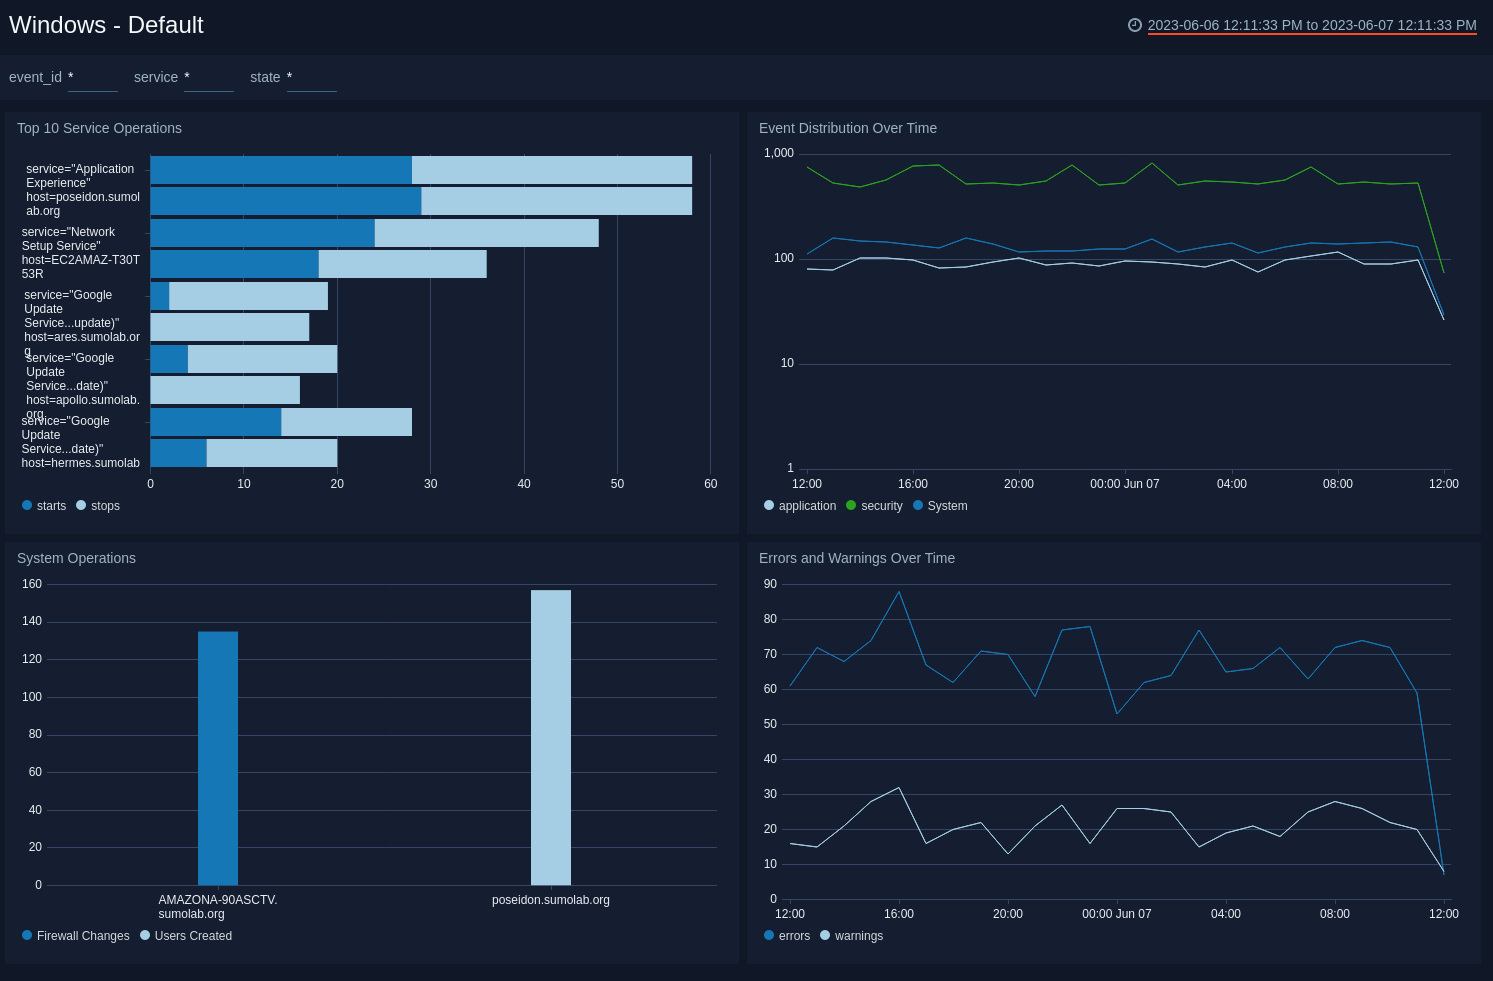
Top 10 Service Operations. Displays information on the top 10 services per host that have started and stopped over the last 10 hours in a bar chart. To display details of the data in a pop-up menu, hover over a section of the chart. Hover over the text Last 10 Hours in the upper right corner to see details of the time frame for the displayed data.
System Operations. Provides information on the number of and type of events that have occurred per host over the last 10 hours, which allows you to easily identify any spikes in activity in the column chart. To display details of the data in a pop-up menu, hover over a section of the chart. Hover over the text Last 10 Hours in the upper right corner to see details of the time frame for the displayed data.
Event Distribution Over Time. Displays the number and type of events per hour in an easy to read timeline for the past 24 hours. To display details of the data in a pop-up menu, hover over a line in the chart. Hover over the text Last 24 Hours in the upper right corner to see details of the time frame for the displayed data.
Errors and Warnings Over Time. Shows the number of errors and warnings per hour in a timeline. To display details of the data in a pop-up menu, hover over a line in the chart. Hover over the text Last 24 Hours in the upper right corner to see details of the time frame for the displayed data.
Login Status
The Windows 7+ - 2008 (Legacy) - Login Status dashboard shows information about successful and failed logins, and successful RDP reconnects.
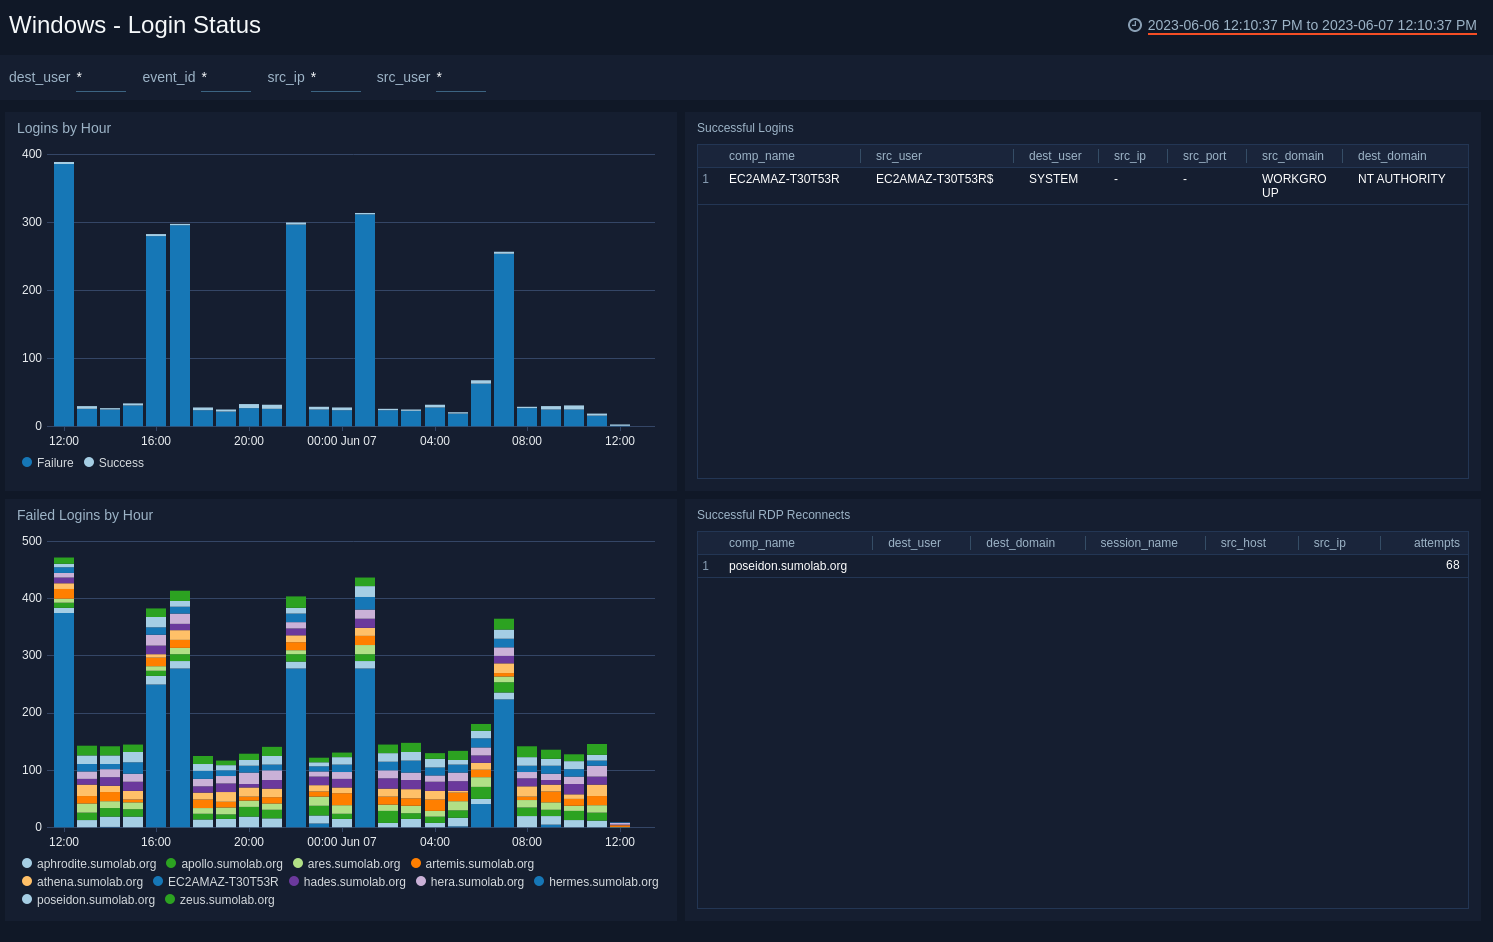
Logins by Hour. Counts the number of login successes and failures by one hour increments over the last two hours in a column chart. To display details of the data in a pop-up menu, hover over a section of the chart. Hover over the text in the upper right corner, Last 2 Hours, to see details of the time frame for the displayed data.
Failed Logins by Hour. Displays the number of failed logins per host by hour in an easy to read stacked column chart. Information is displayed for the last two hours. To display details of the data in a pop-up menu, hover over a section of the chart. Hover over the text in the upper right corner, Last 2 Hours, to see details of the time frame for the displayed data.
Successful Logins. Shows a table of successful logins including information on the computer name, source user, destination user, and number of attempts. Information is displayed for the last two hours.
Successful RDP Logins. Provides a table with a list of successful remote desktop logins including details on computer name, destination user, and number of attempts. Information is displayed for the last two hours.
Event Errors
The Windows 7+ - 2008 (Legacy) - Event Errors dashboard shows information about Window event messages that contain a keyword that indicates a problem. (If a Windows event contains "error", "timeout", "exception", or "fail", Sumo tags the message with "error_keyword", "timeout_keyword", "exception_keyword", or "fail_keyword" respectively.)
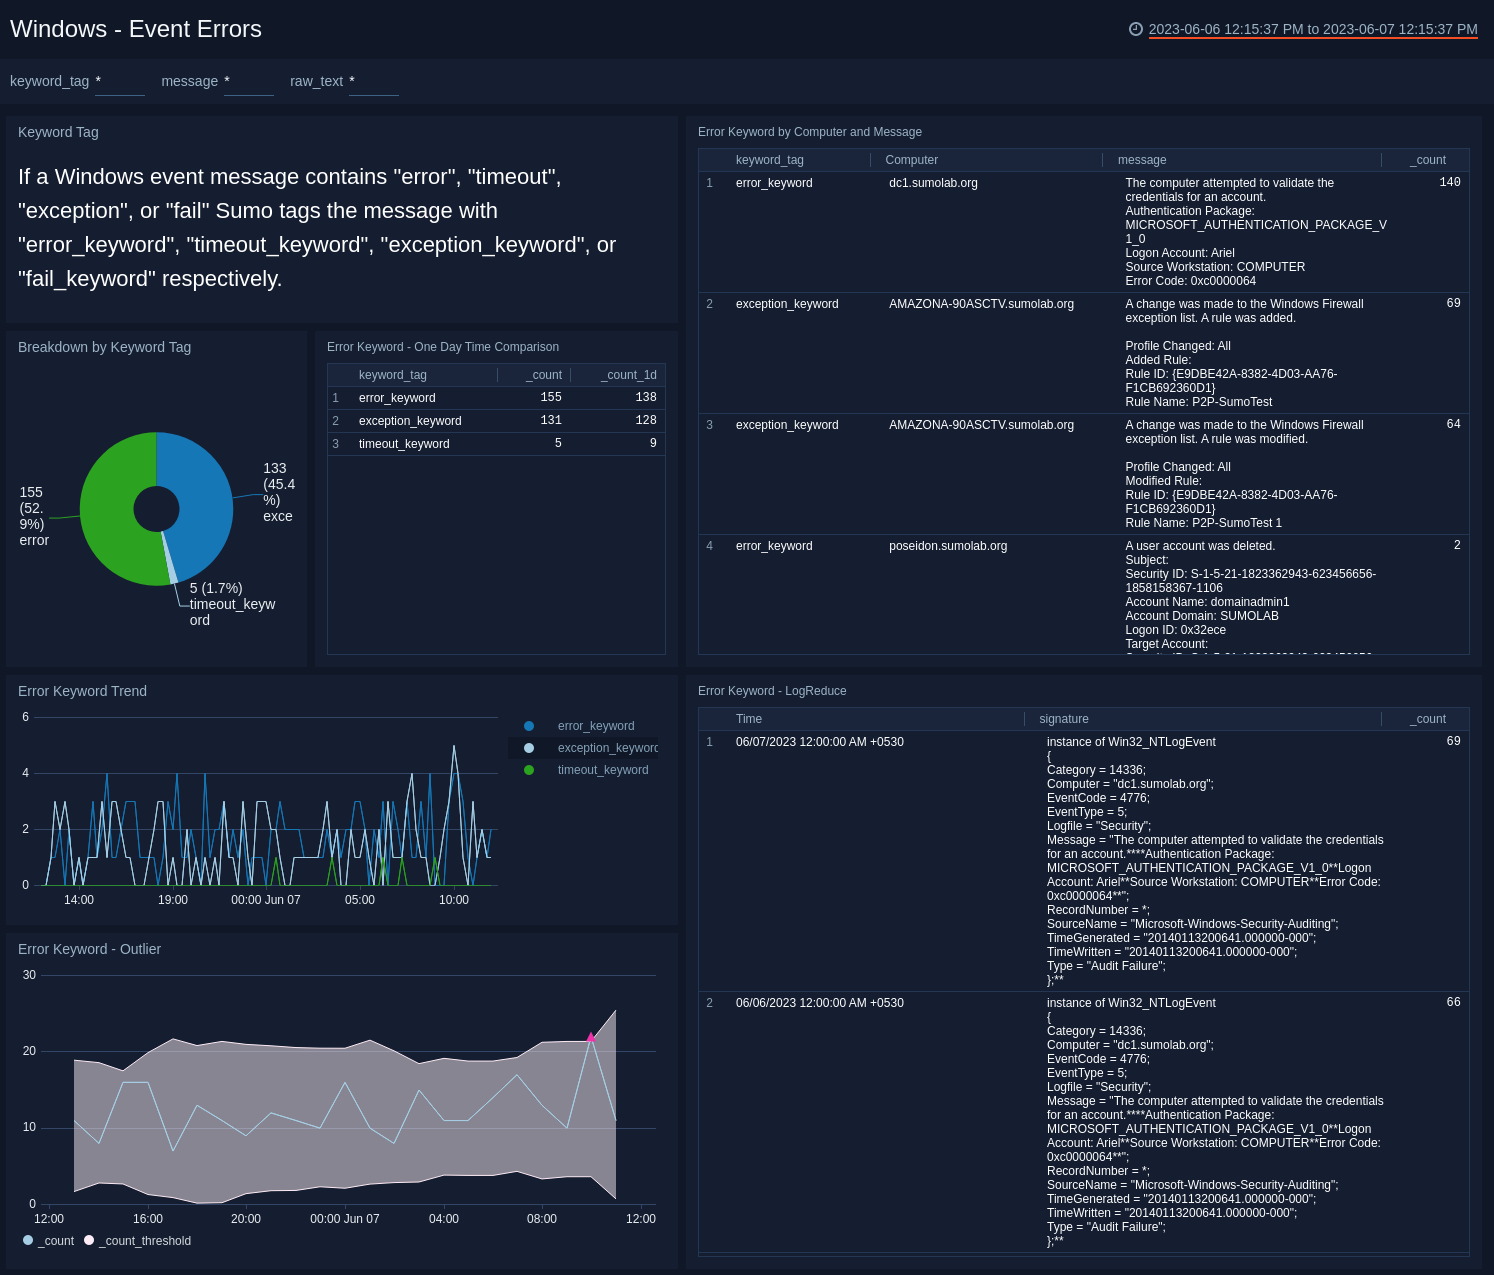
Breakdown by Keyword Tag. A donut chart that shows the breakdown of problem keywords encountered in event messages over the last 24 hours.
Error Keyword - One Day Time Comparison. A table that shows the count of each keyword tag ("error_keyword", "timeout_keyword", "exception_keyword", or "fail_keyword") over the last 24 hours, compared to the same information for the previous day.
Error Keyword by Computer and Message. A table that shows the count of unique keyword tag/computer/message combinations over the last 24 hours.
Error Keyword Trend. A line chart that shows the count of each keyword tag per 15 minute timeslice over the last 24 hours.
Error Keyword - Outlier. See timeslices where the count of problem keywords exceeds the moving average by a statistically significant amount, three standard deviations over the last 24 hours.
Error Keyword - LogReduce. See a LogReduce analysis of event messages that contain problem keywords. (Sumo's LogReduce algorithm uses fuzzy logic to cluster messages together based on string and pattern similarity. For more information, see, Detect Patterns with LogReduce).
Create monitors for the Windows Legacy app
From your App Catalog:
- From the Sumo Logic navigation, select App Catalog.
- In the Search Apps field, search for and then select your app.
- Make sure the app is installed.
- Navigate to What's Included tab and scroll down to the Monitors section.
- Click Create next to the pre-configured monitors. In the create monitors window, adjust the trigger conditions and notifications settings based on your requirements.
- Scroll down to Monitor Details.
- Under Location click on New Folder.
note
By default, monitor will be saved in the root folder. So to make the maintenance easier, create a new folder in the location of your choice.
- Enter Folder Name. Folder Description is optional.
tip
Using app version in the folder name will be helpful to determine the versioning for future updates.
- Click Create. Once the folder is created, click on Save.
Windows Legacy alerts
| Name | Description | Alert Condition | Recover Condition |
|---|---|---|---|
Windows 7+ - 2008 (Legacy) - Excessive Failed Logins | This alert is triggered when a single user has more than 10 failed login attempts within 5 minutes. This may indicate a brute-force attack or credential stuffing attempt against the user's account. | Count > 0 | Count <= 0 |
Windows 7+ - 2008 (Legacy) - User Account Locked Out | This alert is triggered when a user account is locked out. This may indicate a brute-force attack has triggered the account lockout policy, or a misconfigured service is repeatedly attempting authentication with stale credentials. | Count > 0 | Count <= 0 |
Windows 7+ - 2008 (Legacy) - User Added to Administrative Group | This alert is triggered when a user is added to a privileged administrative group such as Administrators, Domain Admins, Schema Admins, Server Operators, Account Operators, or Backup Operators. This may indicate privilege escalation or unauthorized access. | Count > 0 | Count <= 0 |
Windows 7+ - 2008 (Legacy) - Audit Log Cleared | This alert is triggered when the Windows Security audit log is cleared. This is a high-severity indicator as attackers often clear audit logs to cover their tracks after compromising a system. | Count > 0 | Count <= 0 |
Windows 7+ - 2008 (Legacy) - Firewall Rule Modified | This alert is triggered when a Windows Firewall rule is added, modified, or deleted. Unauthorized firewall changes may indicate an attacker attempting to open access to the system or exfiltrate data. | Count > 0 | Count <= 0 |
Windows 7+ - 2008 (Legacy) - User Account Deleted | This alert is triggered when a user account is deleted. This could indicate unauthorized administrative activity or an insider threat attempting to disrupt operations. | Count > 0 | Count <= 0 |
Upgrade/Downgrade the Windows Legacy app (Optional)
To update the app, do the following:
Next-Gen App: To install or update the app, you must be an account administrator or a user with Manage Apps, Manage Monitors, Manage Fields, Manage Metric Rules, and Manage Collectors capabilities depending upon the different content types part of the app.
- Select App Catalog.
- In the Search Apps field, search for and then select your app.
Optionally, you can identify apps that can be upgraded in the Upgrade available section. - To upgrade the app, select Upgrade from the Manage dropdown.
- If the upgrade does not have any configuration or property changes, you will be redirected to the Preview & Done section.
- If the upgrade has any configuration or property changes, you will be redirected to the Setup Data page.
- In the Configure section of your respective app, complete the following fields.
- Field Name. If you already have collectors and sources set up, select the configured metadata field name (eg _sourcecategory) or specify other custom metadata (eg: _collector) along with its metadata Field Value.
- Click Next. You will be redirected to the Preview & Done section.
Post-update
Your upgraded app will be installed in the Installed Apps folder and dashboard panels will start to fill automatically.
See our Release Notes changelog for new updates in the app.
To revert the app to a previous version, do the following:
- Select App Catalog.
- In the Search Apps field, search for and then select your app.
- To version down the app, select Revert to < previous version of your app > from the Manage dropdown.
Uninstalling the Windows Legacy app (Optional)
To uninstall the app, do the following:
- Select App Catalog.
- In the 🔎 Search Apps field, run a search for your desired app, then select it.
- Click Uninstall.