Cisco Meraki - C2C
The Sumo Logic app for Cisco Meraki app collects data from Cisco Meraki Cloud-to-cloud (C2C) collector, providing comprehensive insights and monitoring capabilities for efficient network management and enhanced security. With features such as organization overview, network traffic analysis and monitoring, real-time security event monitoring, event analysis, client and SSID monitoring, Air Marshal security overview, and visualization/reporting, these dashboards offer valuable information on network configuration, traffic patterns, bandwidth utilization, performance metrics, security events, client activity, and potential threats. By leveraging these key features, you can proactively optimize network performance, analyze traffic trends, identify and mitigate security risks, and make informed decisions to ensure a robust and secure network infrastructure.
Key features and benefits of the Cisco Meraki - C2C app include:
- Comprehensive Organization Insights. Gain valuable insights into your organizational configuration and operations, including API adoption, configuration template usage, and product distribution. Stay updated on the overall organization landscape and monitor key metrics for efficient management and optimization.
- Real-time Security Monitoring. Monitor network security in real-time with insights on security events, blocked events, threat severity, and infected hosts. Identify potential threats, track attack origins and targets, and take proactive measures to enhance network security.
- Event Analysis and Trend Identification. Analyze network events based on type, client associations, and SSIDs. Identify event patterns and trends to understand network activity and potential security risks.
- Client and SSID Monitoring. Monitor your client activity and their association with specific SSIDs. Identify your client's geographical distribution to assess potential risks associated with the specific locations and keep track of your client's behaviour and network usage for effective management.
- Air Marshal Security Overview. Provide wireless intrusion detection and prevention by monitoring security status and identifying potential vulnerabilities in the network.
- Enhanced Security Measures. Monitor blocked connections, file scans, and malicious files to ensure a secure network environment. Prioritize your security efforts by identifying top clients and destinations based on security events and take proactive steps to protect the network and mitigate potential threats.
- Visualization and Reporting. Provides visual representations of network data, making it easy for you to understand and interpret key metrics. Generate reports and share insights with your stakeholders to facilitate decision-making and drive network improvements.
- Network Traffic Analysis and Monitoring. Monitor comprehensive network traffic patterns including application usage, protocol distribution, and port activity. Track bandwidth trends and analyze sent versus received data to understand communication patterns and optimize network performance.
- Geographic Risk Assessment and Port Security. Visualize destination locations and identify high-risk or embargoed regions for compliance awareness. Monitor traffic on insecure ports to detect legacy or unencrypted services and enhance network security posture.
Log types
This app uses Cisco Meraki source to collect the data from Cisco Meraki.
Sample log messages
- Get Organizations sample log format.
- Get Organizations Networks sample log format.
- Get Organizations Appliance Security Events sample log format.
- Get Organizations Configuration Changes sample log format.
- Get Network Events sample log format.
- Get Network Wireless Air Marshal sample log format.
- Get Network Traffic Events sample log format.
Sample queries
_sourceCategory=Labs/CiscoMerakiC2C  licensing name management cloud
| json "id","name","cloud.region.name" as id,name,region nodrop

// global filters
| where if("{{organization_name}}" = "*",true,name matches "{{organization_name}}")
| where if("{{region_name}}" = "*",true,region matches "{{region_name}}")

// panel specific
| where !isBlank(id)
| count by id
| count
_sourceCategory=Labs/CiscoMerakiC2C organizationId name productTypes
| json "id","name","timeZone" as id,name,time_zone nodrop

// global filters
| where if("{{time_zone}}"="*",true,time_zone matches "{{time_zone}}")
| where if("{{network_name}}" = "*",true,name matches "{{network_name}}")

// panel specific
| count by id
| count
_sourceCategory=Labs/CiscoMerakiC2C  eventType priority ts
| json "clientName", "eventType", "priority", "ts" as client_name, event_type, priority, ts nodrop

| if(priority matches "1", "High", if(priority matches "2", "Medium", if(priority matches "3", "Low", if (priority matches "4", "Very Low", "-")))) as severity

// global filters
| where if ("{{client_name}}" = "*", true, client_name matches "{{client_name}}")
| where if ("{{event_type}}" = "*", true, event_type matches "{{event_type}}")
| where if ("{{severity}}" = "*", true, severity matches "{{severity}}")

// panel specific
| count by ts // deduplicating via ts as we do not have any unique identifier
| count
_sourceCategory=Labs/CiscoMerakiC2C  occurredAt networkId
| json "type", "occurredAt", "networkId" as type, occurred_at, network_id nodrop

// global filters
| where if ("{{event_type}}" = "*", true, type matches "{{event_type}}")
| where if ("{{category}}" = "*", true, category matches "{{category}}")

// panel specific
| count by occurred_at, network_id
| count
Collection configuration and app installation
Depending on the set up collection method, you can configure and install the app in three ways:
- Create a new collector and install the app. Create a new Sumo Logic Cloud-to-Cloud (C2C) source under a new Sumo Logic Collector and later install the app, or
- Use an existing collector and install the app. Create a new Sumo Logic Cloud-to-Cloud (C2C) source under an existing Sumo Logic Collector and later install the app, or
- Use existing source and install the app. Use your existing configured Sumo Logic Cloud-to-Cloud (C2C) source and install the app.
Use the Cloud-to-Cloud Integration for Cisco Meraki to create the source and use the same source category while installing the app. By following these steps, you can ensure that your Cisco Meraki app is properly integrated and configured to collect and analyze your Cisco Meraki data.
Create a new collector and install the app
To set up collection and install the app, do the following:
Next-Gen App: To install or update the app, you must be an account administrator or a user with Manage Apps, Manage Monitors, Manage Fields, Manage Metric Rules, and Manage Collectors capabilities depending upon the different content types part of the app.
- Select App Catalog.
- In the 🔎 Search Apps field, run a search for your desired app, then select it.
- Click Install App.
note
Sometimes this button says Add Integration.
- In the Set Up Collection section of your respective app, select Create a new Collector.
- Collector Name. Enter a Name to display the Source in the Sumo Logic web application. The description is optional.
- Timezone. Set the default time zone when it is not extracted from the log timestamp. Time zone settings on Sources override a Collector time zone setting.
- (Optional) Metadata. Click the +Add Metadata link to add a custom log Metadata Fields. Define the fields you want to associate, each metadata field needs a name (key) and value.
 A green circle with a checkmark is shown when the field exists and is enabled in the Fields table schema.
 An orange triangle with an exclamation point is shown when the field doesn't exist, or is disabled in the Fields table schema. In this case, you'll see an option to automatically add or enable the nonexistent fields to the Fields table schema. If a field is sent to Sumo Logic but isn’t present or enabled in the schema, it’s ignored and marked as Dropped.
- Click Next.
- Configure the source as specified in the
Infobox above, ensuring all required fields are included. - In the Configure section of your respective app, complete the following fields.
- Field Name. If you already have collectors and sources set up, select the configured metadata field name (eg _sourcecategory) or specify other custom metadata (eg: _collector) along with its metadata Field Value.
- Click Next. You will be redirected to the Preview & Done section.
Post-installation
Once your app is installed, it will appear in your Installed Apps folder, and dashboard panels will start to fill automatically.
Each panel slowly fills with data matching the time range query received since the panel was created. Results will not immediately be available but will be updated with full graphs and charts over time.
Use an existing collector and install the app
To set up the source in the existing collector and install the app, do the following:
Next-Gen App: To install or update the app, you must be an account administrator or a user with Manage Apps, Manage Monitors, Manage Fields, Manage Metric Rules, and Manage Collectors capabilities depending upon the different content types part of the app.
- Select App Catalog.
- In the 🔎 Search Apps field, run a search for your desired app, then select it.
- Click Install App.
note
Sometimes this button says Add Integration.
- In the Set Up Collection section of your respective app, select Use an existing Collector.
- From the Select Collector dropdown, select the collector that you want to set up your source with and click Next.
- Configure the source as specified in the
Infobox above, ensuring all required fields are included. - In the Configure section of your respective app, complete the following fields.
- Field Name. If you already have collectors and sources set up, select the configured metadata field name (eg _sourcecategory) or specify other custom metadata (eg: _collector) along with its metadata Field Value.
- Click Next. You will be redirected to the Preview & Done section.
Post-installation
Once your app is installed, it will appear in your Installed Apps folder, and dashboard panels will start to fill automatically.
Each panel slowly fills with data matching the time range query received since the panel was created. Results will not immediately be available but will be updated with full graphs and charts over time.
Use an existing source and install the app
To skip collection and only install the app, do the following:
Next-Gen App: To install or update the app, you must be an account administrator or a user with Manage Apps, Manage Monitors, Manage Fields, Manage Metric Rules, and Manage Collectors capabilities depending upon the different content types part of the app.
- Select App Catalog.
- In the 🔎 Search Apps field, run a search for your desired app, then select it.
- Click Install App.
note
Sometimes this button says Add Integration.
- In the Set Up Collection section of your respective app, select Skip this step and use existing source and click Next.
- In the Configure section of your respective app, complete the following fields.
- Field Name. If you already have collectors and sources set up, select the configured metadata field name (eg _sourcecategory) or specify other custom metadata (eg: _collector) along with its metadata Field Value.
- Click Next. You will be redirected to the Preview & Done section.
Post-installation
Once your app is installed, it will appear in your Installed Apps folder, and dashboard panels will start to fill automatically.
Each panel slowly fills with data matching the time range query received since the panel was created. Results will not immediately be available but will be updated with full graphs and charts over time.
Viewing the Cisco Meraki - C2C dashboards
All dashboards have a set of filters that you can apply to the entire dashboard. Use these filters to drill down and examine the data to a granular level.
- You can change the time range for a dashboard or panel by selecting a predefined interval from a drop-down list, choosing a recently used time range, or specifying custom dates and times. Learn more.
- You can use template variables to drill down and examine the data on a granular level. For more information, see Filtering Dashboards with Template Variables.
- Most Next-Gen apps allow you to provide the scope at the installation time and are comprised of a key (
_sourceCategoryby default) and a default value for this key. Based on your input, the app dashboards will be parameterized with a dashboard variable, allowing you to change the dataset queried by all panels. This eliminates the need to create multiple copies of the same dashboard with different queries.
Organization Overview
The Cisco Meraki - Organization Overview dashboard provides valuable insights and essential metrics concerning your organizational configuration and operations. It provides a comprehensive understanding of your network through various panels, including Total Organizations, API Enabled Organizations, Organizations by Product Type, and Organizations by Cloud Region, allowing you to stay updated on the overall organization landscape, monitor API adoption, track configuration template usage, and analyze product distribution within the network. Additionally, the dashboard provides insights on Active Admins, Configuration Change Summary, Geo Locations of Top Threats, and Configuration Change Frequency. By leveraging this dashboard, you can efficiently manage and optimize your organization's performance and enhance its security. 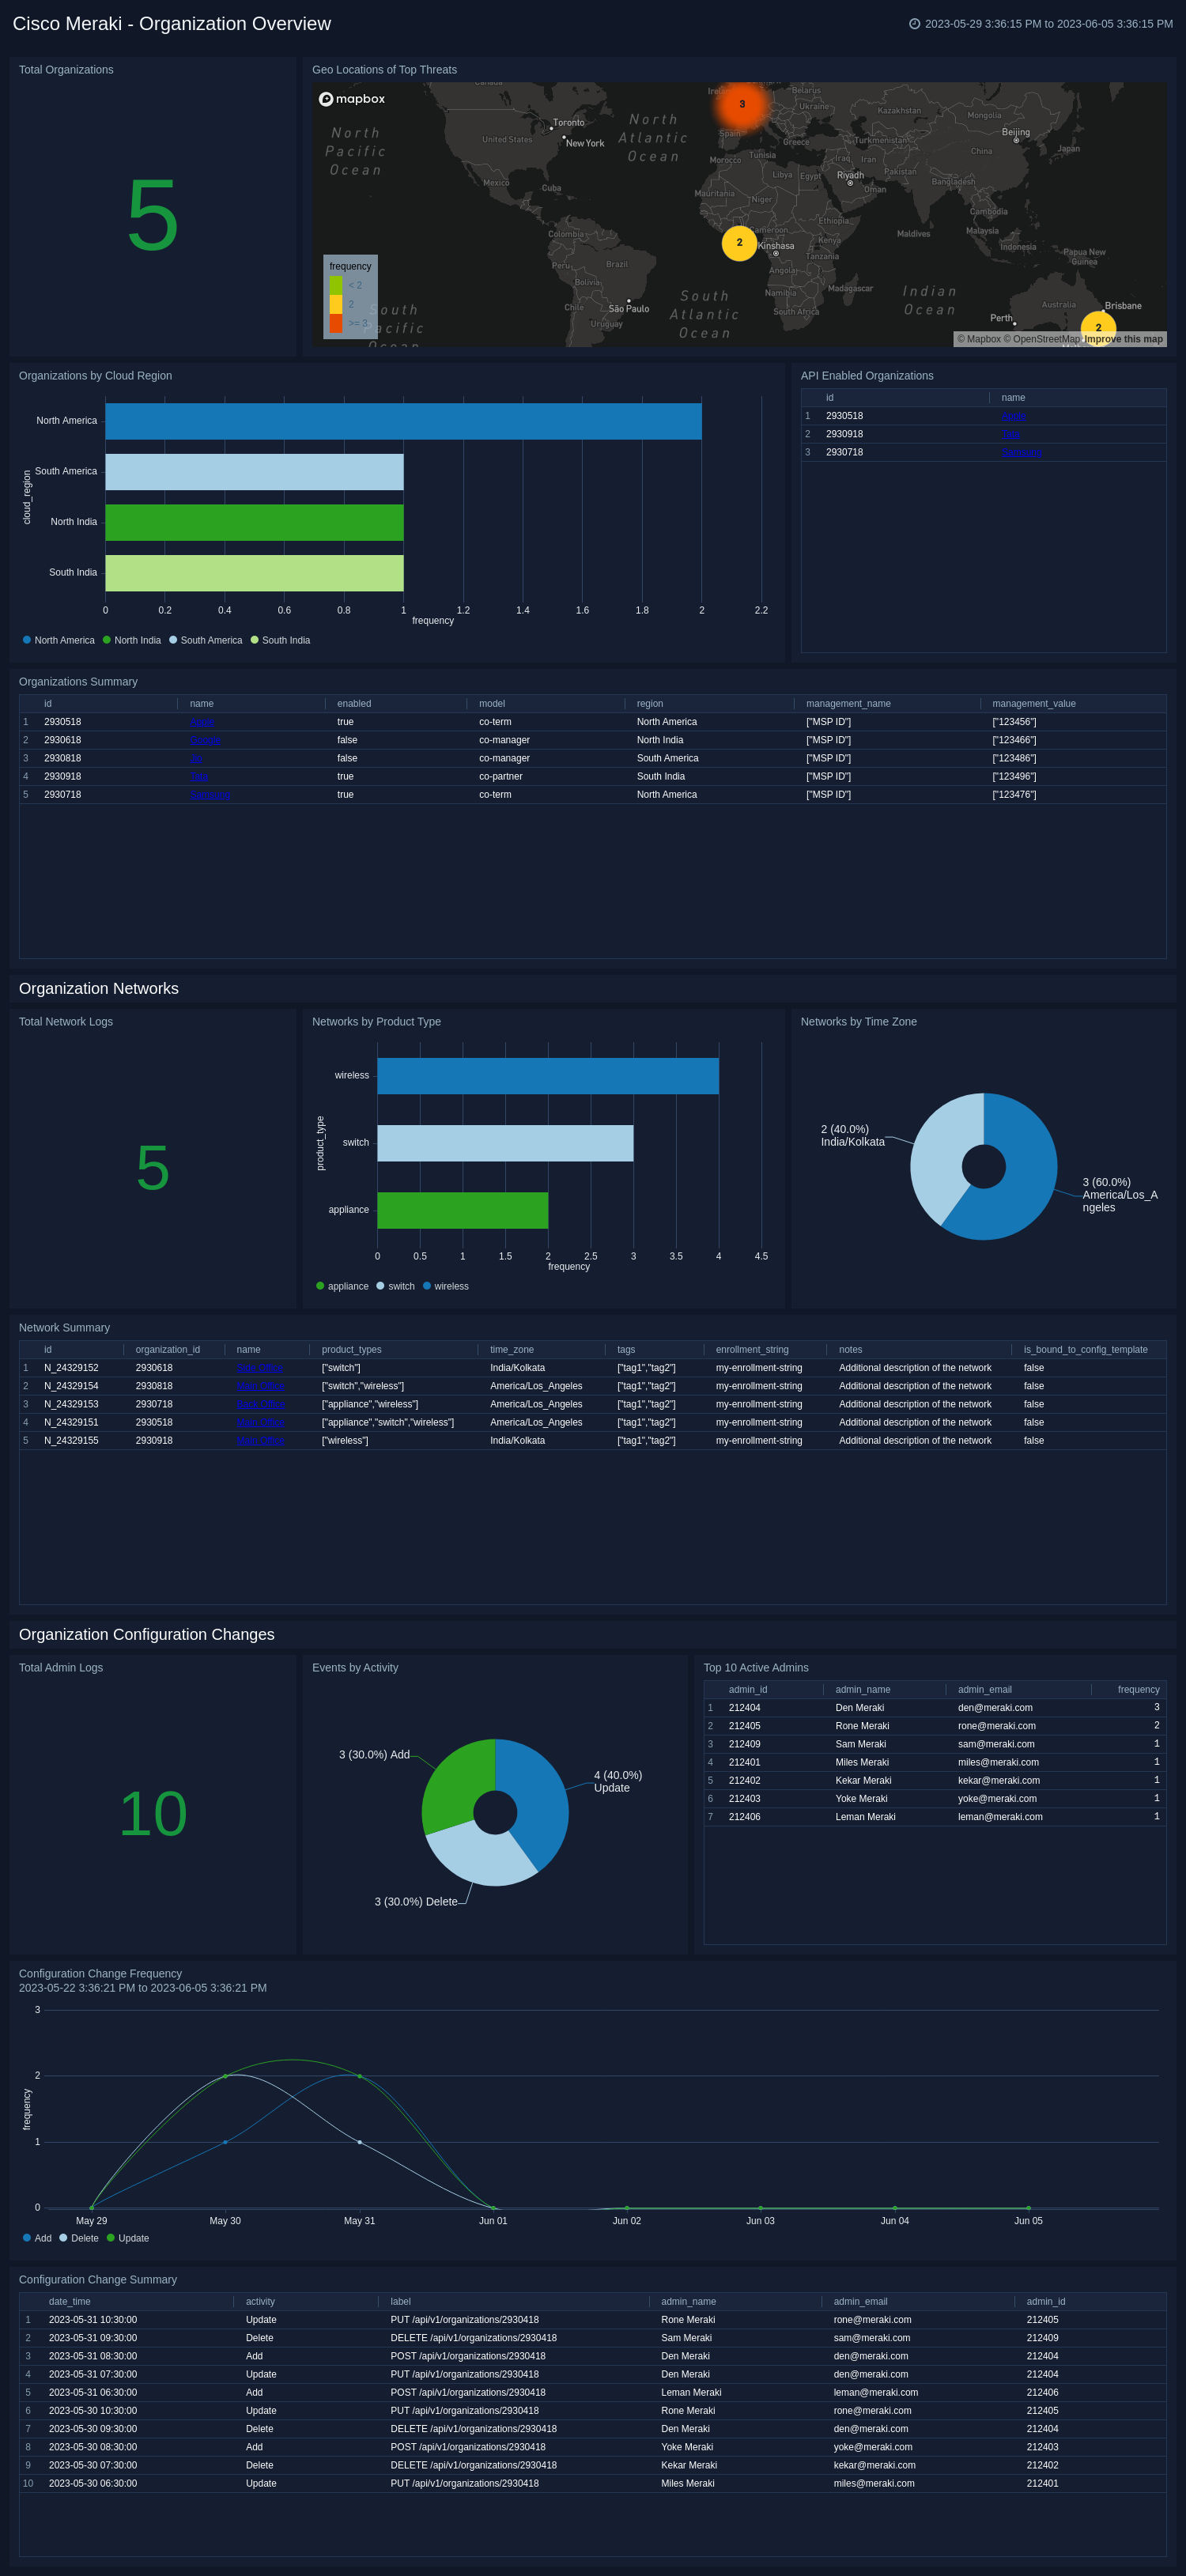
Appliance Security Events
The Cisco Meraki - Appliance Security Events dashboard provides real-time insights and important metrics for monitoring network security. It provides a comprehensive view of the security environment through various panels, including Total Events, Blocked Events, Threat Severity, Events by Type, Infected Hosts, Geo Locations of Attack Origins, Geo Locations of Attack Targets, Trend Analysis, Top Clients by Events, Top Destinations by Events, File Scanned, Blocked Connections, and Malicious Files. Analyze events based on the types, track infected hosts, and visualize the geographical locations of attack origins and targets. Utilize trend analysis to identify patterns and potential threats, prioritize security efforts by identifying top clients and destinations based on events, monitor file scans, blocked connections, and malicious files to enhance security. This dashboard enables proactive management of network security and protection against potential threats. 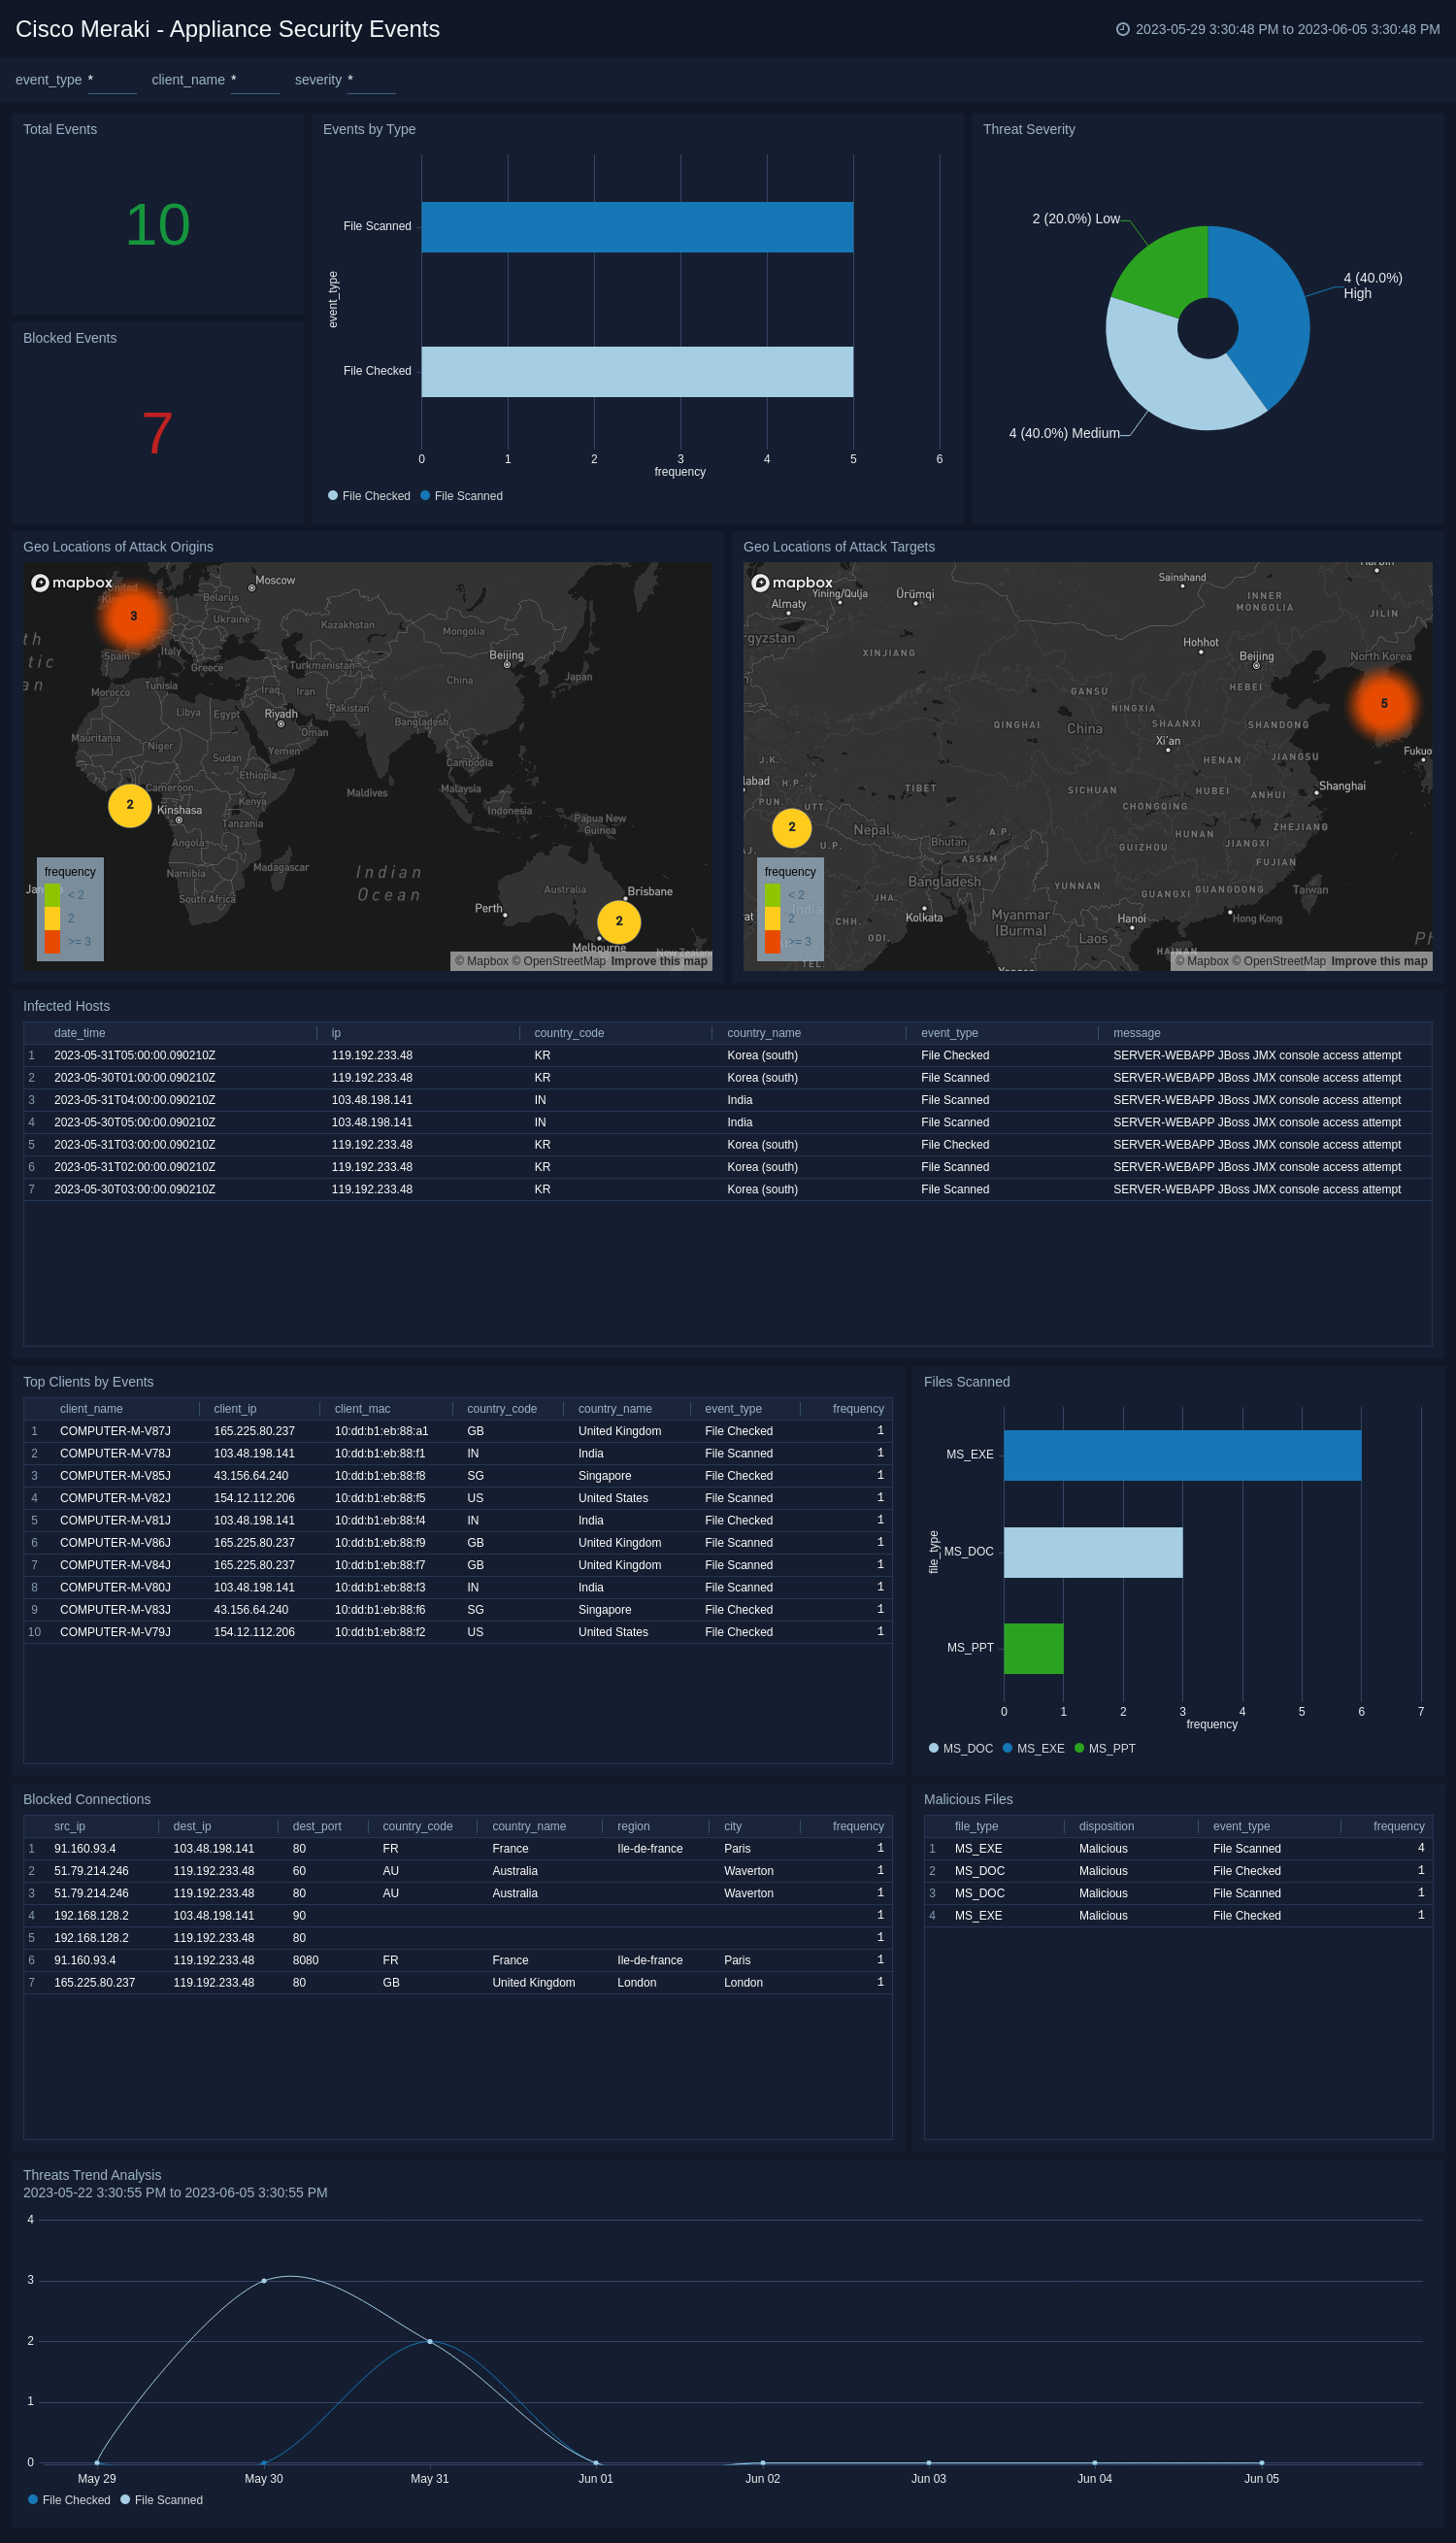
Network Events and Air Marshal
The Cisco Meraki - Network Events and Air Marshal dashboard provides you with a comprehensive overview of network activity, event timelines, and event type breakdown. It offers insights into associated clients and their respective SSIDs, highlighting recent association events. The geo locations of clients are displayed, allowing for easy identification of their geographical distribution. Additionally, this dashboard presents information on the SSID associated with clients and an Air Marshal overview to monitor security. Risky geo locations are highlighted to help you to identify potential threats and vulnerabilities. With these panels, the dashboard offers a holistic view of network performance, event analysis, client activity, and security monitoring. 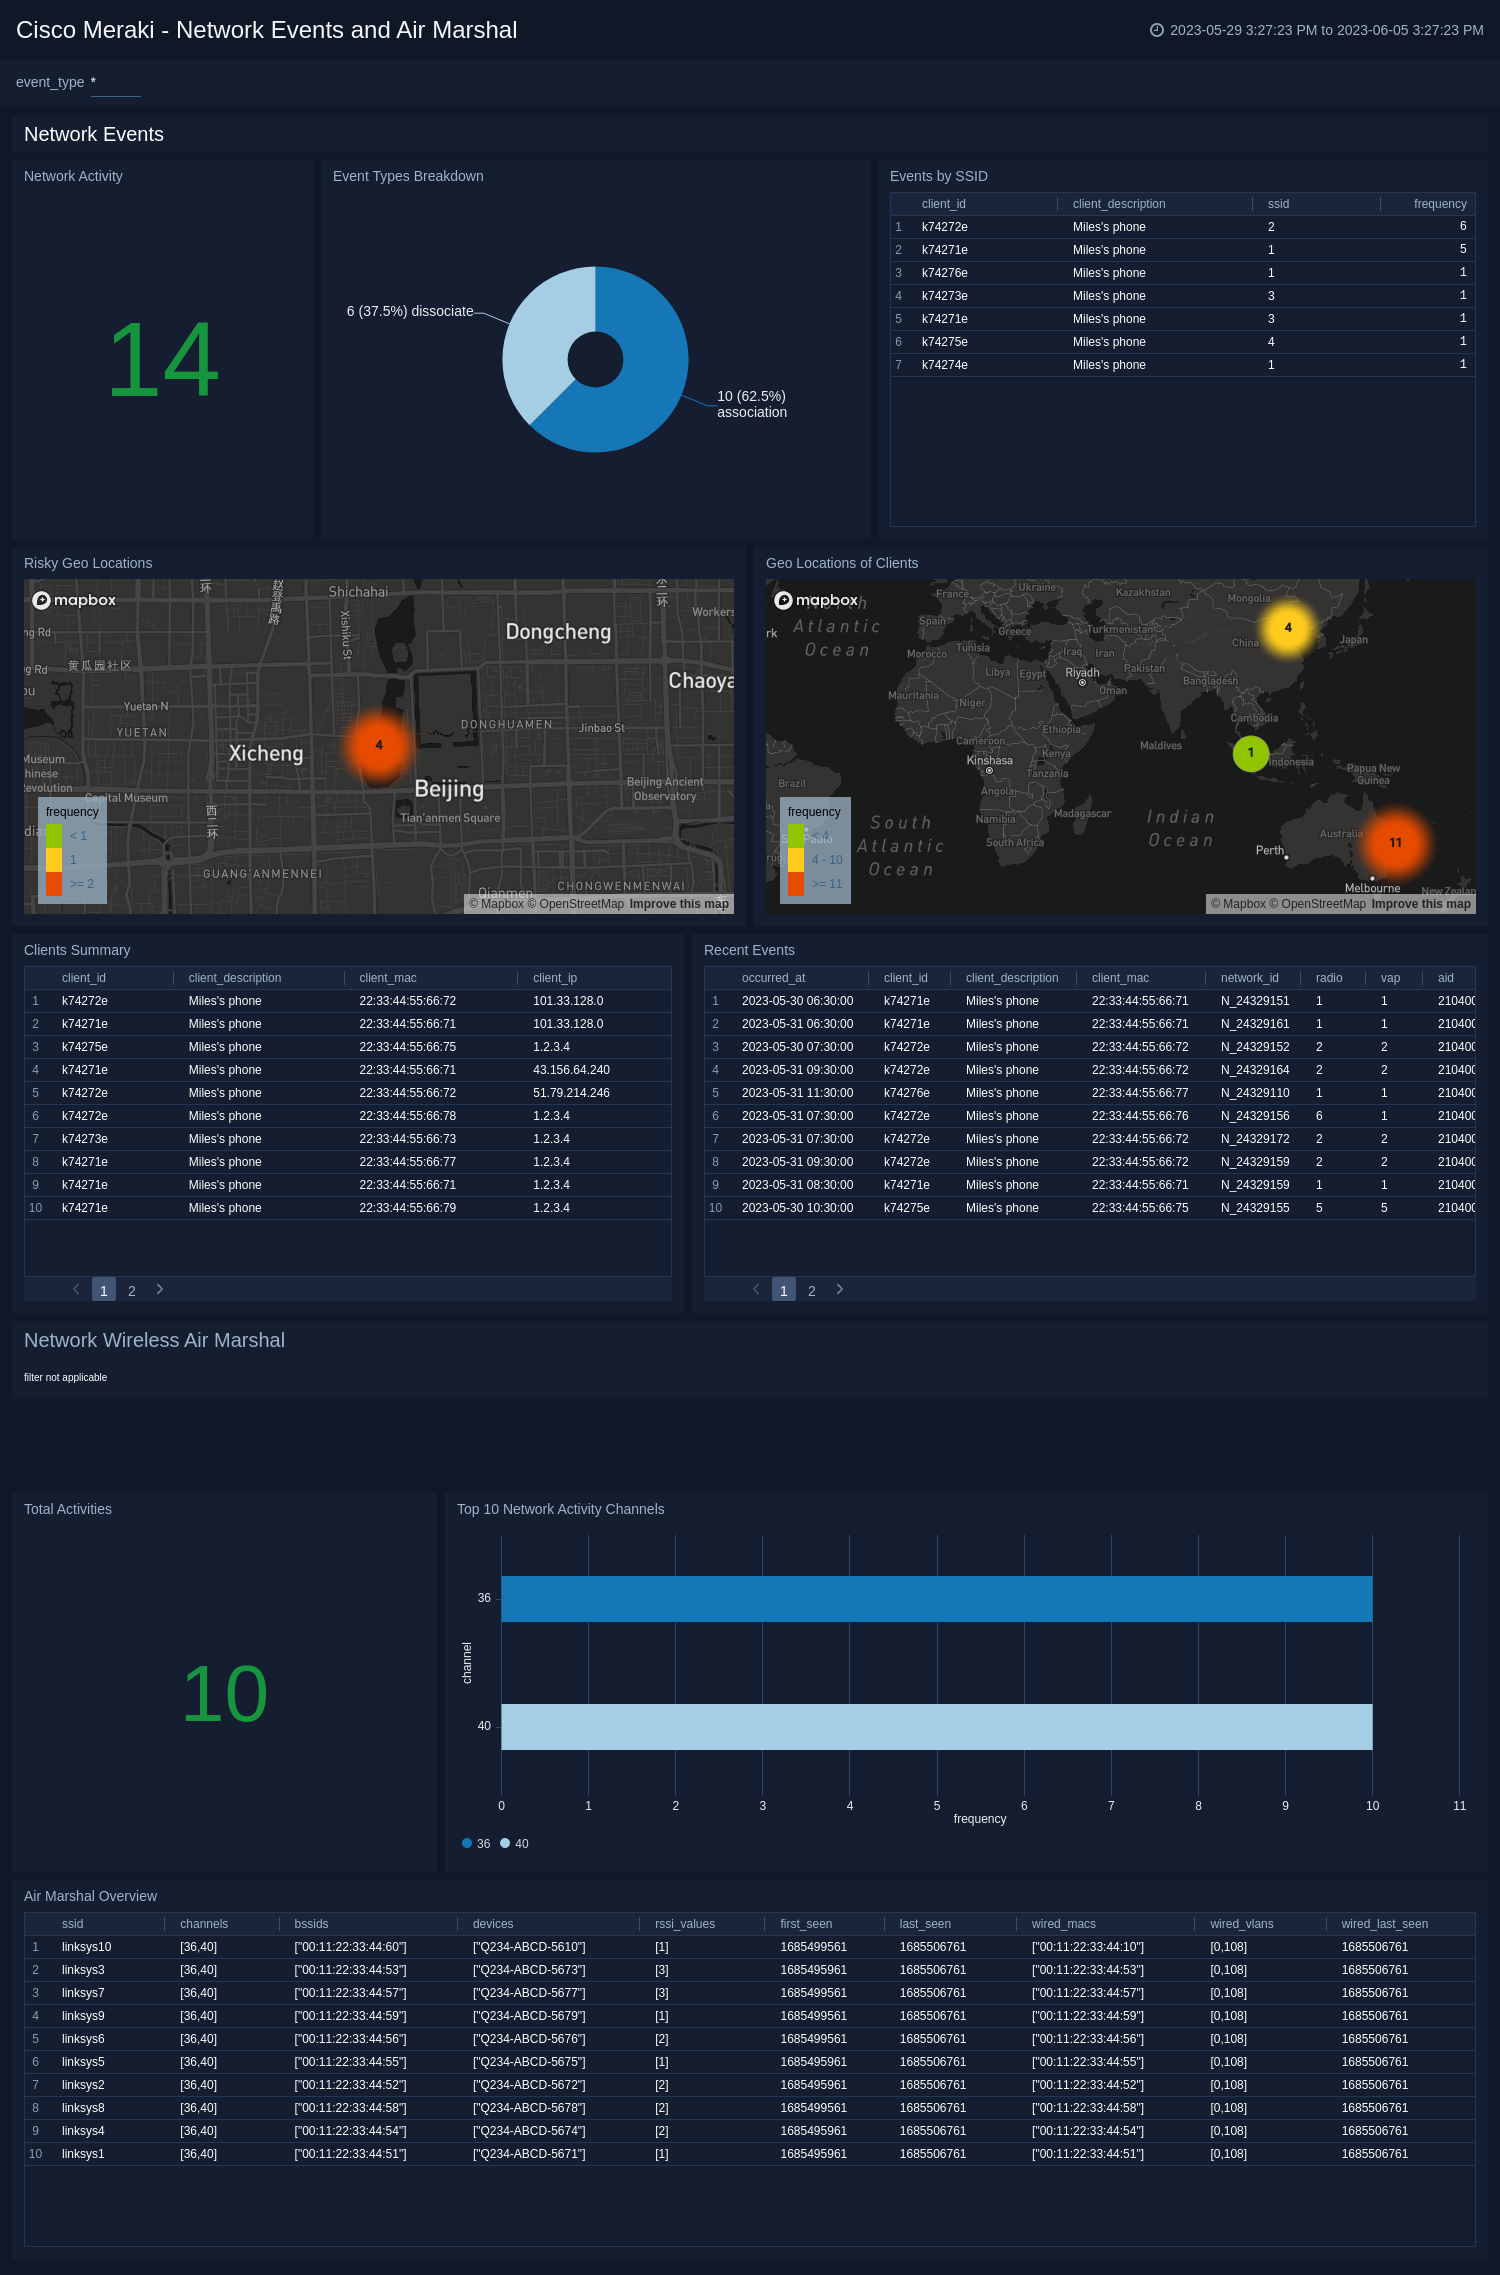
Network Traffic Overview
The Cisco Meraki - Network Traffic Overview dashboard provides a detailed overview of Cisco Meraki network traffic, highlighting application usage, protocol distribution, and port activity. It tracks bandwidth trends and compares sent versus received data to reveal communication patterns. Geographic panels map destination locations and identify high-risk or embargoed regions for compliance awareness. The dashboard also monitors traffic on insecure ports to detect legacy or unencrypted services. Overall, it offers clear visibility into network utilization and security posture. 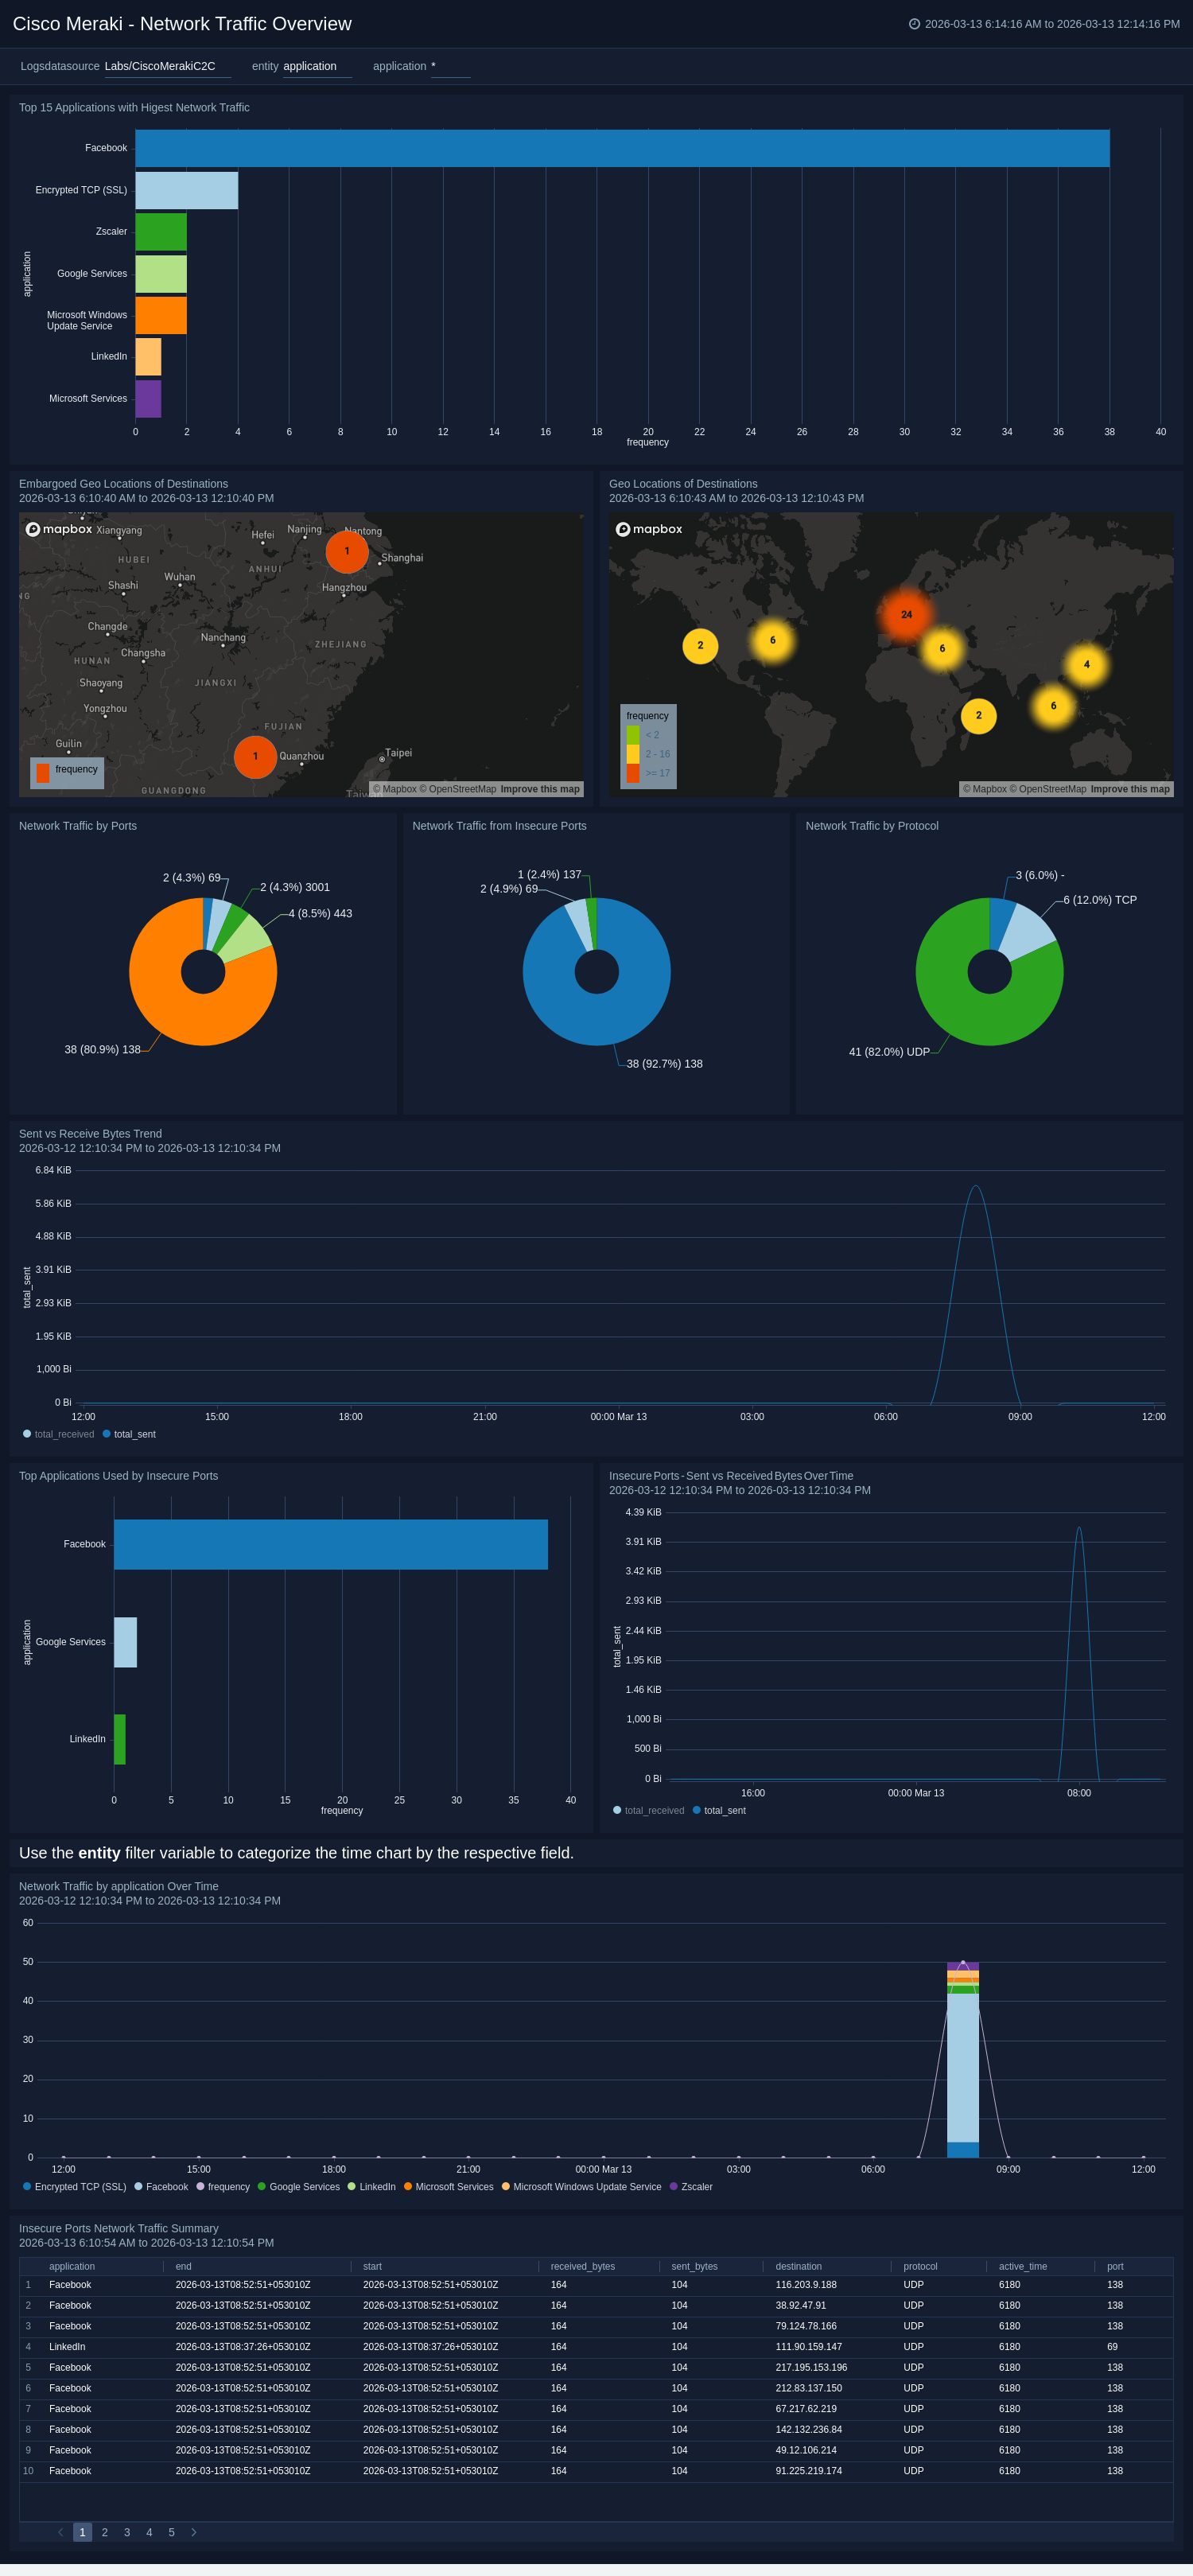
Create monitors for Cisco Meraki C2C app
From your App Catalog:
- From the Sumo Logic navigation, select App Catalog.
- In the Search Apps field, search for and then select your app.
- Make sure the app is installed.
- Navigate to What's Included tab and scroll down to the Monitors section.
- Click Create next to the pre-configured monitors. In the create monitors window, adjust the trigger conditions and notifications settings based on your requirements.
- Scroll down to Monitor Details.
- Under Location click on New Folder.
note
By default, monitor will be saved in the root folder. So to make the maintenance easier, create a new folder in the location of your choice.
- Enter Folder Name. Folder Description is optional.
tip
Using app version in the folder name will be helpful to determine the versioning for future updates.
- Click Create. Once the folder is created, click on Save.
Cisco Meraki C2C Alerts
| Name | Description | Alert Condition |
|---|---|---|
Cisco Meraki - Embargoed Geo Location Of Client | This alert is triggered when data access is detected from client IP addresses located in embargoed or sanctioned regions. This alert ensures compliance with regulations and corporate policies. | Count > 0 |
Cisco Meraki - Embargoed Geo Location Of Destination | This alert is triggered when data access is detected from Destination IP addresses located in embargoed or sanctioned regions. This alert ensures compliance with regulations and corporate policies. | Count > 0 |
Cisco Meraki - Embargoed Geo Location Of Source | This alert is triggered when data access is detected from source IP addresses located in embargoed or sanctioned regions. This alert ensures compliance with regulations and corporate policies. | Count > 0 |
Cisco Meraki - Large Size File Scanned Activity Detected | This alert is triggered when a large volume of file-scanning activity is detected(>500MB) over the network by the client. You can also adjust the threshold as per your requirement. | Count > 0 |
Cisco Meraki - Malicious File Detected | This alert is triggered when a malicious file activity is detected over the network by Cisco Meraki AMP. Investigate immediately to isolate affected endpoints, verify blocking action, and correlate file hash with threat intelligence. | Count > 0 |
Upgrade/Downgrade the Cisco Meraki - C2C app (Optional)
To update the app, do the following:
Next-Gen App: To install or update the app, you must be an account administrator or a user with Manage Apps, Manage Monitors, Manage Fields, Manage Metric Rules, and Manage Collectors capabilities depending upon the different content types part of the app.
- Select App Catalog.
- In the Search Apps field, search for and then select your app.
Optionally, you can identify apps that can be upgraded in the Upgrade available section. - To upgrade the app, select Upgrade from the Manage dropdown.
- If the upgrade does not have any configuration or property changes, you will be redirected to the Preview & Done section.
- If the upgrade has any configuration or property changes, you will be redirected to the Setup Data page.
- In the Configure section of your respective app, complete the following fields.
- Field Name. If you already have collectors and sources set up, select the configured metadata field name (eg _sourcecategory) or specify other custom metadata (eg: _collector) along with its metadata Field Value.
- Click Next. You will be redirected to the Preview & Done section.
Post-update
Your upgraded app will be installed in the Installed Apps folder and dashboard panels will start to fill automatically.
See our Release Notes changelog for new updates in the app.
To revert the app to a previous version, do the following:
- Select App Catalog.
- In the Search Apps field, search for and then select your app.
- To version down the app, select Revert to < previous version of your app > from the Manage dropdown.
Uninstalling the Cisco Meraki - C2C app (Optional)
To uninstall the app, do the following:
- Select App Catalog.
- In the 🔎 Search Apps field, run a search for your desired app, then select it.
- Click Uninstall.