 Meet the new
 CyberArk EPM

The Sumo Logic app for CyberArk EPM provides comprehensive visibility into endpoint privilege management events, policy enforcement outcomes, script activity, administrative audit trails, and user and endpoint risk signals. The app consists of seven predefined dashboards covering overview, administrative audit, application trust, privilege elevation, policy compliance, endpoint risk, and script monitoring.
Log types
This app uses Sumo Logic's CyberArk EPM Source to collect endpoint privilege and policy audit logs from CyberArk EPM.
The app analyzes these event streams:
- Administrative audit events.
- Detailed raw events.
- Aggregated policy audit events.
- Policy audit raw events.
- Aggregated events.
Sample log message
{
  "eventType": "StartElevated",
  "policyAction": "Elevate",
  "policyName": "Allow Approved IT Tools",
  "userName": "jane.doe",
  "userIsAdmin": "false",
  "computerName": "WS-1024",
  "fileName": "powershell.exe",
  "filePath": "C:\\Windows\\System32\\WindowsPowerShell\\v1.0\\powershell.exe",
  "publisher": "Microsoft Corporation",
  "sourceType": "Internet",
  "applicationType": "Executable",
  "arguments": "-ExecutionPolicy Bypass -File install.ps1",
  "lastEventDate": "2026-05-28T14:32:10Z"
}
Sample queries
=Labs/CyberArkEPM eventType StartElevated
| json "eventType", "userName", "computerName", "publisher", "sourceType" as event_type, user_name, computer_name, publisher, source_type nodrop
| where event_type = "StartElevated"
| count
Collection configuration and app installation
Depending on the set up collection method, you can configure and install the app in three ways:
- Create a new collector and install the app. Create a new Sumo Logic Cloud-to-Cloud (C2C) source under a new Sumo Logic Collector and later install the app, or
- Use an existing collector and install the app. Create a new Sumo Logic Cloud-to-Cloud (C2C) source under an existing Sumo Logic Collector and later install the app, or
- Use existing source and install the app. Use your existing configured Sumo Logic Cloud-to-Cloud (C2C) source and install the app.
Use the Cloud-to-Cloud Integration for CyberArk EPM to create the source and use the same source category while installing the app. By following these steps, you can ensure that your CyberArk EPM app is properly integrated and configured to collect and analyze your CyberArk EPM data.
Create a new collector and install the app
To set up collection and install the app, do the following:
Next-Gen App: To install or update the app, you must be an account administrator or a user with Manage Apps, Manage Monitors, Manage Fields, Manage Metric Rules, and Manage Collectors capabilities depending upon the different content types part of the app.
- Select App Catalog.
- In the 🔎 Search Apps field, run a search for your desired app, then select it.
- Click Install App.
note
Sometimes this button says Add Integration.
- In the Set Up Collection section of your respective app, select Create a new Collector.
- Collector Name. Enter a Name to display the Source in the Sumo Logic web application. The description is optional.
- Timezone. Set the default time zone when it is not extracted from the log timestamp. Time zone settings on Sources override a Collector time zone setting.
- (Optional) Metadata. Click the +Add Metadata link to add a custom log Metadata Fields. Define the fields you want to associate, each metadata field needs a name (key) and value.
 A green circle with a checkmark is shown when the field exists and is enabled in the Fields table schema.
 An orange triangle with an exclamation point is shown when the field doesn't exist, or is disabled in the Fields table schema. In this case, you'll see an option to automatically add or enable the nonexistent fields to the Fields table schema. If a field is sent to Sumo Logic but isn’t present or enabled in the schema, it’s ignored and marked as Dropped.
- Click Next.
- Configure the source as specified in the
Infobox above, ensuring all required fields are included. - In the Configure section of your respective app, complete the following fields.
- Field Name. If you already have collectors and sources set up, select the configured metadata field name (eg _sourcecategory) or specify other custom metadata (eg: _collector) along with its metadata Field Value.
- Click Next. You will be redirected to the Preview & Done section.
Post-installation
Once your app is installed, it will appear in your Installed Apps folder, and dashboard panels will start to fill automatically.
Each panel slowly fills with data matching the time range query received since the panel was created. Results will not immediately be available but will be updated with full graphs and charts over time.
Use an existing collector and install the app
To set up the source in the existing collector and install the app, do the following:
Next-Gen App: To install or update the app, you must be an account administrator or a user with Manage Apps, Manage Monitors, Manage Fields, Manage Metric Rules, and Manage Collectors capabilities depending upon the different content types part of the app.
- Select App Catalog.
- In the 🔎 Search Apps field, run a search for your desired app, then select it.
- Click Install App.
note
Sometimes this button says Add Integration.
- In the Set Up Collection section of your respective app, select Use an existing Collector.
- From the Select Collector dropdown, select the collector that you want to set up your source with and click Next.
- Configure the source as specified in the
Infobox above, ensuring all required fields are included. - In the Configure section of your respective app, complete the following fields.
- Field Name. If you already have collectors and sources set up, select the configured metadata field name (eg _sourcecategory) or specify other custom metadata (eg: _collector) along with its metadata Field Value.
- Click Next. You will be redirected to the Preview & Done section.
Post-installation
Once your app is installed, it will appear in your Installed Apps folder, and dashboard panels will start to fill automatically.
Each panel slowly fills with data matching the time range query received since the panel was created. Results will not immediately be available but will be updated with full graphs and charts over time.
Use an existing source and install the app
To skip collection and only install the app, do the following:
Next-Gen App: To install or update the app, you must be an account administrator or a user with Manage Apps, Manage Monitors, Manage Fields, Manage Metric Rules, and Manage Collectors capabilities depending upon the different content types part of the app.
- Select App Catalog.
- In the 🔎 Search Apps field, run a search for your desired app, then select it.
- Click Install App.
note
Sometimes this button says Add Integration.
- In the Set Up Collection section of your respective app, select Skip this step and use existing source and click Next.
- In the Configure section of your respective app, complete the following fields.
- Field Name. If you already have collectors and sources set up, select the configured metadata field name (eg _sourcecategory) or specify other custom metadata (eg: _collector) along with its metadata Field Value.
- Click Next. You will be redirected to the Preview & Done section.
Post-installation
Once your app is installed, it will appear in your Installed Apps folder, and dashboard panels will start to fill automatically.
Each panel slowly fills with data matching the time range query received since the panel was created. Results will not immediately be available but will be updated with full graphs and charts over time.
Viewing CyberArk EPM dashboards
All dashboards have a set of filters that you can apply to the entire dashboard. Use these filters to drill down and examine the data to a granular level.
- You can change the time range for a dashboard or panel by selecting a predefined interval from a drop-down list, choosing a recently used time range, or specifying custom dates and times. Learn more.
- You can use template variables to drill down and examine the data on a granular level. For more information, see Filtering Dashboards with Template Variables.
- Most Next-Gen apps allow you to provide the scope at the installation time and are comprised of a key (
_sourceCategoryby default) and a default value for this key. Based on your input, the app dashboards will be parameterized with a dashboard variable, allowing you to change the dataset queried by all panels. This eliminates the need to create multiple copies of the same dashboard with different queries.
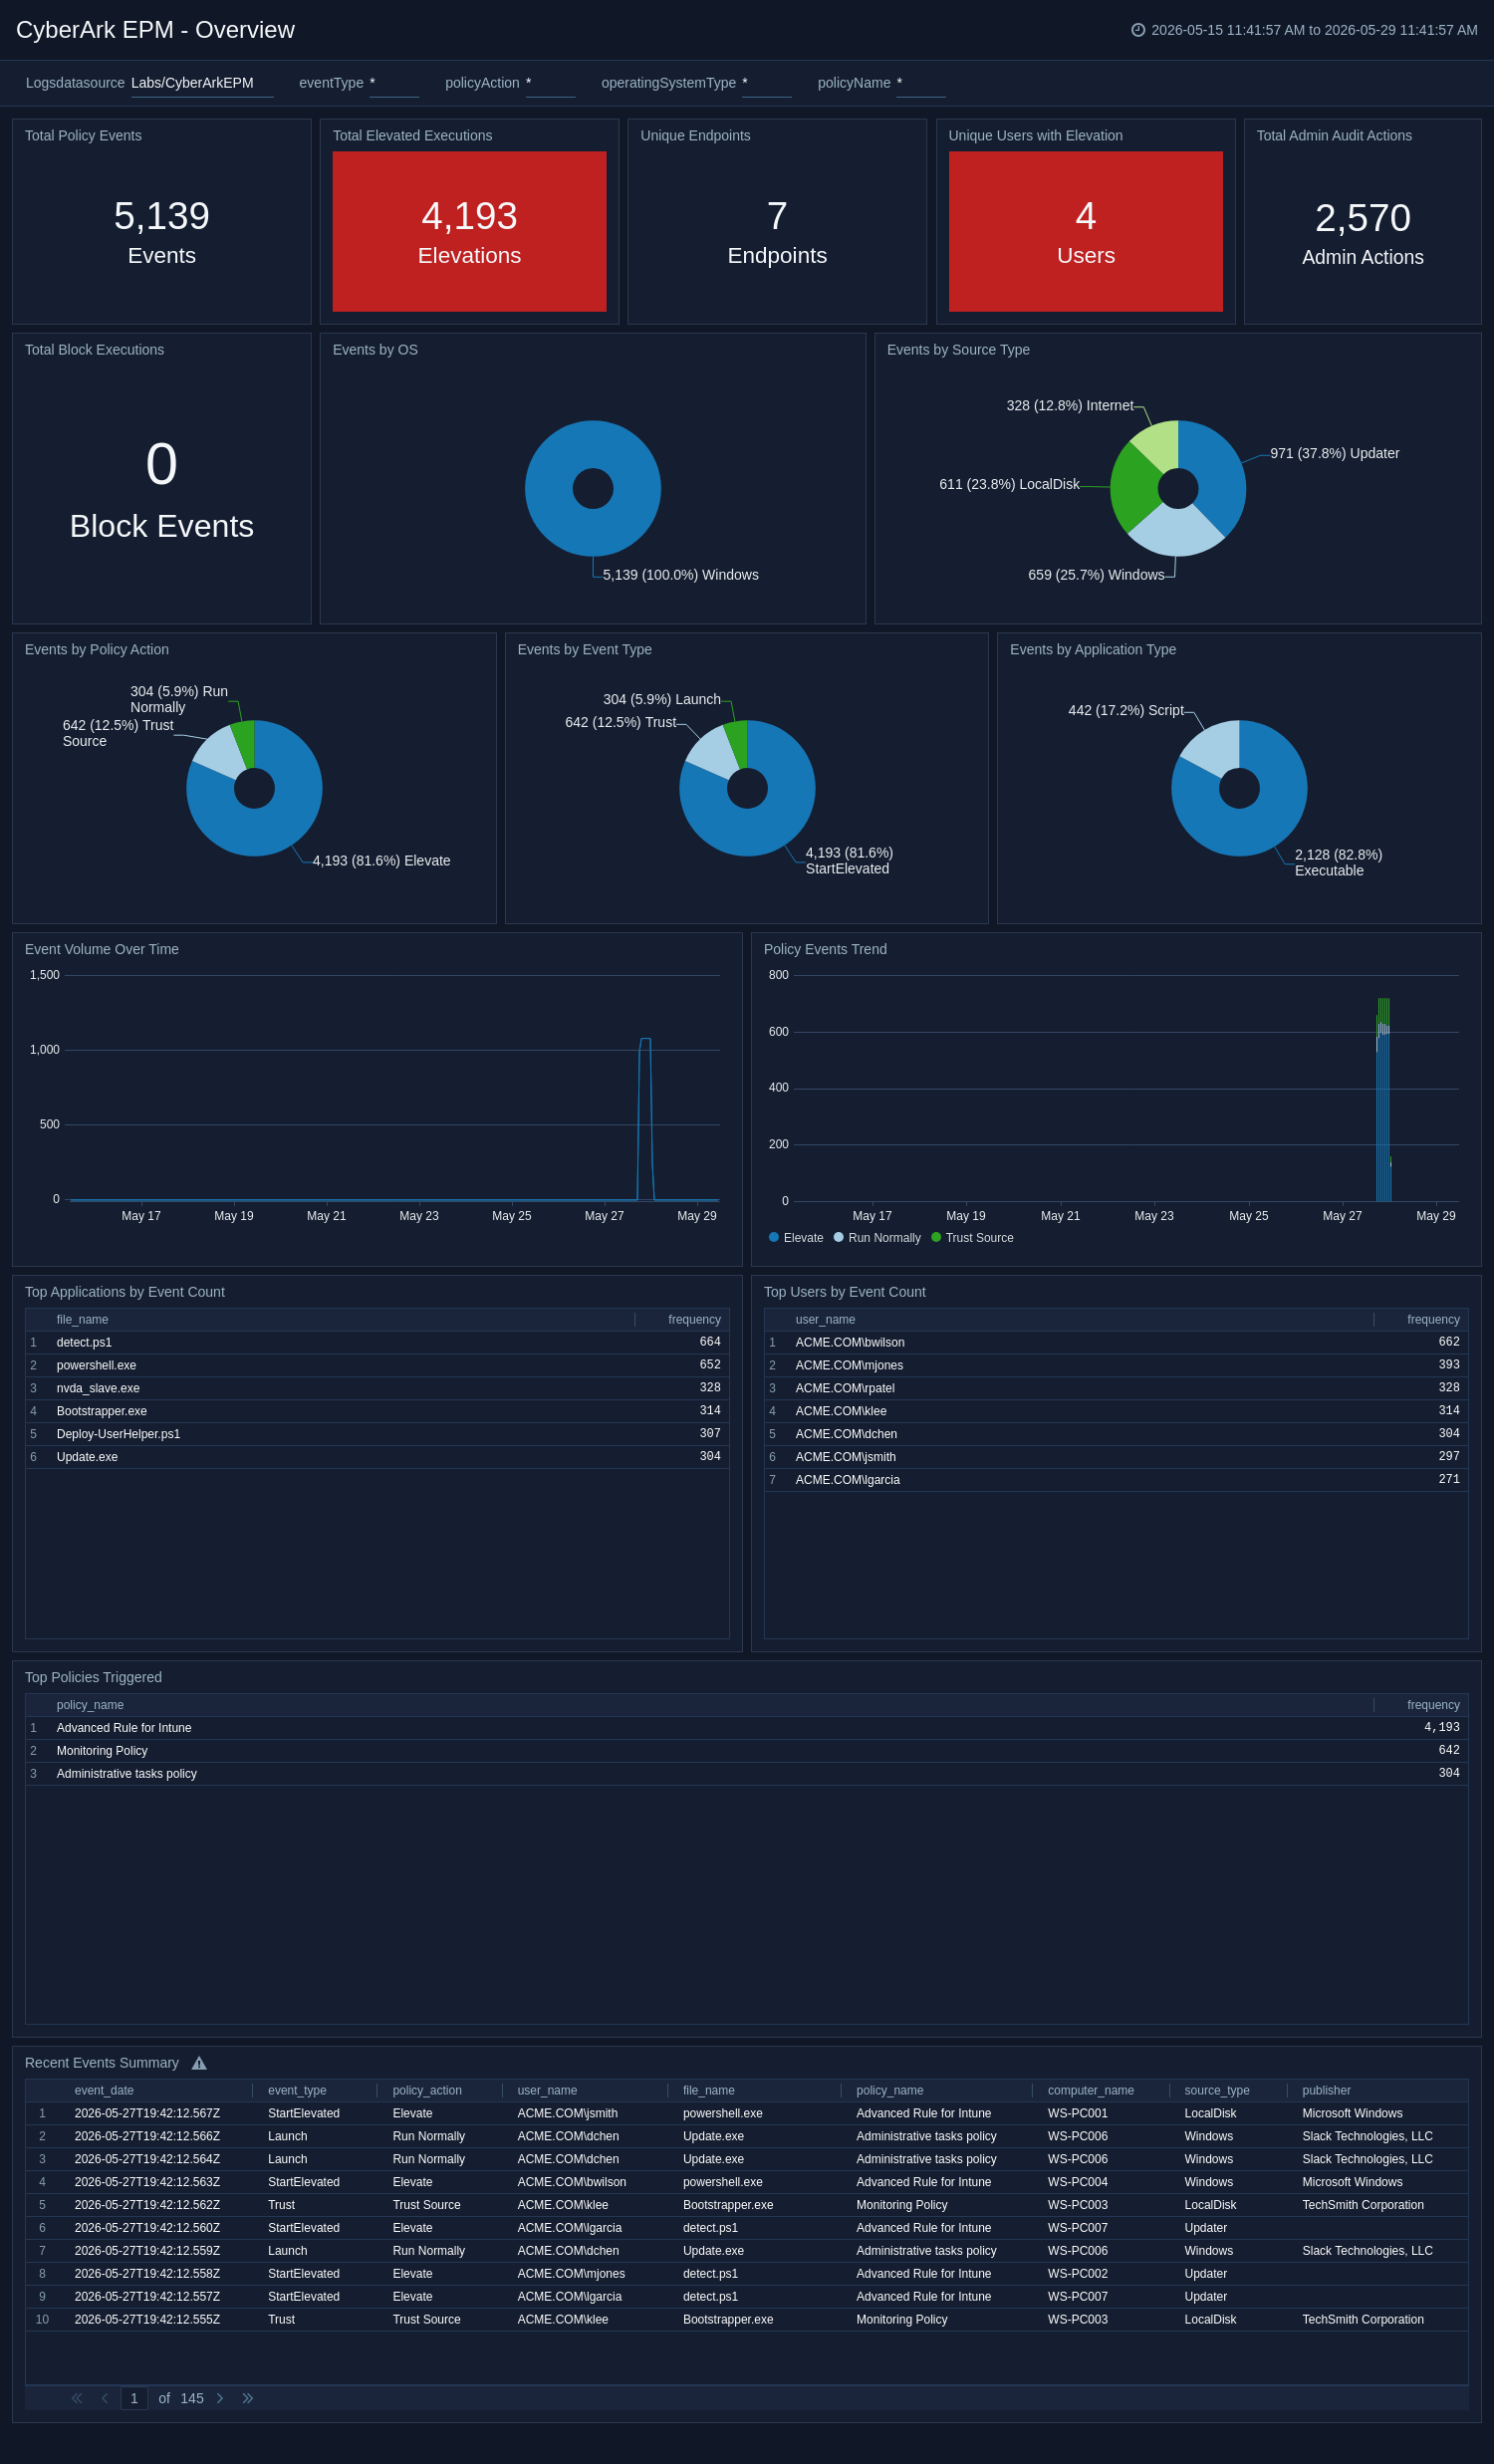
Overview
The CyberArk EPM - Overview dashboard provides a high-level security posture view of all EPM activity across log types, including total events, policy actions, event type distribution, application types, source types, event volume trends, and top users and applications.
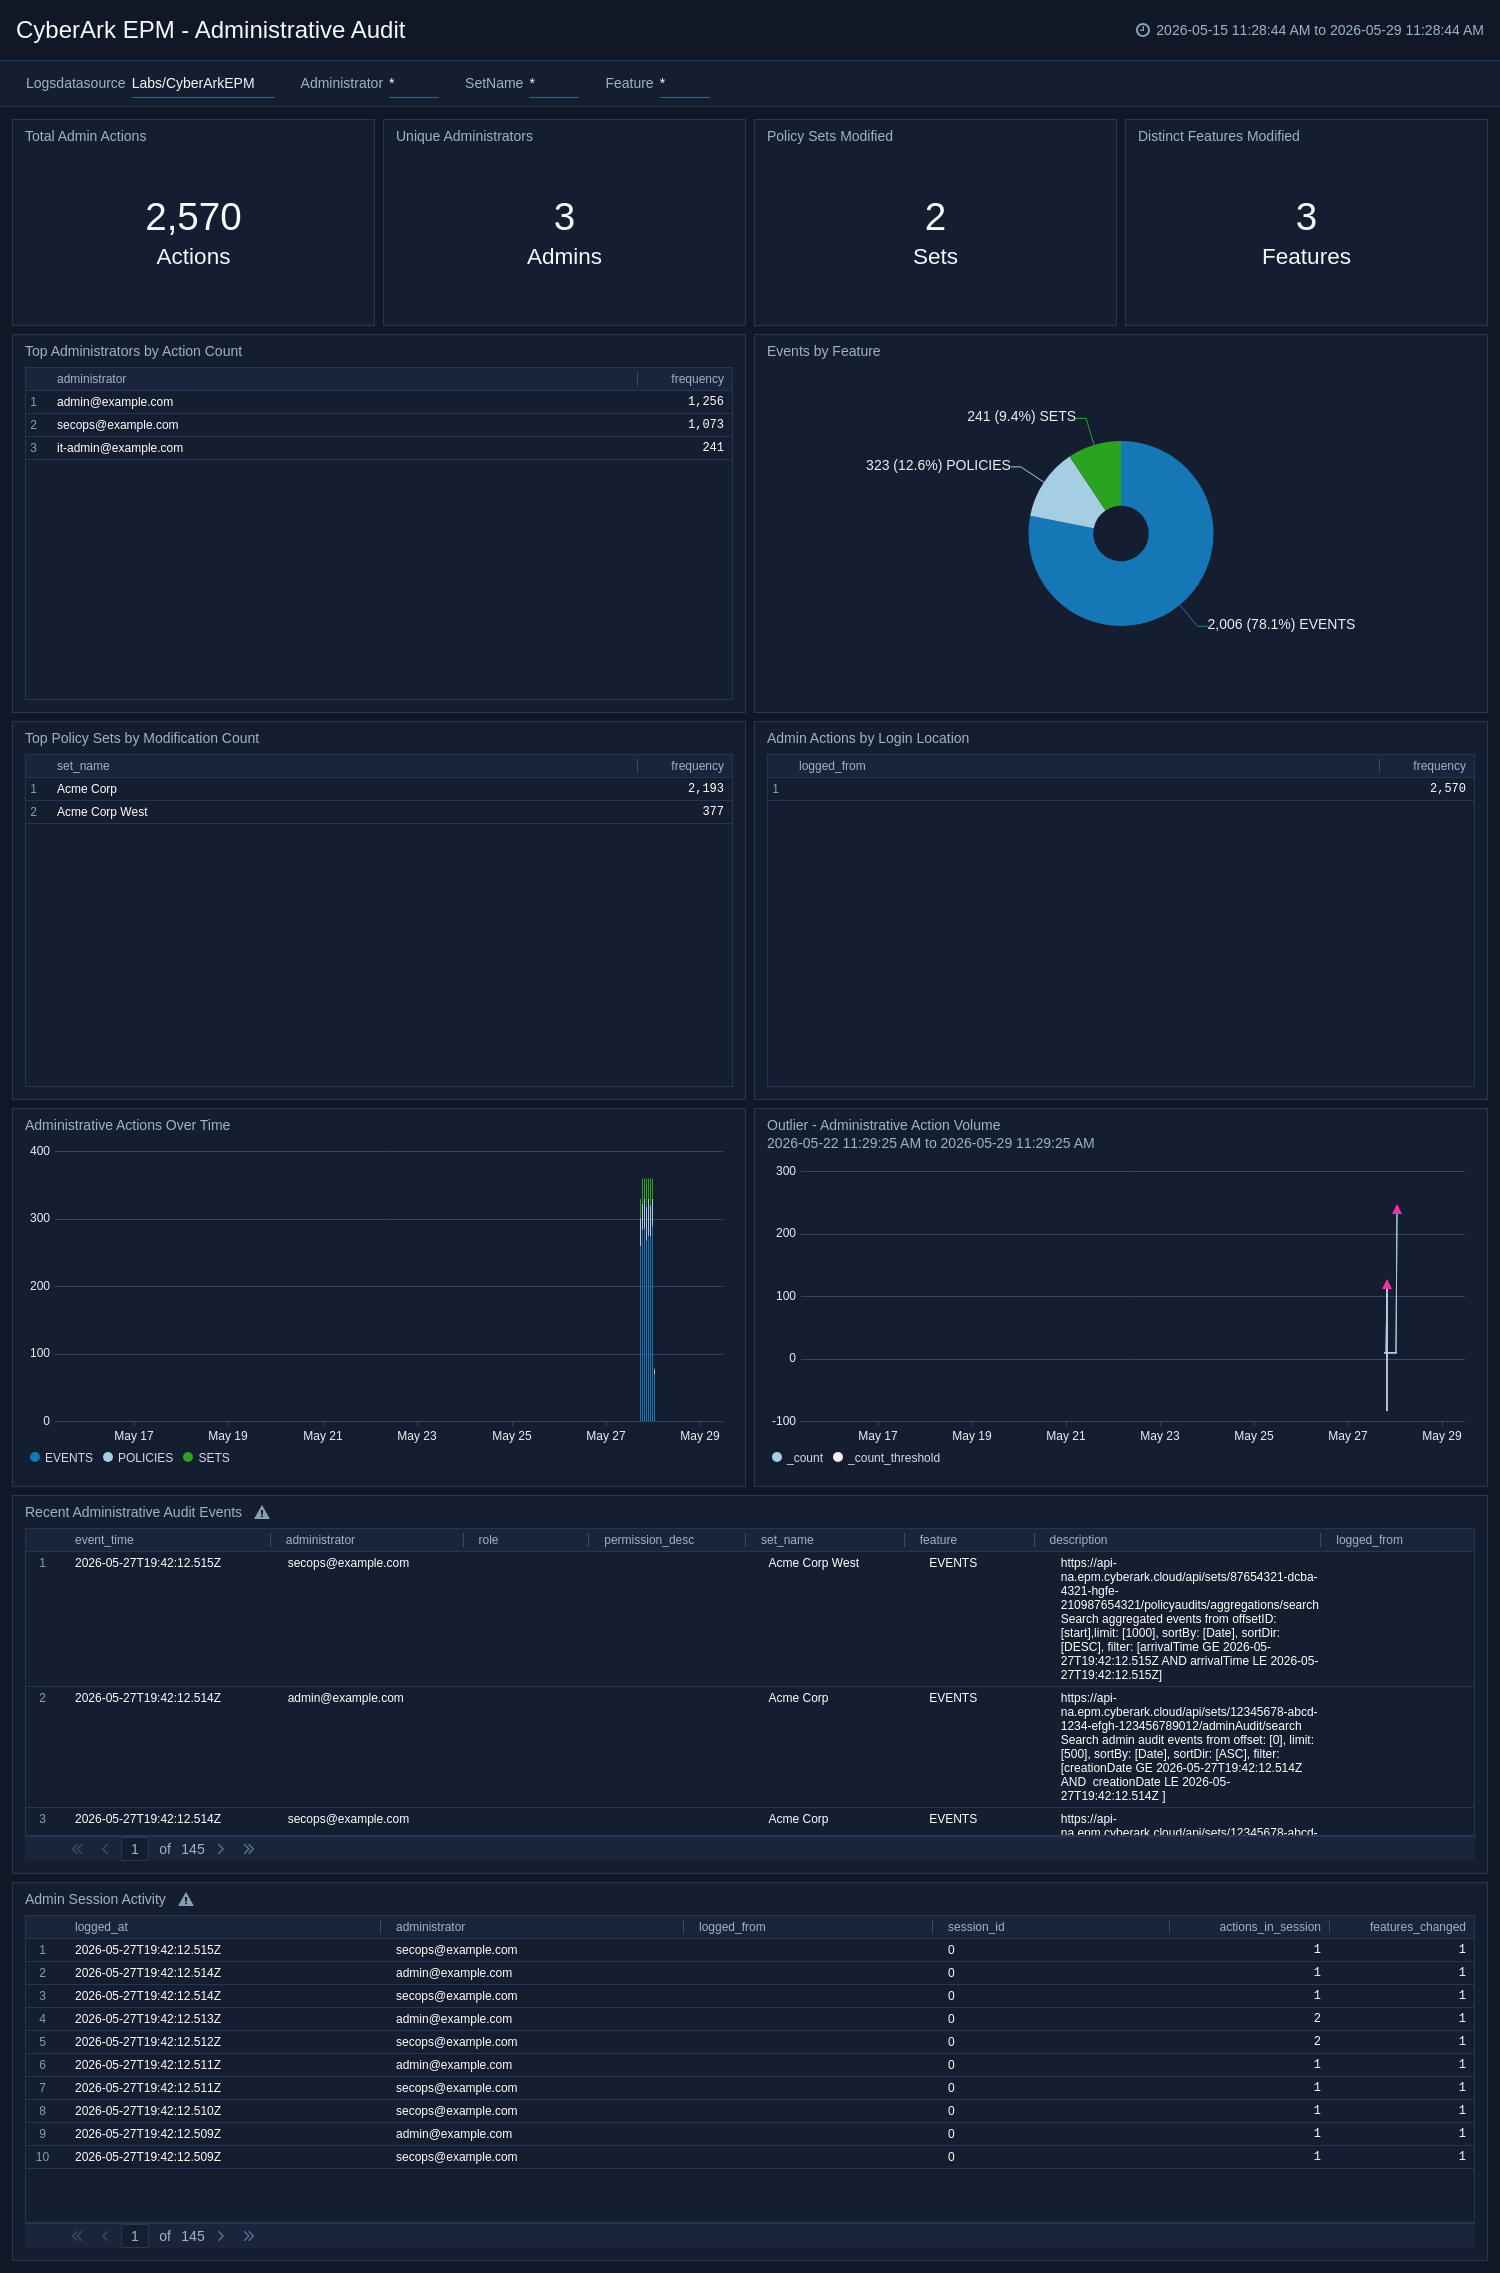
Administrative Audit
The CyberArk EPM - Administrative Audit dashboard monitors administrative actions in the CyberArk EPM console, tracks policy set changes and role-based access modifications, and provides visibility into who makes configuration changes and from where.
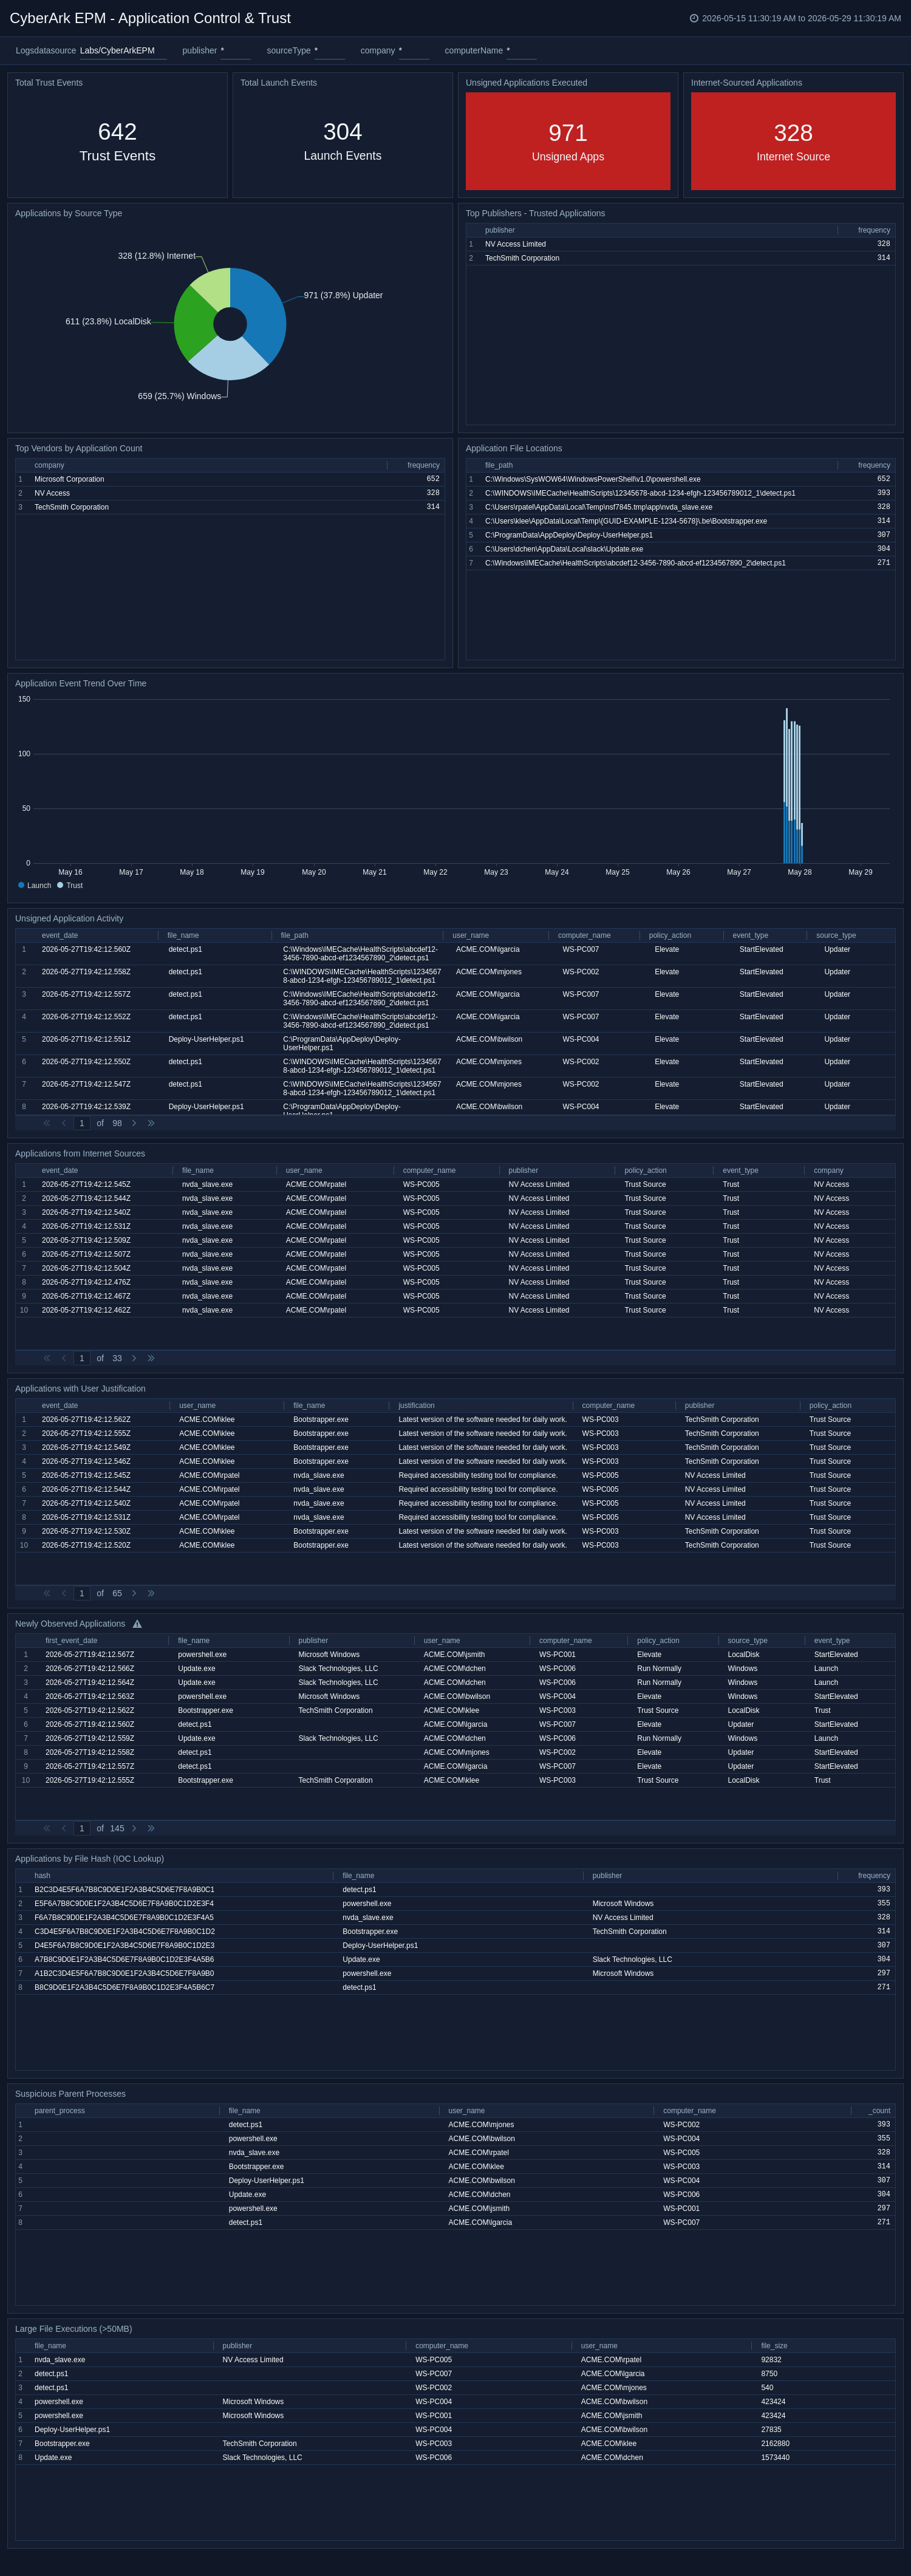
Application Control & Trust
The CyberArk EPM - Application Control & Trust dashboard monitors application trust decisions, tracks software from untrusted sources, identifies unsigned or unknown applications being executed, and detects newly introduced software across endpoints.
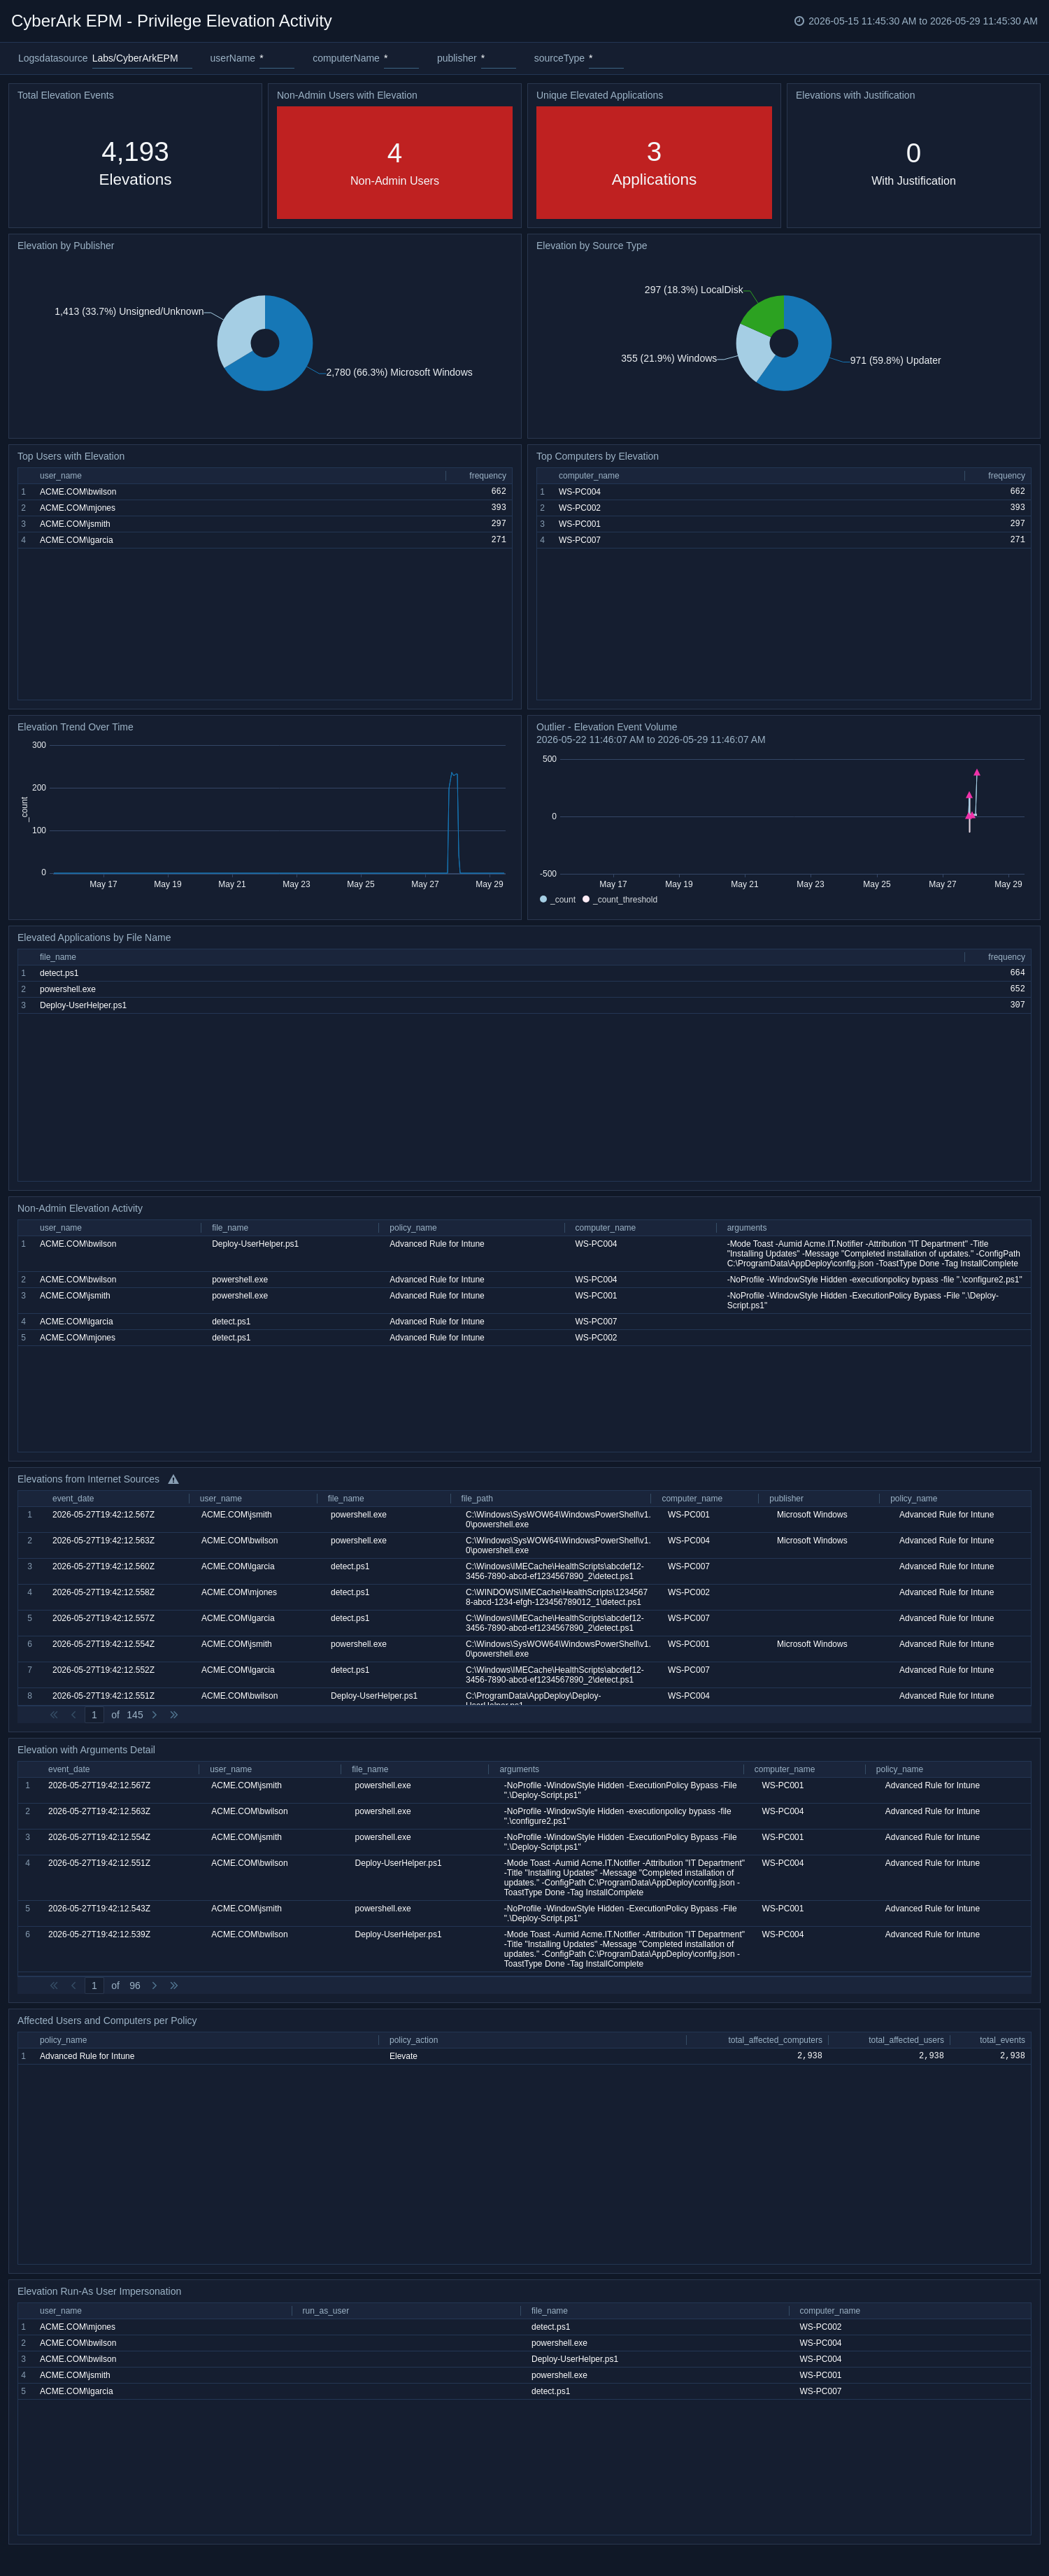
Privilege Elevation Activity
The CyberArk EPM - Privilege Elevation Activity dashboard provides deep visibility into privilege elevation activity, including who is elevating, which applications are elevated, source and publisher context, non-admin escalation patterns, and unusual elevation spikes.
Policy Enforcement & Compliance
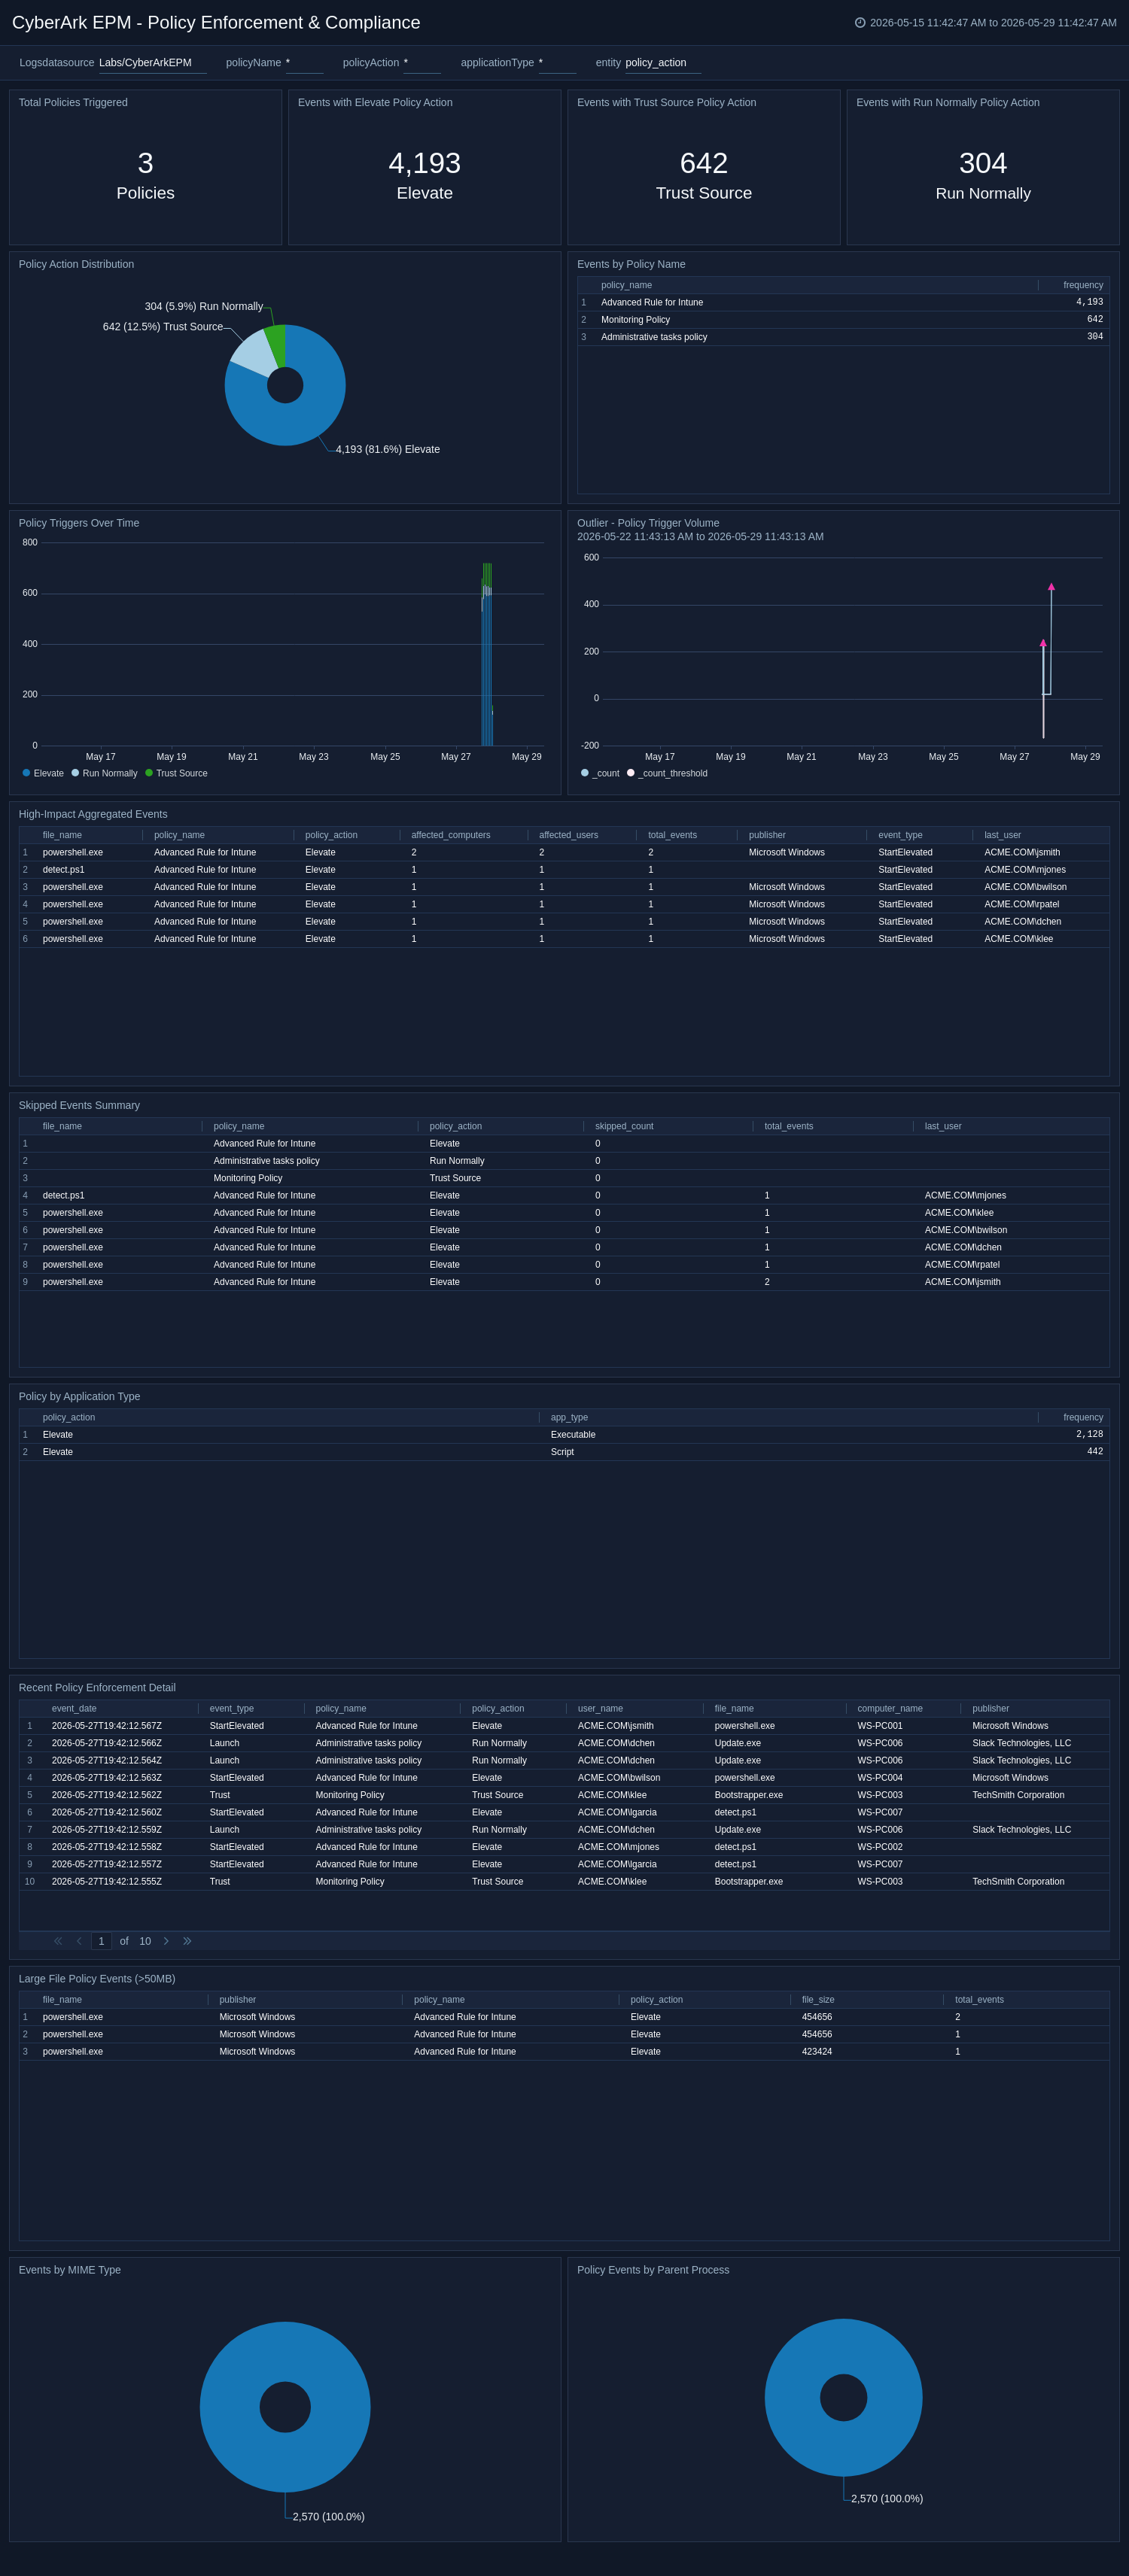
The CyberArk EPM - Policy Enforcement & Compliance dashboard monitors policy effectiveness, identifies enforcement gaps, tracks policy action behavior, and surfaces high-impact aggregated events that affect many users or endpoints.
Endpoint and User Risk Analysis
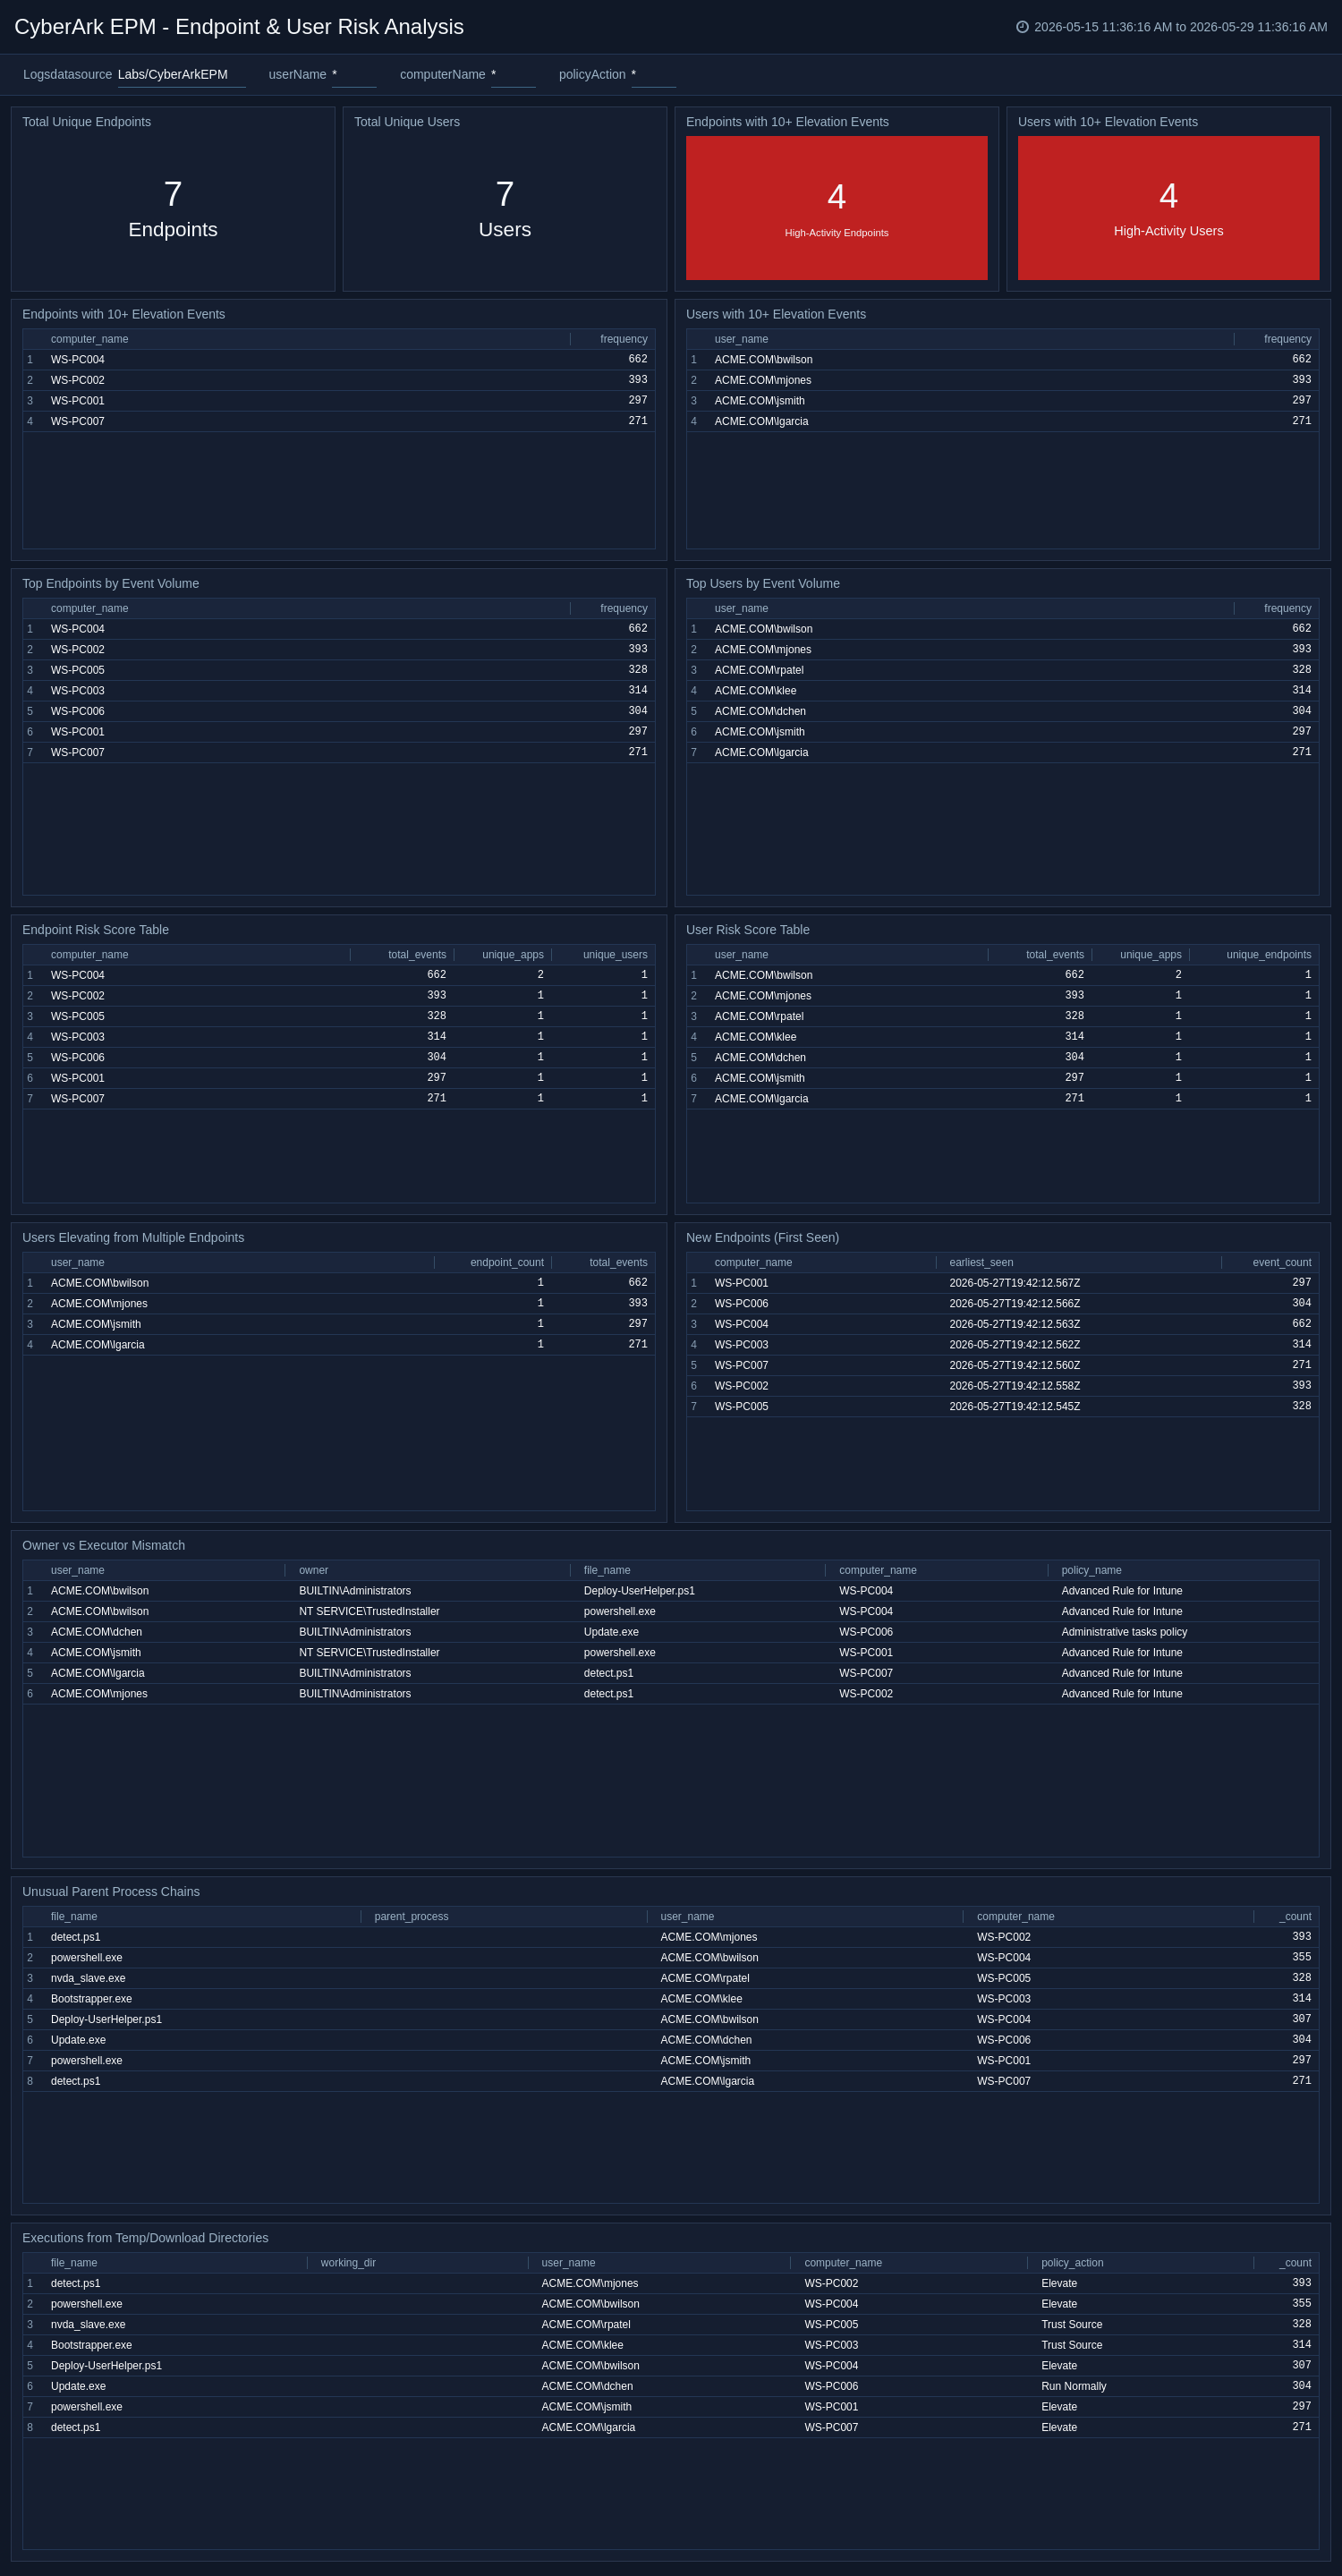
The CyberArk EPM - Endpoint & User Risk Analysis dashboard identifies high-risk endpoints and users based on event volume, diversity of applications elevated, lateral movement indicators, and anomalous behavior to support investigation and threat hunting.
Script and PowerShell Monitoring
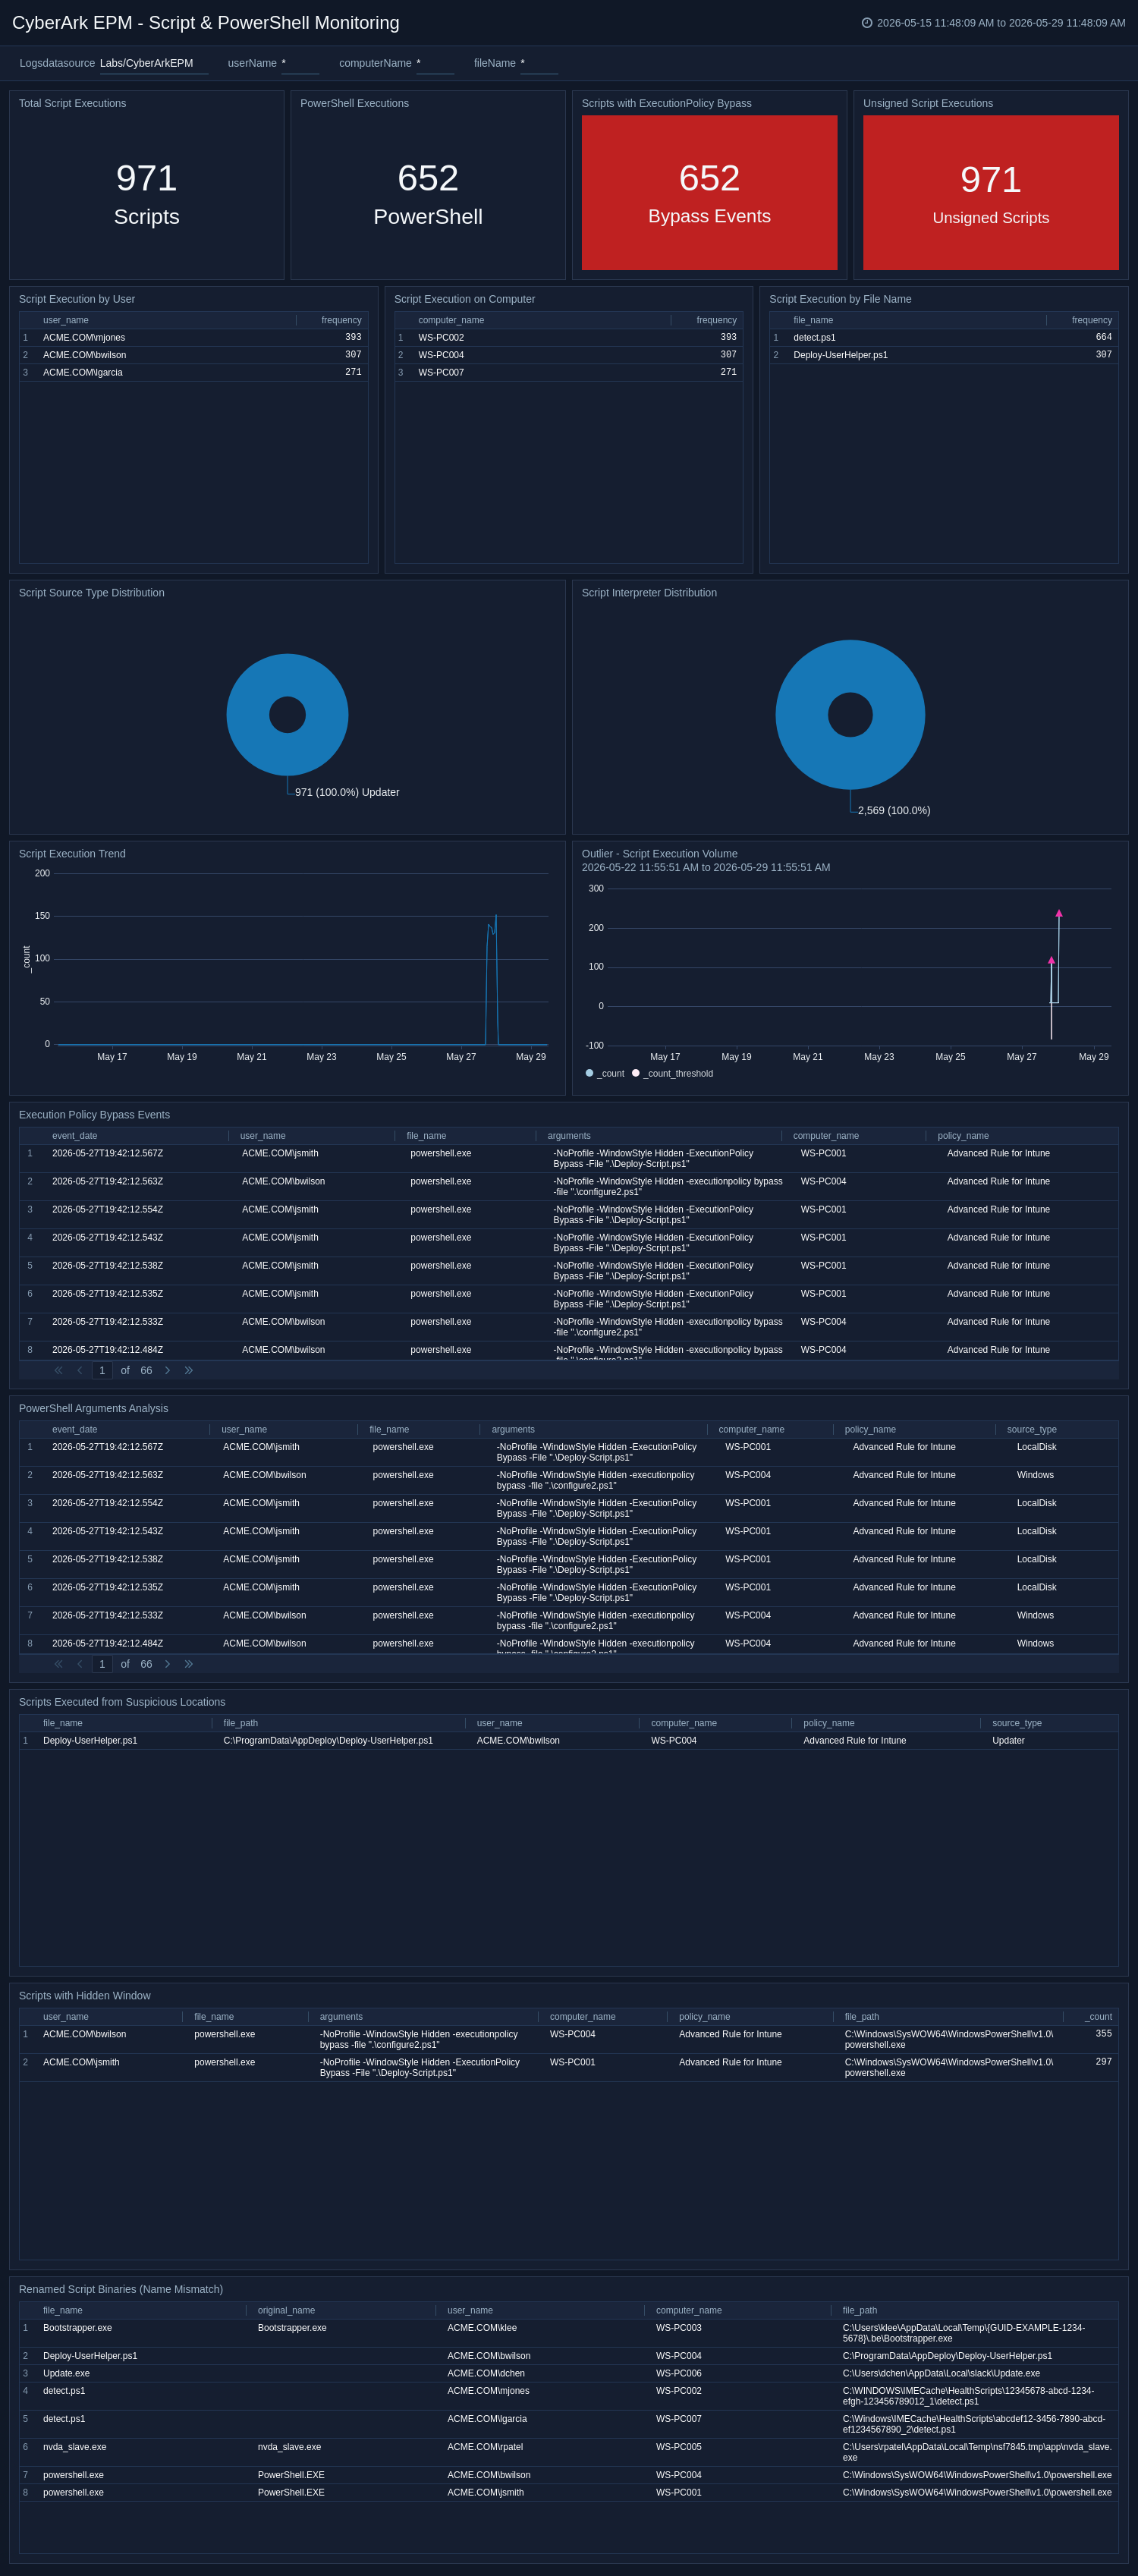
The CyberArk EPM - Script & PowerShell Monitoring dashboard focuses on script execution activity, especially PowerShell, and helps detect execution policy bypass attempts, suspicious arguments, unusual script locations, hidden-window evasion, and unsigned script execution.
Create monitors for the CyberArk EPM app
From your App Catalog:
- From the Sumo Logic navigation, select App Catalog.
- In the Search Apps field, search for and then select your app.
- Make sure the app is installed.
- Navigate to What's Included tab and scroll down to the Monitors section.
- Click Create next to the pre-configured monitors. In the create monitors window, adjust the trigger conditions and notifications settings based on your requirements.
- Scroll down to Monitor Details.
- Under Location click on New Folder.
note
By default, monitor will be saved in the root folder. So to make the maintenance easier, create a new folder in the location of your choice.
- Enter Folder Name. Folder Description is optional.
tip
Using app version in the folder name will be helpful to determine the versioning for future updates.
- Click Create. Once the folder is created, click on Save.
CyberArk EPM app alerts
| Name | Description | Alert Condition | Recover Condition |
|---|---|---|---|
CyberArk EPM - High-Impact Aggregated Events | This alert is triggered when aggregated policy events affect many users or endpoints. This may indicate broad policy impact, rapid propagation of risky behavior, or large-scale activity that needs immediate review. | Count > 0 | Count < = 0 |
CyberArk EPM - Scripts Executed from Suspicious Locations | This alert is triggered when scripts are executed from unusual directories outside standard Windows or Program Files paths. This may indicate evasive script execution or malicious tooling staged in non-standard locations. | Count > 0 | Count < = 0 |
CyberArk EPM - Suspicious Parent Processes Event | This alert is triggered when process launches are associated with uncommon parent processes instead of typical system parents. This may indicate abnormal process chains or potential abuse of scripting and command interpreters. | Count > 0 | Count < = 0 |
CyberArk EPM - Unsigned Application Activity | This alert is triggered when unsigned or unknown applications execute in your environment. This may indicate unauthorized software, untrusted binaries, or potential malware activity. | Count > 0 | Count < = 0 |
CyberArk EPM - Users Elevating from Multiple Endpoints | This alert is triggered when a user performs elevation activity across multiple endpoints in the monitor window. This may indicate credential misuse, lateral movement, or unusual operational behavior. | Total events > 0 | Total events < = 0 |
CyberArk EPM - Execution Policy Bypass Events | This alert is triggered when script execution arguments include Execution Policy bypass patterns. This may indicate an attempt to circumvent script controls and should be investigated for malicious intent. | Count > 0 | Count < = 0 |
CyberArk EPM - Elevation Run-As User Impersonation | This alert is triggered when elevated processes run under a different account than the initiating user. This may indicate impersonation behavior, privilege misuse, or unauthorized account context switching. | Count > 0 | Count < = 0 |
Upgrade/Downgrade the CyberArk EPM app (Optional)
To update the app, do the following:
Next-Gen App: To install or update the app, you must be an account administrator or a user with Manage Apps, Manage Monitors, Manage Fields, Manage Metric Rules, and Manage Collectors capabilities depending upon the different content types part of the app.
- Select App Catalog.
- In the Search Apps field, search for and then select your app.
Optionally, you can identify apps that can be upgraded in the Upgrade available section. - To upgrade the app, select Upgrade from the Manage dropdown.
- If the upgrade does not have any configuration or property changes, you will be redirected to the Preview & Done section.
- If the upgrade has any configuration or property changes, you will be redirected to the Setup Data page.
- In the Configure section of your respective app, complete the following fields.
- Field Name. If you already have collectors and sources set up, select the configured metadata field name (eg _sourcecategory) or specify other custom metadata (eg: _collector) along with its metadata Field Value.
- Click Next. You will be redirected to the Preview & Done section.
Post-update
Your upgraded app will be installed in the Installed Apps folder and dashboard panels will start to fill automatically.
See our Release Notes changelog for new updates in the app.
To revert the app to a previous version, do the following:
- Select App Catalog.
- In the Search Apps field, search for and then select your app.
- To version down the app, select Revert to < previous version of your app > from the Manage dropdown.
Uninstalling the CyberArk EPM app (Optional)
To uninstall the app, do the following:
- Select App Catalog.
- In the 🔎 Search Apps field, run a search for your desired app, then select it.
- Click Uninstall.