JumpCloud Directory Insights
The Sumo Logic app for JumpCloud Directory Insights provides comprehensive visibility into user activities, authentication events, and security actions within the JumpCloud-managed environment. By using JumpCloud Directory Insights logs, this app enables IT administrators and security analysts to monitor access, detect anomalies, and respond to security threats efficiently.
With pre-configured dashboards, the app delivers insights into user authentication trends, directory modifications, policy enforcement, and security incidents. Analysts can track failed login attempts, changes to privileged access, and account lockouts in real time to improve security and ensure compliance with organizational policies.
This app includes built-in monitors. For details on creating custom monitors, refer to the Create monitors for JumpCloud Directory Insights app.
Log types
This app uses Sumo Logic’s JumpCloud Directory Insights Source to collect the logs from the JumpCloud Directory Insights platform.
Sample log message
Event Log
[
    {
        "initiated_by": {
            "id": "64949312a2930fd2c93b2667",
            "type": "admin",
            "email": "soaklander@sumologic.com"
        },
        "geoip": {
            "country_code": "US",
            "timezone": "America/Los_Angeles",
            "latitude": 37.7797,
            "continent_code": "NA",
            "region_name": "California",
            "longitude": -122.4159,
            "region_code": "CA"
        },
        "resource": {
            "displayName": "Sumo Logic",
            "id": "64949312a2930fd2c93b2669",
            "type": "organization"
        },
        "changes": [
            {
                "field": "customer",
                "to": false
            },
            {
                "field": "displayName",
                "to": "Sumo Logic"
            },
            {
                "field": "features",
                "to": {
                    "systemInsights": {
                        "enableNewLinux": true,
                        "enableNewWindows": true,
                        "createdAt": "2023-06-22T18:29:38.966Z",
                        "enableNewDarwin": true,
                        "enabled": true,
                        "updatedAt": "2023-06-22T18:29:38.966Z"
                    },
                    "directoryInsightsPremium": {
                        "createdAt": "2023-06-22T18:29:38.967Z",
                        "enabled": false,
                        "updatedAt": "2023-06-22T18:29:38.967Z"
                    }
                }
            },
            {
                "field": "id",
                "to": "64949312a2930fd2c93b2669"
            },
            {
                "field": "logoUrl",
                "to": null
            },
            {
                "field": "maxSystemUsers",
                "to": 10
            },
            {
                "field": "settings.contactEmail",
                "to": "soaklander@sumologic.com"
            },
            {
                "field": "settings.contactName",
                "to": "Siri Oaklander"
            },
            {
                "field": "settings.deviceIdentificationEnabled",
                "to": false
            },
            {
                "field": "settings.disableGoogleLogin",
                "to": false
            },
            {
                "field": "settings.enableManagedUID",
                "to": false
            },
            {
                "field": "settings.enableUserPortalAgentInstall",
                "to": false
            },
            {
                "field": "settings.name",
                "to": "Sumo Logic"
            },
            {
                "field": "settings.newSystemUserStateDefaults",
                "to": {
                    "applicationImport": "STAGED",
                    "manualEntry": "STAGED",
                    "csvImport": "STAGED"
                }
            },
            {
                "field": "settings.passwordPolicy",
                "to": {
                    "minLength": 8,
                    "minChangePeriodInDays": 0,
                    "enableResetLockoutCounter": false,
                    "enablePasswordExpirationInDays": false,
                    "enableMaxHistory": false,
                    "enableDaysAfterExpirationToSelfRecover": true,
                    "enableMaxLoginAttempts": true,
                    "needsSymbolic": true,
                    "daysAfterExpirationToSelfRecover": -1,
                    "needsNumeric": true,
                    "needsUppercase": true,
                    "enableMinLength": true,
                    "enableRecoveryEmail": false,
                    "resetLockoutCounterMinutes": 30,
                    "allowUsernameSubstring": false,
                    "maxHistory": 3,
                    "maxLoginAttempts": 6,
                    "passwordExpirationInDays": 90,
                    "enableDaysBeforeExpirationToForceReset": false,
                    "enableMinChangePeriodInDays": false,
                    "needsLowercase": true,
                    "lockoutTimeInSeconds": 600,
                    "daysBeforeExpirationToForceReset": 10,
                    "effectiveDate": "2023-06-22T14:27:14.338Z",
                    "enableLockoutTimeInSeconds": true
                }
            },
            {
                "field": "settings.systemUsersCanEdit",
                "to": true
            },
            {
                "field": "settings.userPortal",
                "to": {
                    "idleSessionDurationMinutes": 60
                }
            }
        ],
        "useragent": {
            "os": "Mac OS X",
            "minor": "0",
            "os_minor": "15",
            "os_major": "10",
            "os_version": "10.15.7",
            "version": "112.0.0.0",
            "os_patch": "7",
            "patch": "0",
            "os_full": "Mac OS X 10.15.7",
            "major": "112",
            "name": "Chrome",
            "os_name": "Mac OS X",
            "device": "Mac"
        },
        "auth_method": "other",
        "event_type": "organization_create",
        "service": "directory",
        "organization": "64949312a2930fd2c93b2669",
        "@version": "1",
        "client_ip": "23.118.110.219",
        "id": "64949312a2930fd2c93b266e",
        "timestamp": "2023-06-22T18:29:38.985Z"
    }
]
Sample queries
={{Logsdatasource}} service
| json "id", "geoip.region_name", "service", "event_type" as id, region_name, service, event_type nodrop
// global filters
| where service matches "{{service}}"
| where event_type matches "{{event_type}}"
| where if ("{{region_name}}" = "*", true, region_name matches "{{region_name}}")
| where !isBlank(service)
| count by id, service
| count by service
| sort by _count, service asc
| limit 10
Collection configuration and app installation
Depending on the set up collection method, you can configure and install the app in three ways:
- Create a new collector and install the app. Create a new Sumo Logic Cloud-to-Cloud (C2C) source under a new Sumo Logic Collector and later install the app, or
- Use an existing collector and install the app. Create a new Sumo Logic Cloud-to-Cloud (C2C) source under an existing Sumo Logic Collector and later install the app, or
- Use existing source and install the app. Use your existing configured Sumo Logic Cloud-to-Cloud (C2C) source and install the app.
Use the Cloud-to-Cloud Integration for JumpCloud Directory Insights Source to create the source and use the same source category while installing the app. By following these steps, you can ensure that your JumpCloud Directory Insights app is properly integrated and configured to collect and analyze your data.
Create a new collector and install the app
To set up collection and install the app, do the following:
Next-Gen App: To install or update the app, you must be an account administrator or a user with Manage Apps, Manage Monitors, Manage Fields, Manage Metric Rules, and Manage Collectors capabilities depending upon the different content types part of the app.
- Select App Catalog.
- In the 🔎 Search Apps field, run a search for your desired app, then select it.
- Click Install App.
note
Sometimes this button says Add Integration.
- In the Set Up Collection section of your respective app, select Create a new Collector.
- Collector Name. Enter a Name to display the Source in the Sumo Logic web application. The description is optional.
- Timezone. Set the default time zone when it is not extracted from the log timestamp. Time zone settings on Sources override a Collector time zone setting.
- (Optional) Metadata. Click the +Add Metadata link to add a custom log Metadata Fields. Define the fields you want to associate, each metadata field needs a name (key) and value.
 A green circle with a checkmark is shown when the field exists and is enabled in the Fields table schema.
 An orange triangle with an exclamation point is shown when the field doesn't exist, or is disabled in the Fields table schema. In this case, you'll see an option to automatically add or enable the nonexistent fields to the Fields table schema. If a field is sent to Sumo Logic but isn’t present or enabled in the schema, it’s ignored and marked as Dropped.
- Click Next.
- Configure the source as specified in the
Infobox above, ensuring all required fields are included. - In the Configure section of your respective app, complete the following fields.
- Field Name. If you already have collectors and sources set up, select the configured metadata field name (eg _sourcecategory) or specify other custom metadata (eg: _collector) along with its metadata Field Value.
- Click Next. You will be redirected to the Preview & Done section.
Post-installation
Once your app is installed, it will appear in your Installed Apps folder, and dashboard panels will start to fill automatically.
Each panel slowly fills with data matching the time range query received since the panel was created. Results will not immediately be available but will be updated with full graphs and charts over time.
Use an existing collector and install the app
To set up the source in the existing collector and install the app, do the following:
Next-Gen App: To install or update the app, you must be an account administrator or a user with Manage Apps, Manage Monitors, Manage Fields, Manage Metric Rules, and Manage Collectors capabilities depending upon the different content types part of the app.
- Select App Catalog.
- In the 🔎 Search Apps field, run a search for your desired app, then select it.
- Click Install App.
note
Sometimes this button says Add Integration.
- In the Set Up Collection section of your respective app, select Use an existing Collector.
- From the Select Collector dropdown, select the collector that you want to set up your source with and click Next.
- Configure the source as specified in the
Infobox above, ensuring all required fields are included. - In the Configure section of your respective app, complete the following fields.
- Field Name. If you already have collectors and sources set up, select the configured metadata field name (eg _sourcecategory) or specify other custom metadata (eg: _collector) along with its metadata Field Value.
- Click Next. You will be redirected to the Preview & Done section.
Post-installation
Once your app is installed, it will appear in your Installed Apps folder, and dashboard panels will start to fill automatically.
Each panel slowly fills with data matching the time range query received since the panel was created. Results will not immediately be available but will be updated with full graphs and charts over time.
Use an existing source and install the app
To skip collection and only install the app, do the following:
Next-Gen App: To install or update the app, you must be an account administrator or a user with Manage Apps, Manage Monitors, Manage Fields, Manage Metric Rules, and Manage Collectors capabilities depending upon the different content types part of the app.
- Select App Catalog.
- In the 🔎 Search Apps field, run a search for your desired app, then select it.
- Click Install App.
note
Sometimes this button says Add Integration.
- In the Set Up Collection section of your respective app, select Skip this step and use existing source and click Next.
- In the Configure section of your respective app, complete the following fields.
- Field Name. If you already have collectors and sources set up, select the configured metadata field name (eg _sourcecategory) or specify other custom metadata (eg: _collector) along with its metadata Field Value.
- Click Next. You will be redirected to the Preview & Done section.
Post-installation
Once your app is installed, it will appear in your Installed Apps folder, and dashboard panels will start to fill automatically.
Each panel slowly fills with data matching the time range query received since the panel was created. Results will not immediately be available but will be updated with full graphs and charts over time.
Viewing the JumpCloud Directory Insights dashboards
All dashboards have a set of filters that you can apply to the entire dashboard. Use these filters to drill down and examine the data to a granular level.
- You can change the time range for a dashboard or panel by selecting a predefined interval from a drop-down list, choosing a recently used time range, or specifying custom dates and times. Learn more.
- You can use template variables to drill down and examine the data on a granular level. For more information, see Filtering Dashboards with Template Variables.
- Most Next-Gen apps allow you to provide the scope at the installation time and are comprised of a key (
_sourceCategoryby default) and a default value for this key. Based on your input, the app dashboards will be parameterized with a dashboard variable, allowing you to change the dataset queried by all panels. This eliminates the need to create multiple copies of the same dashboard with different queries.
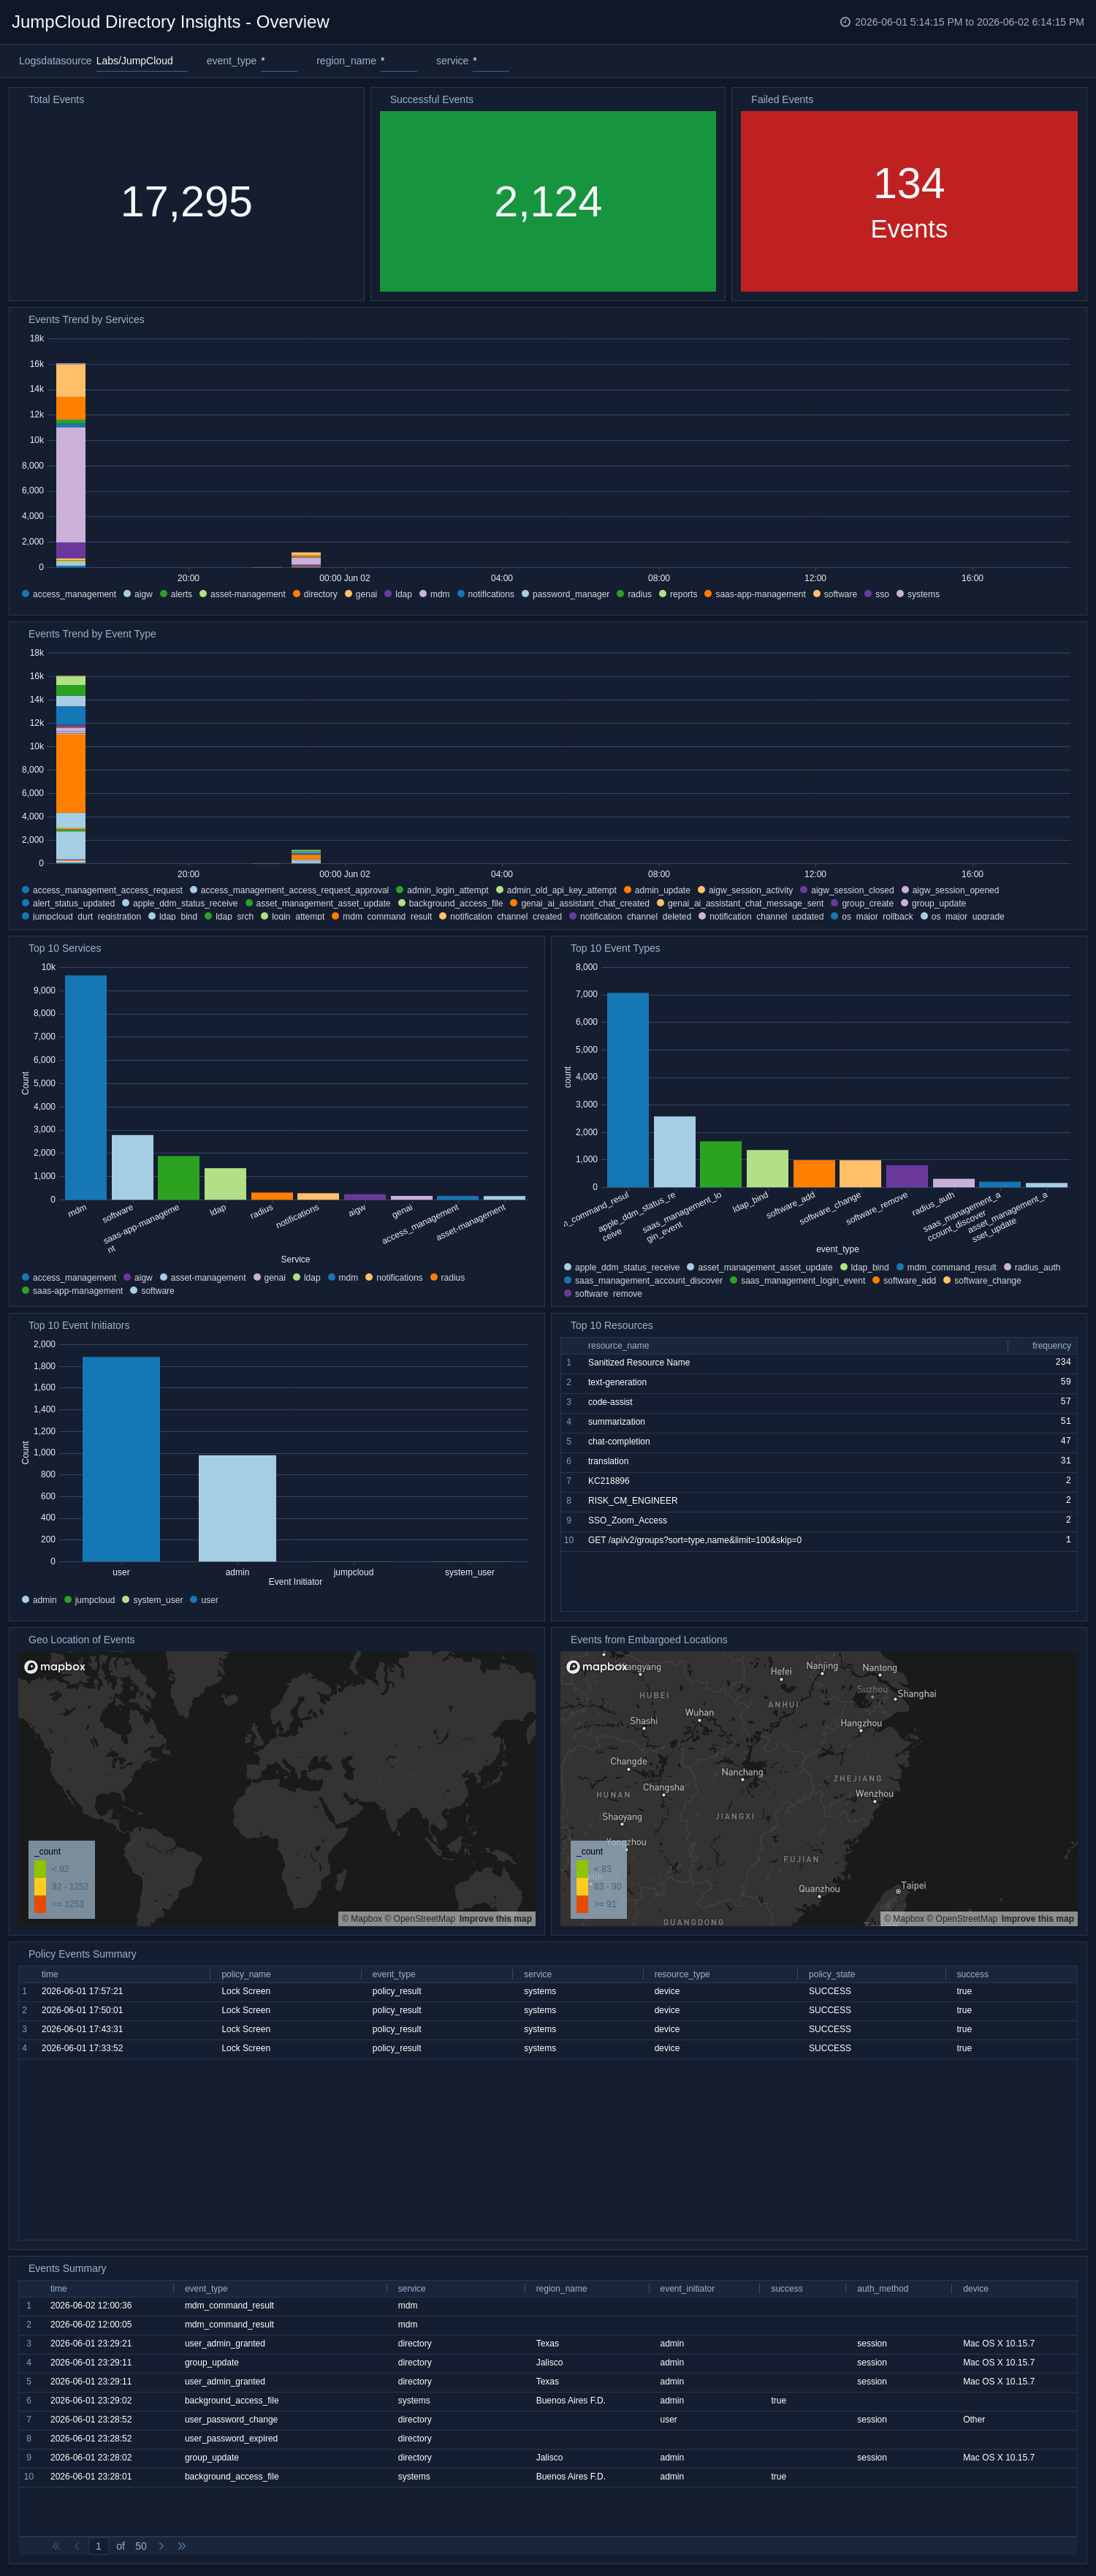
Overview
The JumpCloud Directory Insights - Overview dashboard provides a comprehensive view of directory activity, including user authentications, administrative changes, and system modifications. It highlights authentication trends by tracking successful and failed logins over time, helping IT teams identify patterns. This dashboard also provides insights into user provisioning, de-provisioning, and group membership changes, offering visibility into directory structure updates. Additionally, it includes administrator actions such as password resets and policy modifications to monitor privileged activities.
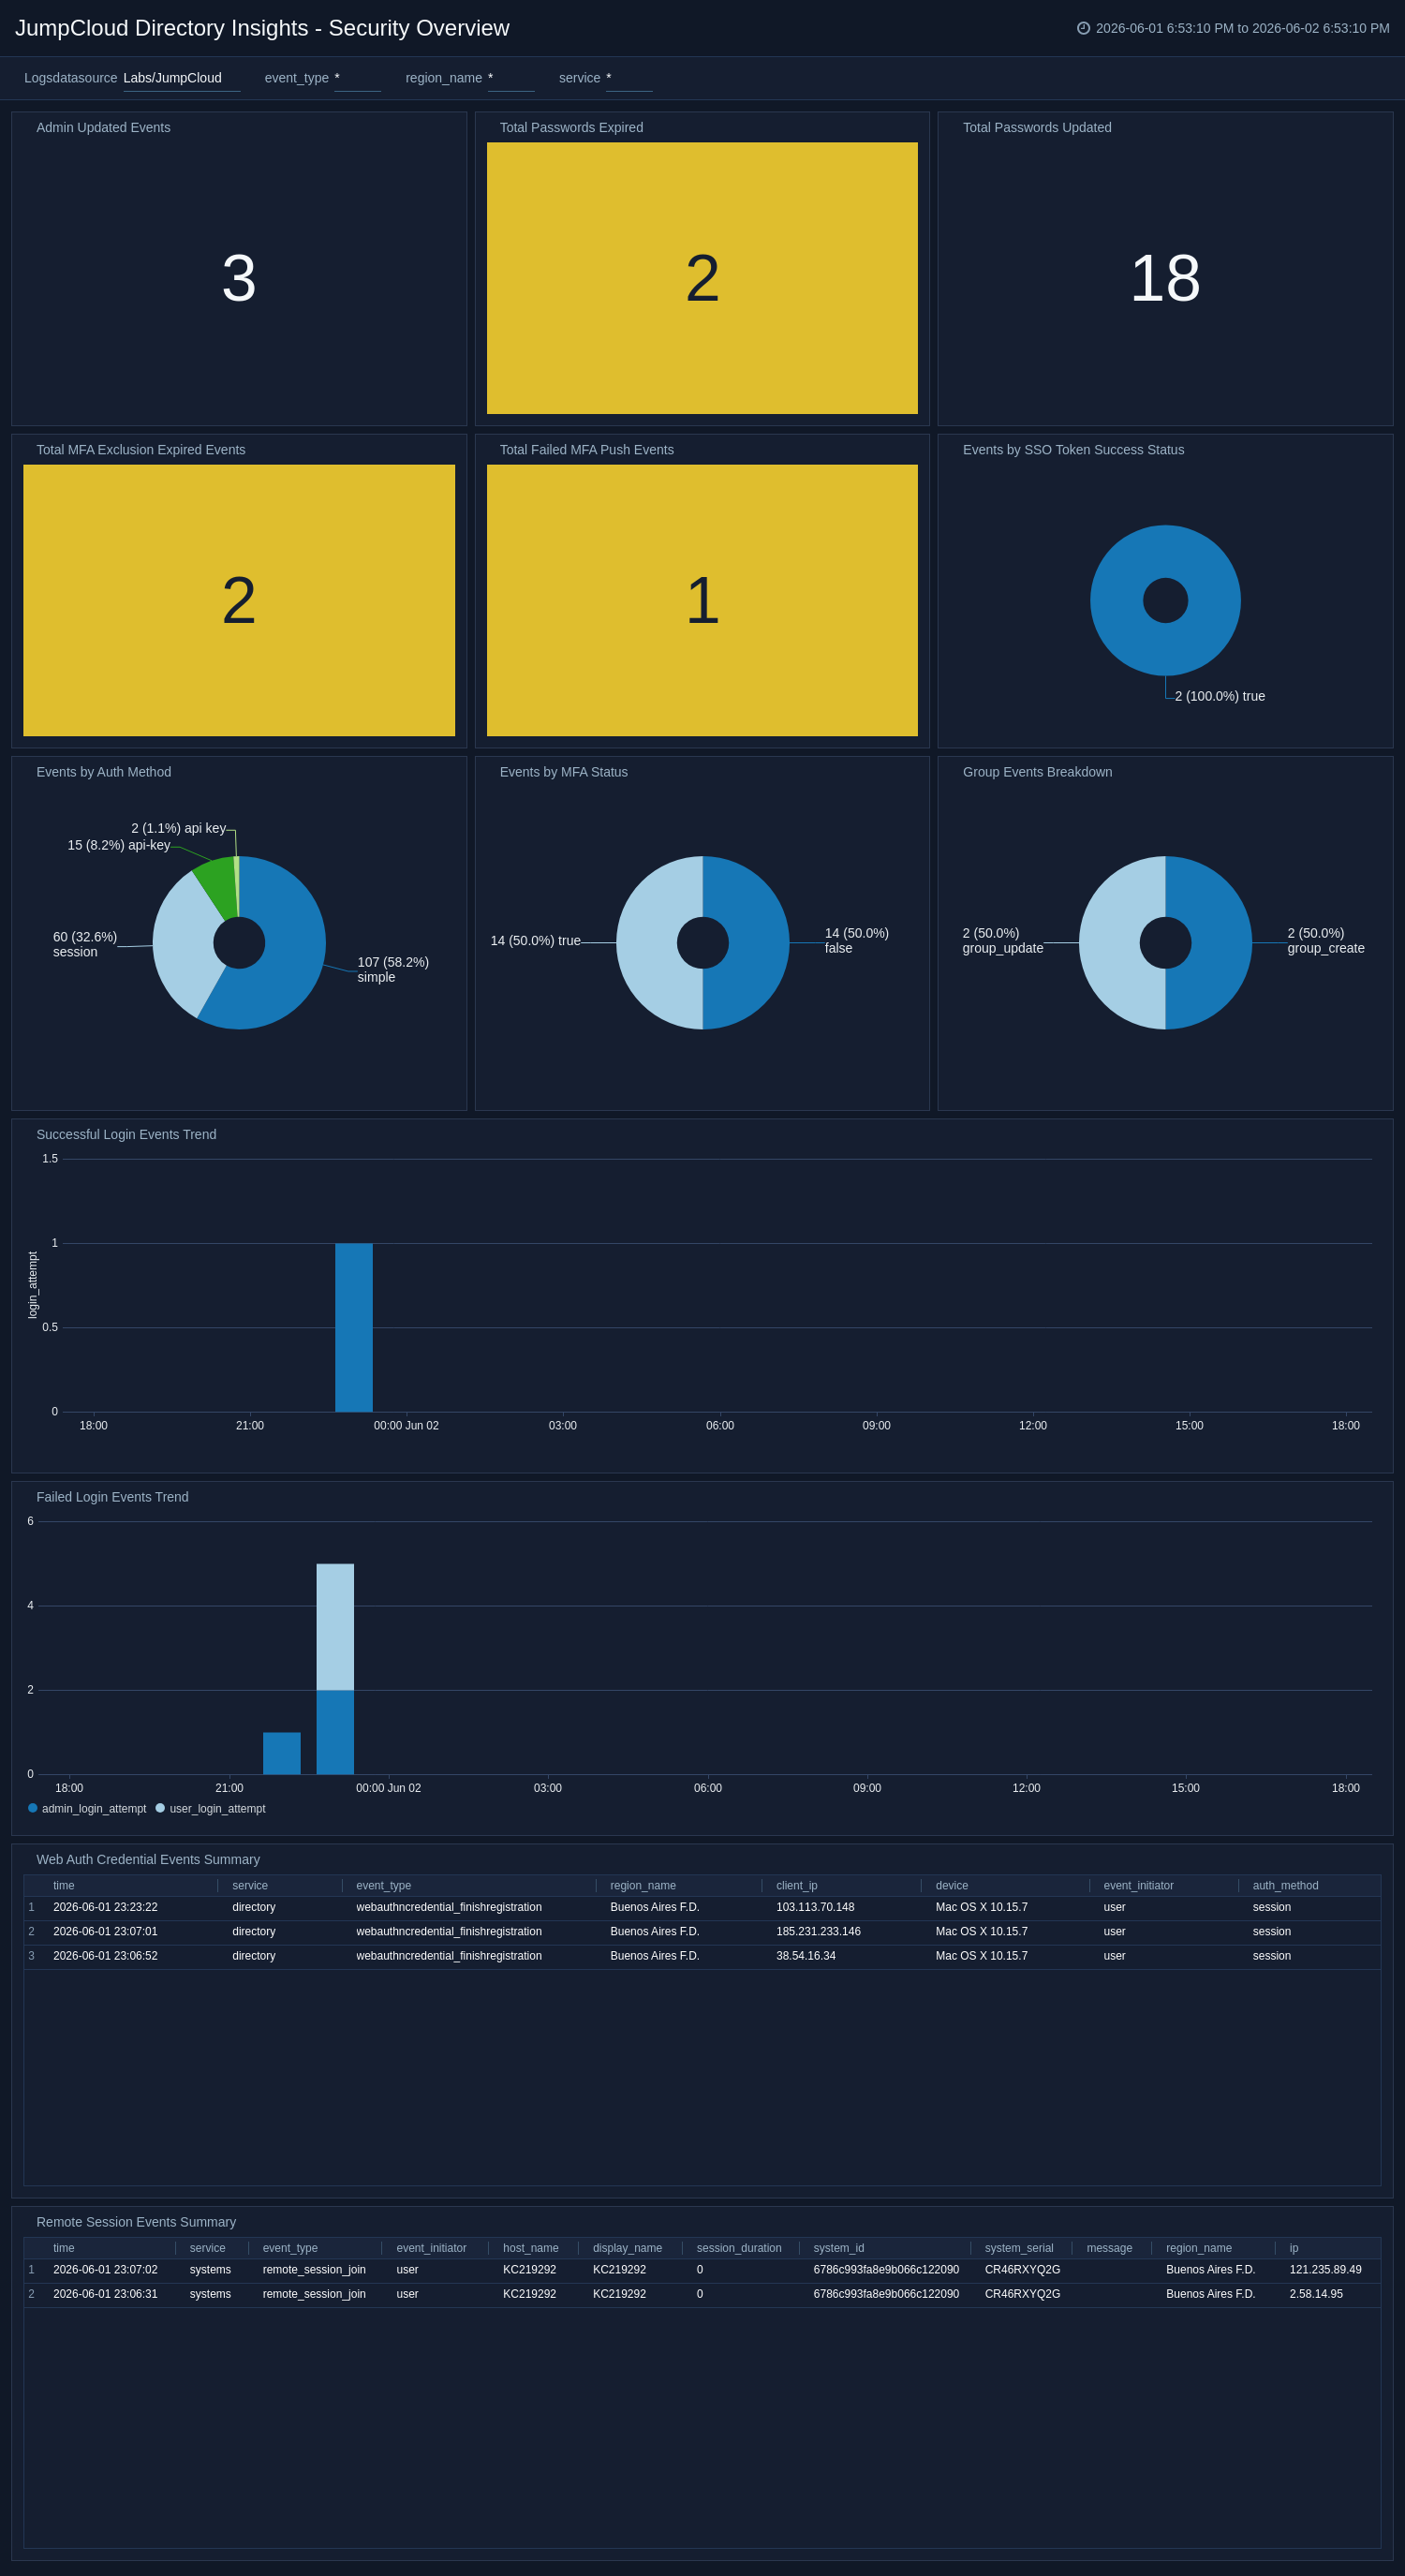
Security Overview
The JumpCloud Directory Insights - Security Overview dashboard focuses on security-related events, emphasizing failed login attempts, account lockouts, and privilege escalations. It provides geographic insights into authentication activities, helping you to detect suspicious login locations. This dashboard also tracks high-risk events such as MFA failures and unauthorized access attempts to enhance security monitoring. Analyzing login behaviors and access trends, it helps security teams identify potential threats and enforce compliance policies.
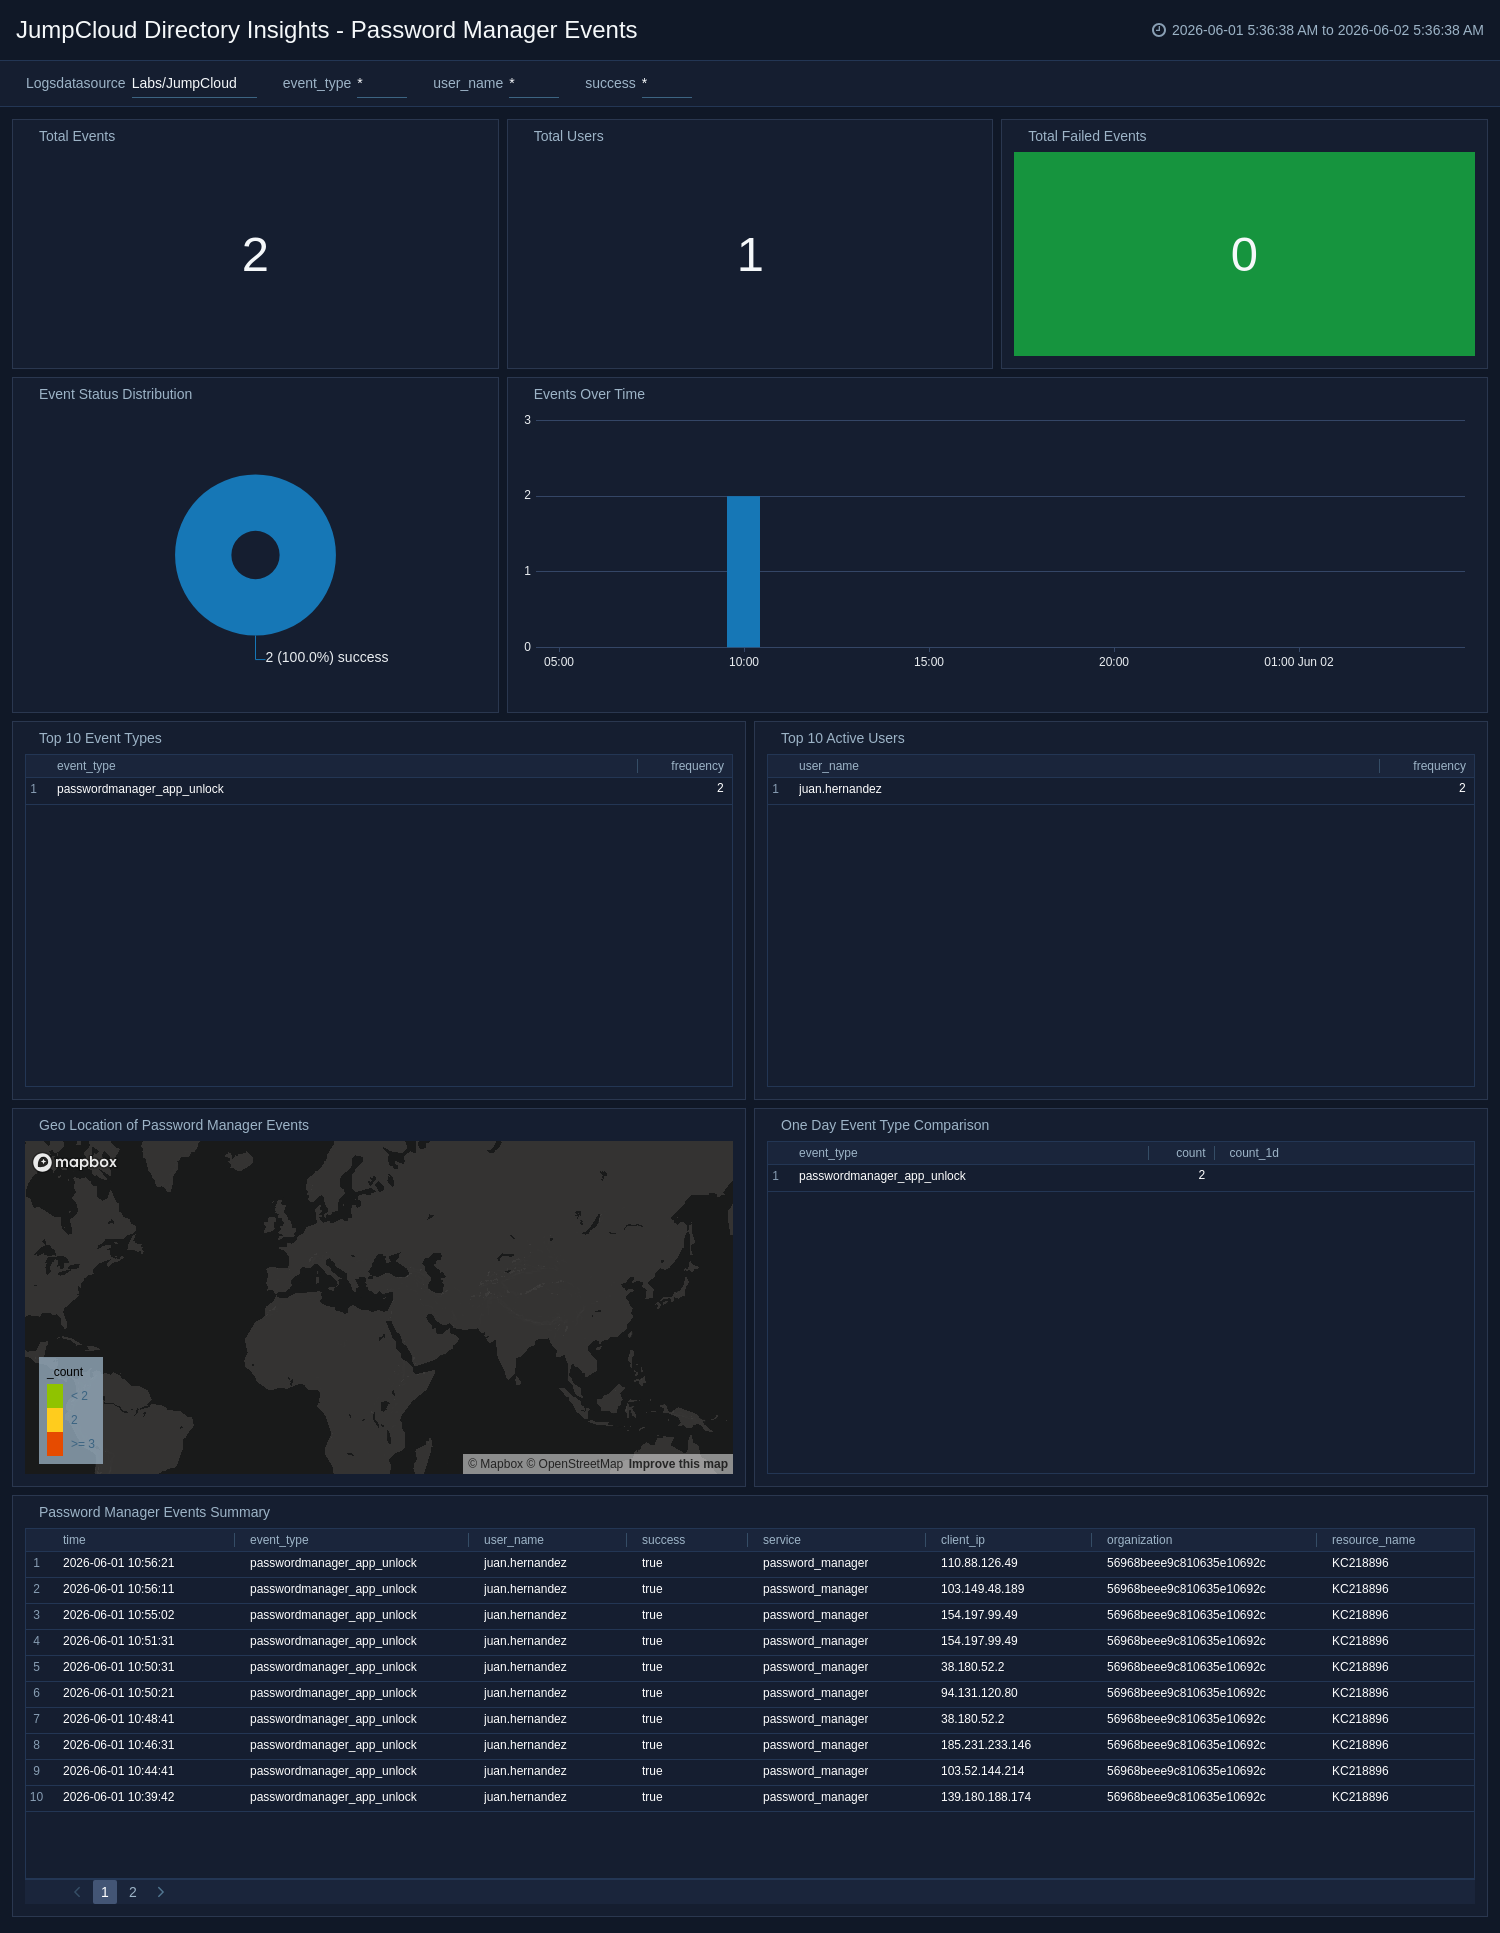
Password Manager Events
The JumpCloud Directory Insights - Password Manager Events dashboard provides visibility into password manager activity, including user behavior, authentication outcomes, and event type trends. It highlights geographic access patterns, failed event counts, and detailed operation summaries to support credential security monitoring. The dashboard helps teams detect suspicious vault access and investigate password-related anomalies quickly.
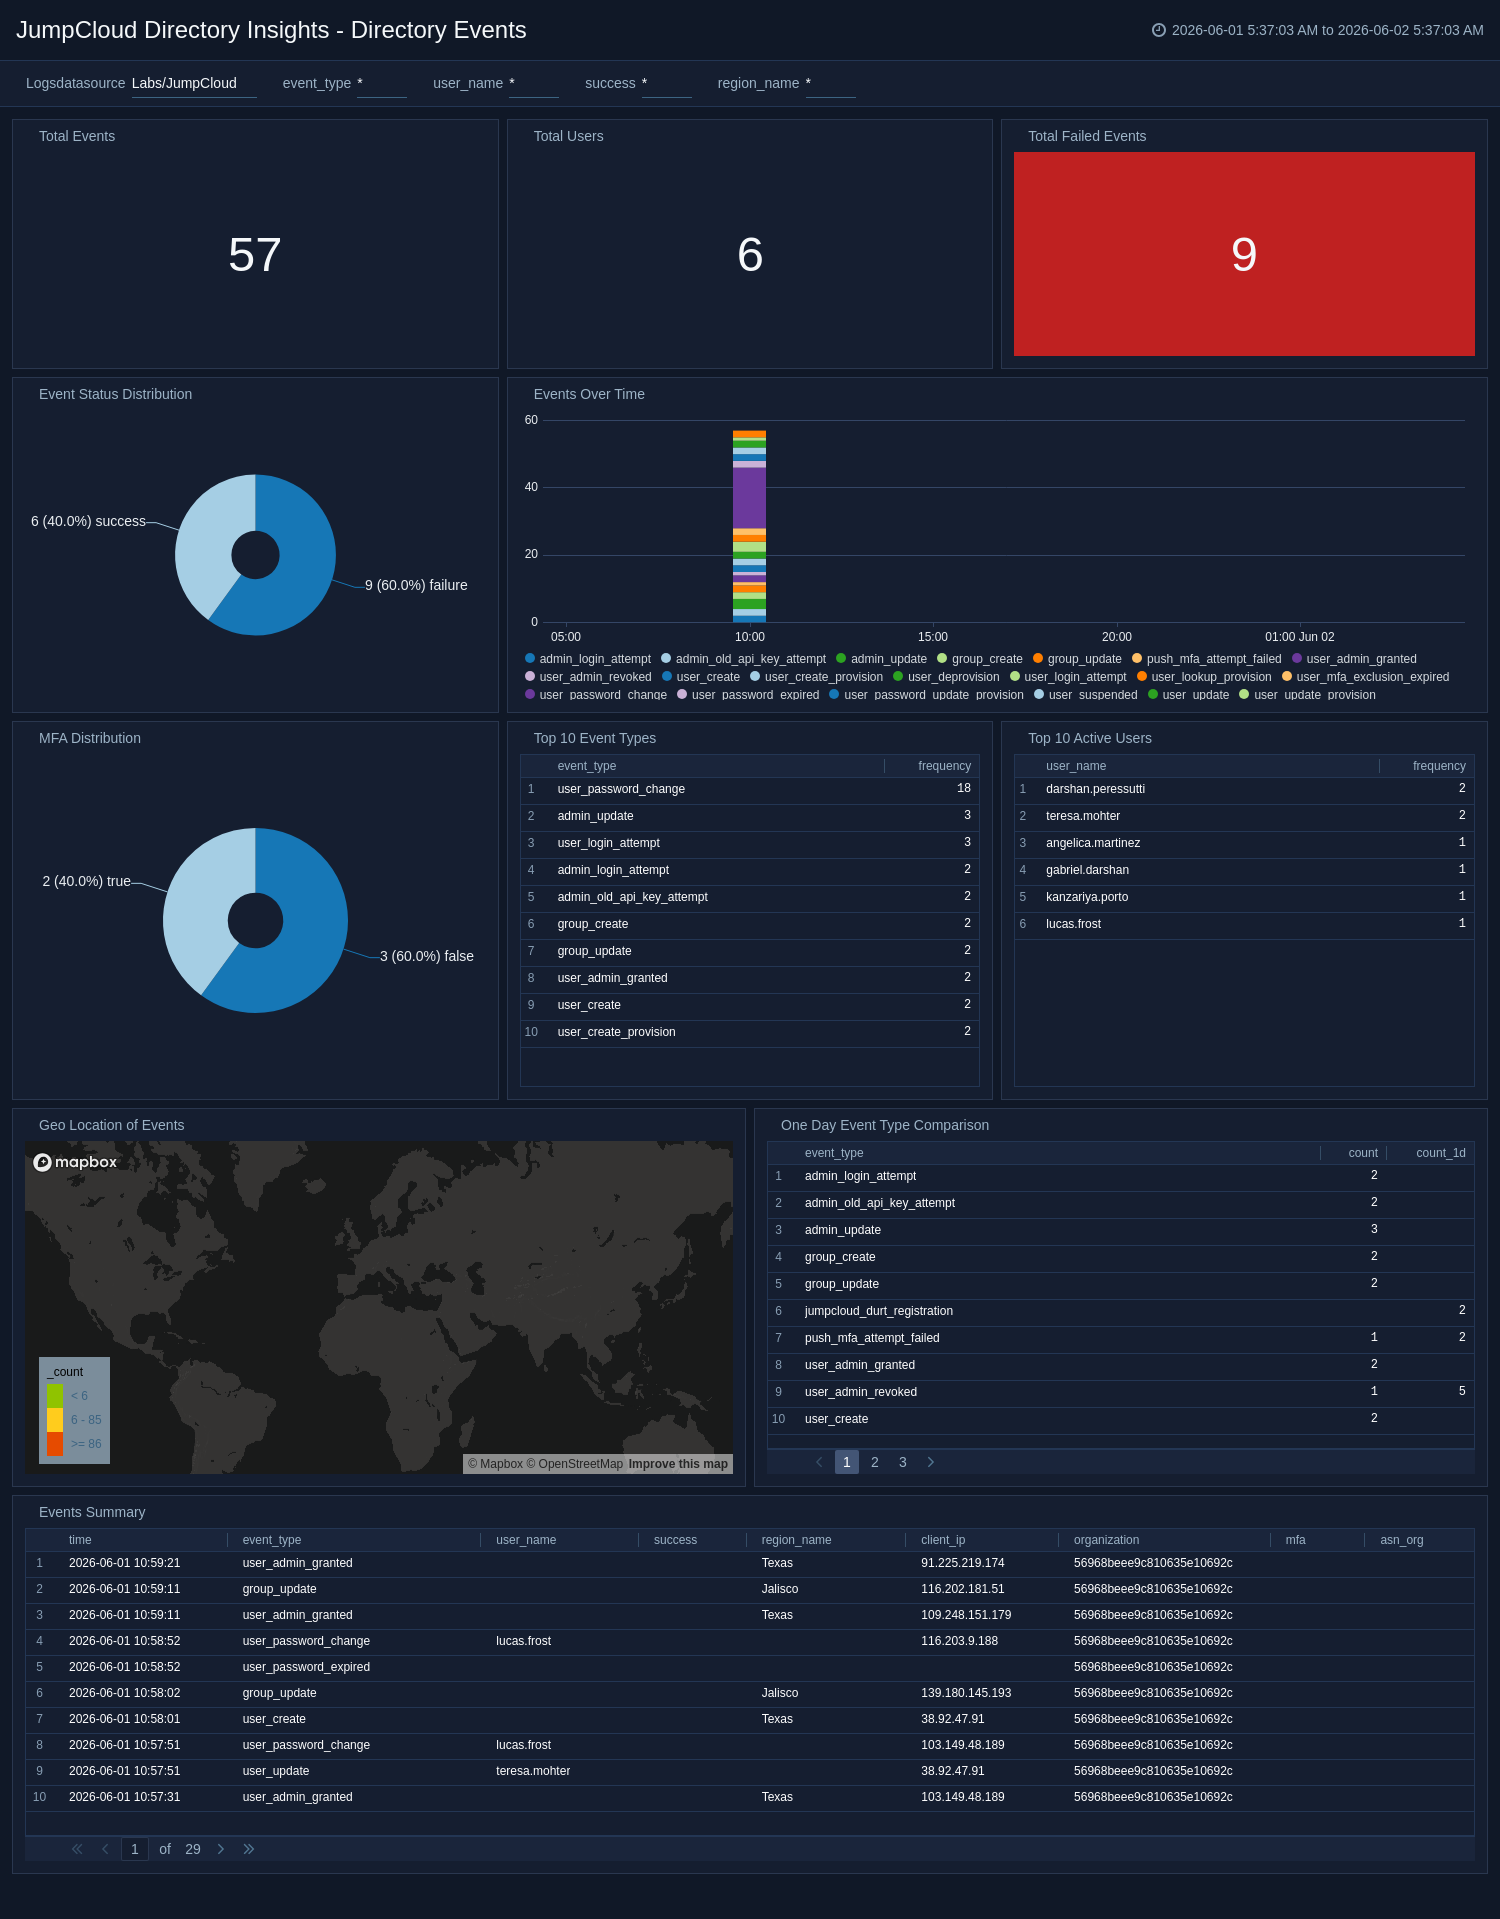
Directory Events
The JumpCloud Directory Insights - Directory Events dashboard provides insight into directory-related activity such as user actions, event types, and authentication outcomes. It surfaces MFA and status distributions, geographic patterns, and event trends to help identify risky or unusual behavior. Detailed event summaries support rapid investigation of directory changes and access anomalies.
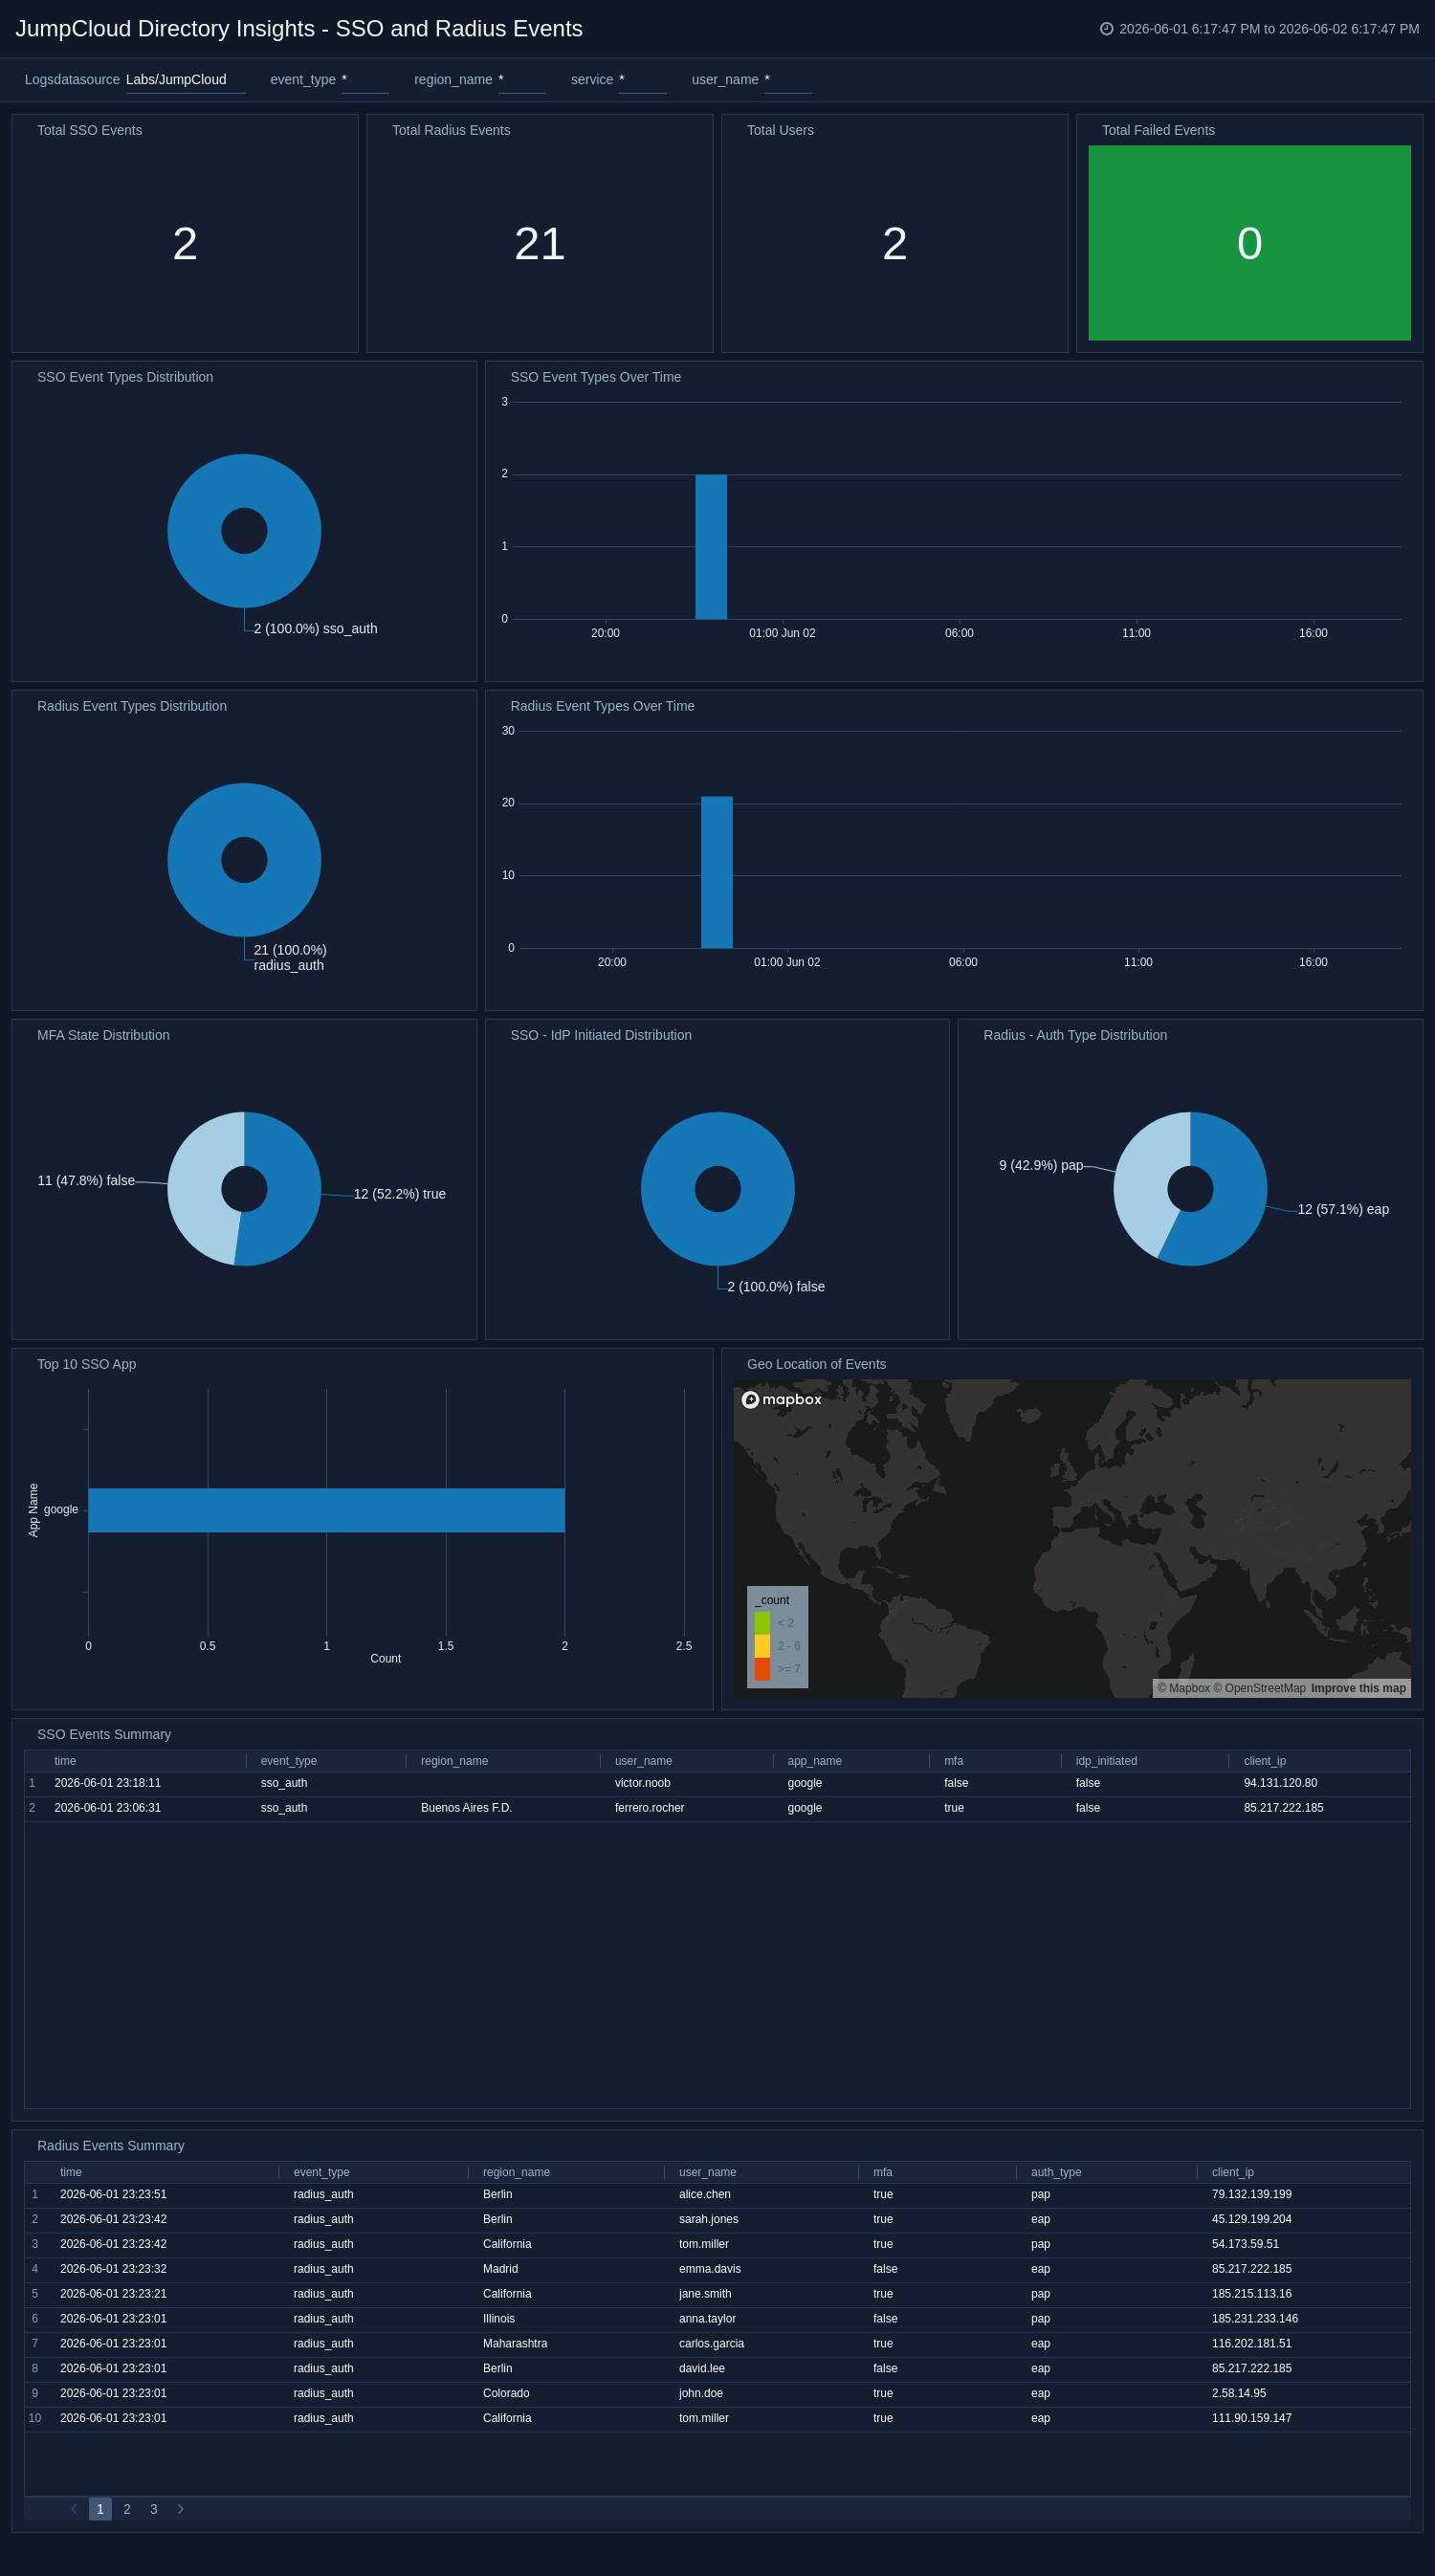
SSO and Radius Events
The JumpCloud Directory Insights - SSO and Radius Events dashboard provides unified visibility into SSO and RADIUS authentication activity. It tracks application access, IdP-initiated behavior, MFA and auth-type distributions, user activity, and regional access patterns. With dedicated summaries and trend panels for both services, the dashboard helps teams identify authentication failures and security gaps quickly.
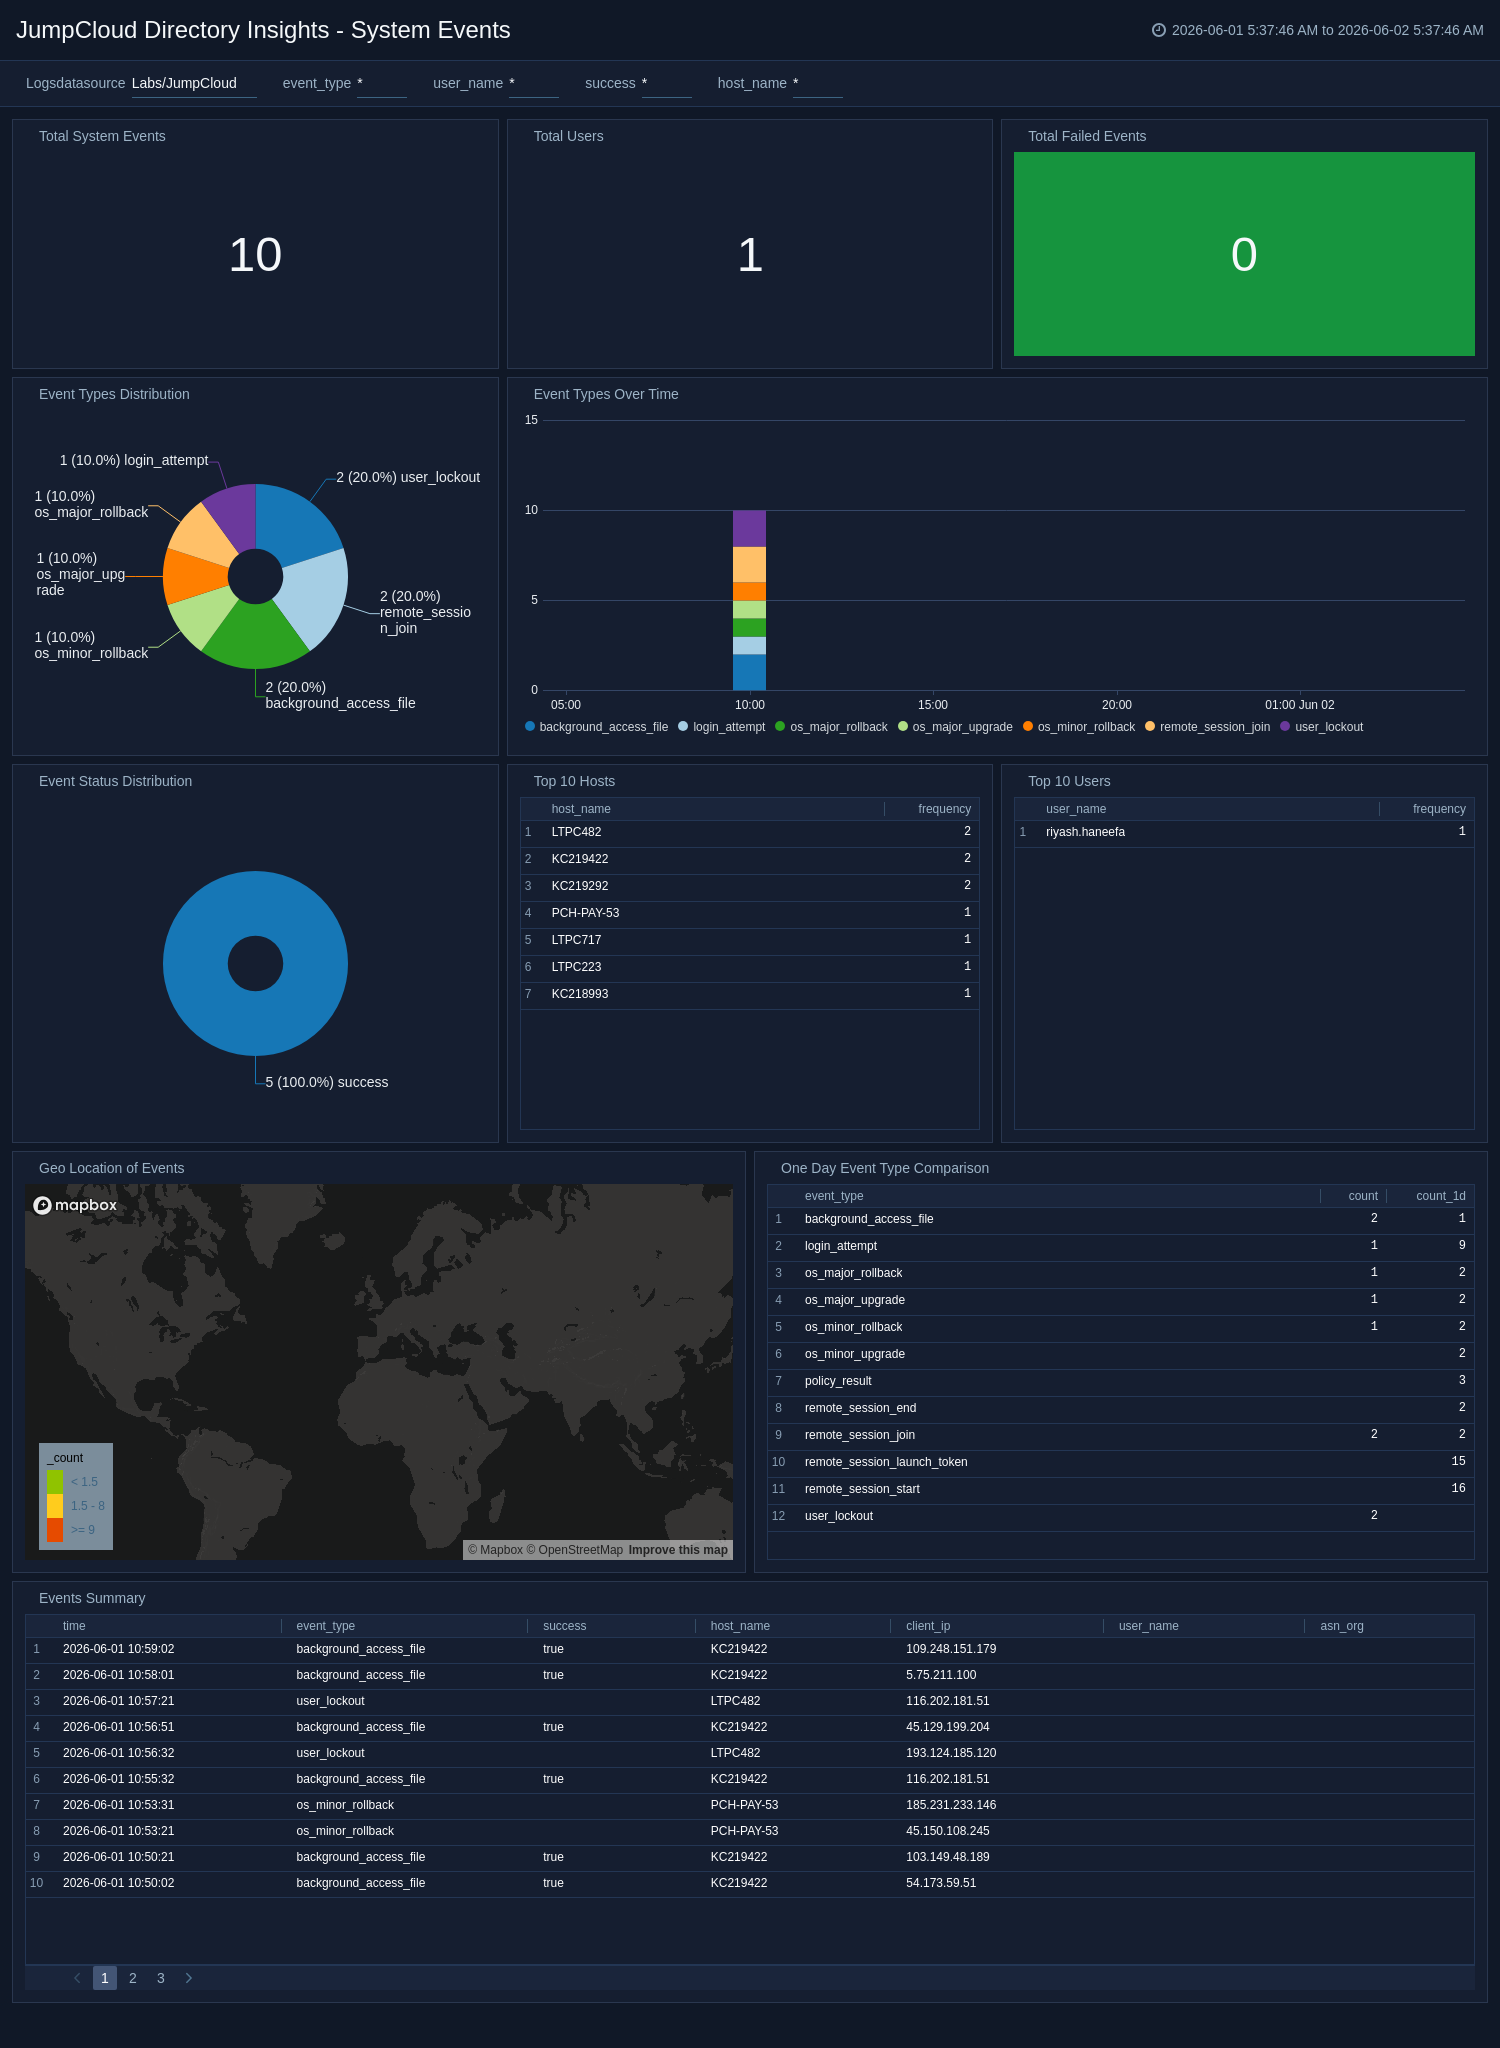
System Events
The JumpCloud Directory Insights - System Events dashboard provides monitoring of system-level login and host activity across JumpCloud-managed endpoints. It highlights event and status distributions, top users and hosts, geo location patterns, and temporal trends to reveal suspicious access behavior. Detailed event summaries and failure metrics support investigations into unauthorized access and brute-force activity.
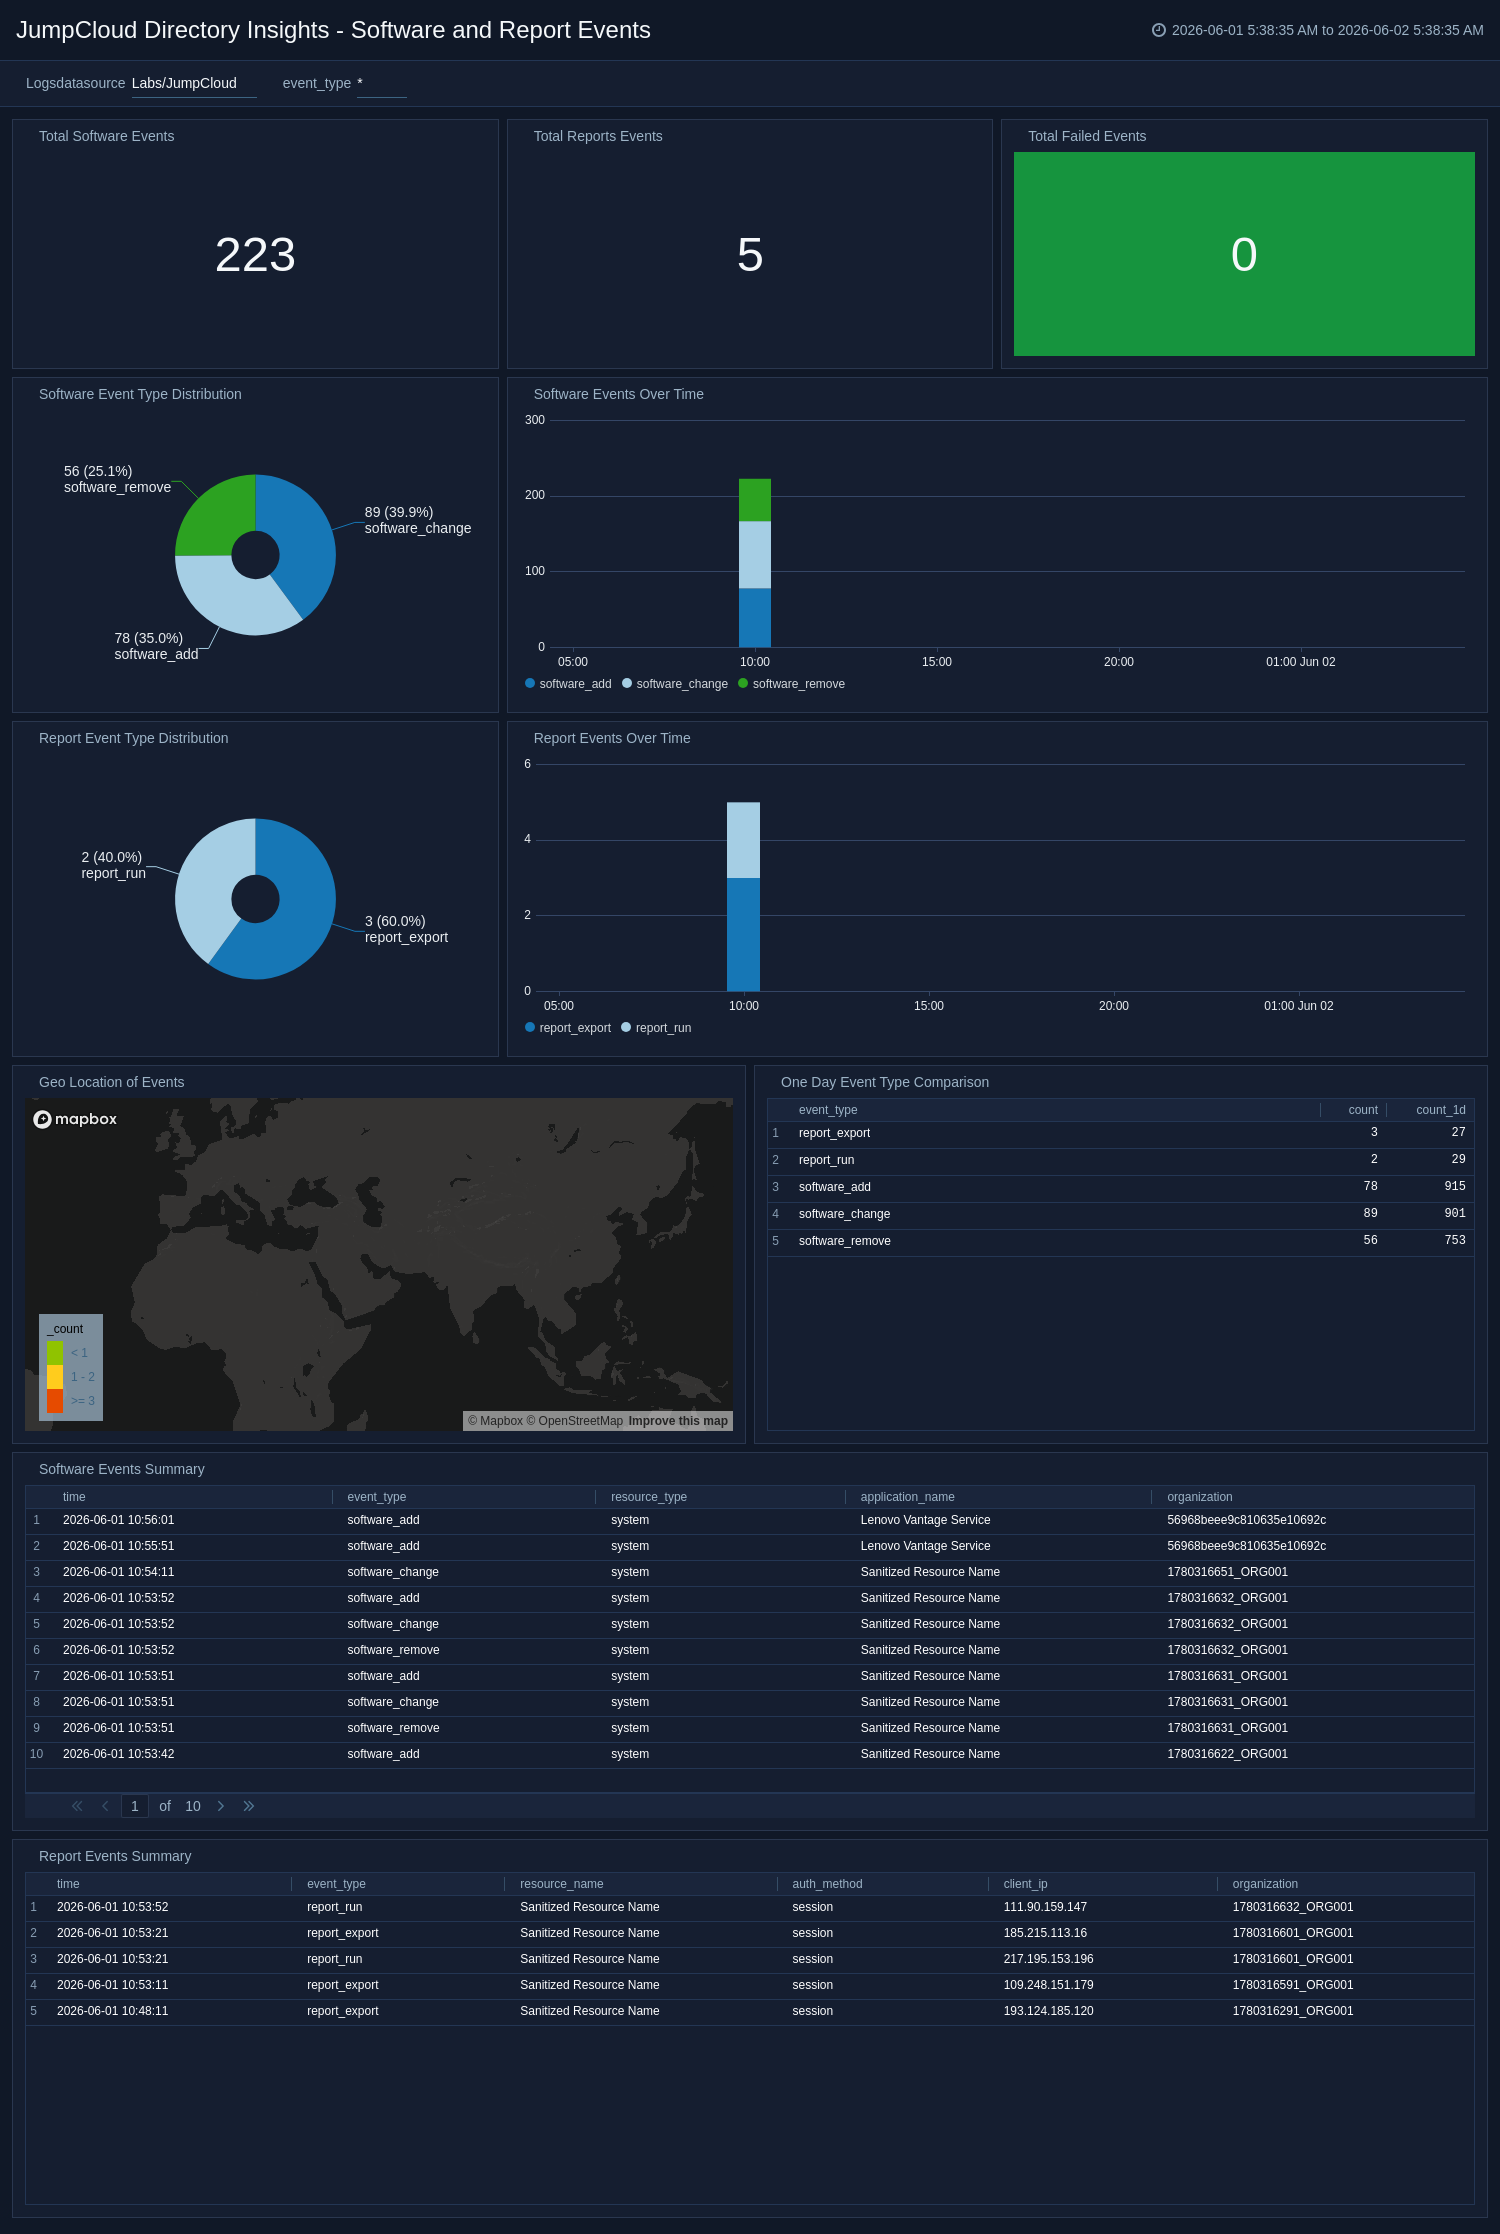
Software and Report Events
The JumpCloud Directory Insights - Software and Report Events dashboard provides comprehensive monitoring of software and report activity, including event type distributions, trend analysis, and failure tracking. It highlights geographic access patterns and detailed operational summaries to help teams validate software-related changes and reporting workflows. This dashboard supports rapid investigation of anomalous software or report events.
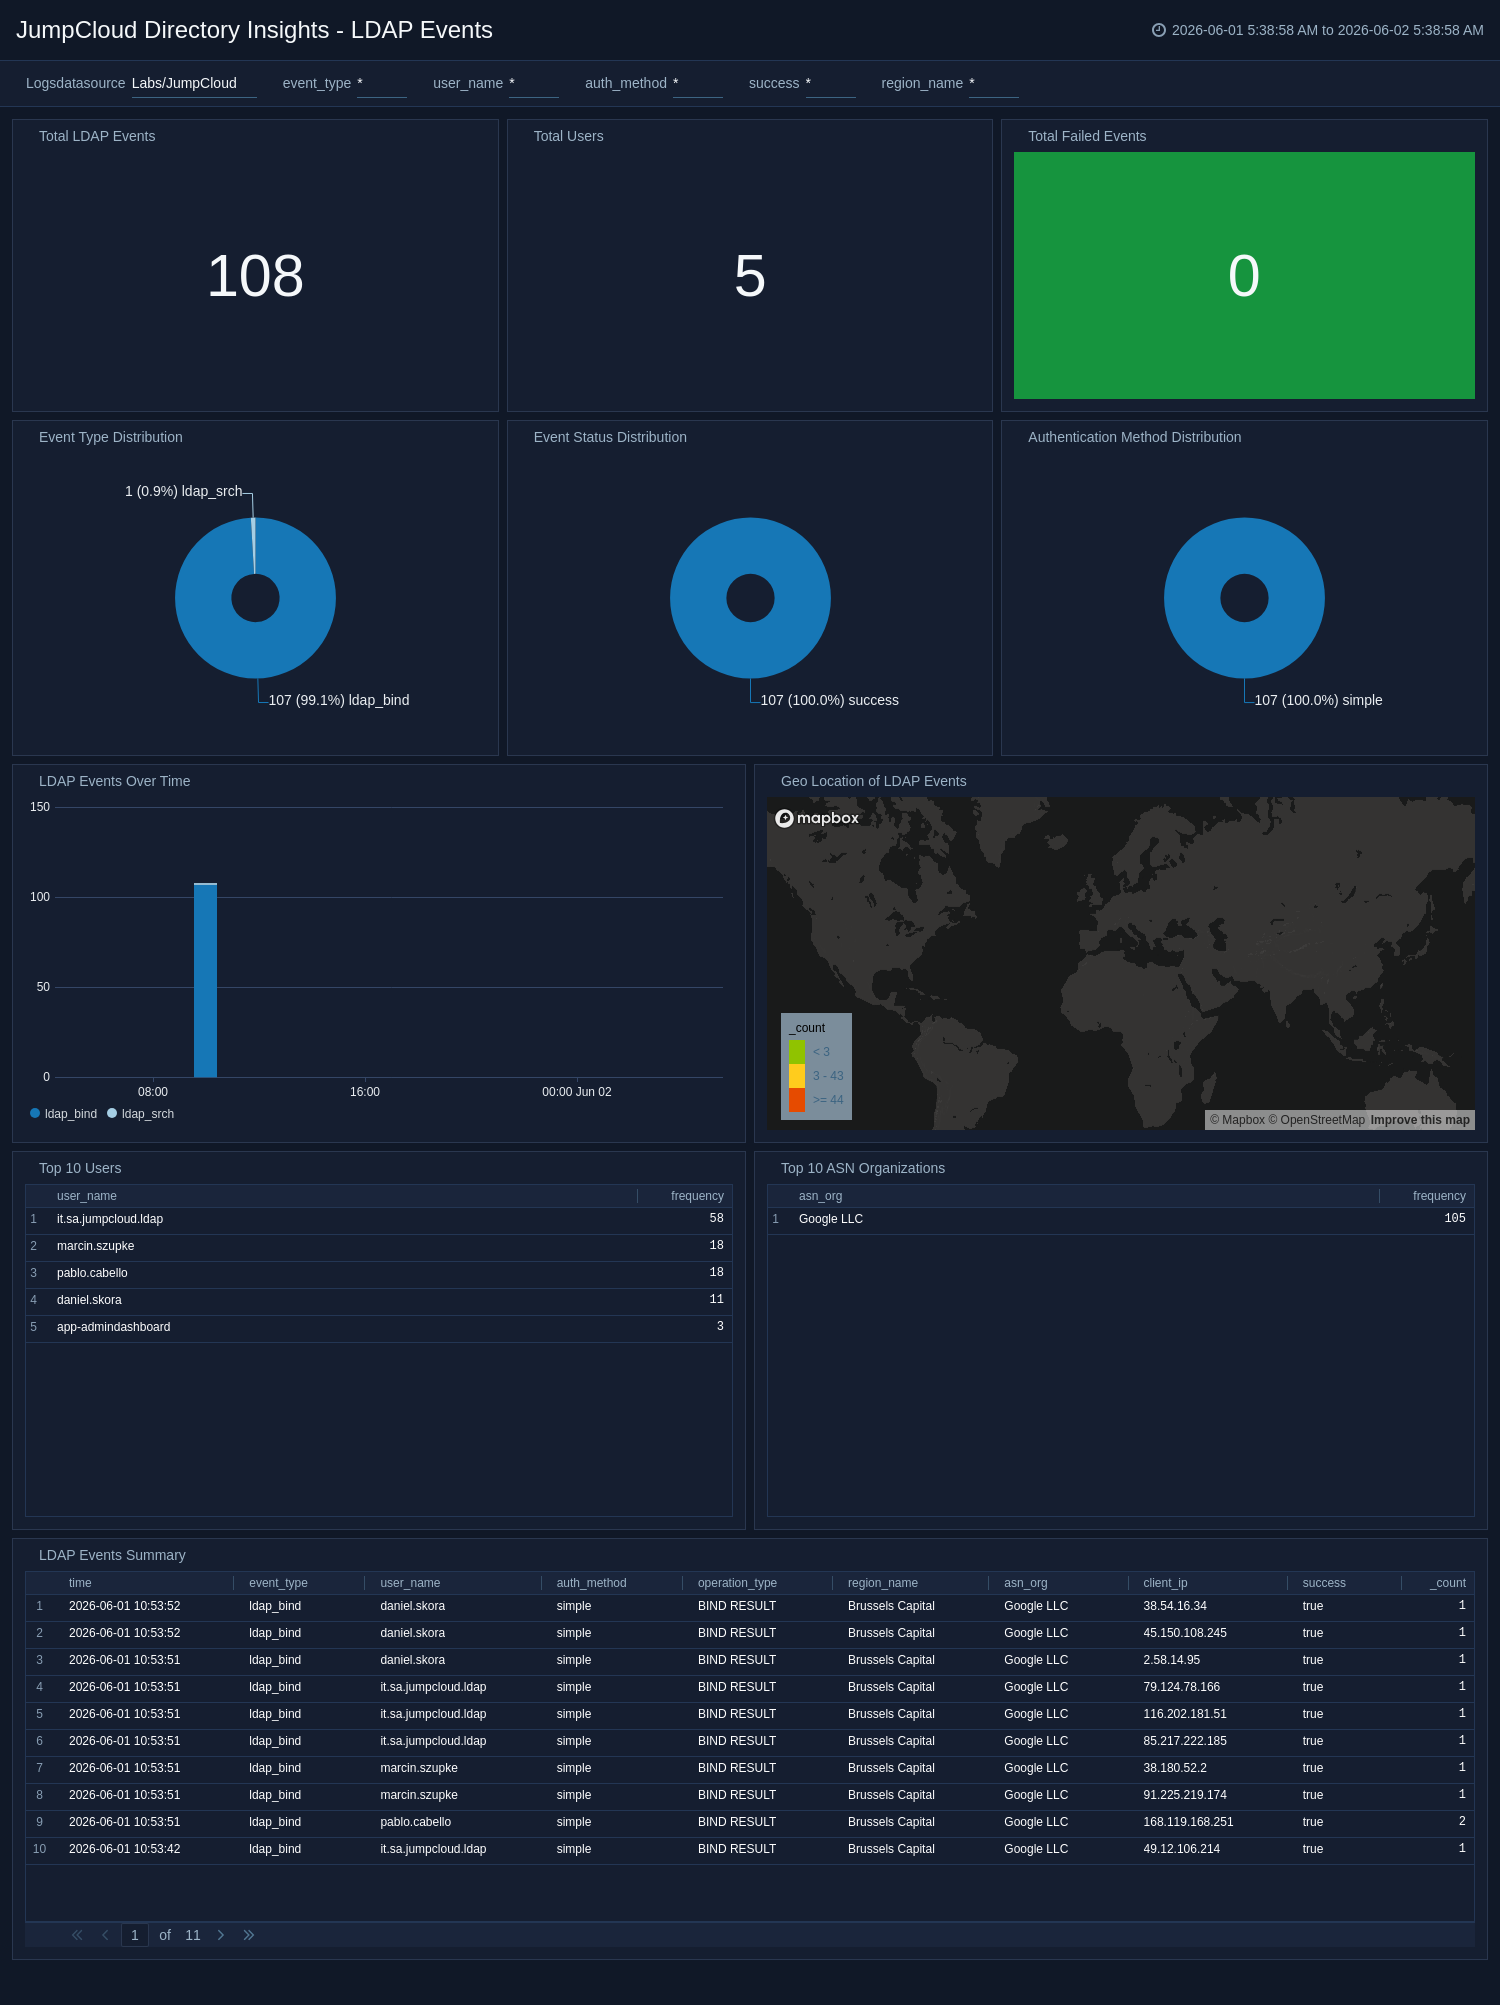
LDAP Events
The JumpCloud Directory Insights - LDAP Events dashboard provides focused monitoring of LDAP authentication and bind activity across users, methods, and outcomes. It highlights failed event patterns, source geo location, ASN organization trends, and event type distributions to detect suspicious directory access behavior. The dashboard also includes detailed summaries and time-series views to support credential abuse investigations.
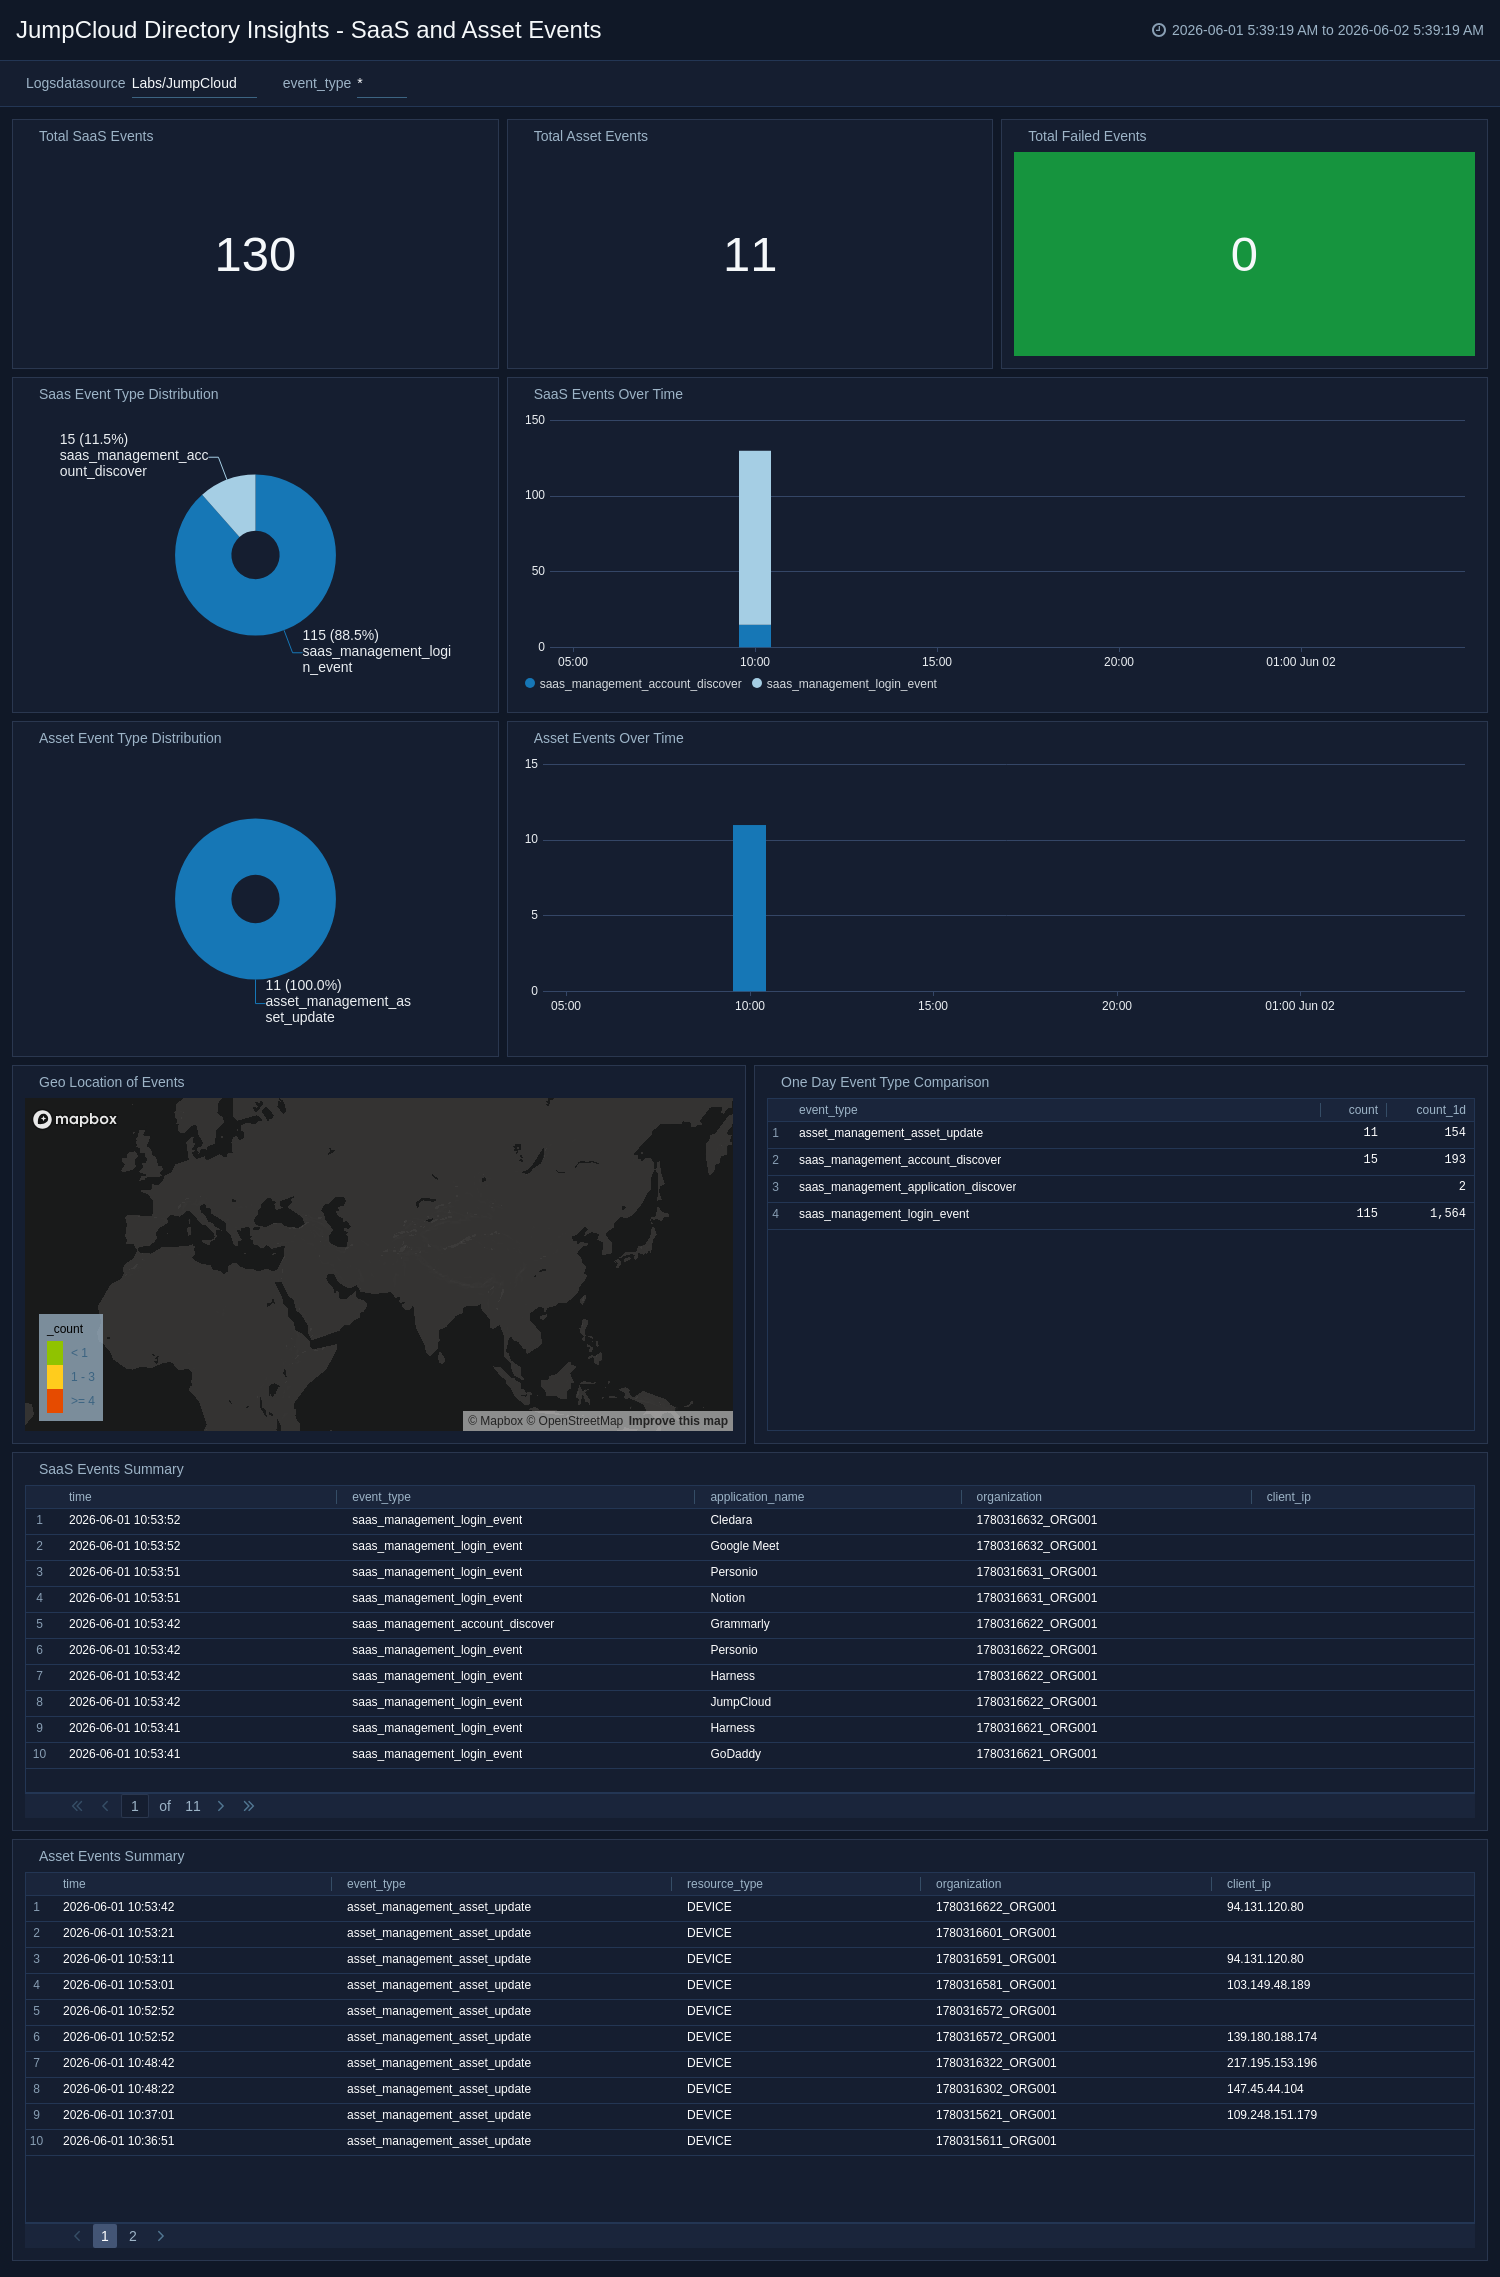
SaaS and Asset Events
The JumpCloud Directory Insights - SaaS and Asset Events dashboard provides visibility into SaaS application and asset management activity across your environment. It tracks event distributions, time-based trends, and geo-location patterns for both service domains, along with total and failed event metrics. Detailed SaaS and asset summaries help analysts investigate configuration changes and potential misuse.
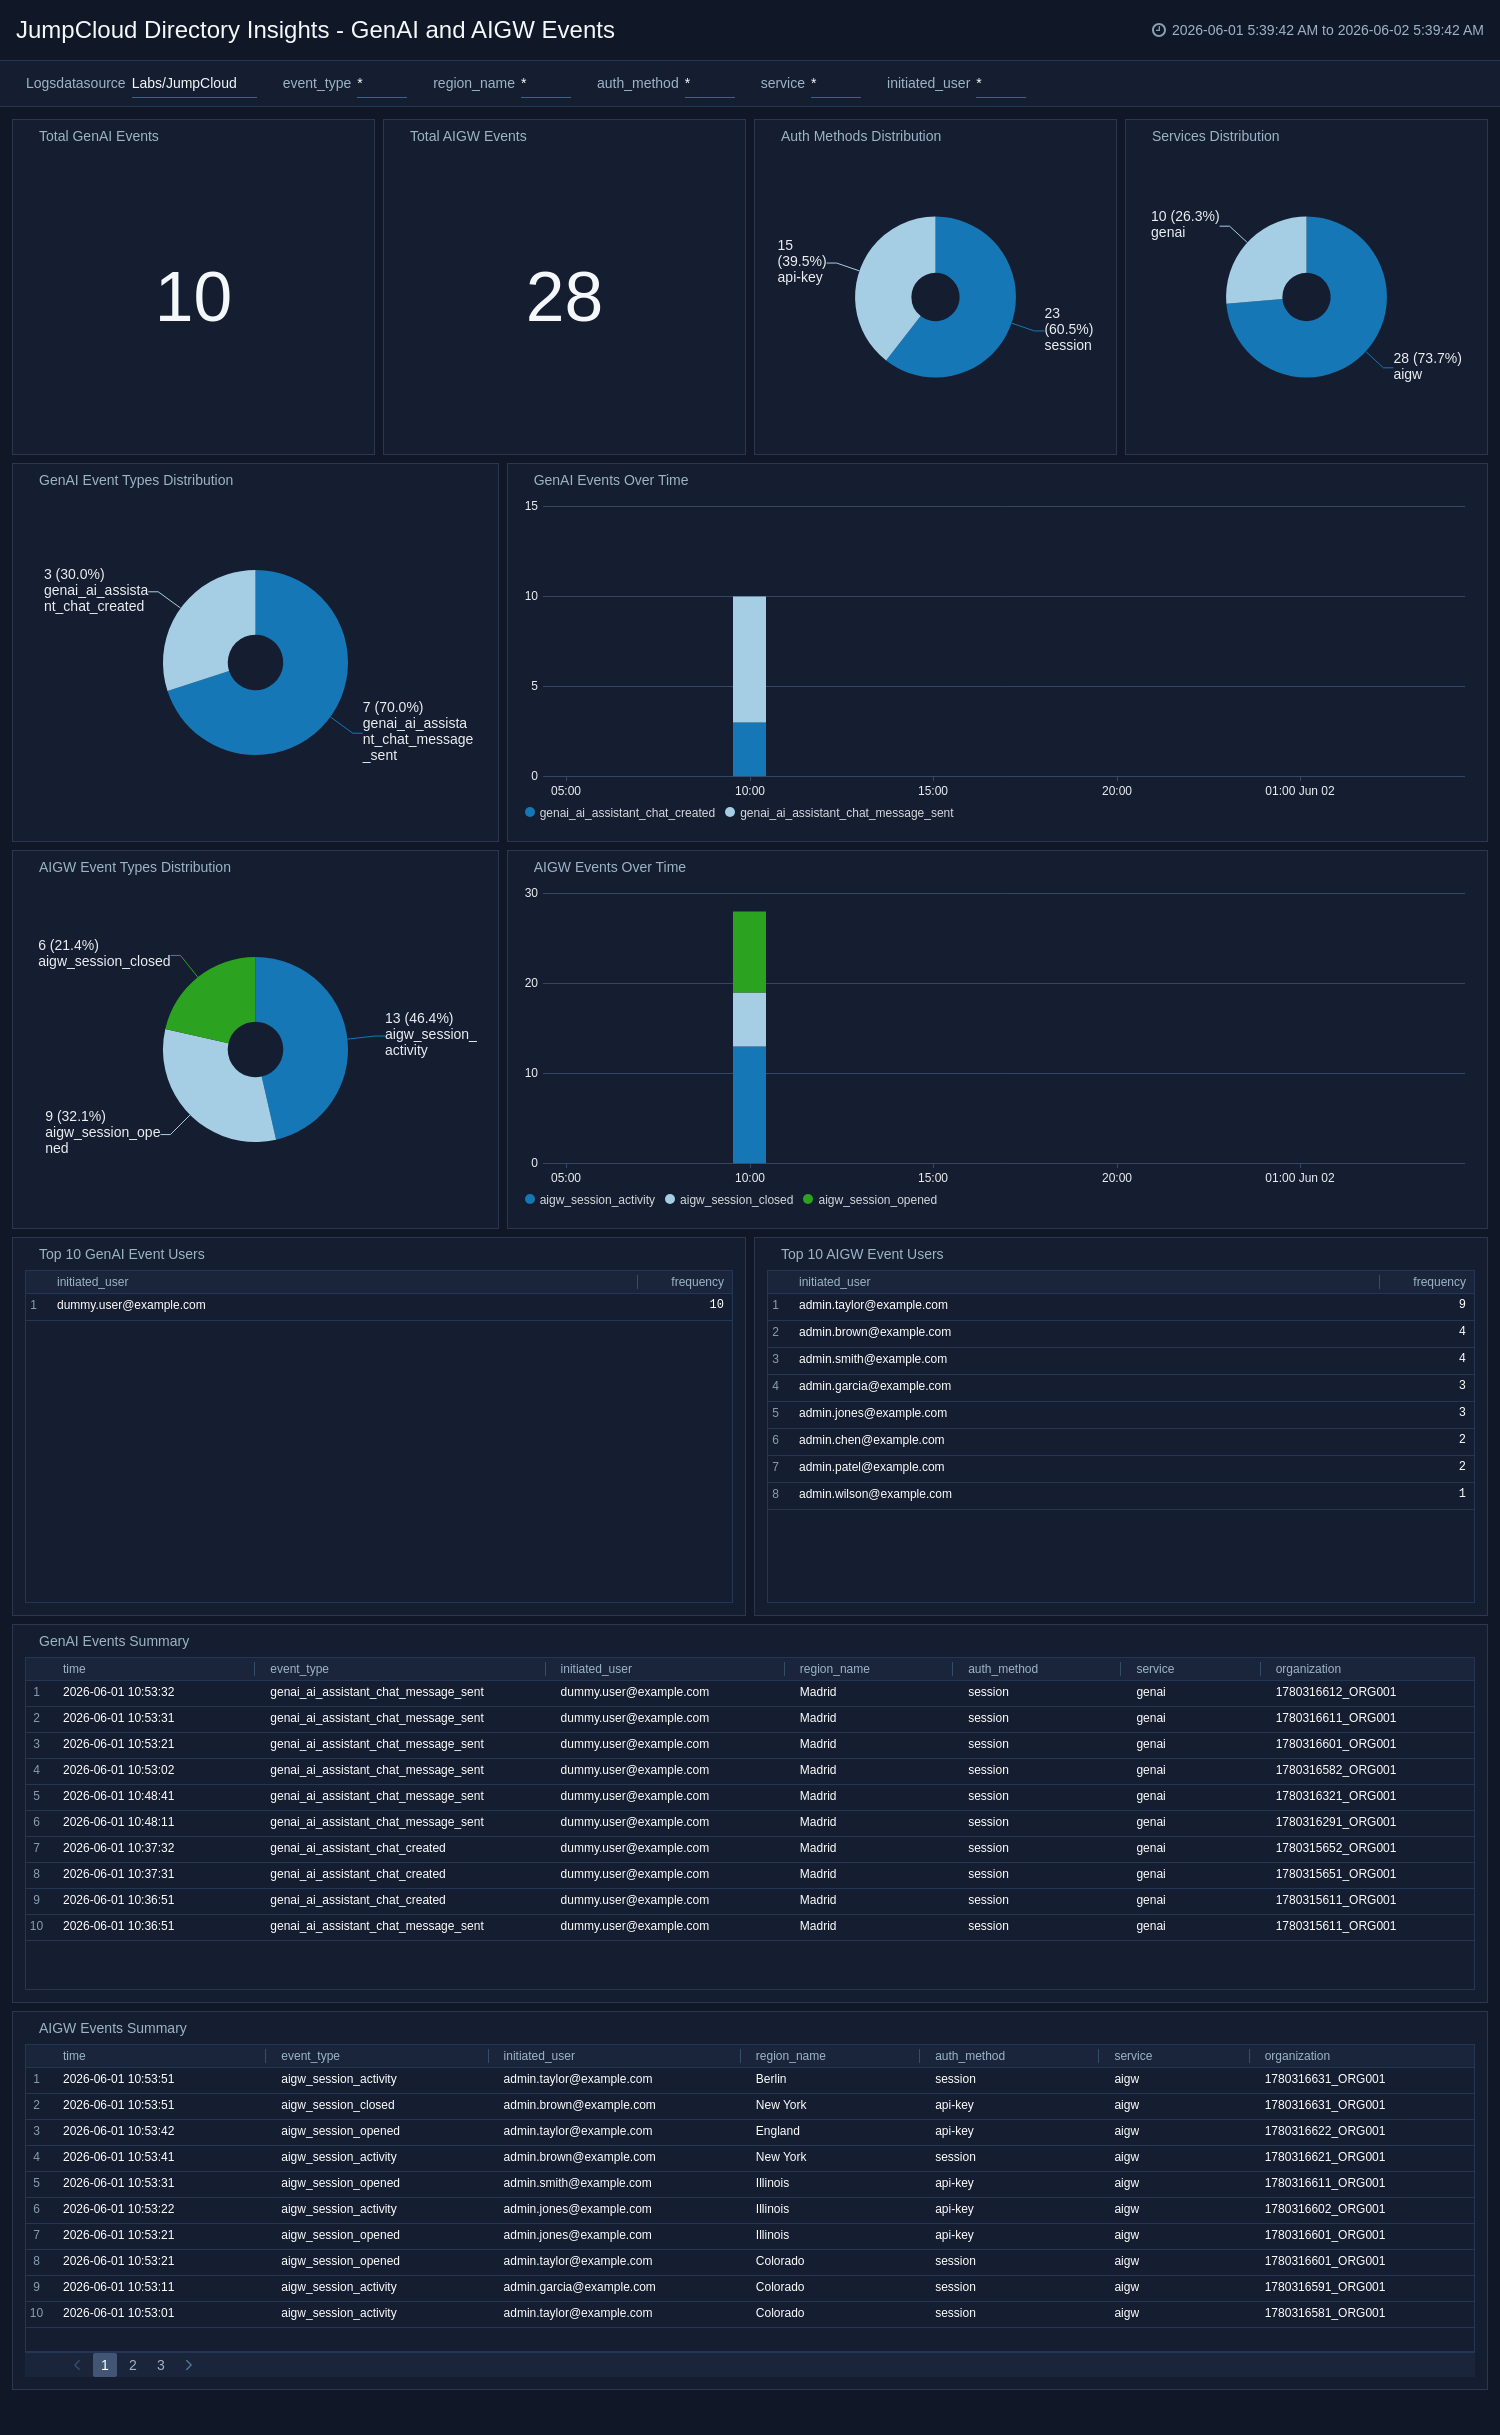
GenAI and AIGW Events
The JumpCloud Directory Insights - GenAI and AIGW Events dashboard delivers visibility into GenAI assistant and AI Gateway activity, including usage volume, event type distributions, and top users. It highlights service-level trends, authentication method patterns, and region-based behavior to support operational and security monitoring. Detailed summaries help teams investigate AI interaction anomalies and risk-related events efficiently.
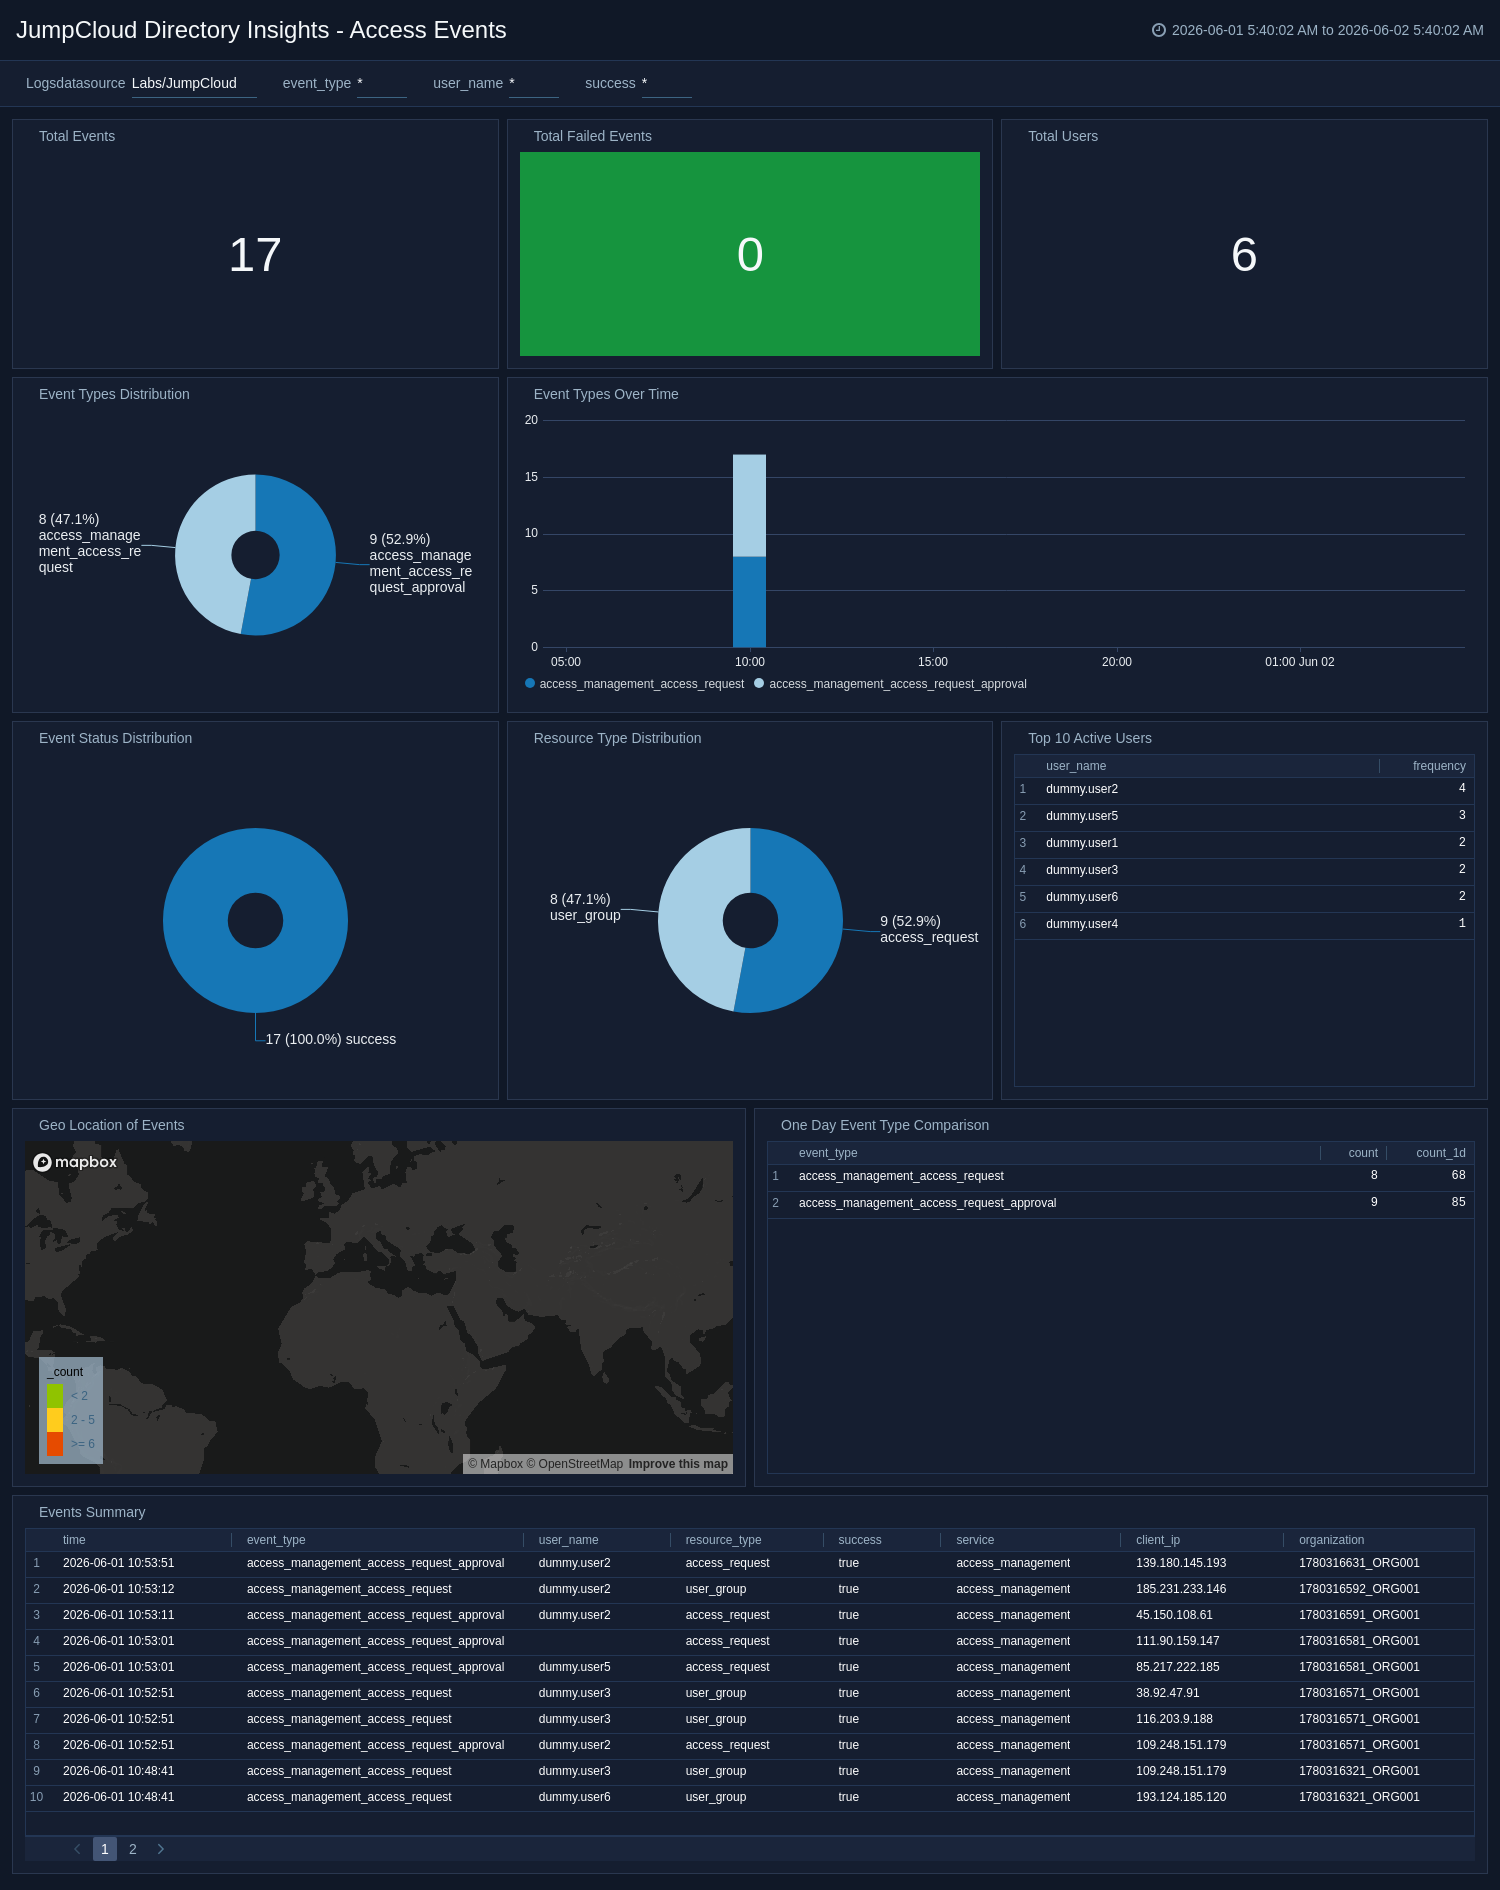
Access Events
The JumpCloud Directory Insights - Access Events dashboard provides visibility into access management activity, including event volume, success and failure outcomes, and top active users. It highlights event and resource type distributions, geographic activity patterns, and time-based trends to help teams detect anomalous access behavior. The dashboard also includes detailed event summaries for faster triage and investigation.
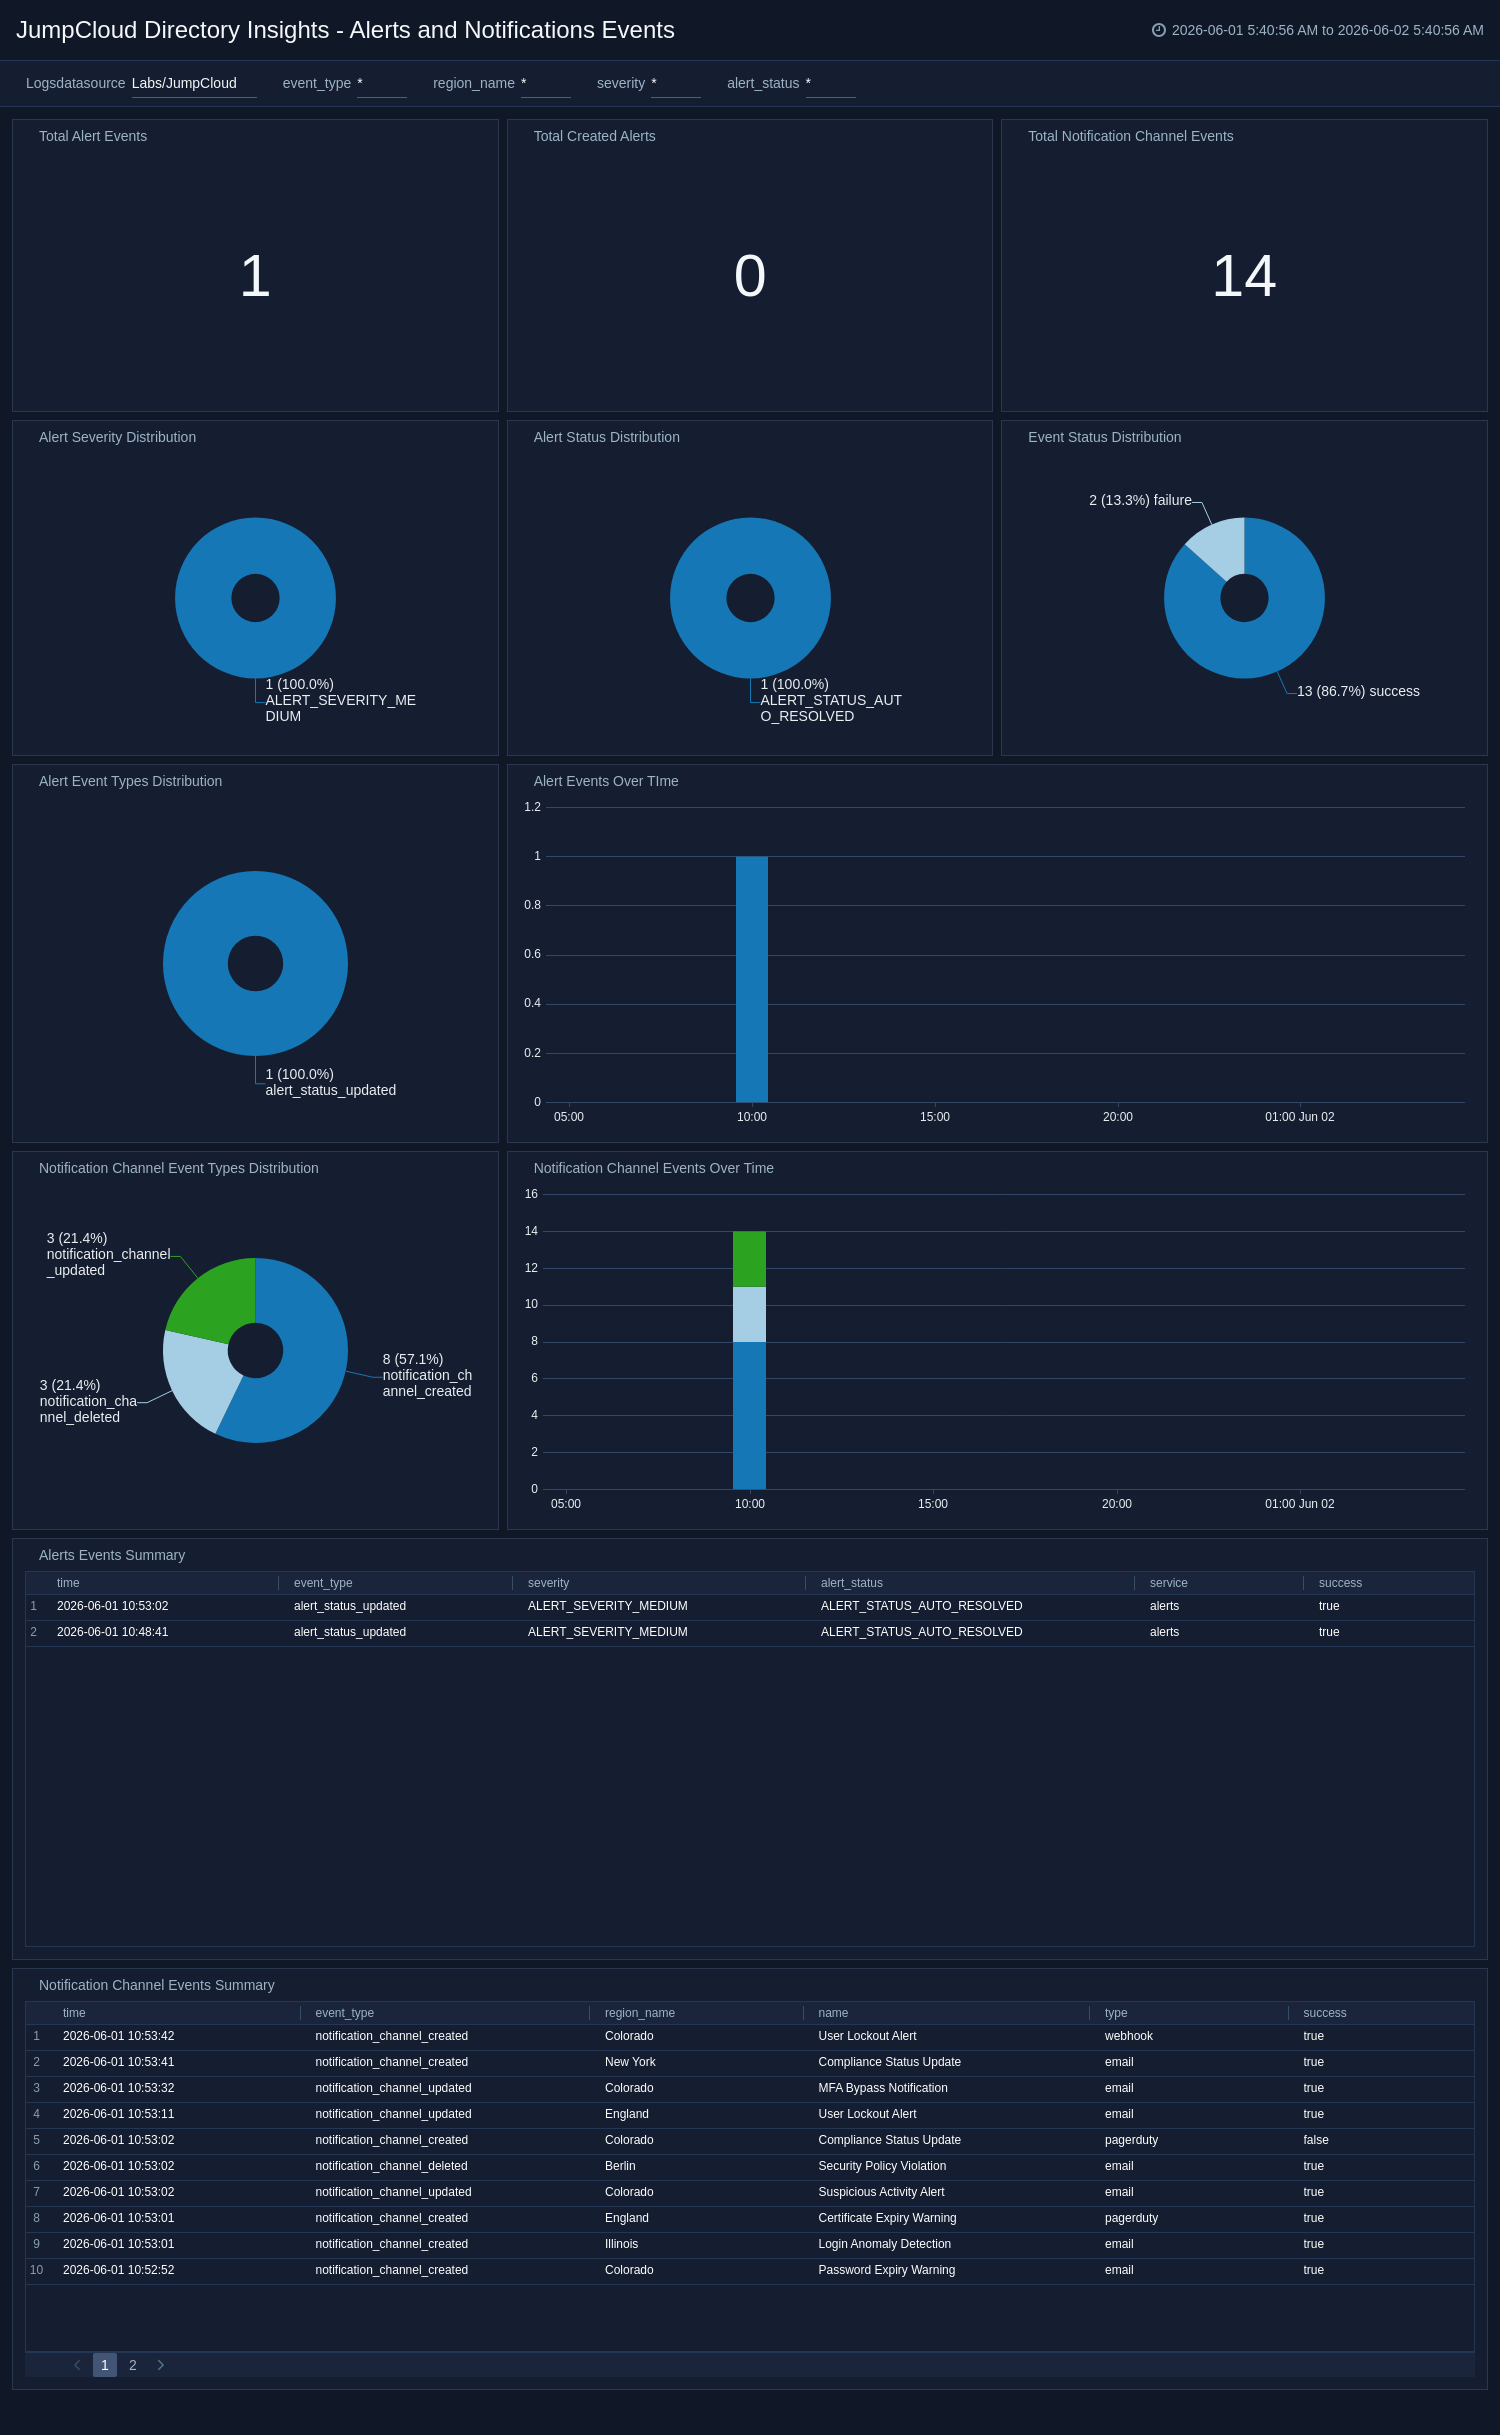
Alerts and Notifications Events
The JumpCloud Directory Insights - Alerts and Notifications Events dashboard provides comprehensive visibility into alert lifecycle and notification channel activity. It tracks alert creation and status changes, severity trends, notification event patterns, and event status distributions over time. With detailed summary tables and trend views, the dashboard helps security teams validate alerting posture and investigate response workflow changes.
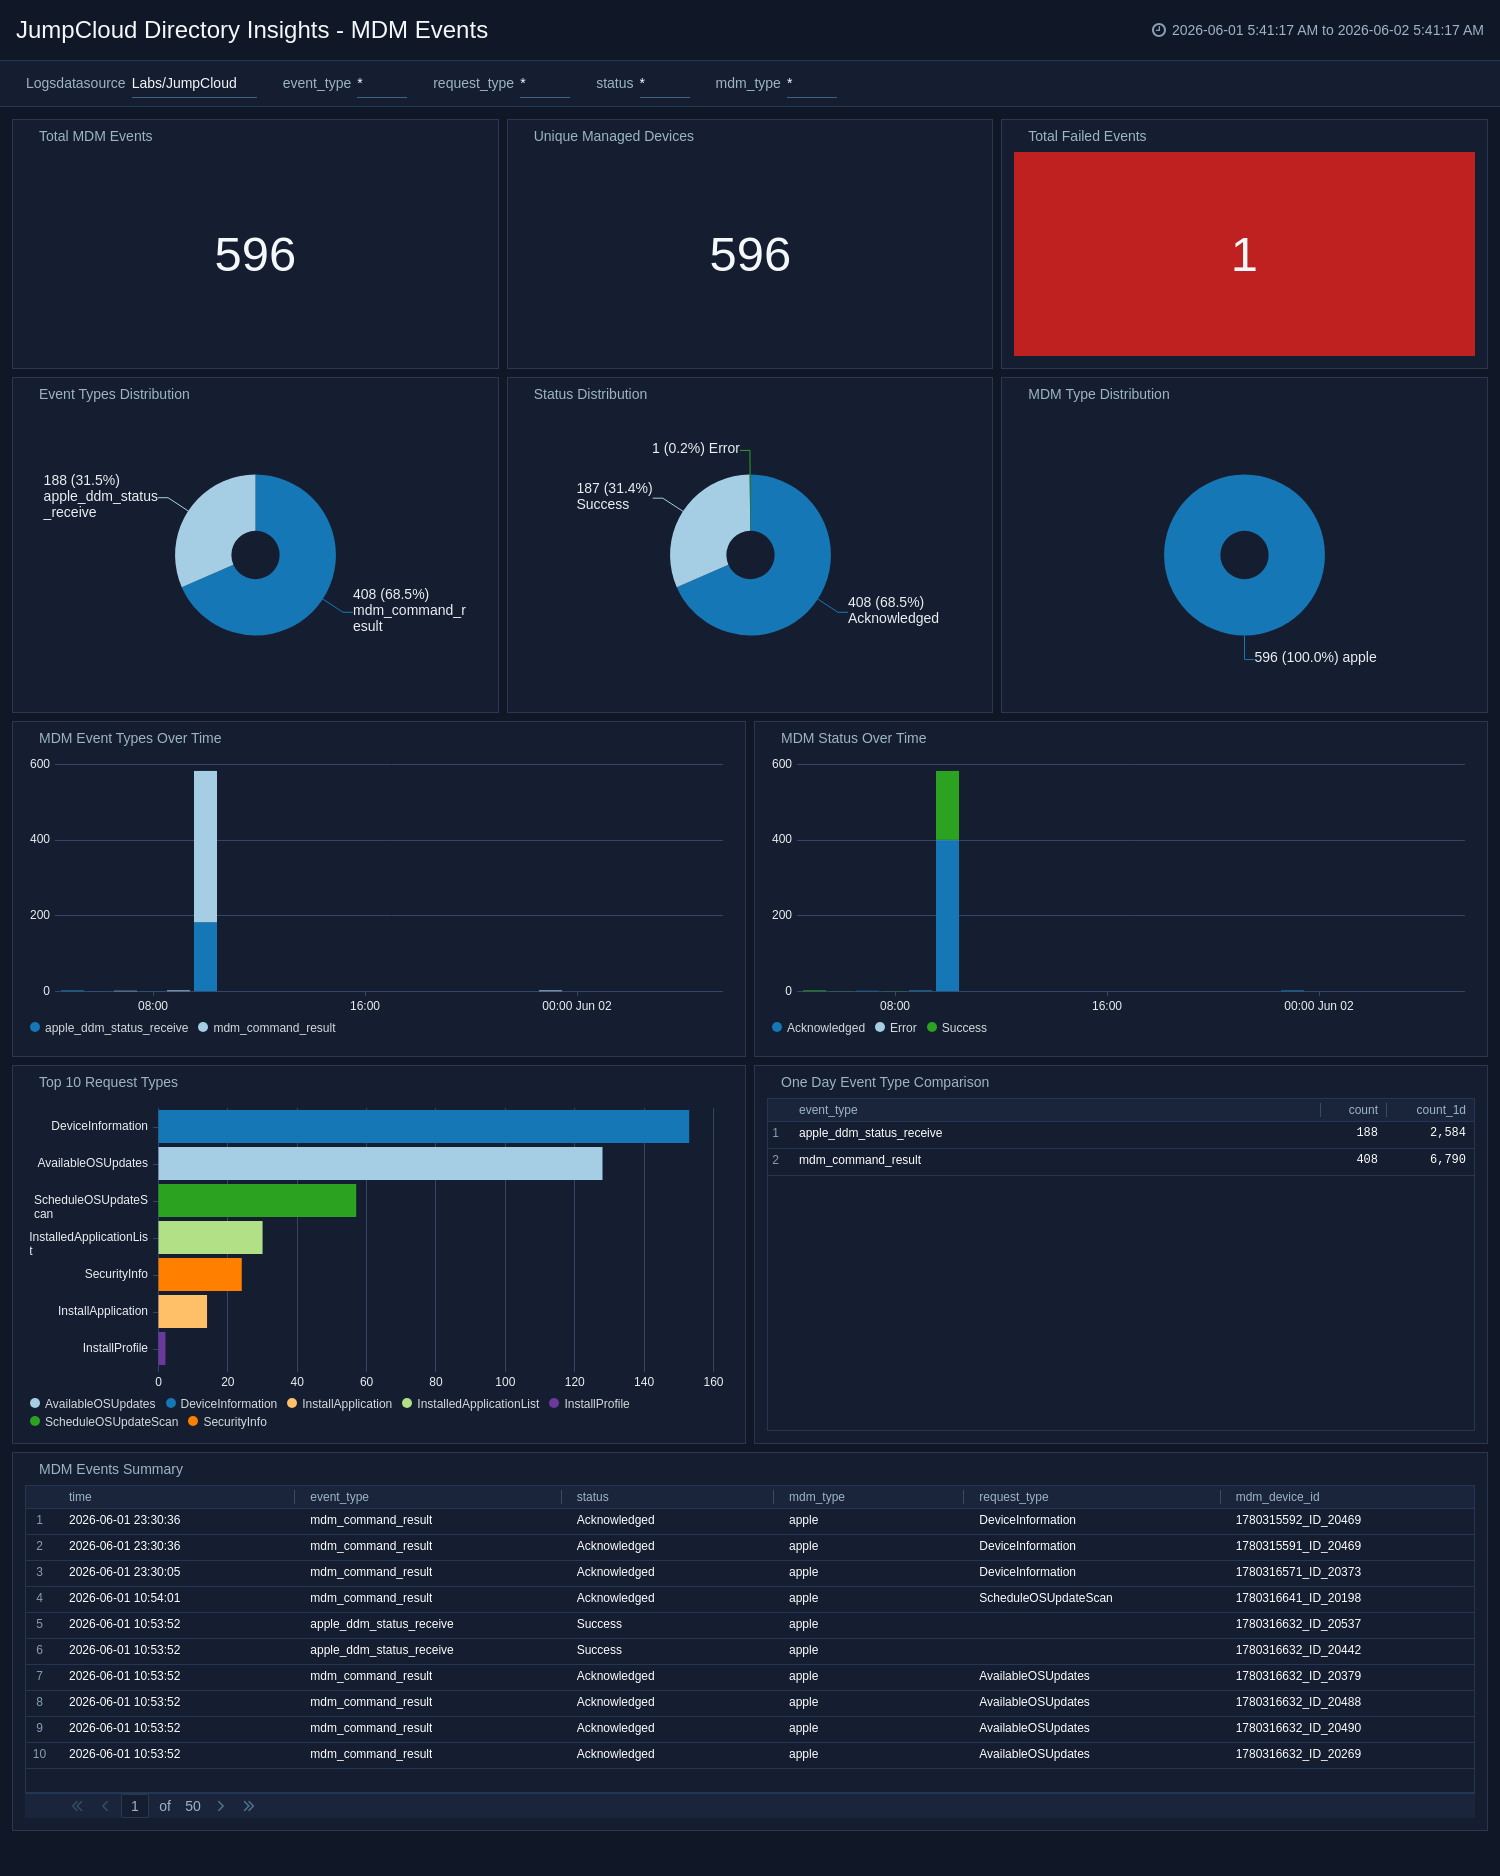
MDM Events
The JumpCloud Directory Insights - MDM Events dashboard provides end-to-end visibility into mobile device management activity, including command execution, request types, status outcomes, and device counts. It surfaces MDM-type distributions, event trends, and failure indicators to help teams assess fleet health and operational reliability. Detailed event summaries support troubleshooting of enrollment and command anomalies.
Create monitors for the JumpCloud Directory Insights app
From your App Catalog:
- From the Sumo Logic navigation, select App Catalog.
- In the Search Apps field, search for and then select your app.
- Make sure the app is installed.
- Navigate to What's Included tab and scroll down to the Monitors section.
- Click Create next to the pre-configured monitors. In the create monitors window, adjust the trigger conditions and notifications settings based on your requirements.
- Scroll down to Monitor Details.
- Under Location click on New Folder.
note
By default, monitor will be saved in the root folder. So to make the maintenance easier, create a new folder in the location of your choice.
- Enter Folder Name. Folder Description is optional.
tip
Using app version in the folder name will be helpful to determine the versioning for future updates.
- Click Create. Once the folder is created, click on Save.
JumpCloud Directory Insights monitors
| Name | Description | Trigger Type (Critical / Warning / MissingData) | Alert Condition |
|---|---|---|---|
JumpCloud Directory Insights - Alerts Created | This alert is triggered when potential security risks, configuration issues, or critical system events requiring investigation are identified. | Critical | Count > 5 |
JumpCloud Directory Insights - Disabled MFA | This alert is triggered when unauthorized flags or accidental removal of MFA are identified. This could expose accounts to compromise, and immediate review is recommended to ensure compliance and security. | Critical | Count > 0 |
JumpCloud Directory Insights - Events from Embargoed Locations | This alert is triggered when logins or actions from embargoed locations are detected, suggesting potential unauthorized access. Investigate to confirm legitimacy or block malicious actors. | Critical | Count > 0 |
JumpCloud Directory Insights - Impossible Logins | This alert is triggered when the user account is compromised. For example, a user logging in from two distant locations consecutively. Immediate investigation is required to rule out credential theft. | Critical | Count > 0 |
JumpCloud Directory Insights - Unsuccessful Logins | This alert is triggered when credentials are misconfigured or when brute-force attacks and credential stuffing are detected. Review source IPs and lock accounts if suspicious activity is confirmed. | Critical | Count > 5 |
JumpCloud Directory Insights - Unsuccessful SSOs | This alert is triggered by misconfigurations in identity providers or malicious attempts to bypass SSO. Check SSO logs to identify the cause or any threats. | Critical | Count > 1 |
Upgrade/Downgrade the JumpCloud Directory Insights app (Optional)
To update the app, do the following:
Next-Gen App: To install or update the app, you must be an account administrator or a user with Manage Apps, Manage Monitors, Manage Fields, Manage Metric Rules, and Manage Collectors capabilities depending upon the different content types part of the app.
- Select App Catalog.
- In the Search Apps field, search for and then select your app.
Optionally, you can identify apps that can be upgraded in the Upgrade available section. - To upgrade the app, select Upgrade from the Manage dropdown.
- If the upgrade does not have any configuration or property changes, you will be redirected to the Preview & Done section.
- If the upgrade has any configuration or property changes, you will be redirected to the Setup Data page.
- In the Configure section of your respective app, complete the following fields.
- Field Name. If you already have collectors and sources set up, select the configured metadata field name (eg _sourcecategory) or specify other custom metadata (eg: _collector) along with its metadata Field Value.
- Click Next. You will be redirected to the Preview & Done section.
Post-update
Your upgraded app will be installed in the Installed Apps folder and dashboard panels will start to fill automatically.
See our Release Notes changelog for new updates in the app.
To revert the app to a previous version, do the following:
- Select App Catalog.
- In the Search Apps field, search for and then select your app.
- To version down the app, select Revert to < previous version of your app > from the Manage dropdown.
Uninstalling the JumpCloud Directory Insights app (Optional)
To uninstall the app, do the following:
- Select App Catalog.
- In the 🔎 Search Apps field, run a search for your desired app, then select it.
- Click Uninstall.