LiteLLM
The Sumo Logic app for LiteLLM provides preconfigured dashboards to monitor request volume, latency, token consumption, spend, budget and rate limits, deployment and fallback health, infrastructure (Redis, Postgres), and user or route visibility. Use the app to track cost by team or API key, identify slow models, detect failures and fallbacks, and ensure your LLM proxy is running smoothly.
LiteLLM is an open-source proxy that provides a unified interface to call 100+ LLM APIs (OpenAI, Anthropic, AWS Bedrock, Groq, and more). It routes requests, manages fallbacks, tracks budgets, and exposes Prometheus metrics for observability.
Log and metric types
The Sumo Logic app for LiteLLM collects logs and metrics to provide comprehensive observability.
Logs
LiteLLM sends request and response logs to Sumo Logic via the sumologic callback, which POSTs log entries as JSON to an HTTP Logs and Metrics Source. These logs include:
- Request details (model, route, user, team, API key)
- Response metadata (tokens, latency, cost)
- Error information (exception class, status, messages)
- Security and compliance data (guardrails, PII detection, geographic access)
- MCP (Model Context Protocol) and RAG activity
Metrics
LiteLLM exposes Prometheus metrics at /metrics/ which are scraped by the OpenTelemetry Collector. Metrics include:
- Request counts (total, failed, by model/team/user)
- Latency metrics (total latency, API latency, time to first token)
- Token usage (input, output, total tokens)
- Cost tracking (spend by model, team, user)
- Budget metrics (remaining budget, hours until reset)
- Deployment health (success, failures, fallbacks, state)
- Rate limits (remaining requests, remaining tokens)
- Infrastructure metrics (Redis, Postgres, queue sizes)
For more details on metrics, see the LiteLLM Prometheus documentation.
Prerequisites
Before setting up the LiteLLM app, ensure the following:
- LiteLLM Proxy is installed and running. See LiteLLM documentation for installation instructions.
- OpenTelemetry Collector is installed on the same host as LiteLLM or can access the LiteLLM
/metrics/endpoint. See OpenTelemetry Collector Installation. - LiteLLM Prometheus metrics are enabled in your LiteLLM configuration.
- Sumo Logic Installation Token for registering the OTel Collector.
Collection Setup
As part of data collection setup and app installation, you can select the App from App Catalog and click on Install App. Follow the steps below.
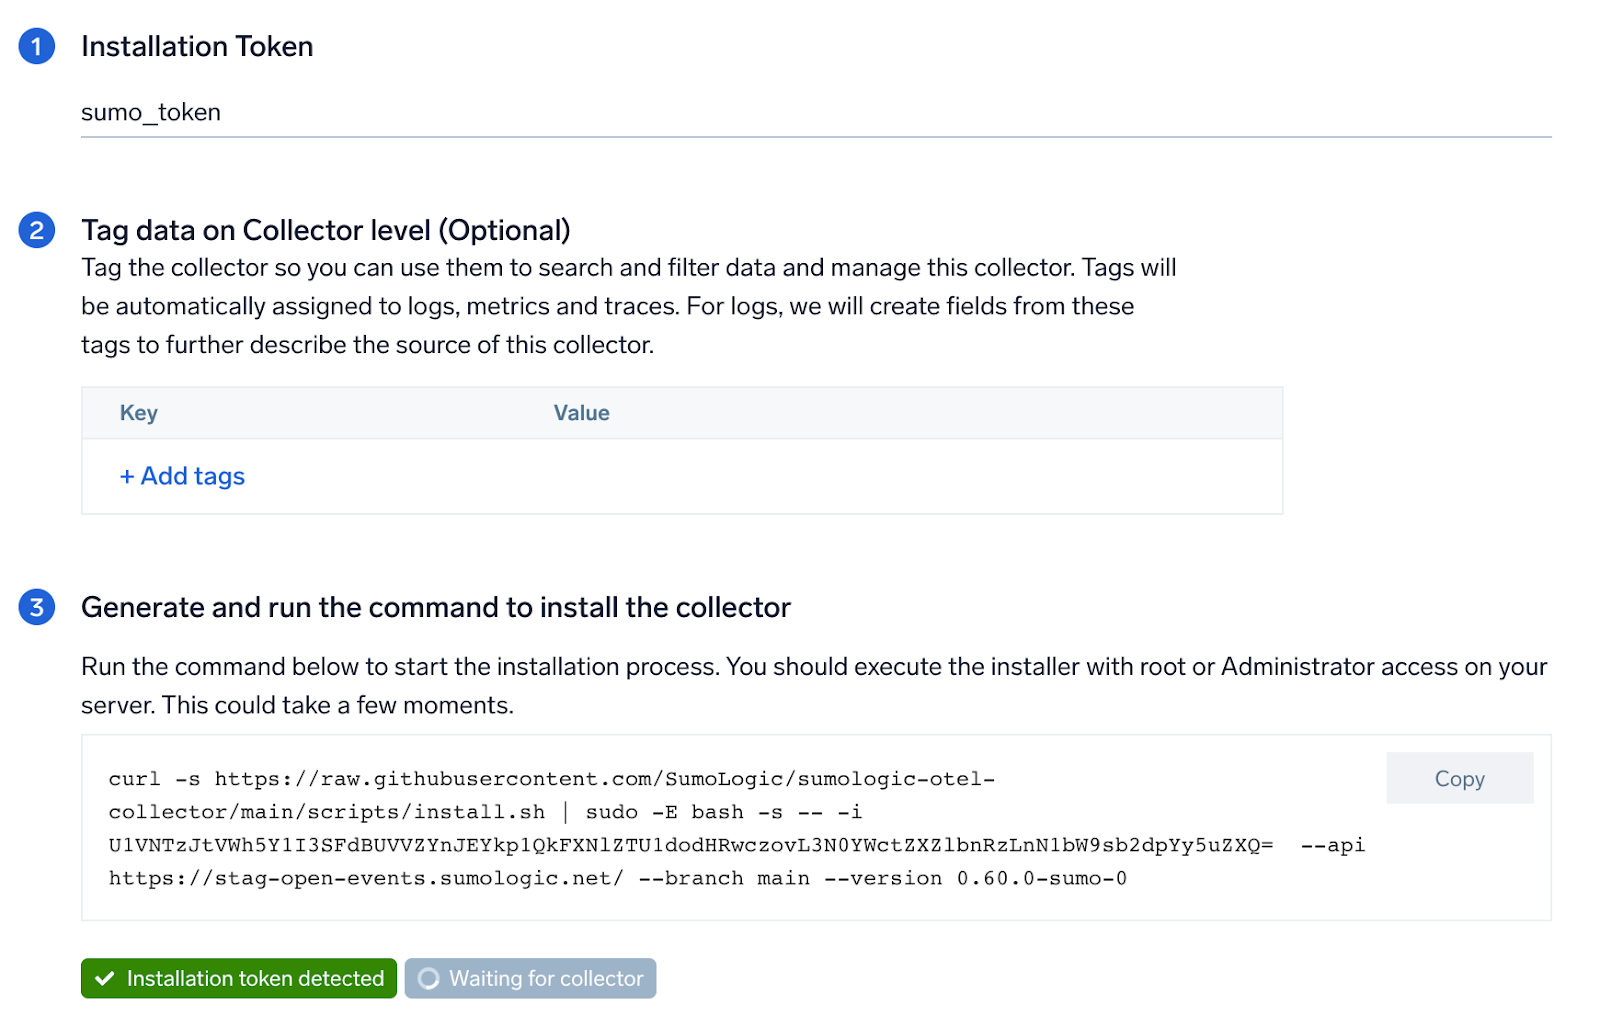
Step 1: Set up OpenTelemetry Collector
If you want to use an existing OpenTelemetry Collector, you can skip this step by selecting the Use an existing Collector option.
To create a new Collector:
- Select the Add a new Collector option.
- Select the platform where you want to install the Sumo Logic OpenTelemetry Collector.
This will generate a command that you can execute in the machine environment you need to monitor. Once executed, it will install the Sumo Logic OpenTelemetry Collector.
Please select locally managed collector option while creating new OpenTelemetry collector.
Step 2: Configure integration
In this step, you'll configure LiteLLM for logs and metrics collection.
1. LiteLLM Configuration
Add the following to your LiteLLM proxy configuration file (/app/config.yaml or your equivalent litellm-config.yaml path):
litellm_settings:
  # Enable Prometheus metrics, OTel tracing, and Sumo Logic log callback
  callbacks: ["prometheus", "otel", "sumologic"]
  # Enable system-level Prometheus metrics (Redis, Postgres, self latency)
  service_callback: ["prometheus_system"]
  # Required for provider rate-limit headers (remaining requests/tokens metrics)
  return_response_headers: true
  # Enable end-user cost tracking in Prometheus metrics
  enable_end_user_cost_tracking_prometheus_only: true
  # Store audit logs in the database
  store_audit_logs: true
  # Initialize budget metrics on startup
  prometheus_initialize_budget_metrics: true
Set the following environment variable:
| Variable | Required | Description |
|---|---|---|
PROMETHEUS_MULTIPROC_DIR | Yes | Directory for Prometheus multiprocess metric aggregation. Set to /prometheus_multiproc. The directory must exist before LiteLLM starts. Required when running LiteLLM with multiple workers. |
2. Logs Collection
LiteLLM sends logs directly to Sumo Logic via HTTP using the sumologic callback.
Create HTTP Logs and Metrics Source in Sumo Logic
- New UI. In the Sumo Logic main menu select Data Management, and then under Data Collection select Collection. You can also click the Go To... menu at the top of the screen and select Collection.
Classic UI. In the main Sumo Logic menu, select Manage Data > Collection > Collection. - Click Add Collector.
- Click Hosted Collector.
- Provide a Name for the Collector. Description is optional.
- Category. Enter any string to tag the logs collected from this Collector. This Source Category value is stored in a searchable metadata field called
_sourceCategory. - Click the +Add Field link in the Fields section. Add any fields you want to associate with this Collector; each field needs a name (key) and value.
- Time Zone. Set the default time zone when it is not extracted from the log timestamp.
- Review your input and click Save.
- In the Collectors page, click Add Source next to the Hosted Collector you just created.
- Select HTTP Logs & Metrics.
- Enter a Name to display for the Source. Description is optional.
- Source Category. Enter a value such as
litellm/logs. This value is stored in the_sourceCategorymetadata field. - Fields/Metadata. Click +Add to define any additional fields you want to associate.
- Click Save.
- In the HTTP Source Address dialog box, copy the generated Source URL. You will use this as the value for
SUMOLOGIC_WEBHOOK_URLin LiteLLM.
Configure LiteLLM to send logs to HTTP endpoint
Set the following environment variables for LiteLLM:
| Variable | Required | Description |
|---|---|---|
SUMOLOGIC_WEBHOOK_URL | Yes | HTTP Source URL copied from above. Used by the sumologic callback to POST log entries. |
GENERIC_LOGGER_ENDPOINT | Yes | Set to the same value as SUMOLOGIC_WEBHOOK_URL. Required by the LiteLLM generic logger fallback. |
Add the environment variables to your litellm-config.yaml:
environment_variables:
  SUMOLOGIC_WEBHOOK_URL: os.environ/SUMOLOGIC_WEBHOOK_URL
  GENERIC_LOGGER_ENDPOINT: os.environ/GENERIC_LOGGER_ENDPOINT
3. Metrics Collection
LiteLLM exposes Prometheus metrics at /metrics/, which are scraped by the OpenTelemetry Collector and forwarded to Sumo Logic.
Configure Prometheus metrics in LiteLLM
Configure the prometheus_metrics_config block to control which metrics and labels are exposed at /metrics/. Add the following to your litellm-config.yaml:
Click to expand prometheus_metrics_config
prometheus_metrics_config:
  - group: "proxy_total_requests"
    metrics:
      - "litellm_proxy_total_requests_metric"
    include_labels:
      - "api_key_alias"
      - "end_user"
      - "hashed_api_key"
      - "requested_model"
      - "route"
      - "status_code"
      - "team"
      - "team_alias"
      - "user"
      - "user_email"

  - group: "proxy_failed_requests"
    metrics:
      - "litellm_proxy_failed_requests_metric"
    include_labels:
      - "api_key_alias"
      - "end_user"
      - "exception_class"
      - "exception_status"
      - "hashed_api_key"
      - "requested_model"
      - "route"
      - "team"
      - "team_alias"
      - "user"
      - "user_email"

  - group: "latency_metrics"
    metrics:
      - "litellm_request_total_latency_metric"
      - "litellm_llm_api_latency_metric"
    include_labels:
      - "api_key_alias"
      - "end_user"
      - "hashed_api_key"
      - "model"
      - "requested_model"
      - "team"
      - "team_alias"
      - "user"

  - group: "token_metrics"
    metrics:
      - "litellm_input_tokens_metric"
      - "litellm_output_tokens_metric"
      - "litellm_total_tokens_metric"
    include_labels:
      - "end_user"
      - "hashed_api_key"
      - "api_key_alias"
      - "requested_model"
      - "team"
      - "team_alias"
      - "user"
      - "model"

  - group: "team_budget_metrics"
    metrics:
      - "litellm_remaining_team_budget_metric"
      - "litellm_team_max_budget_metric"
      - "litellm_team_budget_remaining_hours_metric"
    include_labels:
      - "team"
      - "team_alias"

  - group: "spend_metrics"
    metrics:
      - "litellm_spend_metric"
    include_labels:
      - "end_user"
      - "hashed_api_key"
      - "api_key_alias"
      - "model"
      - "team"
      - "team_alias"
      - "user"

  - group: "api_key_budget_metrics"
    metrics:
      - "litellm_api_key_max_budget_metric"
      - "litellm_remaining_api_key_budget_metric"
      - "litellm_api_key_budget_remaining_hours_metric"
    include_labels:
      - "hashed_api_key"
      - "api_key_alias"

  # Note: api_key_rate_limit_metrics and callback_logging_metrics
  # are not available in the current LiteLLM version

  - group: "deployment_success_responses_metric"
    metrics:
      - "litellm_deployment_success_responses"
    include_labels:
      - "requested_model"
      - "litellm_model_name"
      - "model_id"
      - "api_base"
      - "api_provider"
      - "hashed_api_key"
      - "api_key_alias"
      - "team"
      - "team_alias"

  - group: "deployment_failure_responses_metric"
    metrics:
      - "litellm_deployment_failure_responses"
    include_labels:
      - "requested_model"
      - "litellm_model_name"
      - "model_id"
      - "api_base"
      - "api_provider"
      - "hashed_api_key"
      - "api_key_alias"
      - "team"
      - "team_alias"
      - "exception_status"
      - "exception_class"

  - group: "deployment_total_requests_metric"
    metrics:
      - "litellm_deployment_total_requests"
    include_labels:
      - "requested_model"
      - "litellm_model_name"
      - "model_id"
      - "api_base"
      - "api_provider"
      - "hashed_api_key"
      - "api_key_alias"
      - "team"
      - "team_alias"

  - group: "provider_rate_limit_metrics"
    metrics:
      - "litellm_remaining_requests_metric"
      - "litellm_remaining_tokens_metric"
    include_labels:
      - "model_group"
      - "api_provider"
      - "api_base"
      - "litellm_model_name"
      - "hashed_api_key"
      - "api_key_alias"

  - group: "deployment_state_metric"
    metrics:
      - "litellm_deployment_state"
    include_labels:
      - "litellm_model_name"
      - "model_id"
      - "api_base"
      - "api_provider"

  - group: "deployment_latency_per_output_token_metric"
    metrics:
      - "litellm_deployment_latency_per_output_token"
    include_labels:
      - "litellm_model_name"
      - "model_id"
      - "api_base"
      - "api_provider"
      - "hashed_api_key"
      - "api_key_alias"
      - "team"
      - "team_alias"

  - group: "deployment_cooled_down_metric"
    metrics:
      - "litellm_deployment_cooled_down"
    include_labels:
      - "litellm_model_name"
      - "model_id"
      - "api_base"
      - "api_provider"

  - group: "fallback_metrics"
    metrics:
      - "litellm_deployment_successful_fallbacks"
      - "litellm_deployment_failed_fallbacks"
    include_labels:
      - "requested_model"
      - "fallback_model"
      - "hashed_api_key"
      - "api_key_alias"
      - "team"
      - "team_alias"
      - "exception_status"
      - "exception_class"

  - group: "request_counting_metrics"
    metrics:
      - "litellm_requests_metric"
    include_labels:
      - "end_user"
      - "hashed_api_key"
      - "api_key_alias"
      - "model"
      - "team"
      - "team_alias"
      - "user"
      - "user_email"

  - group: "overhead_latency_metric"
    metrics:
      - "litellm_overhead_latency_metric"
    include_labels:
      - "model_group"
      - "api_provider"
      - "api_base"
      - "litellm_model_name"
      - "hashed_api_key"
      - "api_key_alias"

  - group: "time_to_first_token_metric"
    metrics:
      - "litellm_llm_api_time_to_first_token_metric"
    include_labels:
      - "model"
      - "hashed_api_key"
      - "api_key_alias"
      - "team"
      - "team_alias"

  - group: "system_health_metrics"
    metrics:
      - "litellm_pod_lock_manager_size"
      - "litellm_in_memory_daily_spend_update_queue_size"
      - "litellm_redis_daily_spend_update_queue_size"
      - "litellm_in_memory_spend_update_queue_size"
      - "litellm_redis_spend_update_queue_size"
The prometheus_metrics_config block controls which labels are emitted per metric group. Labels not listed in include_labels will be stripped from the metric series. Ensure all labels used in dashboard panel queries are included in the corresponding group.
Set up environment variable for OpenTelemetry Collector
Set the following environment variable:
| Variable | Required | Description |
|---|---|---|
SUMOLOGIC_INSTALLATION_TOKEN | Yes | Installation token used by the sumologic extension to register the collector identity with Sumo Logic. Get this from Sumo Logic under Manage Data > Collection > Collection. |
Configure OpenTelemetry Collector
Create the OpenTelemetry Collector configuration file (litellm.yaml) with the following content. This configuration scrapes Prometheus metrics from LiteLLM and forwards them to Sumo Logic:
extensions:
  sumologic:
    installation_token: ${SUMOLOGIC_INSTALLATION_TOKEN}
    collector_name: litellm-otel-collector

receivers:
  prometheus:
    config:
      scrape_configs:
        - job_name: 'litellm'
          scrape_interval: 30s
          metrics_path: '/metrics/'
          static_configs:
            - targets: ['localhost:4000']

processors:
  memory_limiter:
    check_interval: 1s
    limit_mib: 512
  resourcedetection/system:
    detectors: ["system"]
    system:
      hostname_sources: ["os"]
  resource/common:
    attributes:
      - key: sumo.datasource
        value: litellm-metrics
        action: upsert
      - key: _sourceCategory
        value: otel/litellm/metrics
        action: upsert
      - key: service.name
        value: litellm-proxy
        action: upsert
      - key: deployment.environment
        value: production
        action: upsert
  resource/sumologic:
    attributes:
      - key: cloud.availability_zone
        action: delete
      - key: k8s.pod.uid
        action: delete

exporters:
  sumologic:
    metric_format: prometheus
    sending_queue:
      queue_size: 2048000
      batch:
        flush_timeout: 5s
        min_size: 2048

service:
  extensions: [sumologic]
  pipelines:
    metrics:
      receivers: [prometheus]
      processors: [memory_limiter, resourcedetection/system, resource/common, resource/sumologic]
      exporters: [sumologic]
- Adjust the
targetsfield if LiteLLM runs on a different host or port (default islocalhost:4000) - Do not change
_sourceCategory(otel/litellm/metrics) ordeployment.environmentvalues unless you modify dashboard template variables - The collector saves credentials in
/root/.sumologic-otel-collector. Persist this directory across restarts
This configuration file will be placed in the appropriate directory based on your platform in Step 3.
Step 3: Send logs and metrics to Sumo Logic
Once you have downloaded the YAML file as described in the previous step, follow the below steps based on your platform.
- Linux
- Windows
- macOS
- Chef
- Ansible
- Puppet
- Create the OTel collector configuration file at
/etc/otelcol-sumo/conf.d/litellm.yamlwith the configuration provided in Step 2. - Restart the collector using:
sudo systemctl restart otelcol-sumo
- Create the OTel collector configuration file at
C:\ProgramData\Sumo Logic\OpenTelemetry Collector\config\conf.d\litellm.yamlwith the configuration provided in Step 2. - Restart the collector using:
Restart-Service -Name OtelcolSumo
- Create the OTel collector configuration file at
/etc/otelcol-sumo/conf.d/litellm.yamlwith the configuration provided in Step 2. - Restart the otelcol-sumo process using the below command:
otelcol-sumo --config /etc/otelcol-sumo/sumologic.yaml --config "glob:/etc/otelcol-sumo/conf.d/*.yaml"
- Copy the yaml file into your Chef cookbook files directory
files/<downloaded_yaml_file>.` - Use a Chef file resource in a recipe to manage it.
cookbook_file '/etc/otelcol-sumo/conf.d/<downloaded_yaml_file>' domode 0644notifies :restart, 'service[otelcol-sumo]', :delayedend
- Use a Chef file resource in a recipe to manage it.
cookbook_file '/etc/otelcol-sumo/env/<downloaded_env_file>' domode 0600notifies :restart, 'service[otelcol-sumo]', :delayedend
- Add the recipe to your collector setup to start collecting. Every team typically has their established way of applying the Chef recipe. The resulting Chef recipe should look something like:
cookbook_file '/etc/otelcol-sumo/conf.d/<downloaded_yaml_file>' domode 0644notifies :restart, 'service[otelcol-sumo]', :delayedendcookbook_file '/etc/otelcol-sumo/env/<downloaded_env_file>' domode 0600notifies :restart, 'service[otelcol-sumo]', :delayedend
- Place the file into your Ansible playbook files directory.
- Run the Ansible playbook using:
ansible-playbook -i inventory install_sumologic_otel_collector.yaml-e '{"installation_token": "<YOUR_TOKEN>", "collector_tags": {<YOUR_TAGS>}, "src_config_path": "files/conf.d", "src_env_path": "files/env"}'
- Place the file into your Puppet module files directory
modules/install_otel_collector/files/<downloaded_yaml>. - Use a Puppet file resource to manage it
file { '/etc/otelcol-sumo/conf.d/<downloaded_yaml_file>':ensure => present,source => 'puppet:///modules/install_otel_collector/<downloaded_yaml_file>',mode => '0644',notify => Service[otelcol-sumo],}
- Use a Puppet file resource to manage it
file { '/etc/otelcol-sumo/env/<downloaded_env_file>'ensure => present,source => 'puppet:///modules/install_otel_collector/<downloaded_env_file>',mode => '0600',notify => Service[otelcol-sumo],}
- Apply the Puppet manifest. Every team typically has their established way of applying the Puppet manifes. The resulting Puppet manifest should look something like:
node 'default' {class { 'install_otel_collector'installation_token => '<YOUR_TOKEN>',collector_tags => { <YOUR_TAGS> },}service { 'otelcol-sumo':provider => 'systemd',ensure => running,enable => true,require => Class['install_otel_collector'],}file { '/etc/otelcol-sumo/conf.d/<downloaded_yaml_file>':ensure => present,source => 'puppet:///modules/install_otel_collector/<downloaded_yaml_file>',mode => '0644',notify => Service[otelcol-sumo],}file { '/etc/otelcol-sumo/env/<downloaded_env_file>':ensure => present,source => 'puppet:///modules/install_otel_collector/<downloaded_env_file>',mode => '0600',notify => Service[otelcol-sumo],}}
After successfully executing the above command, Sumo Logic will start receiving data from your host machine.
Click Next. This will install the app (dashboards and monitors) to your Sumo Logic Org.
Dashboard panels will start to fill automatically. It's important to note that each panel fills with data matching the time range query and received since the panel was created. Results won't immediately be available, but within 20 minutes, you'll see full graphs and maps.
Viewing the LiteLLM dashboards
All dashboards have a set of filters that you can apply to the entire dashboard. Use these filters to drill down and examine the data to a granular level. You can change the time range for a dashboard or panel by selecting a predefined interval from a drop-down list, choosing a recently used time range, or specifying custom dates and times. Learn more.
You can use template variables to drill down and examine the data on a granular level. For more information, see Filtering Dashboards with Template Variables.
Most Next-Gen apps allow you to provide the scope at the installation time and are comprised of a key (_sourceCategory by default) and a default value for this key. Based on your input, the app dashboards will be parameterized with a dashboard variable, allowing you to change the dataset queried by all panels. This eliminates the need to create multiple copies of the same dashboard with different queries.
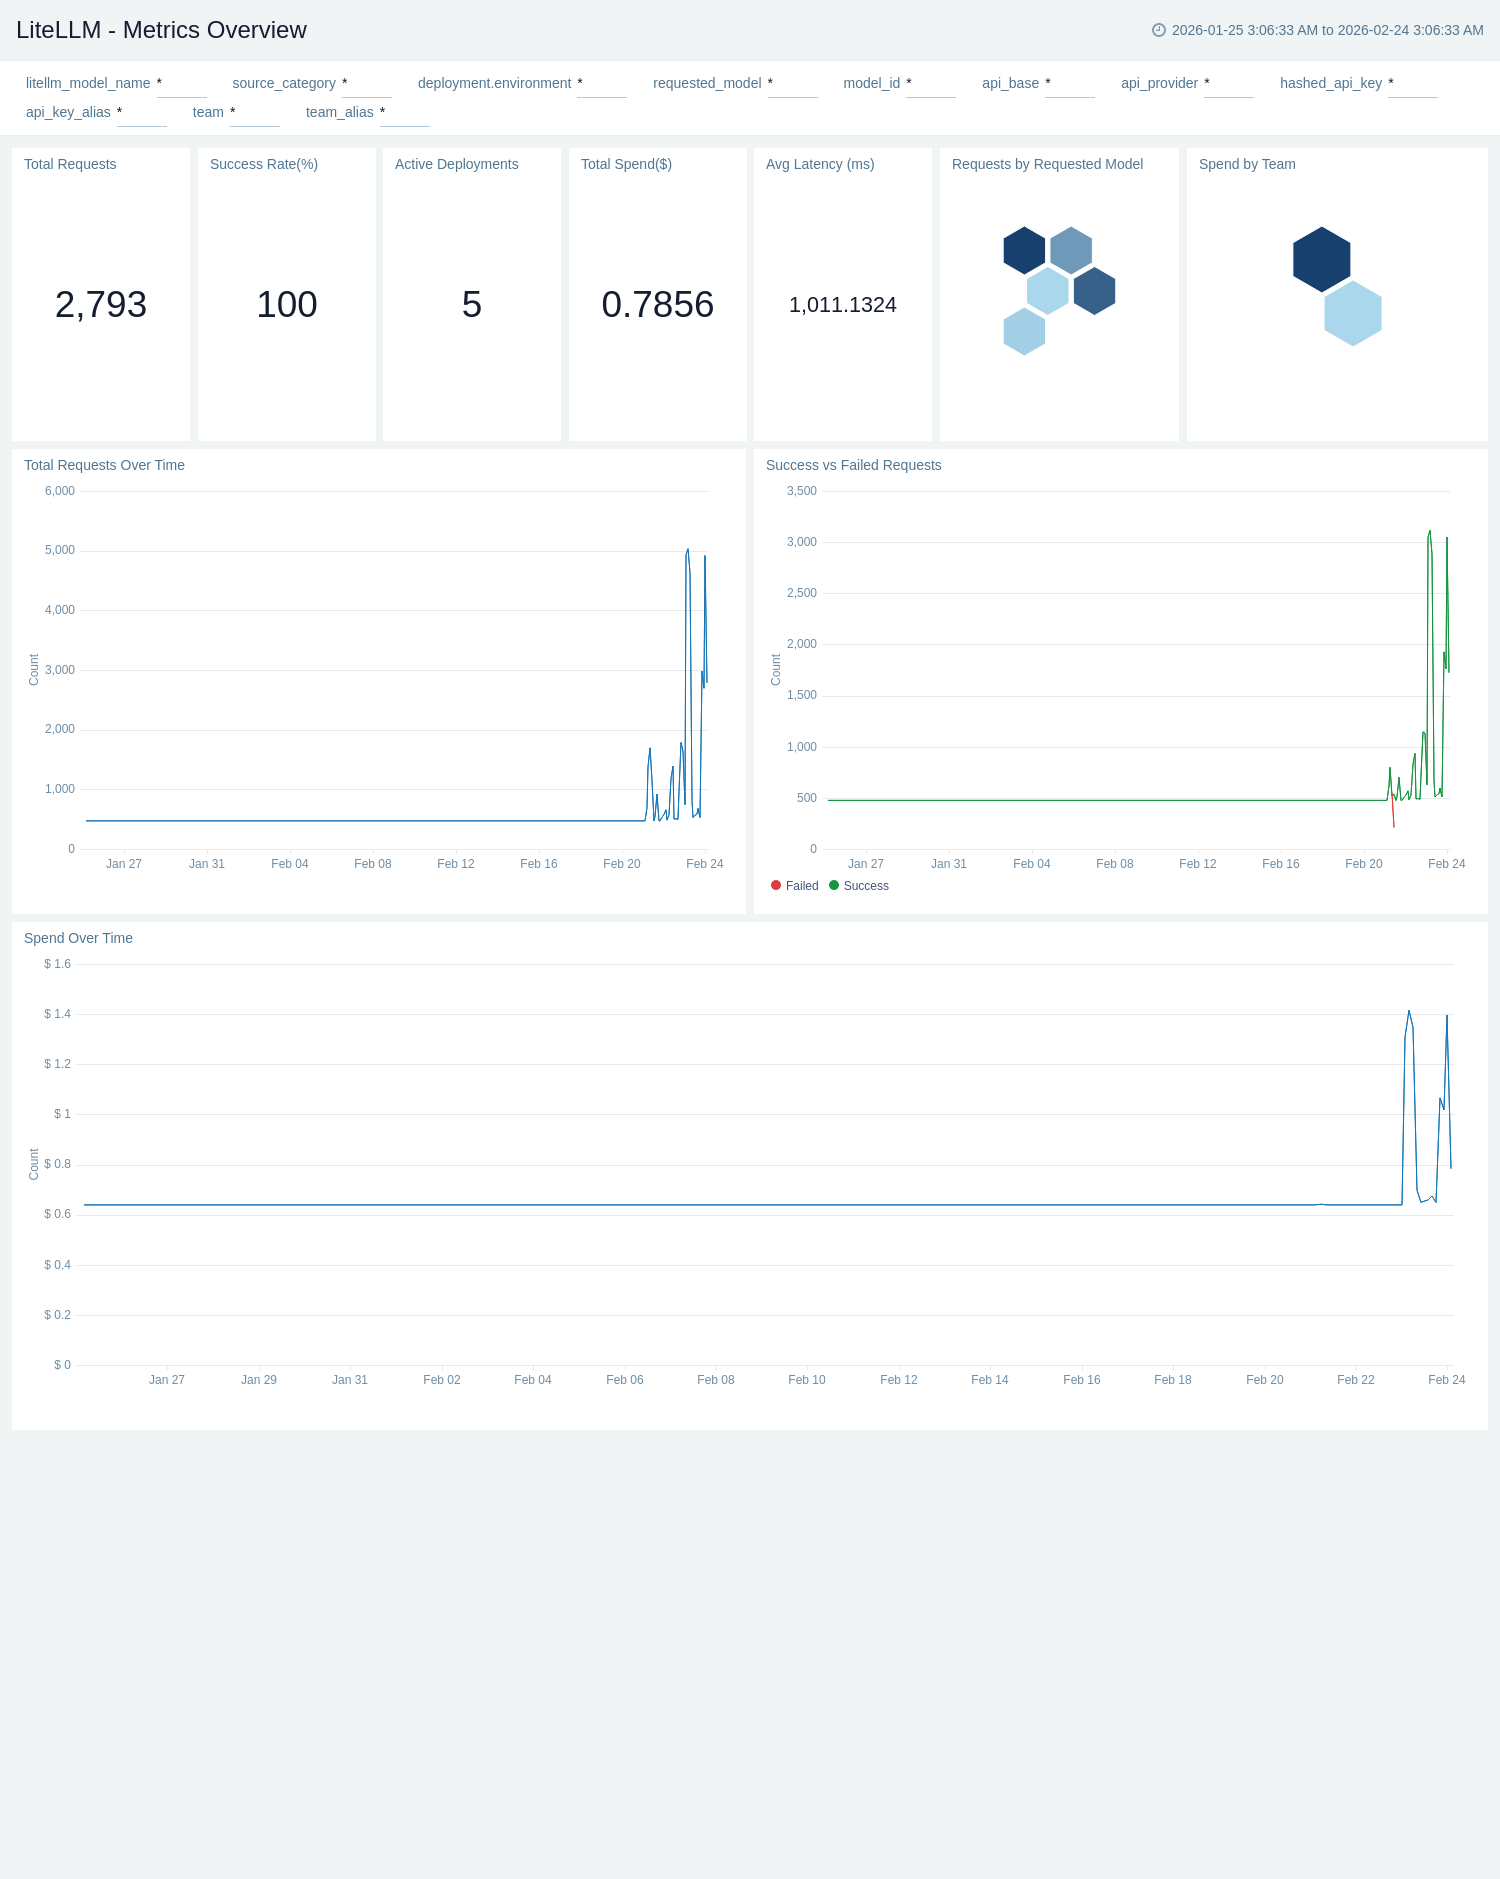
Metrics Overview
The LiteLLM - Metrics Overview dashboard provides high-level visibility into LiteLLM operational metrics and system health including total request volume, success rates, concurrent requests, request distribution across models and teams, and error rates.
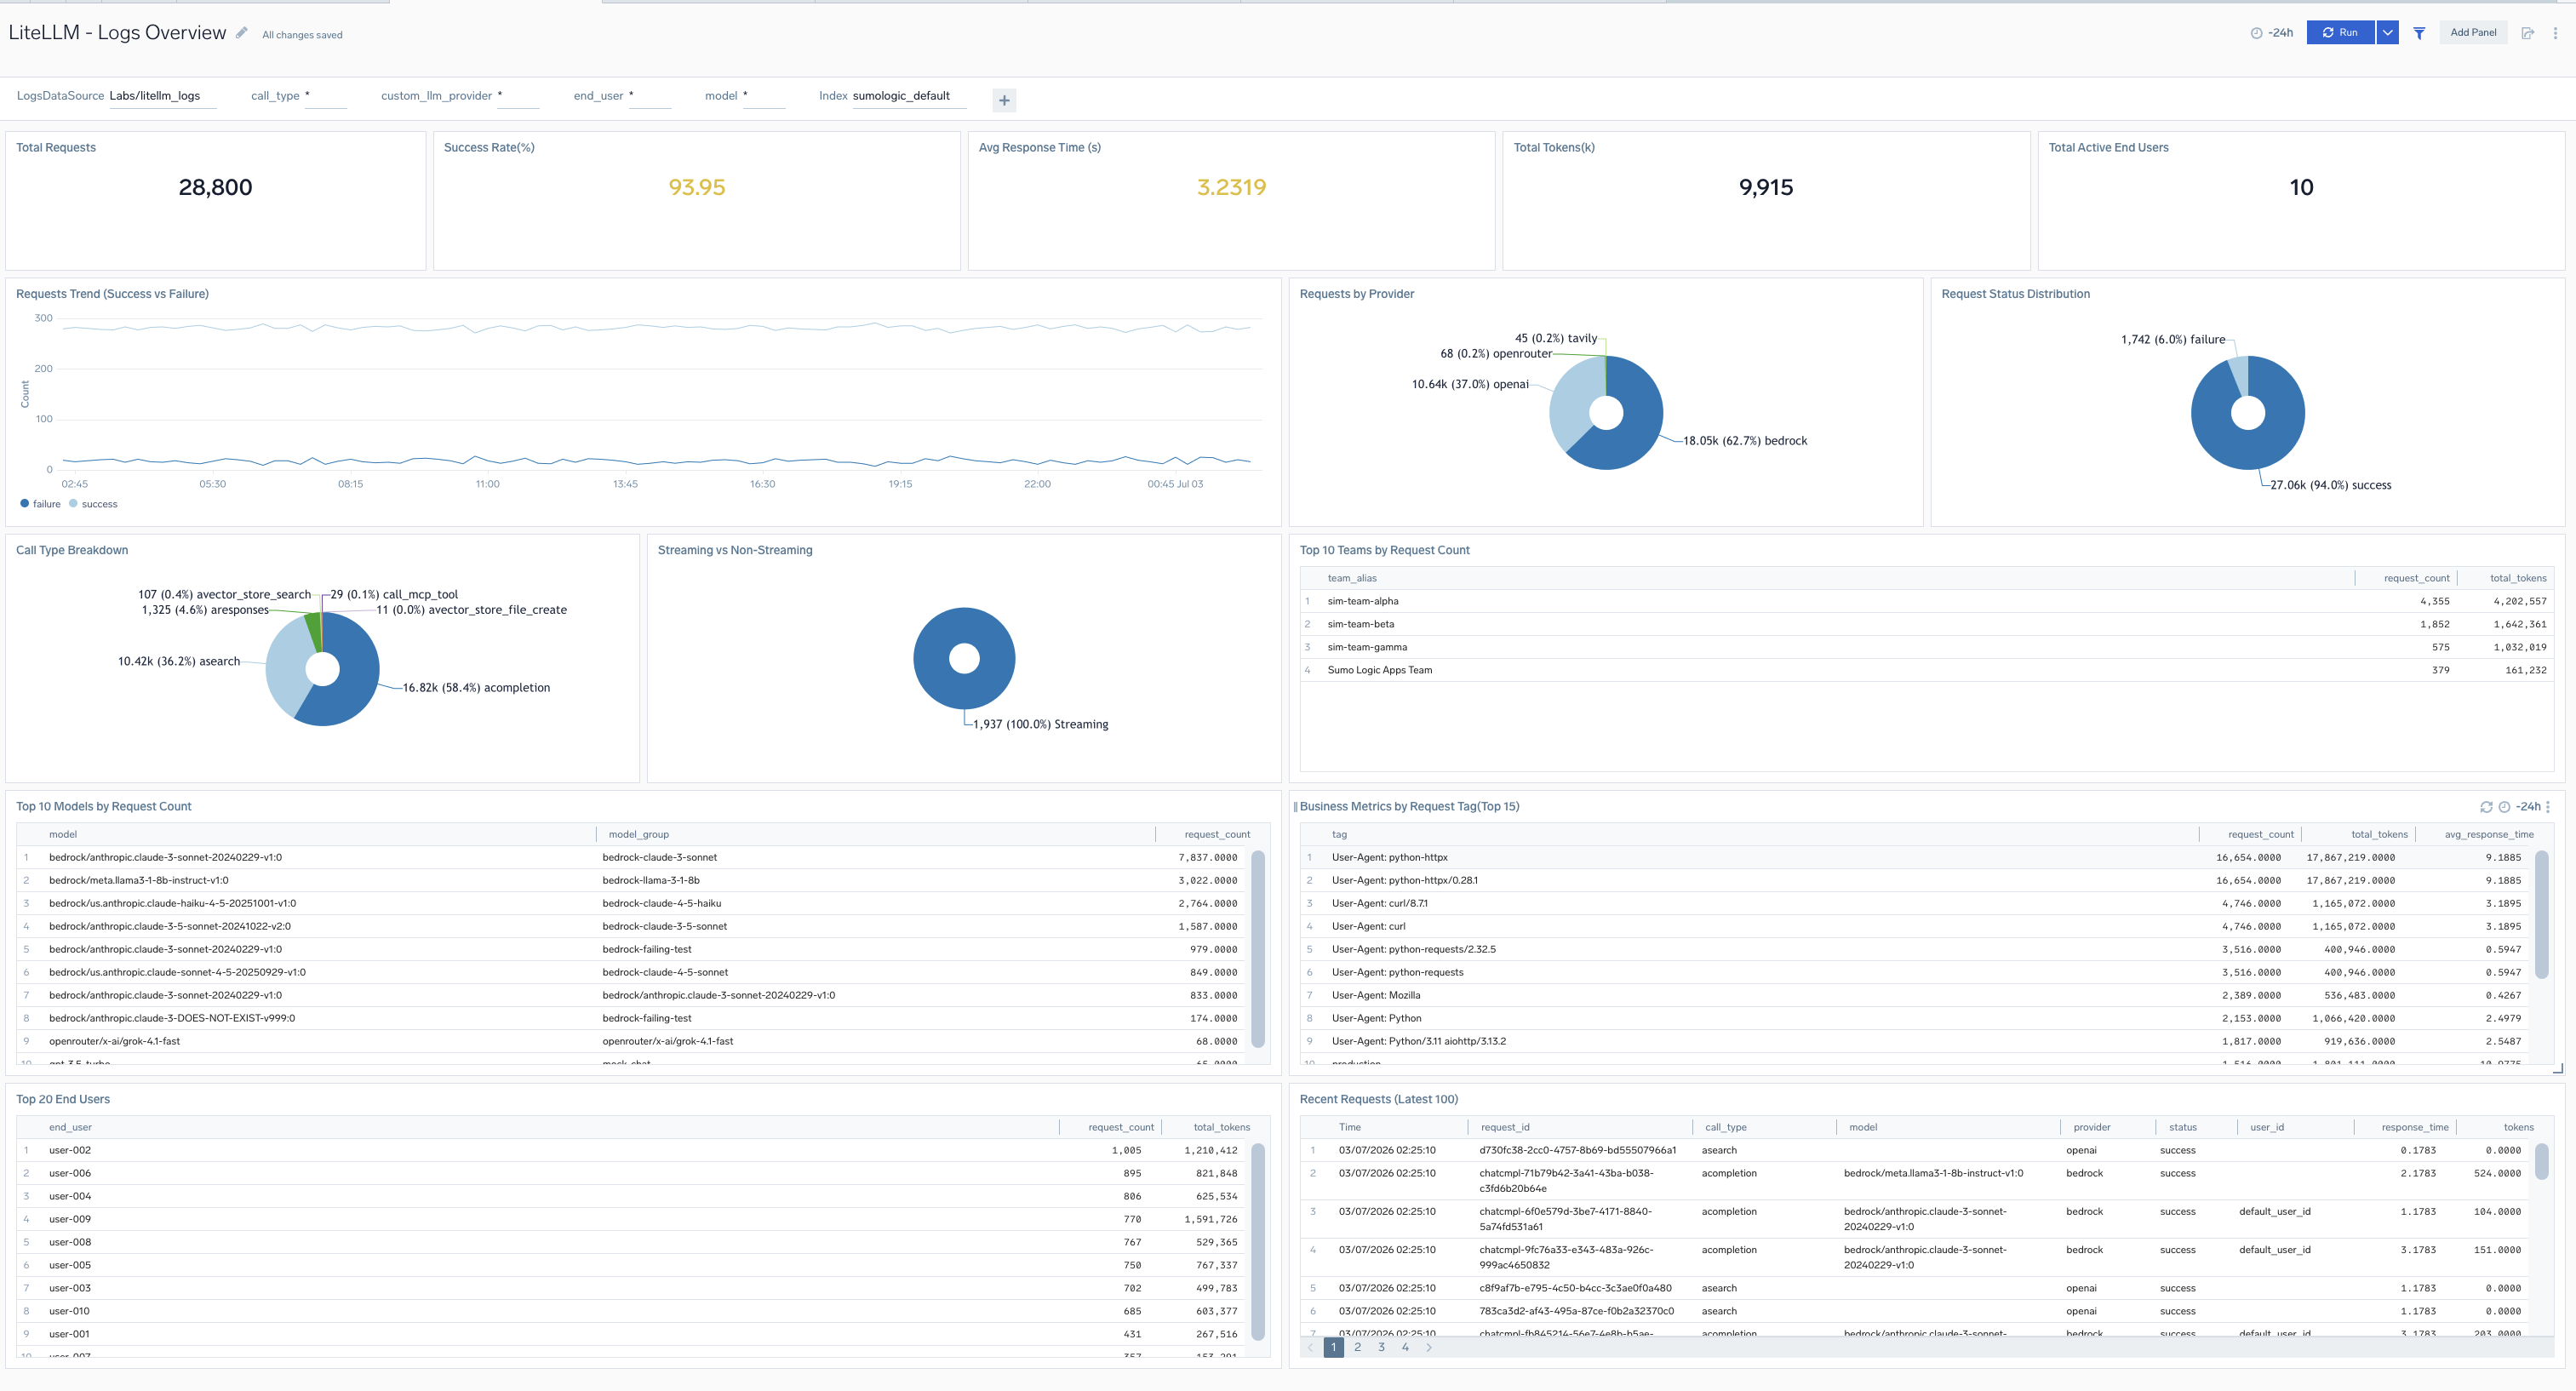
Logs Overview
The LiteLLM - Logs Overview dashboard provides high-level KPIs, business metrics, cost tracking, and usage patterns across all LiteLLM deployments including requests, success rates, costs, models, users, teams, and tags.
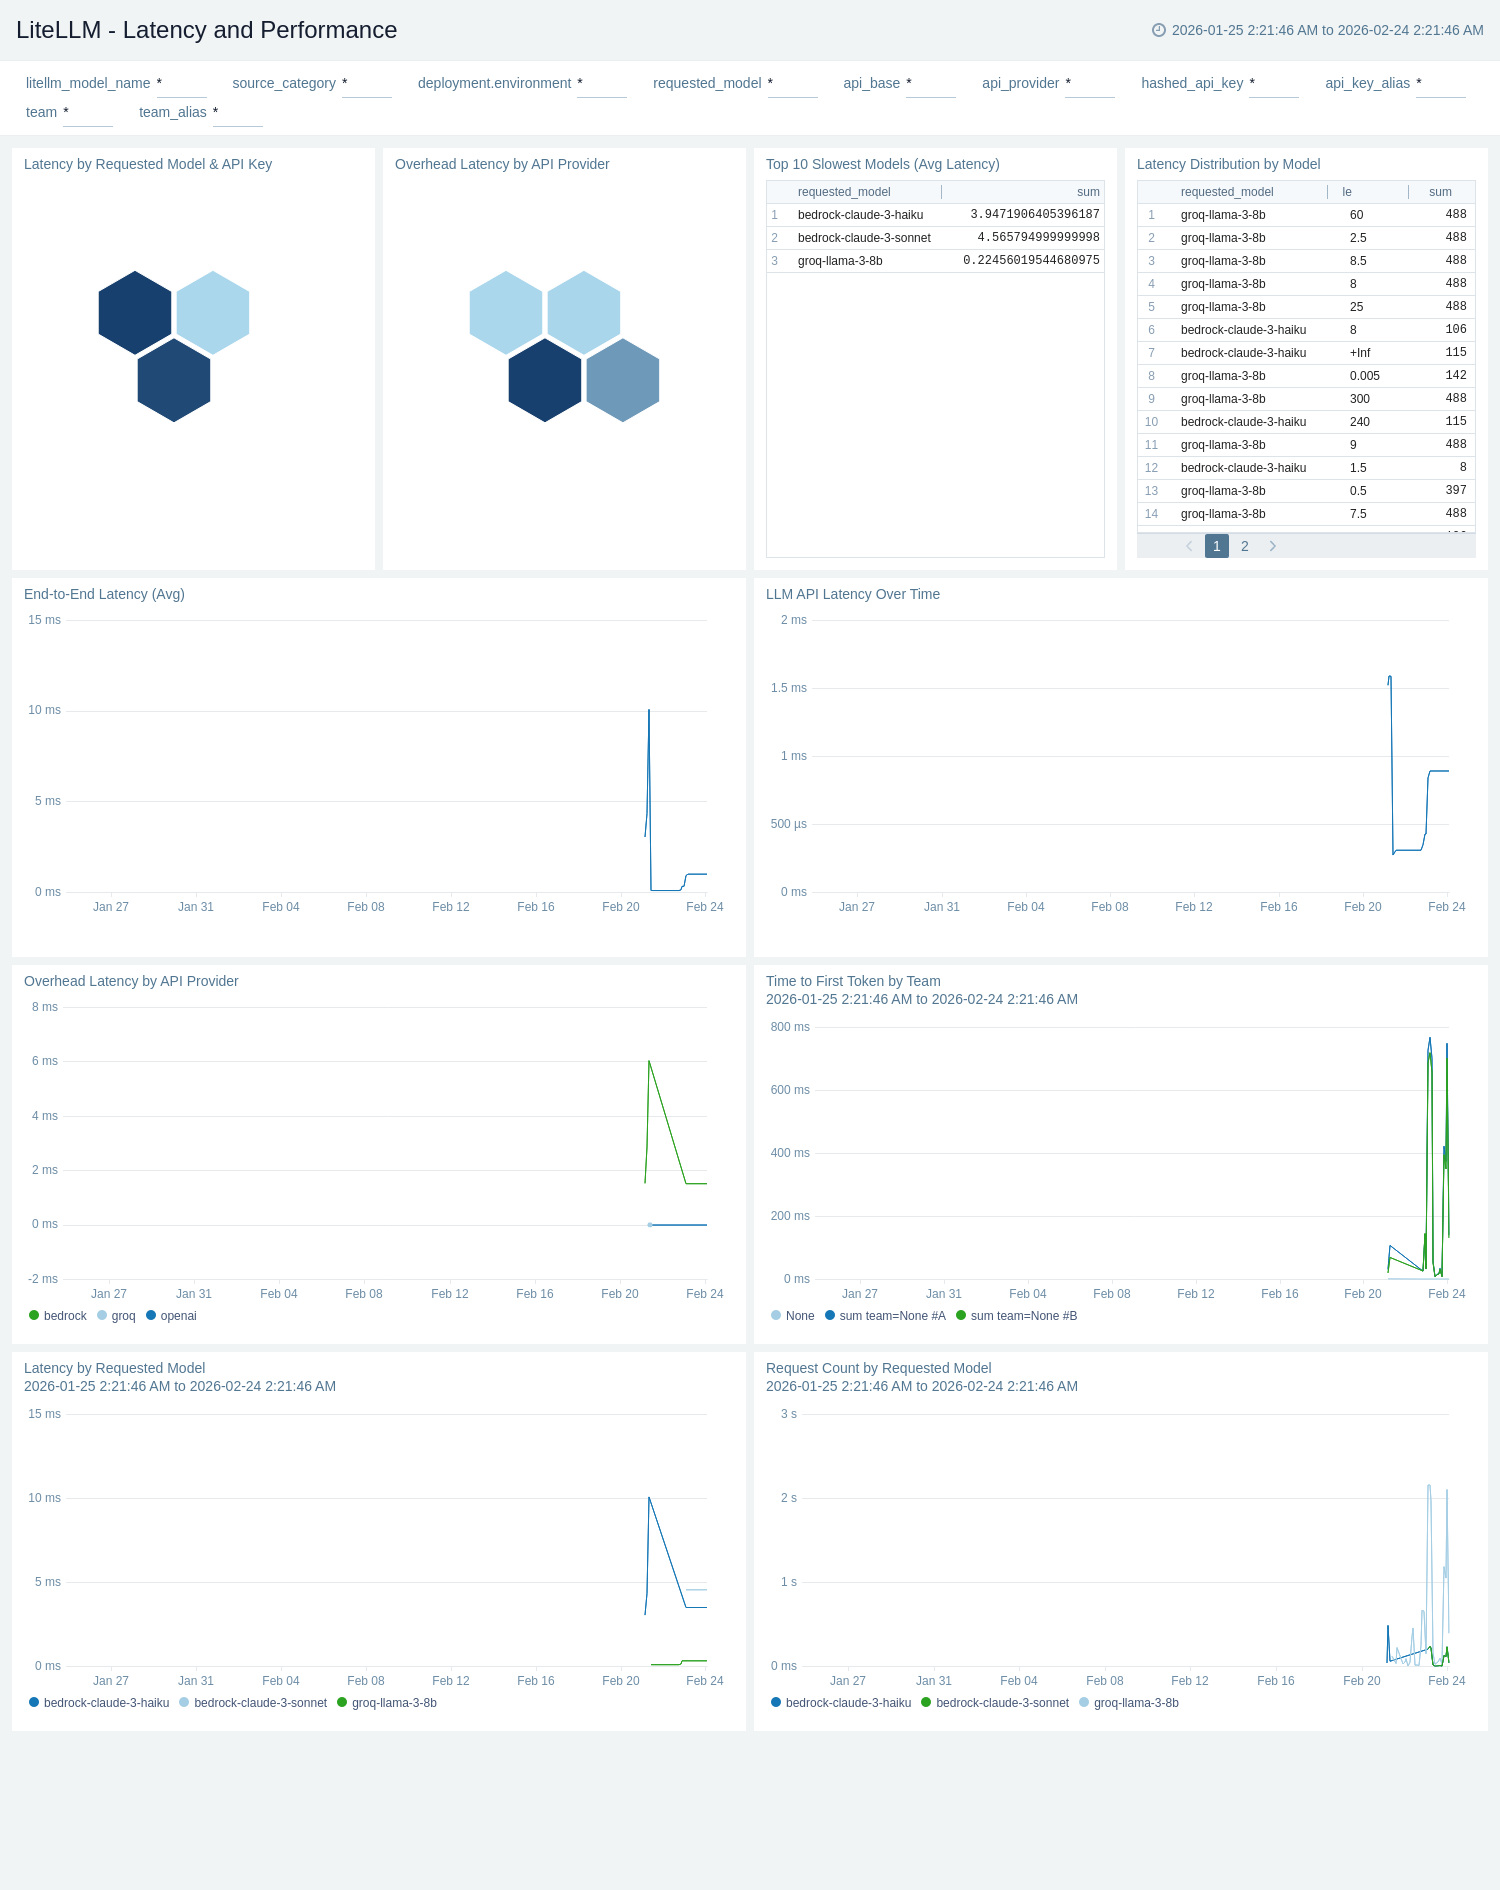
Latency and Performance
The LiteLLM - Latency and Performance dashboard provides comprehensive monitoring of response times and throughput metrics for LiteLLM including request latency percentiles (p50, p95, p99), time to first token (TTFT), streaming performance, and token throughput rates.
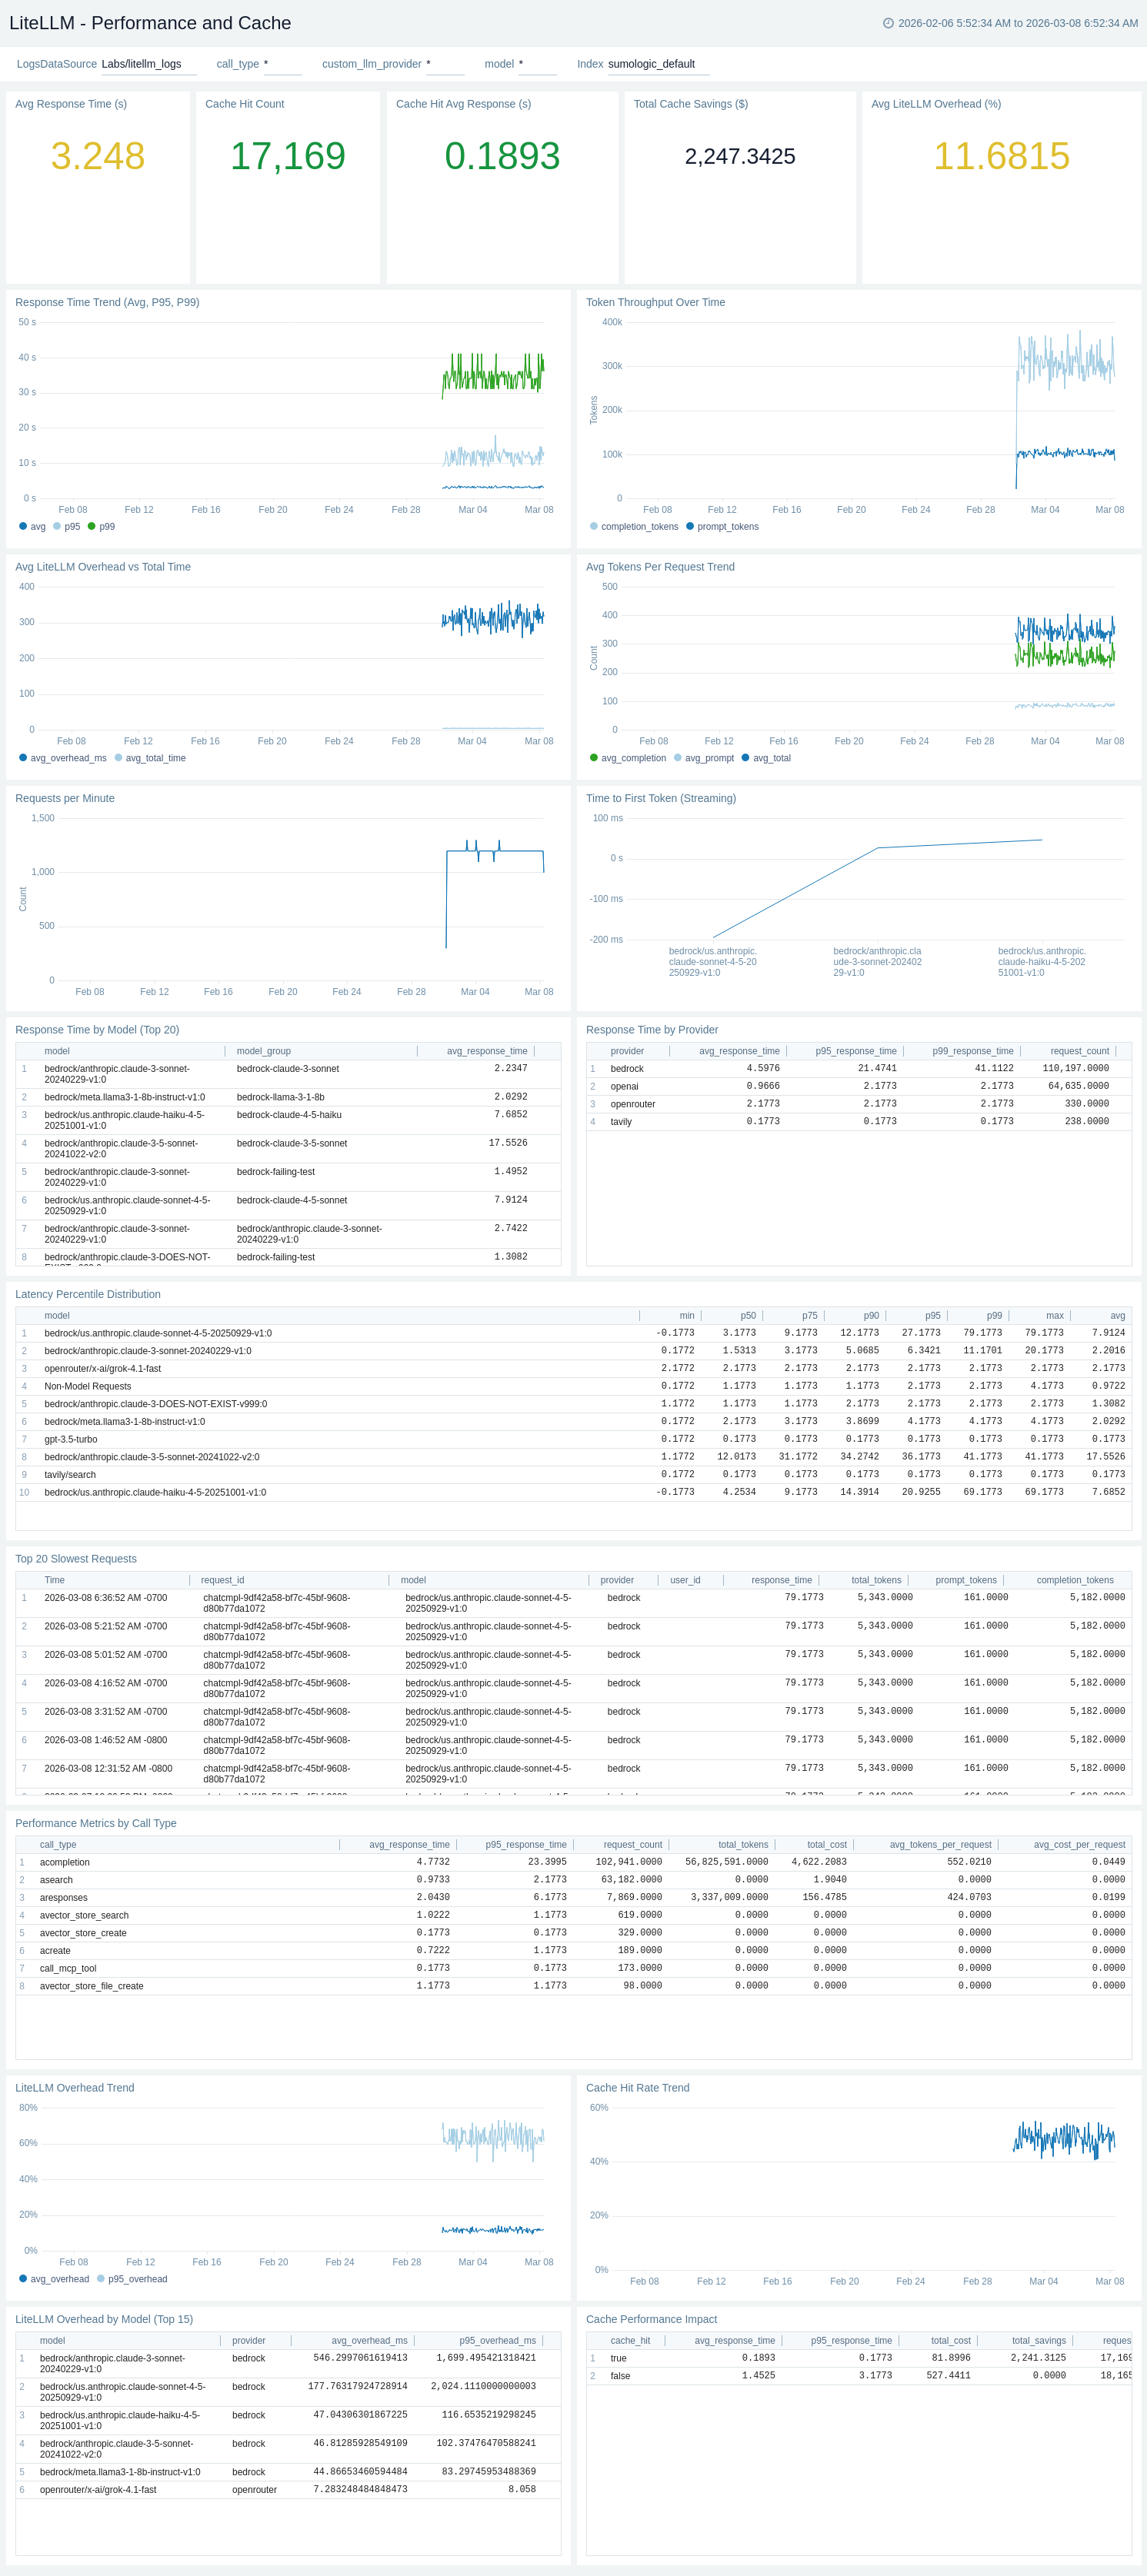
Performance and Cache
The LiteLLM - Performance and Cache dashboard provides comprehensive performance monitoring for LiteLLM including response times, token throughput, streaming performance, LiteLLM overhead tracking, cache analytics, vector store latency, and MCP tool performance for SRE and platform engineers.
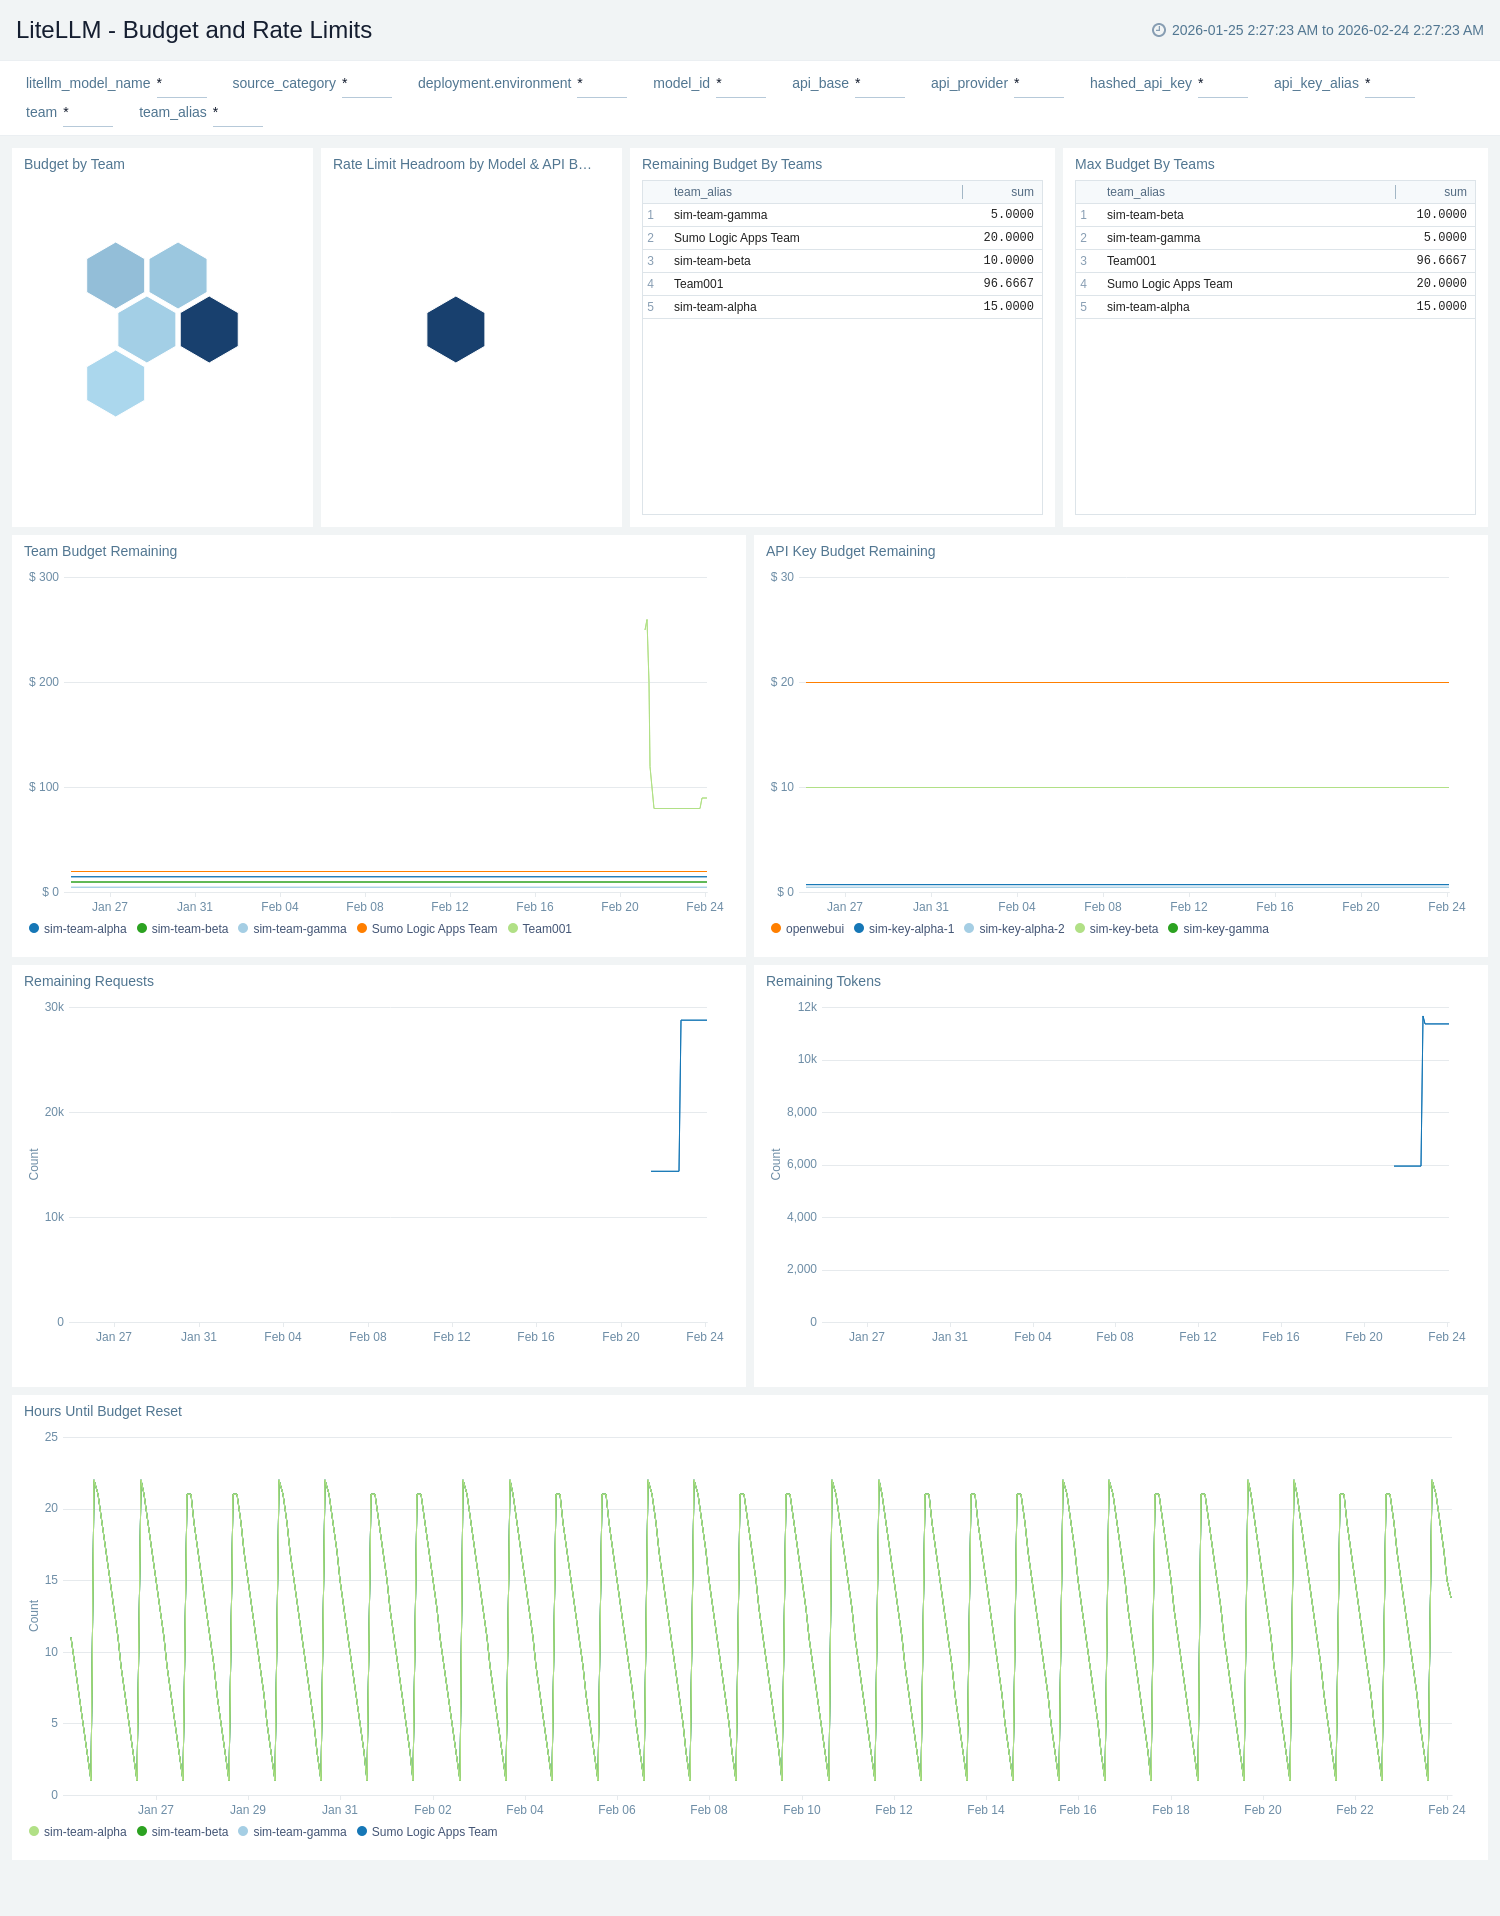
Budget and Rate Limits
The LiteLLM - Budget and Rate Limits dashboard provides comprehensive monitoring of budget utilization and rate limiting controls for LiteLLM including budget spent, remaining budget across teams, rate limit configurations, and token usage patterns.
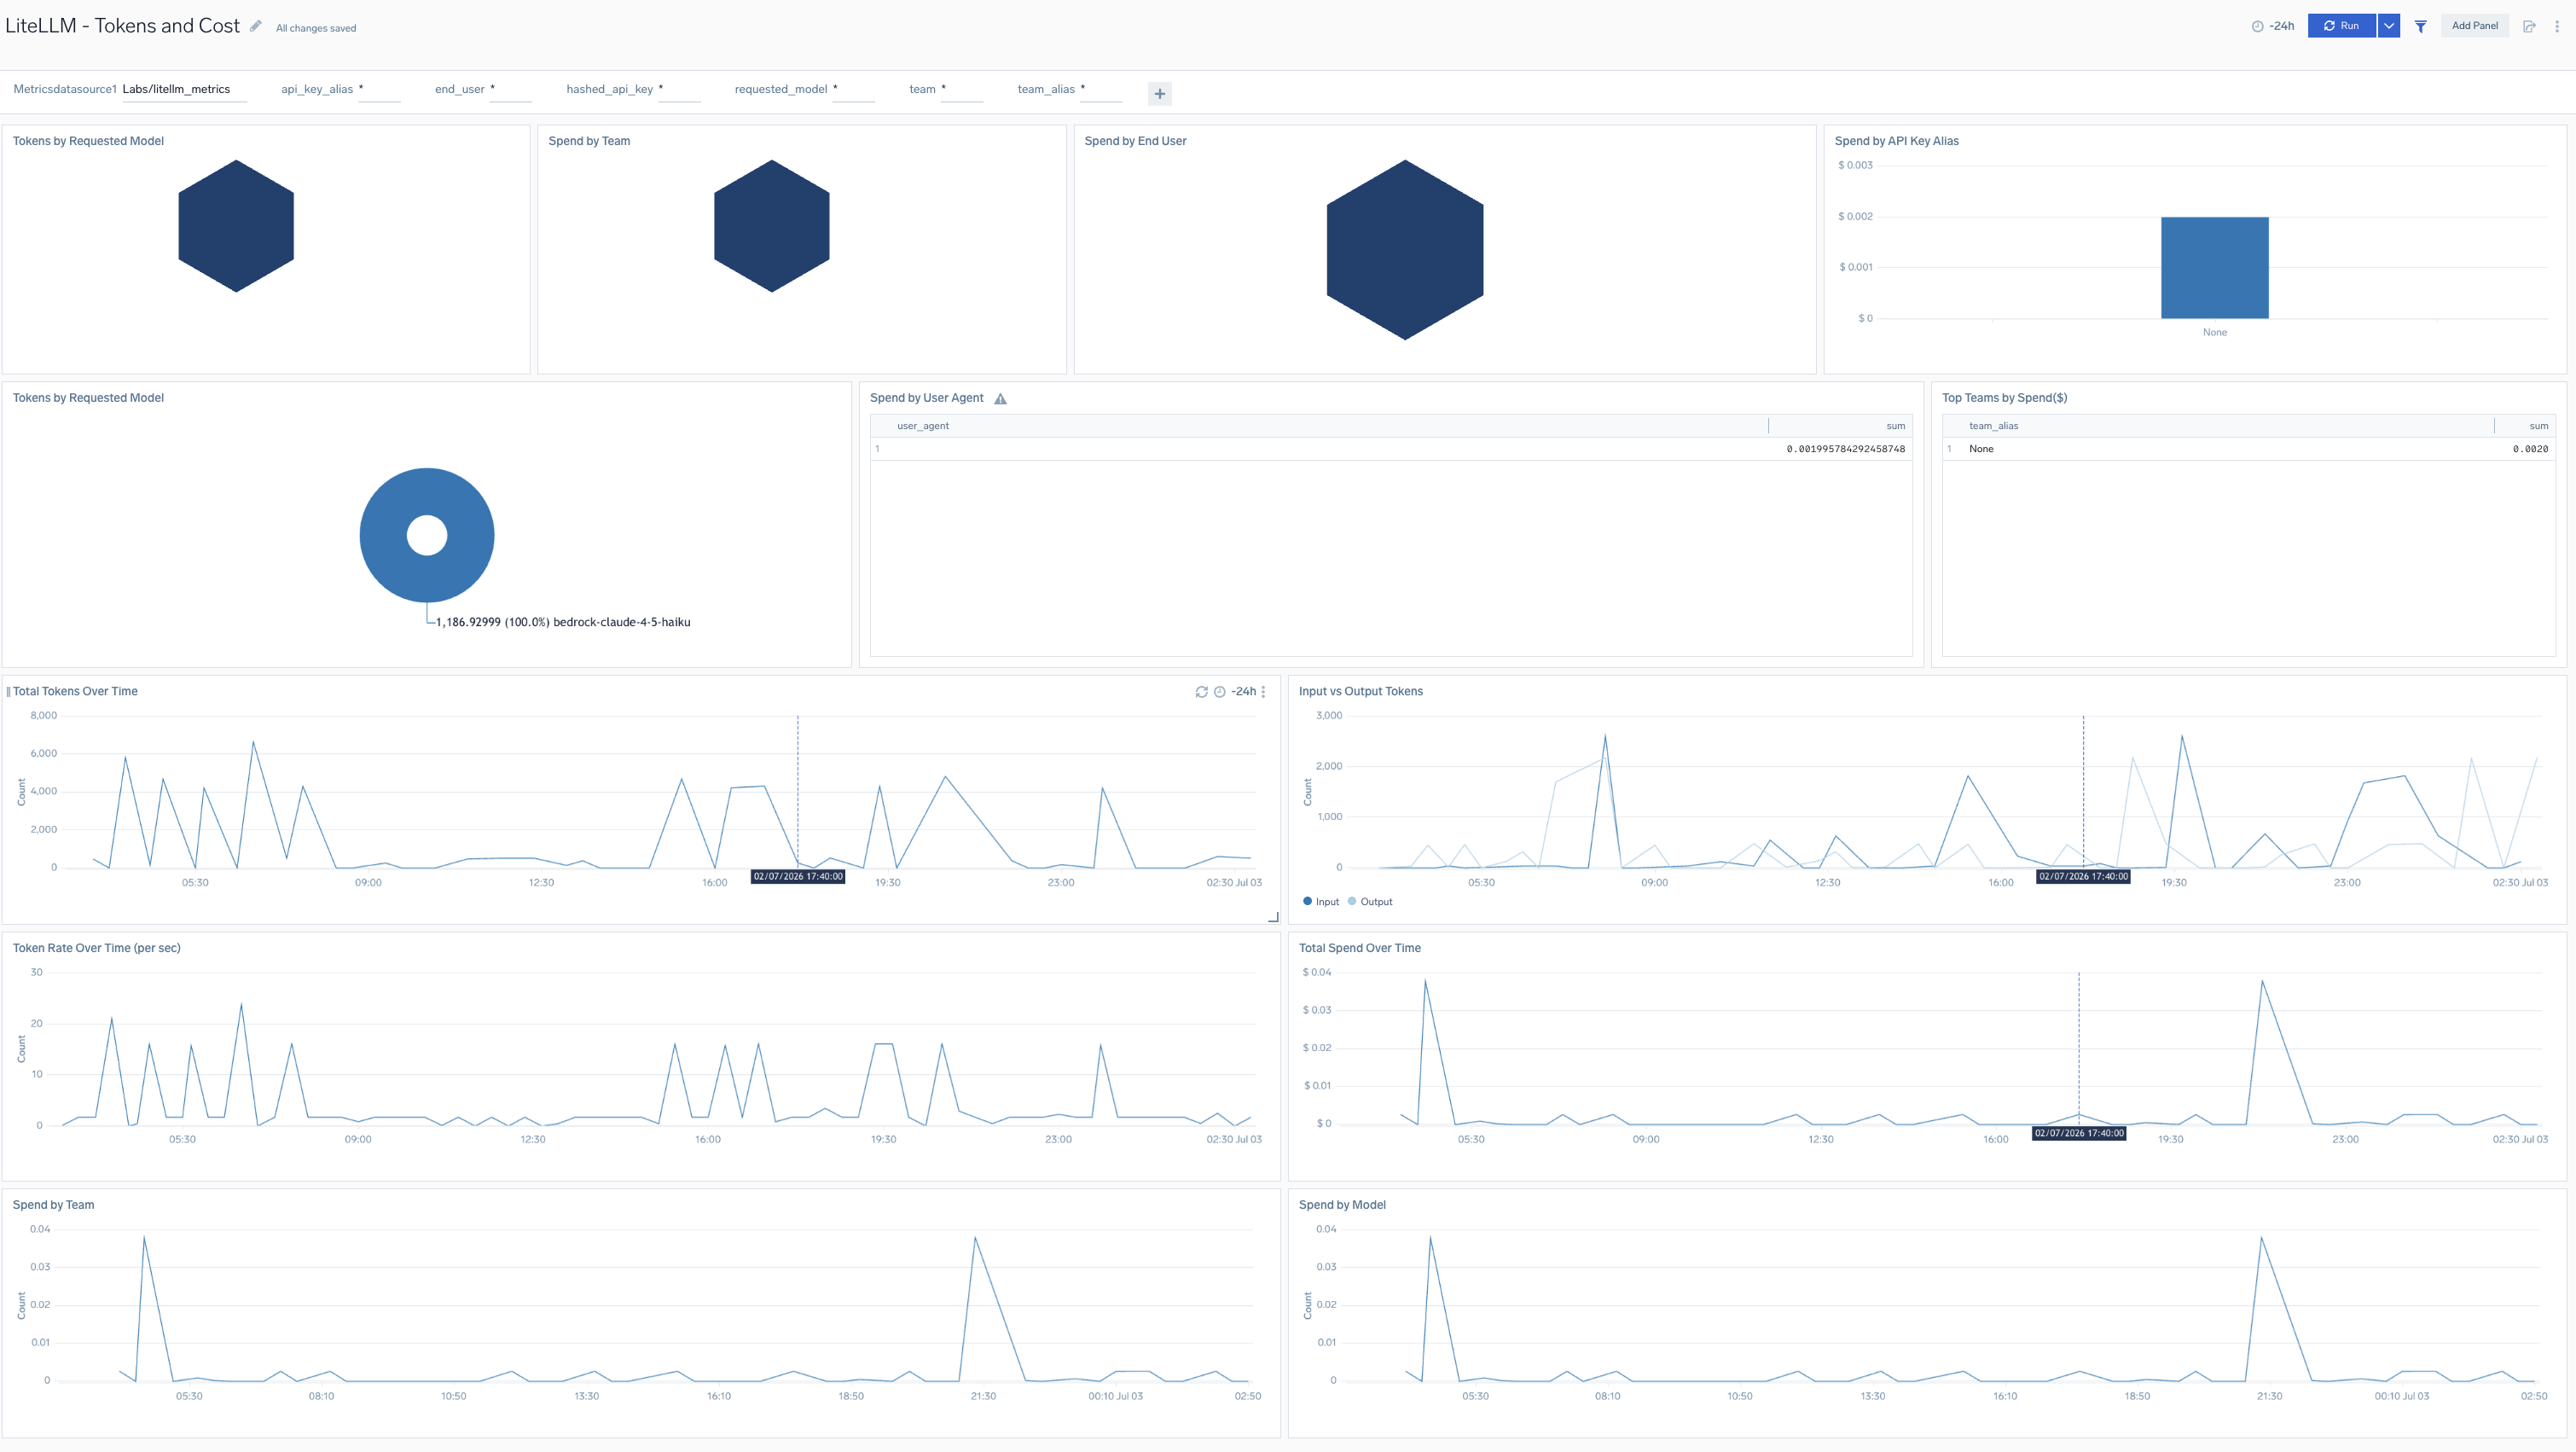
Tokens and Cost
The LiteLLM - Tokens and Cost dashboard provides detailed analysis of token consumption and associated costs for LiteLLM including total tokens consumed, cost per request, token distribution across prompt and completion tokens, and cost trends over time.
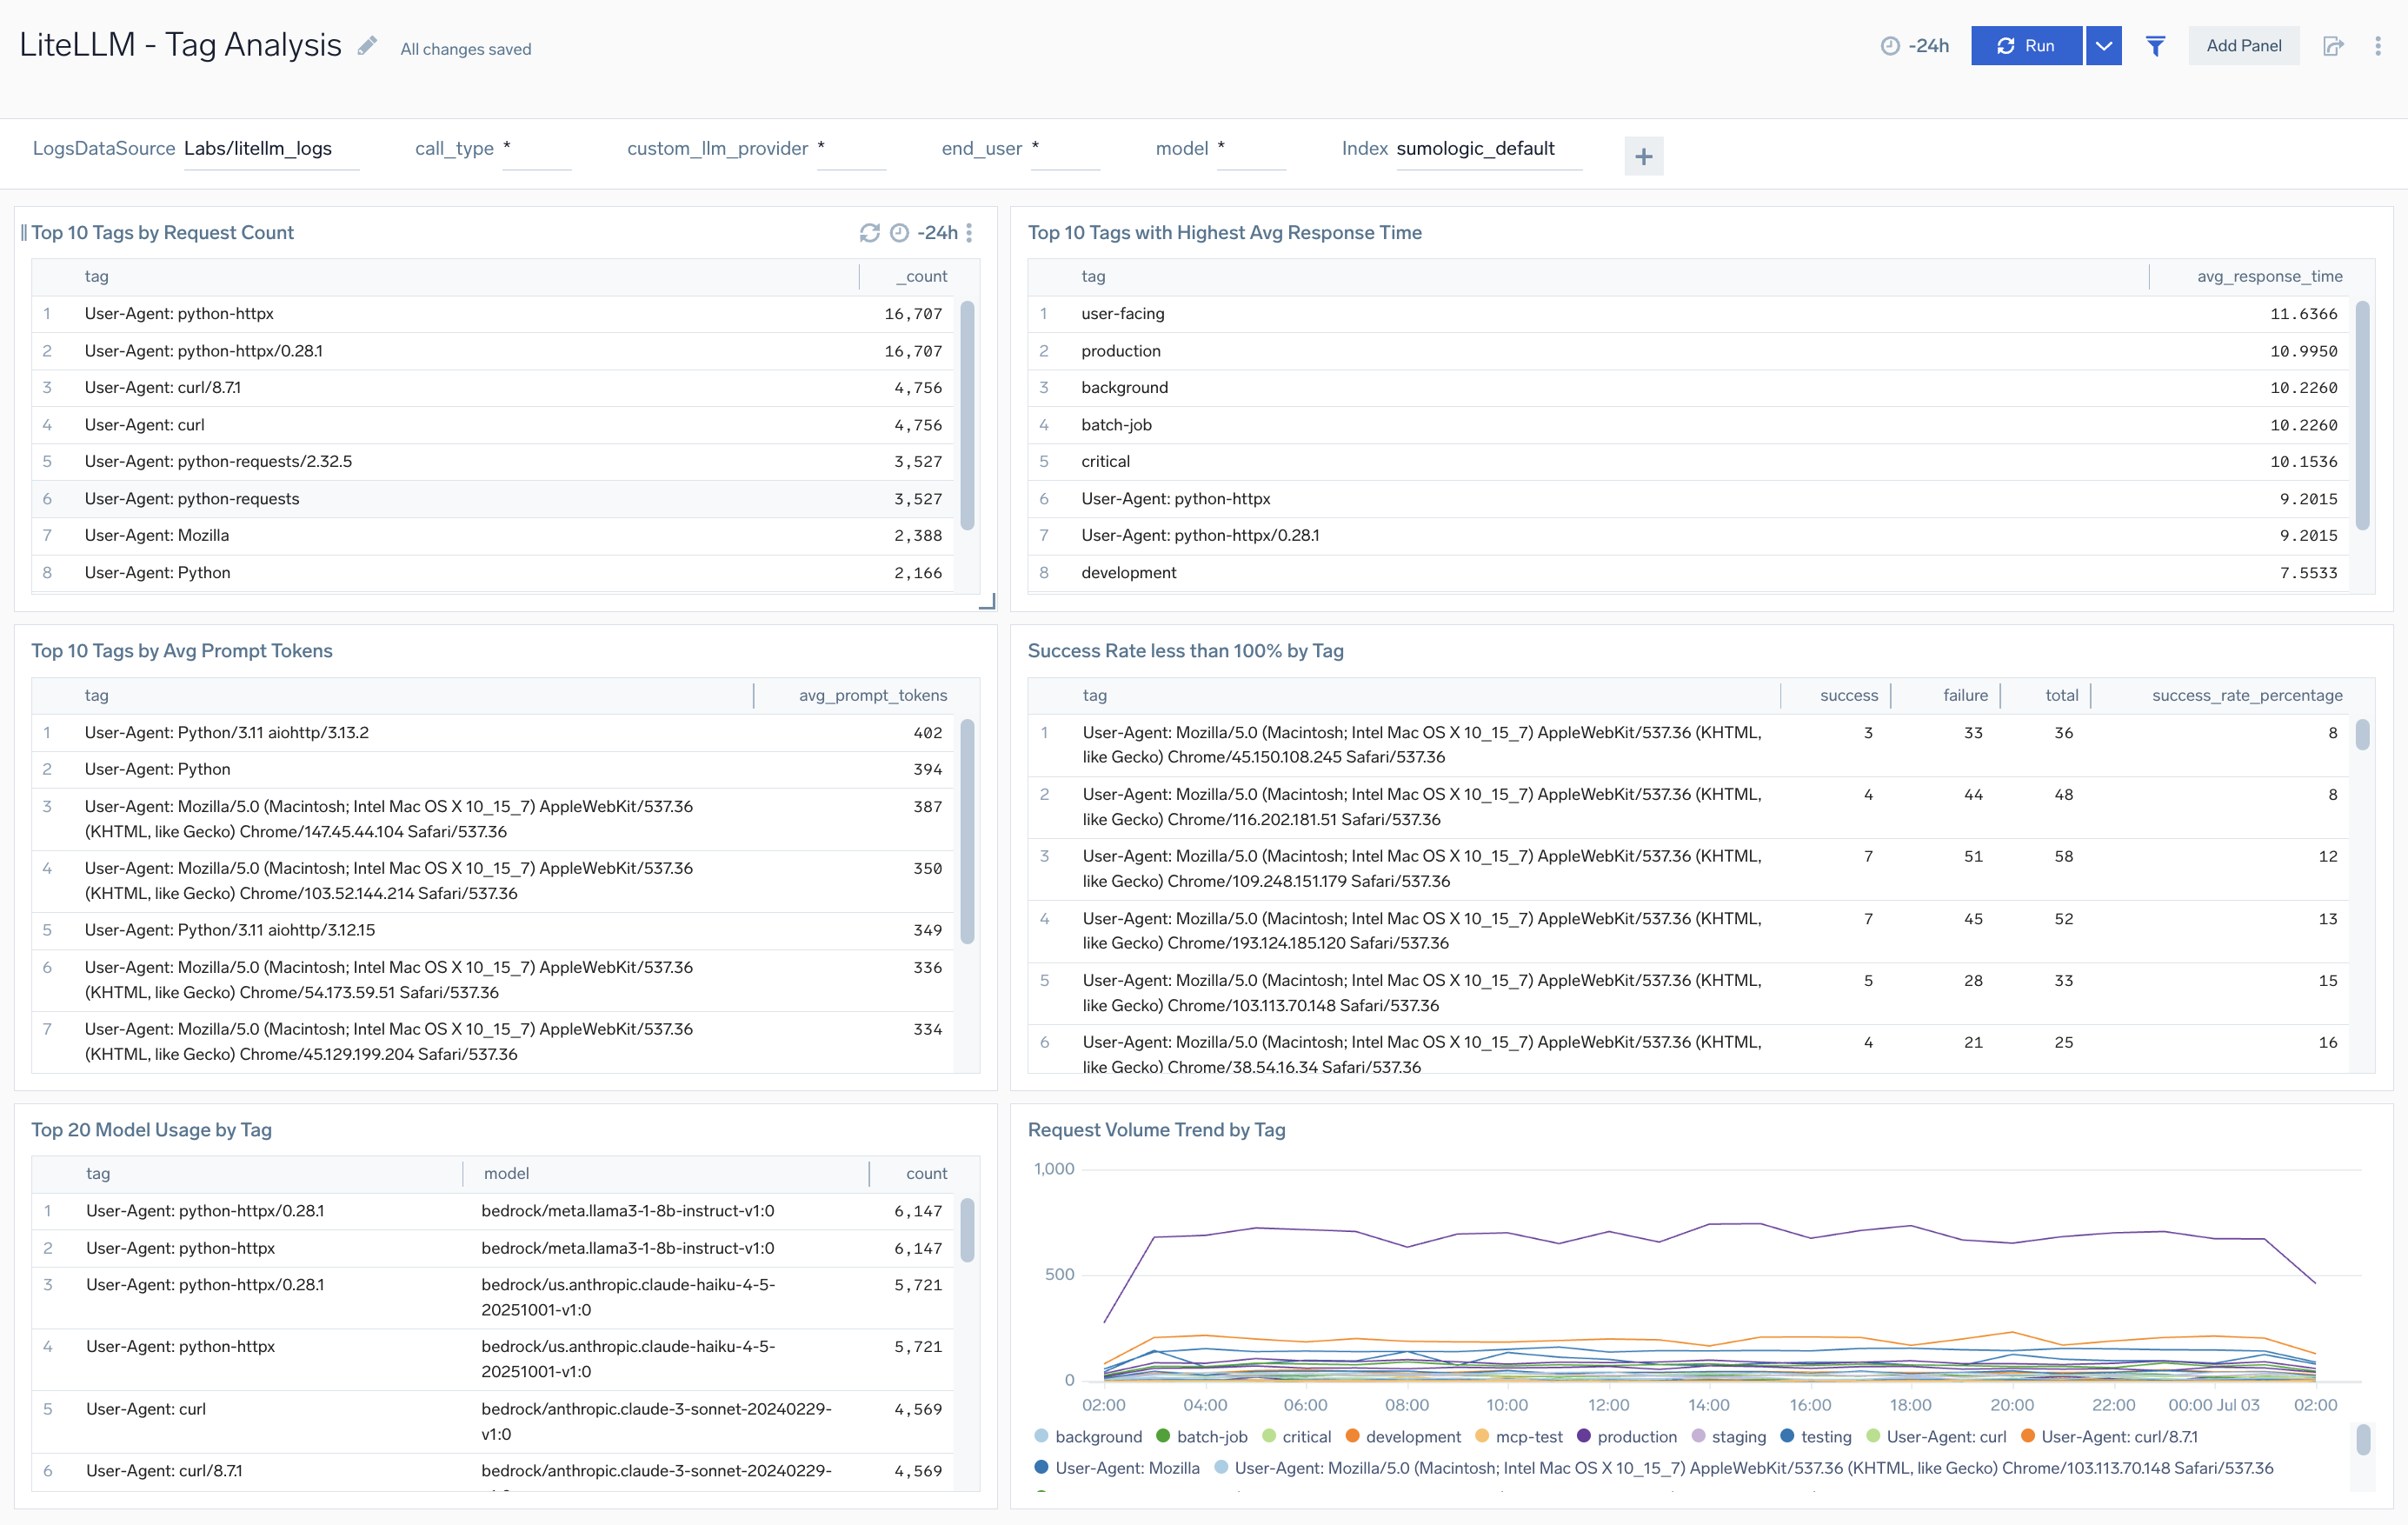
Tag Analysis
The LiteLLM - Tag Analysis dashboard provides comprehensive cost tracking for LiteLLM including LLM costs, MCP tool costs, prompt version comparison, tag-based attribution, batch operations, end-user costs, budget monitoring, and cache savings analysis.
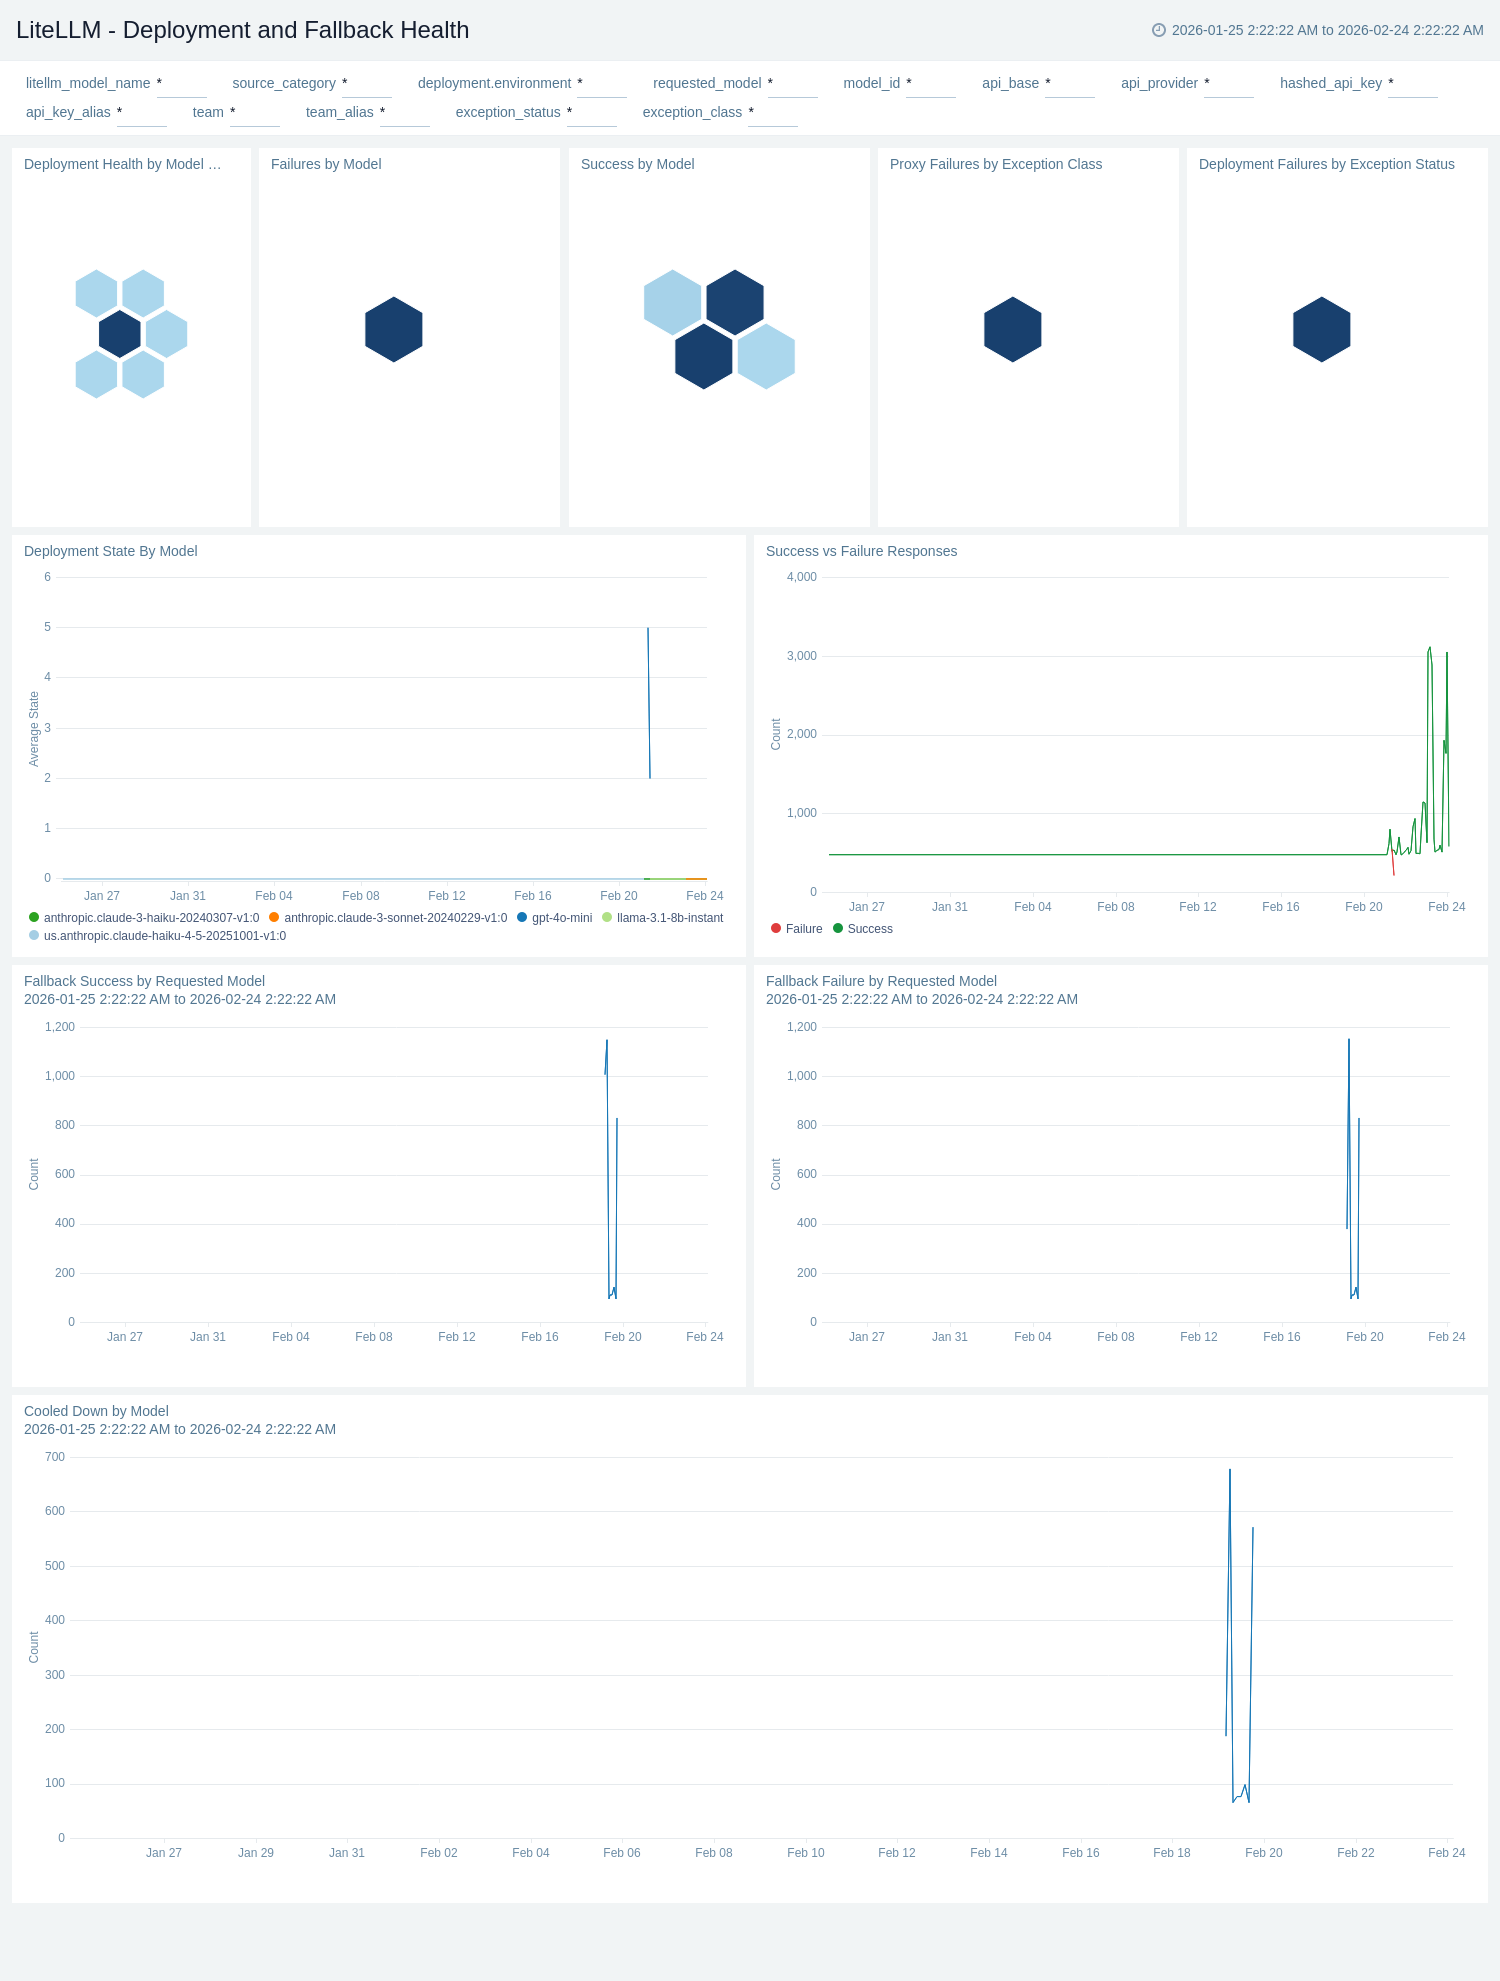
Deployment and Fallback Health
The LiteLLM - Deployment and Fallback Health dashboard provides visibility into model deployment health and fallback mechanism performance for LiteLLM including deployment success rates, fallback trigger frequency, health check statuses, and deployment availability metrics.
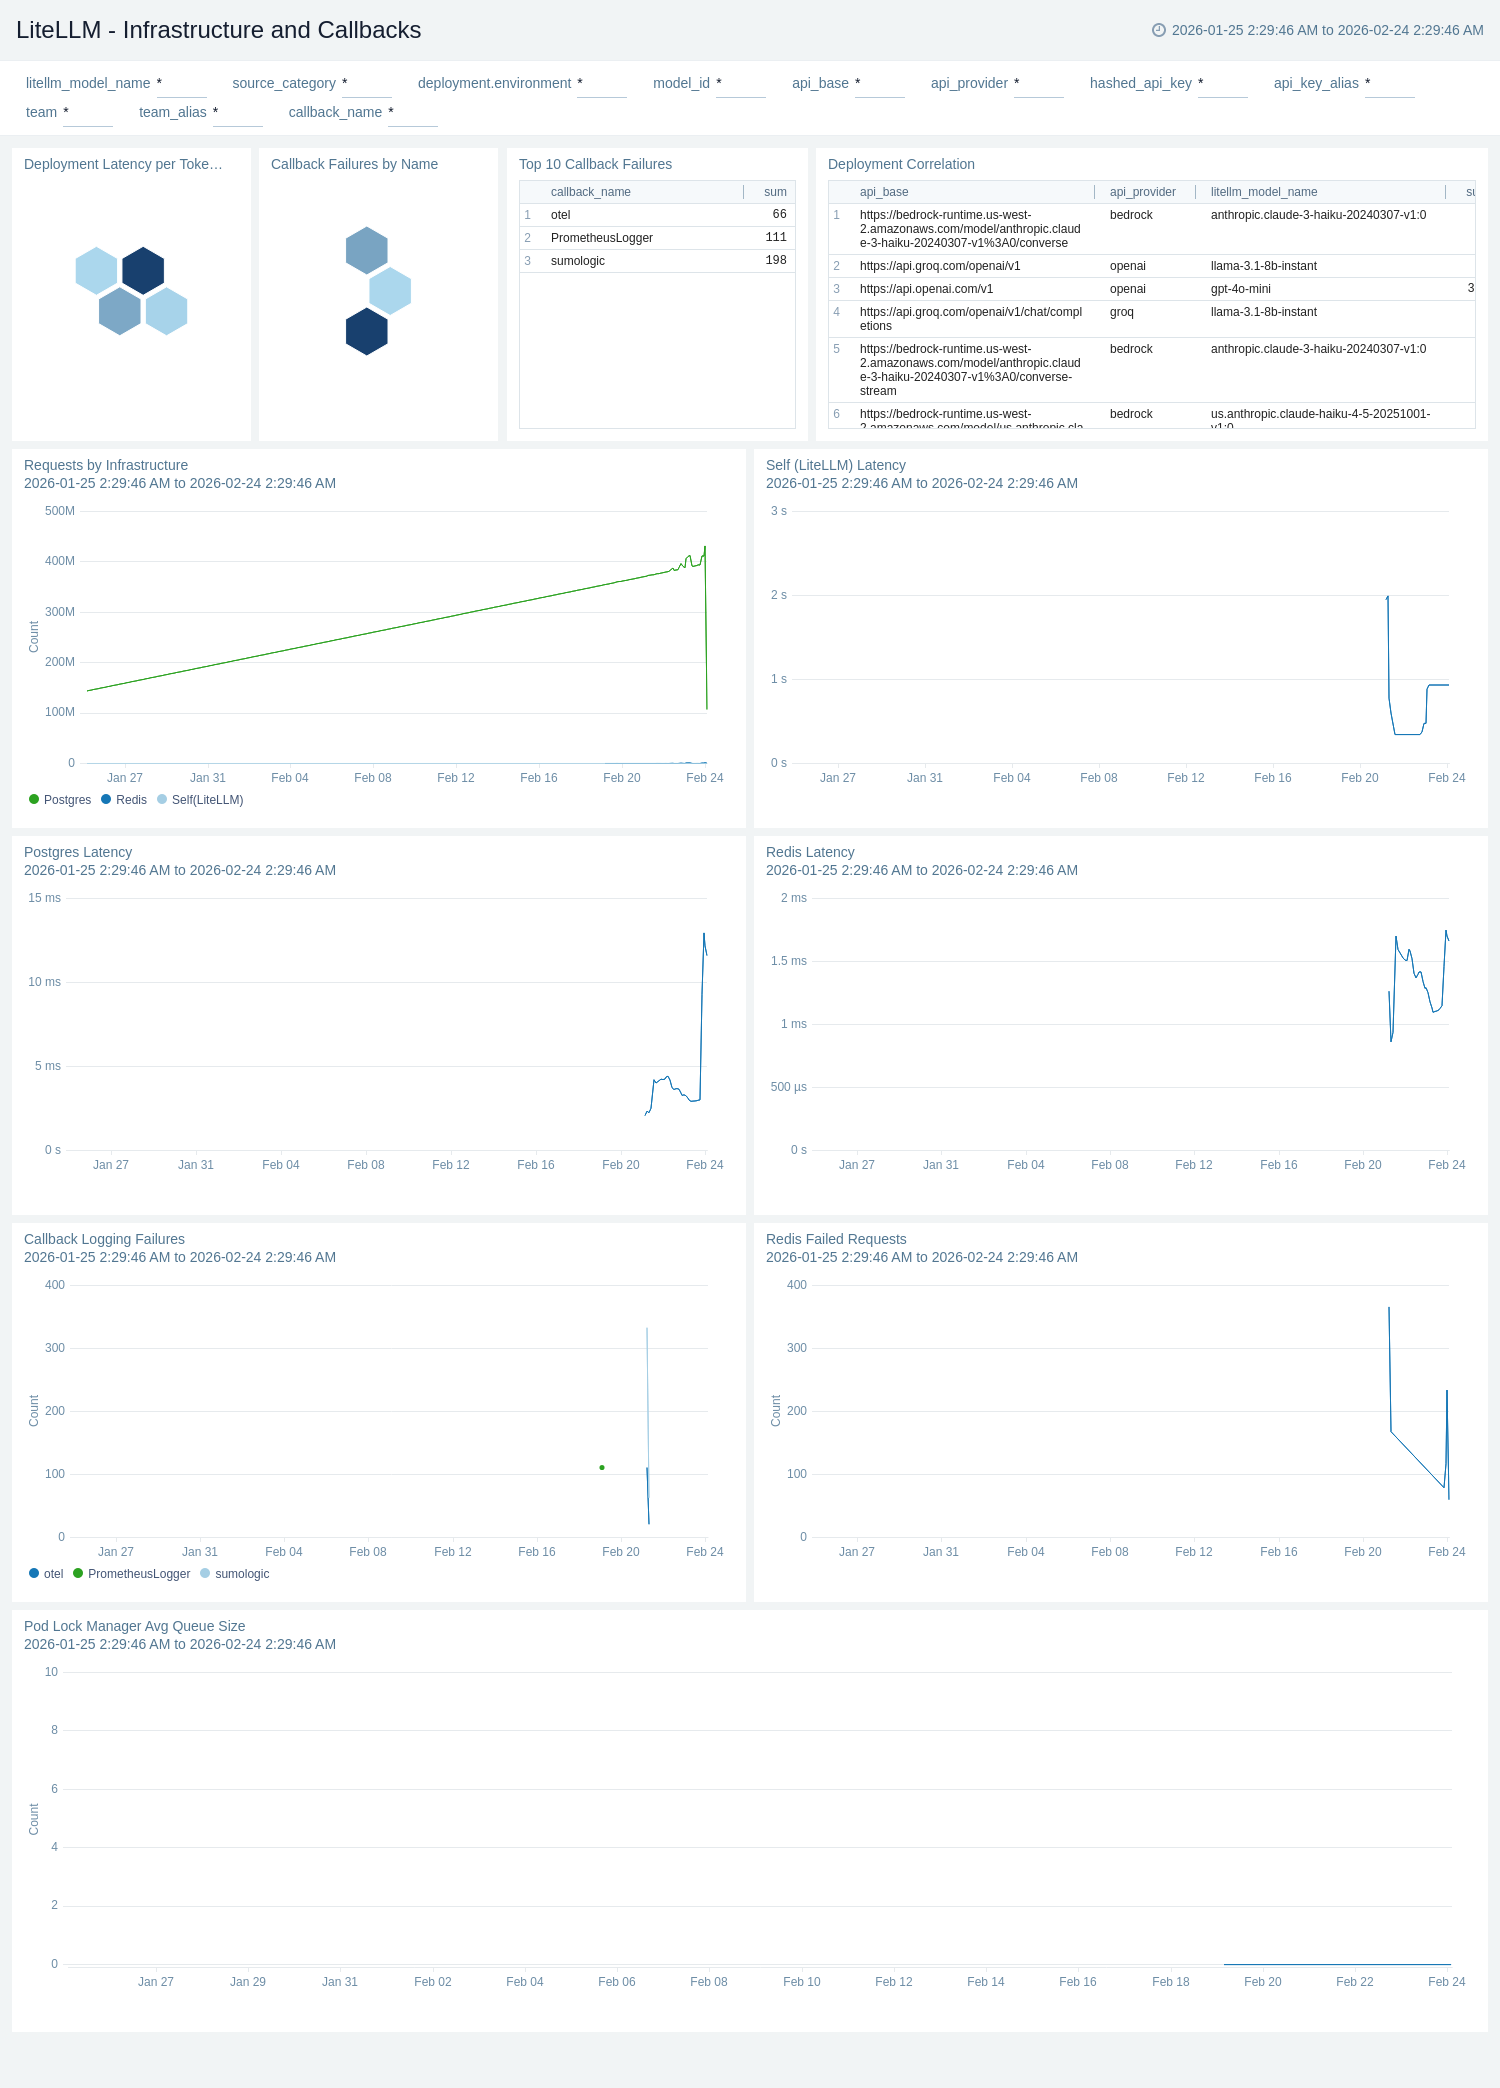
Infrastructure and Callbacks
The LiteLLM - Infrastructure and Callbacks dashboard provides detailed insights into infrastructure performance and callback system operations for LiteLLM including database connection pool health, callback success rates, queue depths, and system resource consumption.
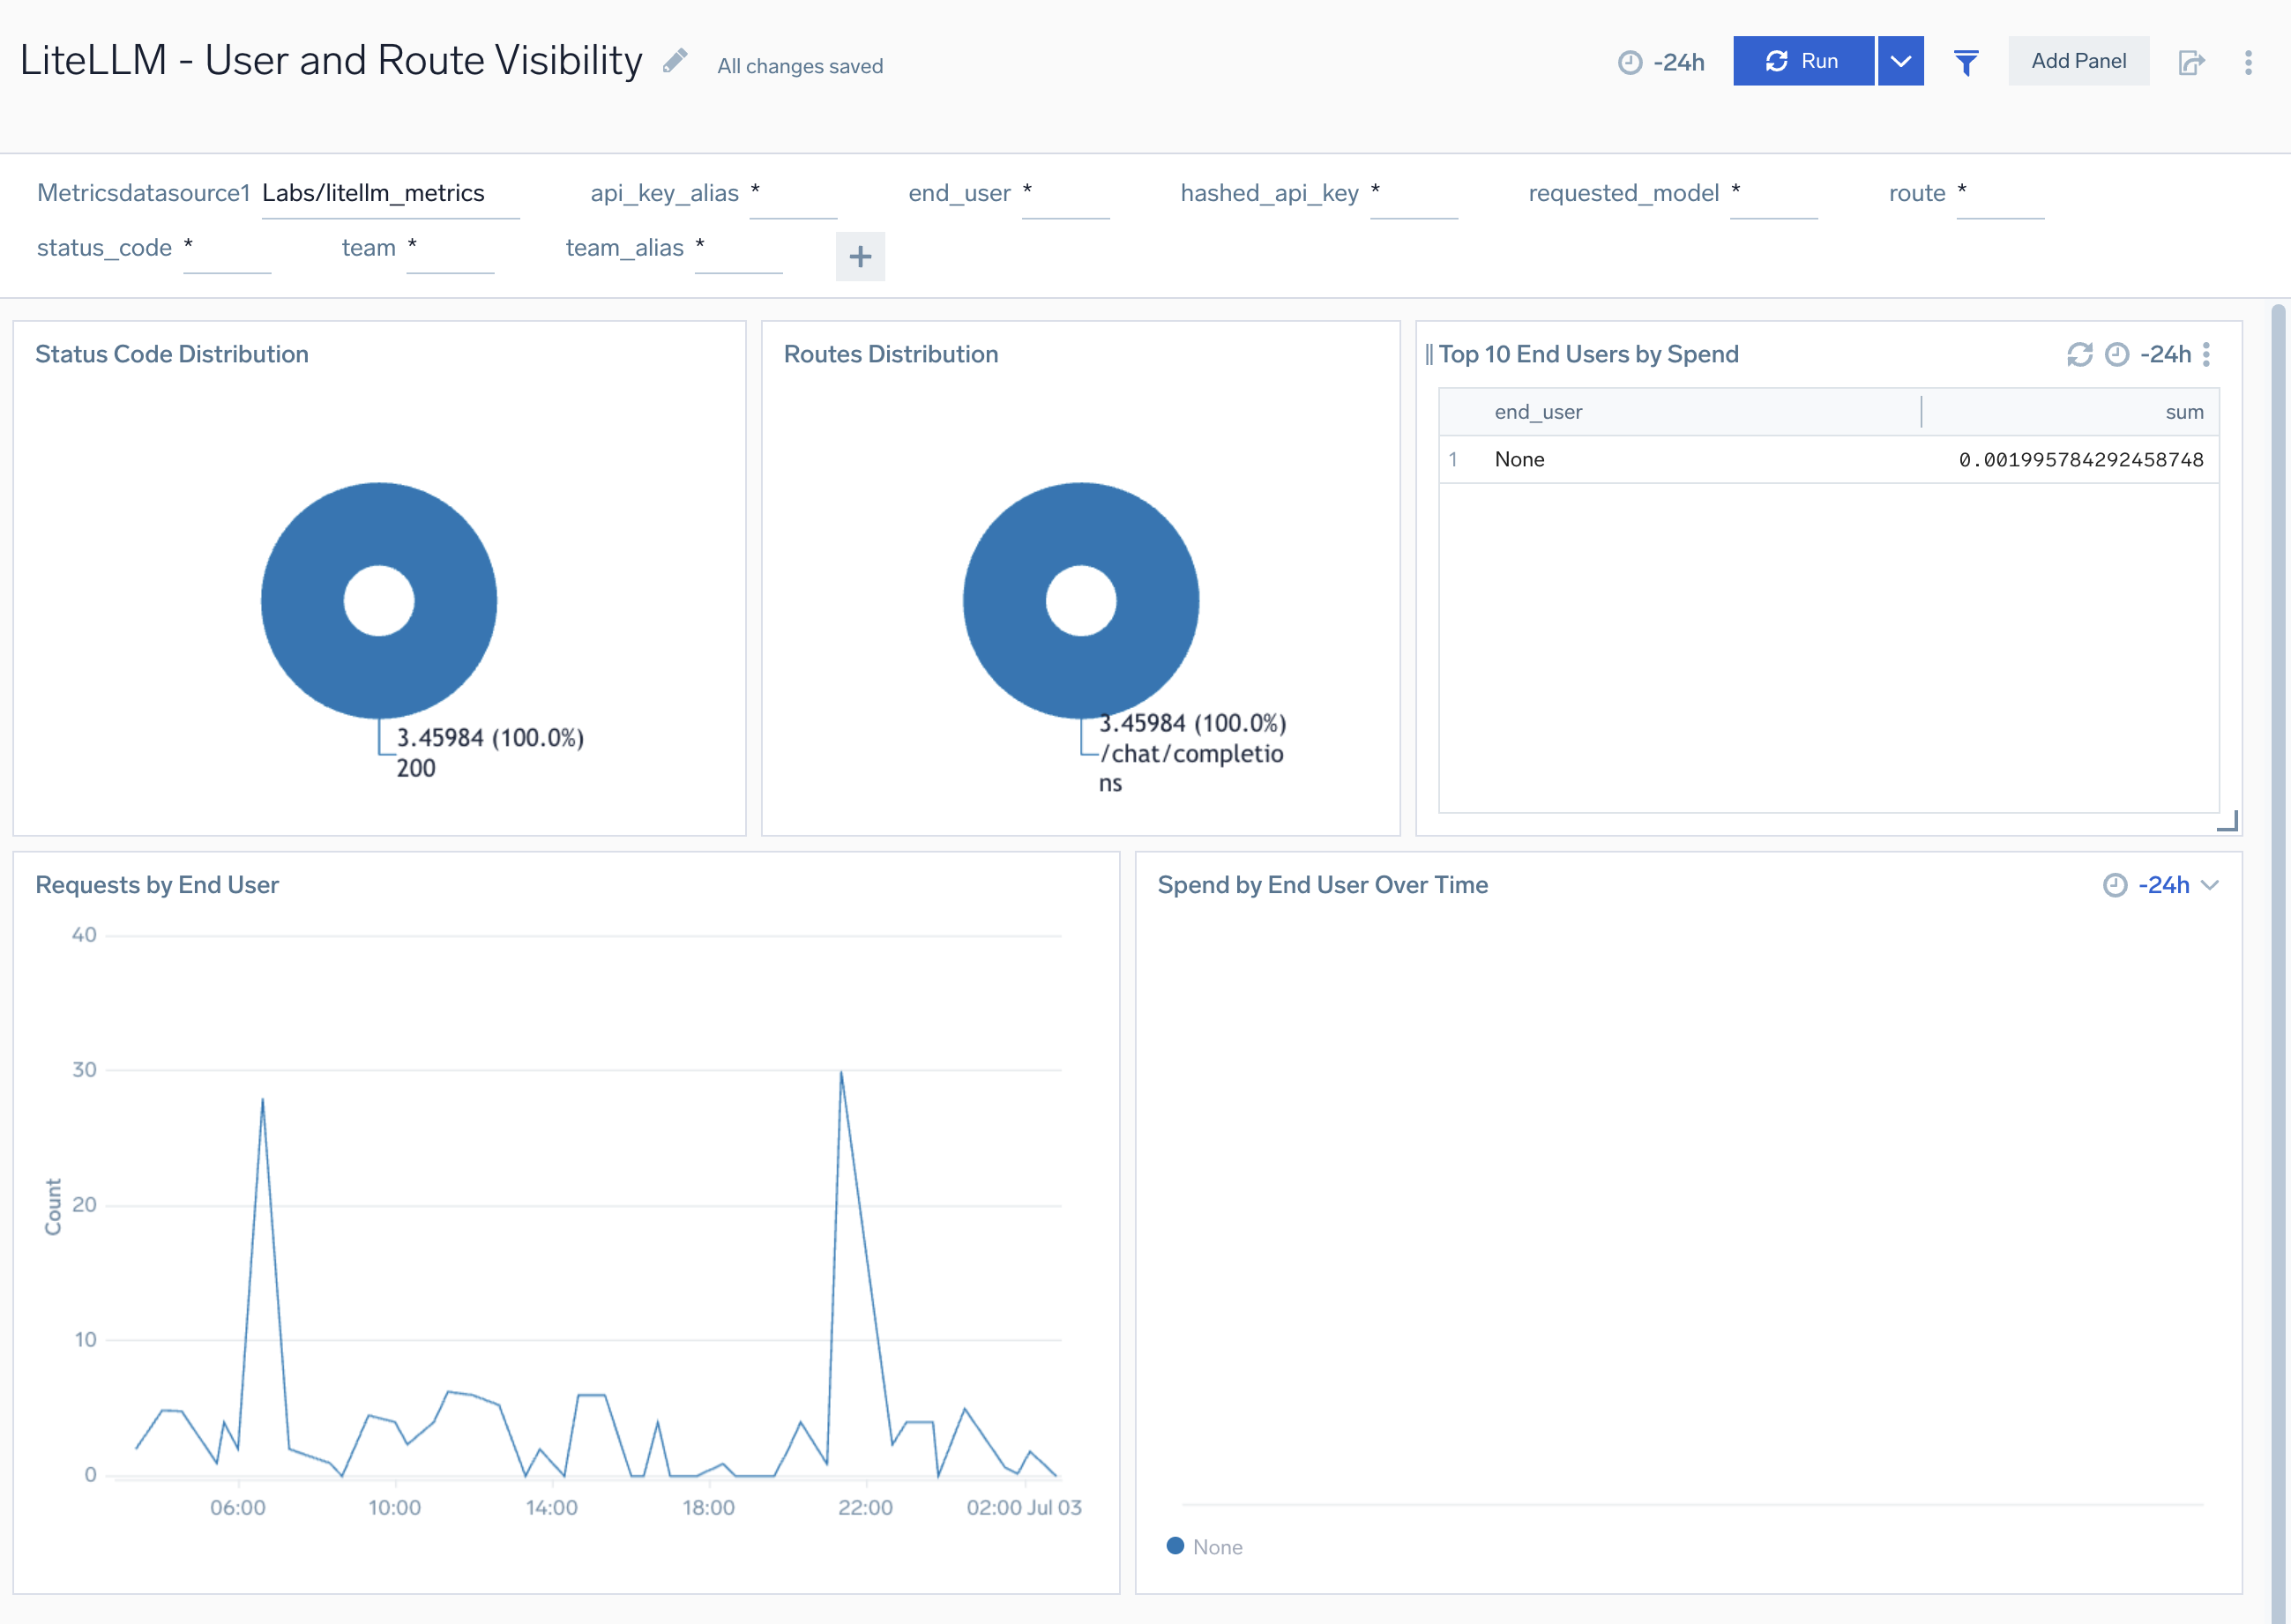
User and Route Visibility
The LiteLLM - User and Route Visibility dashboard provides comprehensive insights into user activity and API route usage patterns for LiteLLM including active users, user request volumes, route-specific request distribution, and user authentication patterns.
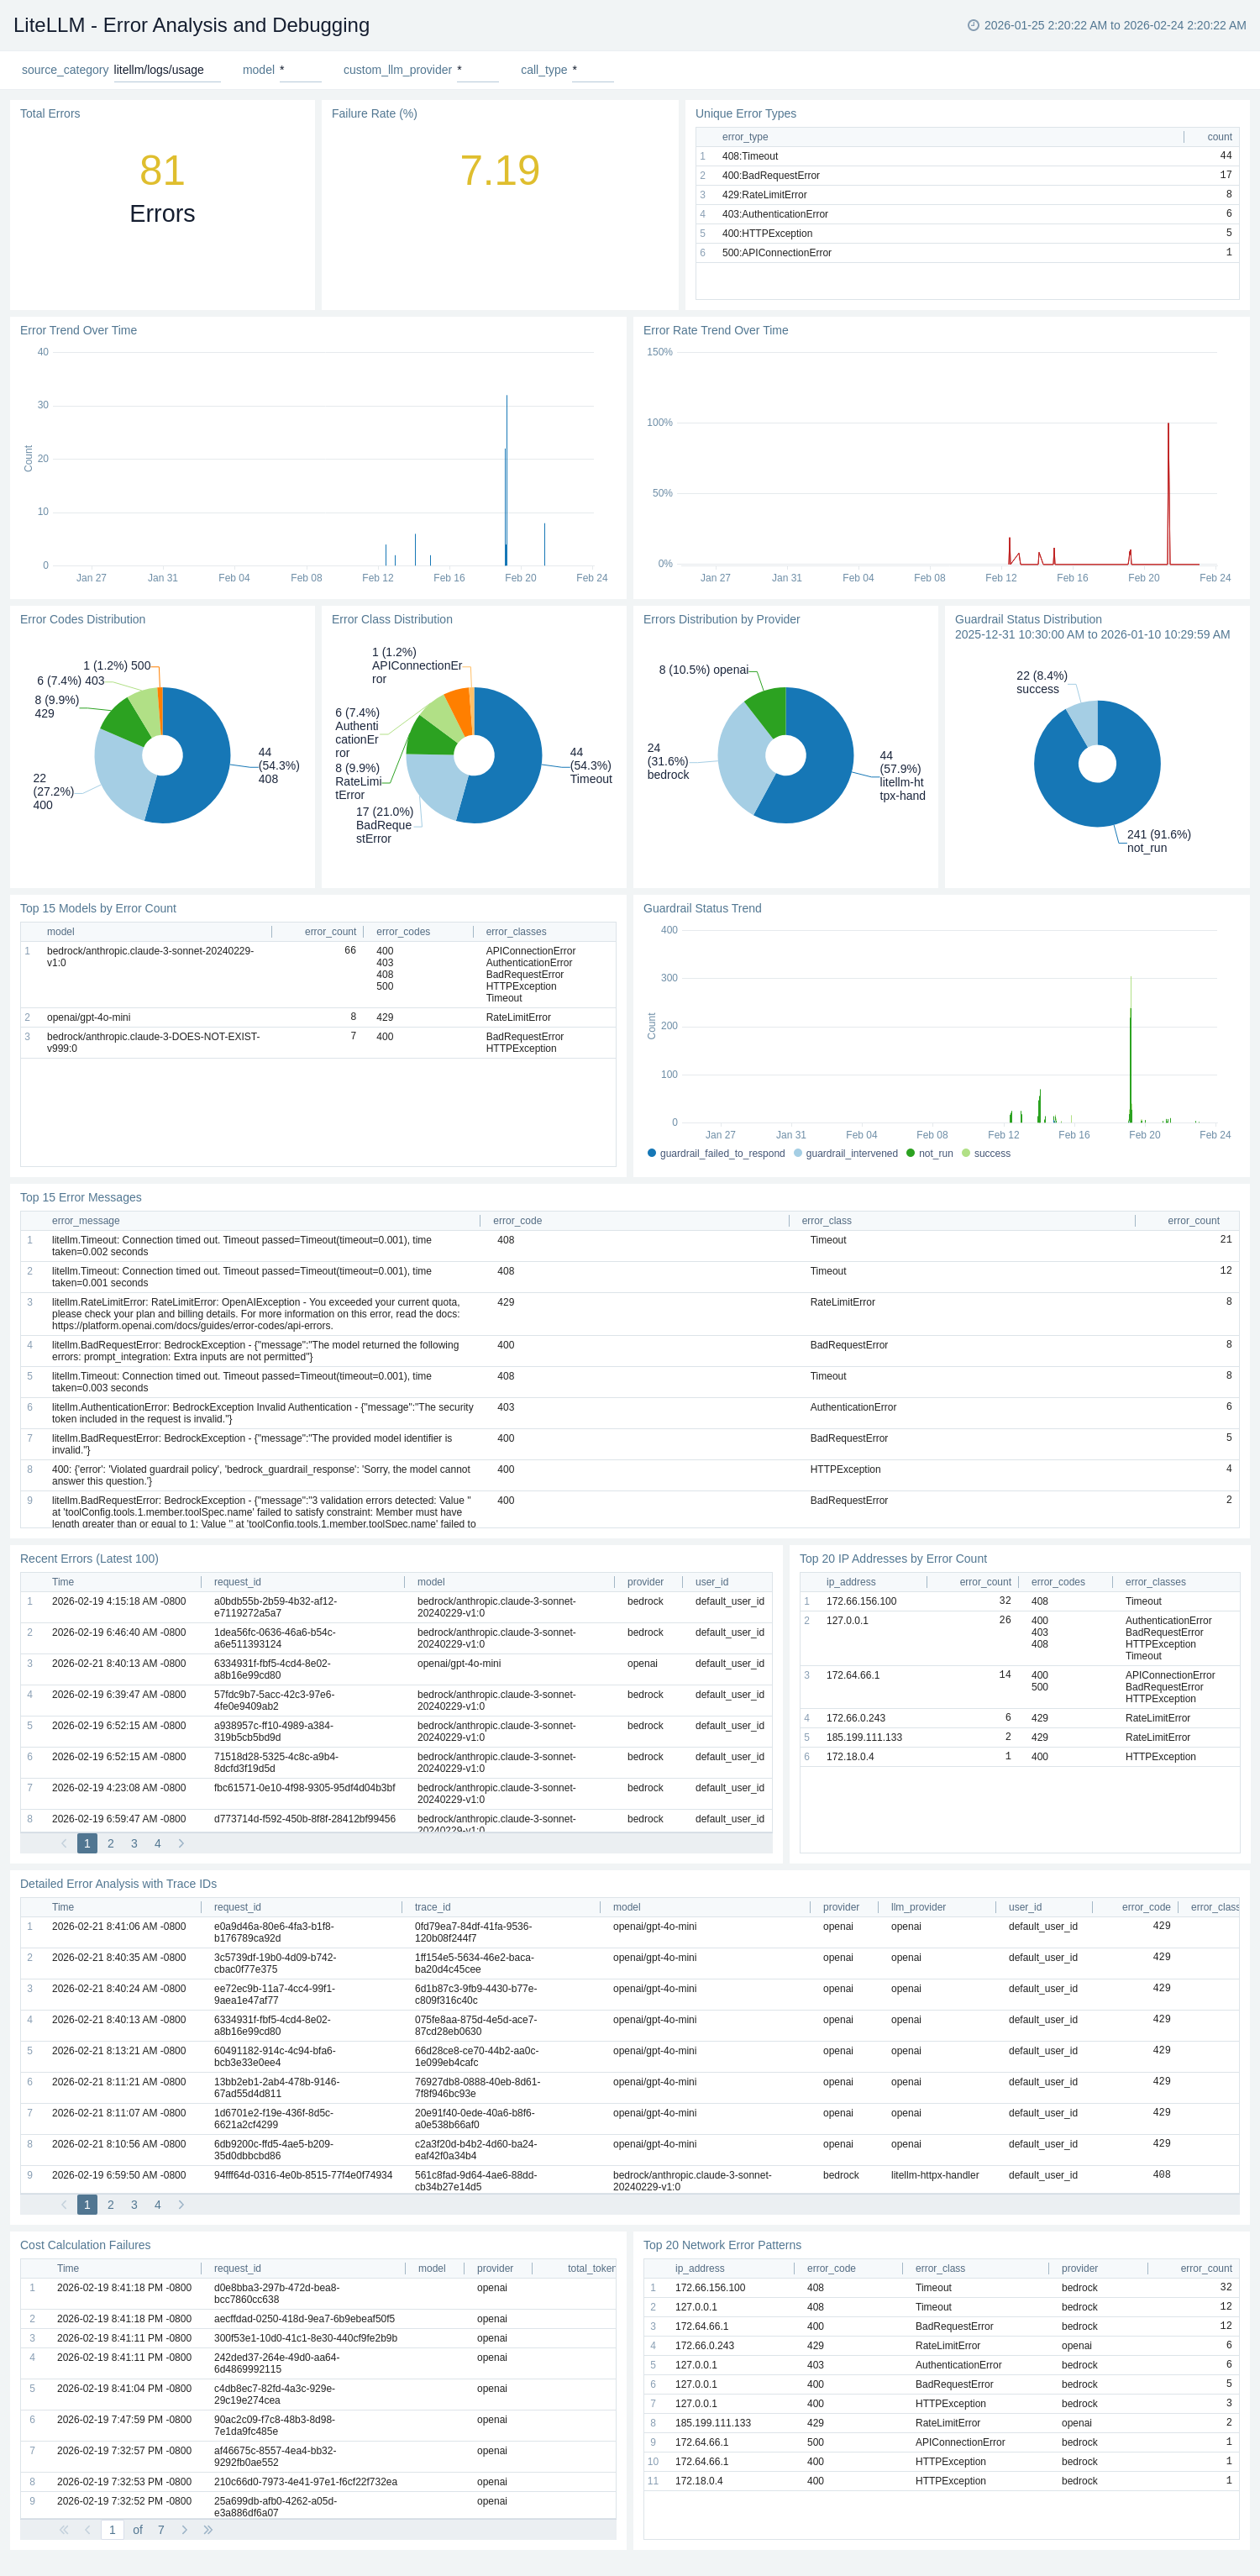
Error Analysis and Debugging
The LiteLLM - Error Analysis and Debugging dashboard provides comprehensive error tracking and debugging for LiteLLM including error rates, trace IDs for distributed tracing, cost failure debugging, end-user error patterns, IP-based network analysis, and detailed failure investigation.
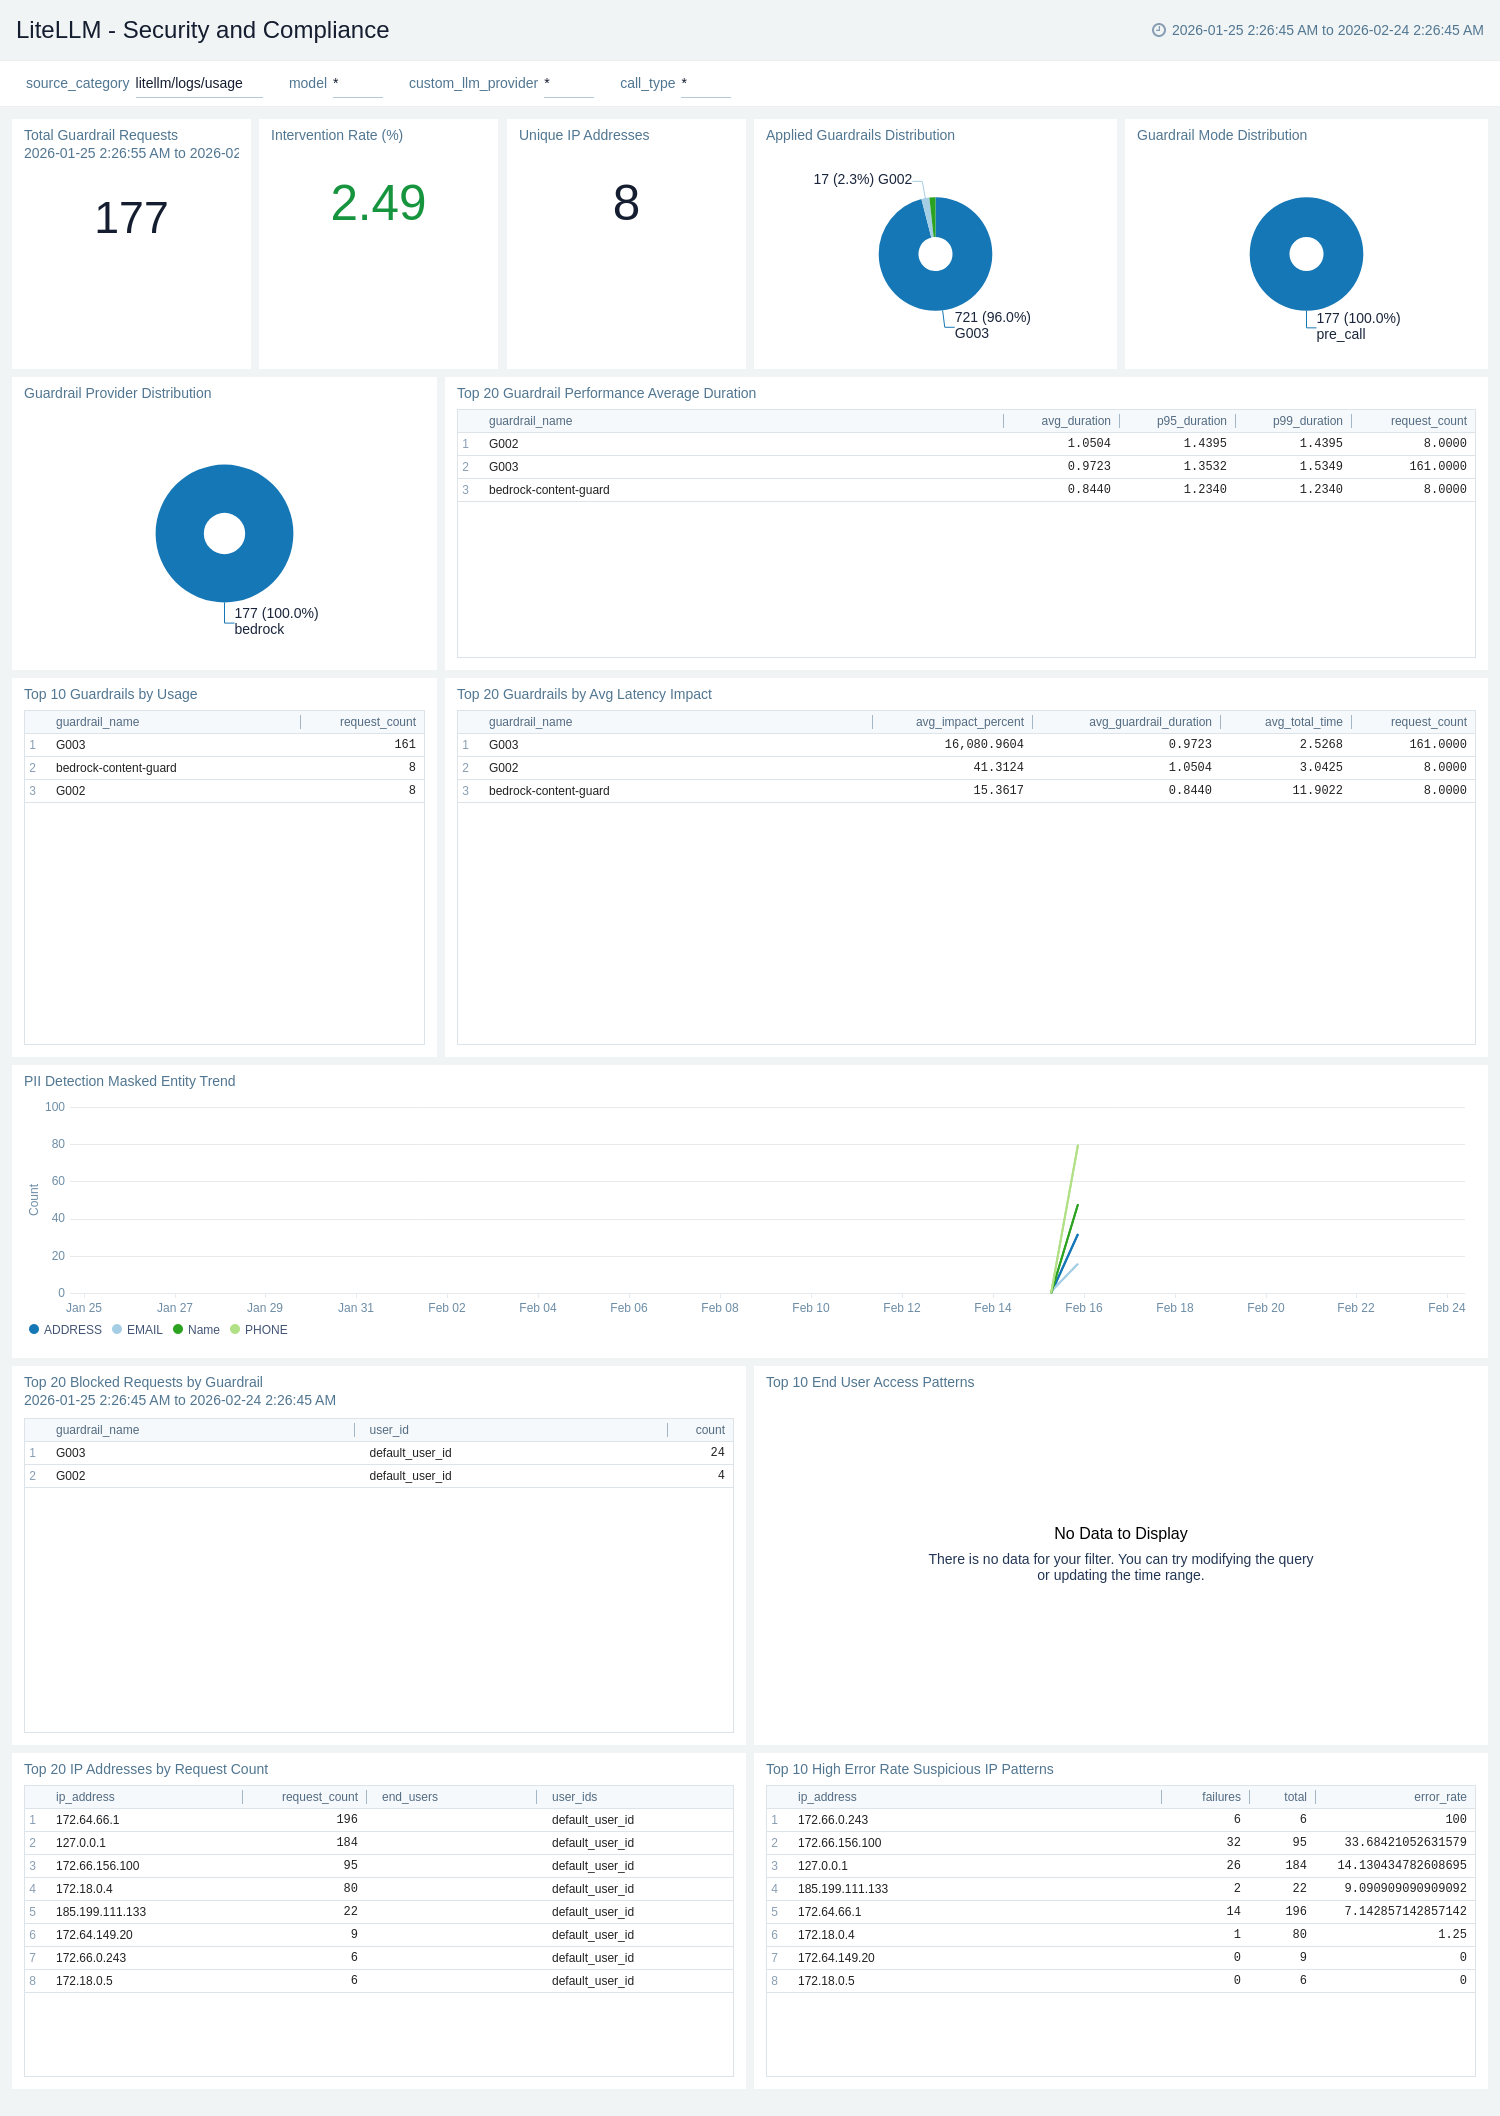
Security and Compliance
The LiteLLM - Security and Compliance dashboard provides comprehensive security monitoring for LiteLLM including detailed guardrail analytics, entity masking & PII detection, geographic access patterns, network security analysis, and compliance tracking for security teams and compliance officers.
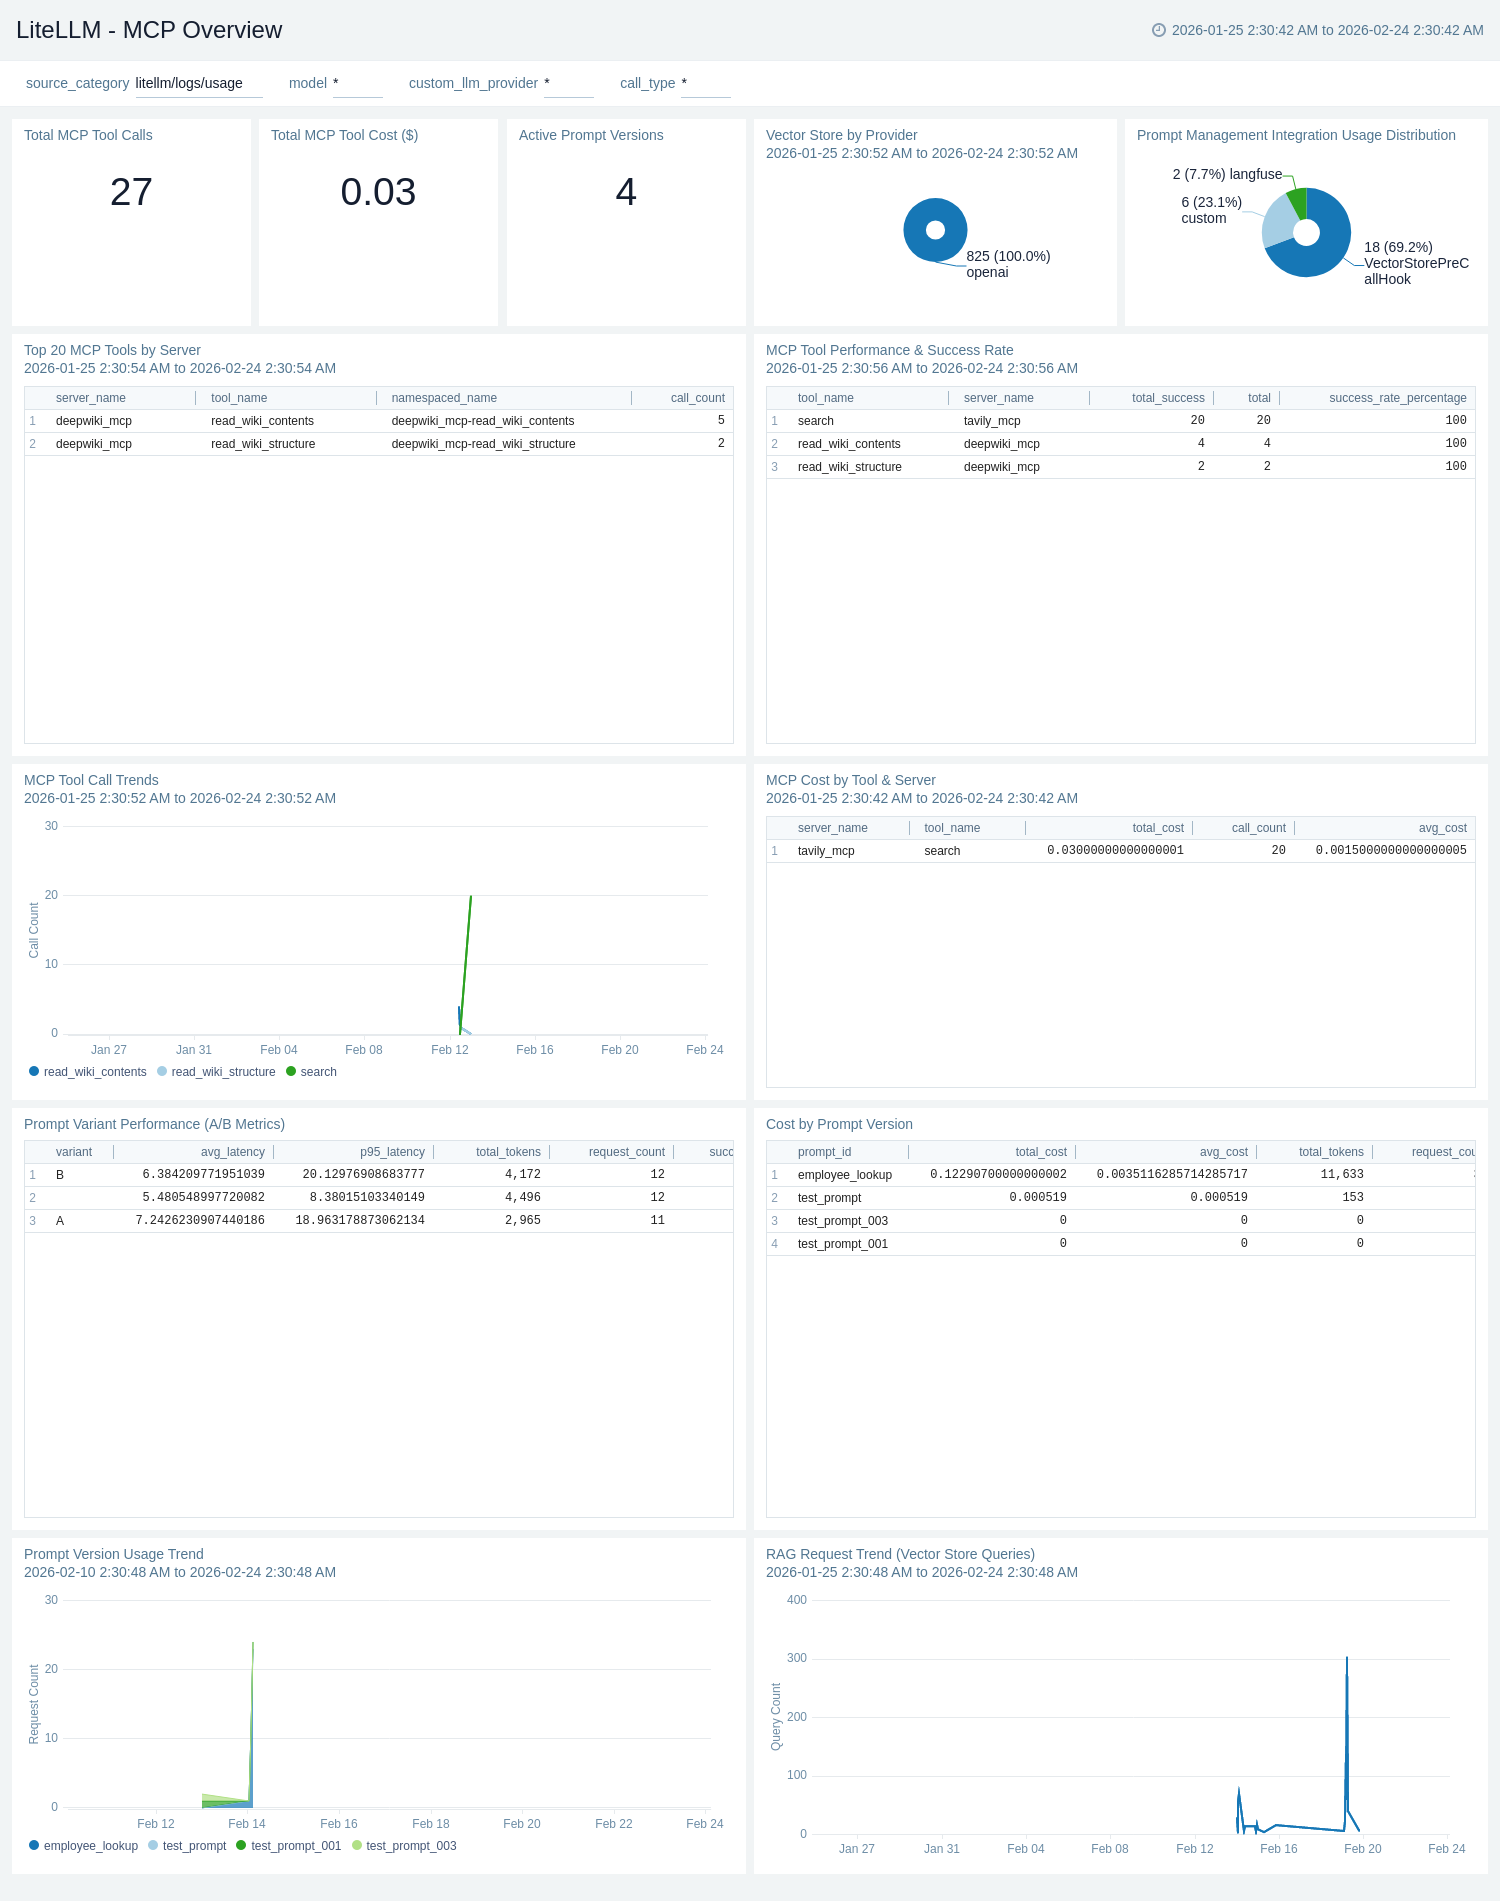
MCP Overview
The LiteLLM - MCP Overview dashboard provides comprehensive monitoring for LiteLLM advanced features including MCP tool call analytics, prompt management & A/B testing, vector store & RAG performance, and request tags classification for ML engineers and feature developers.
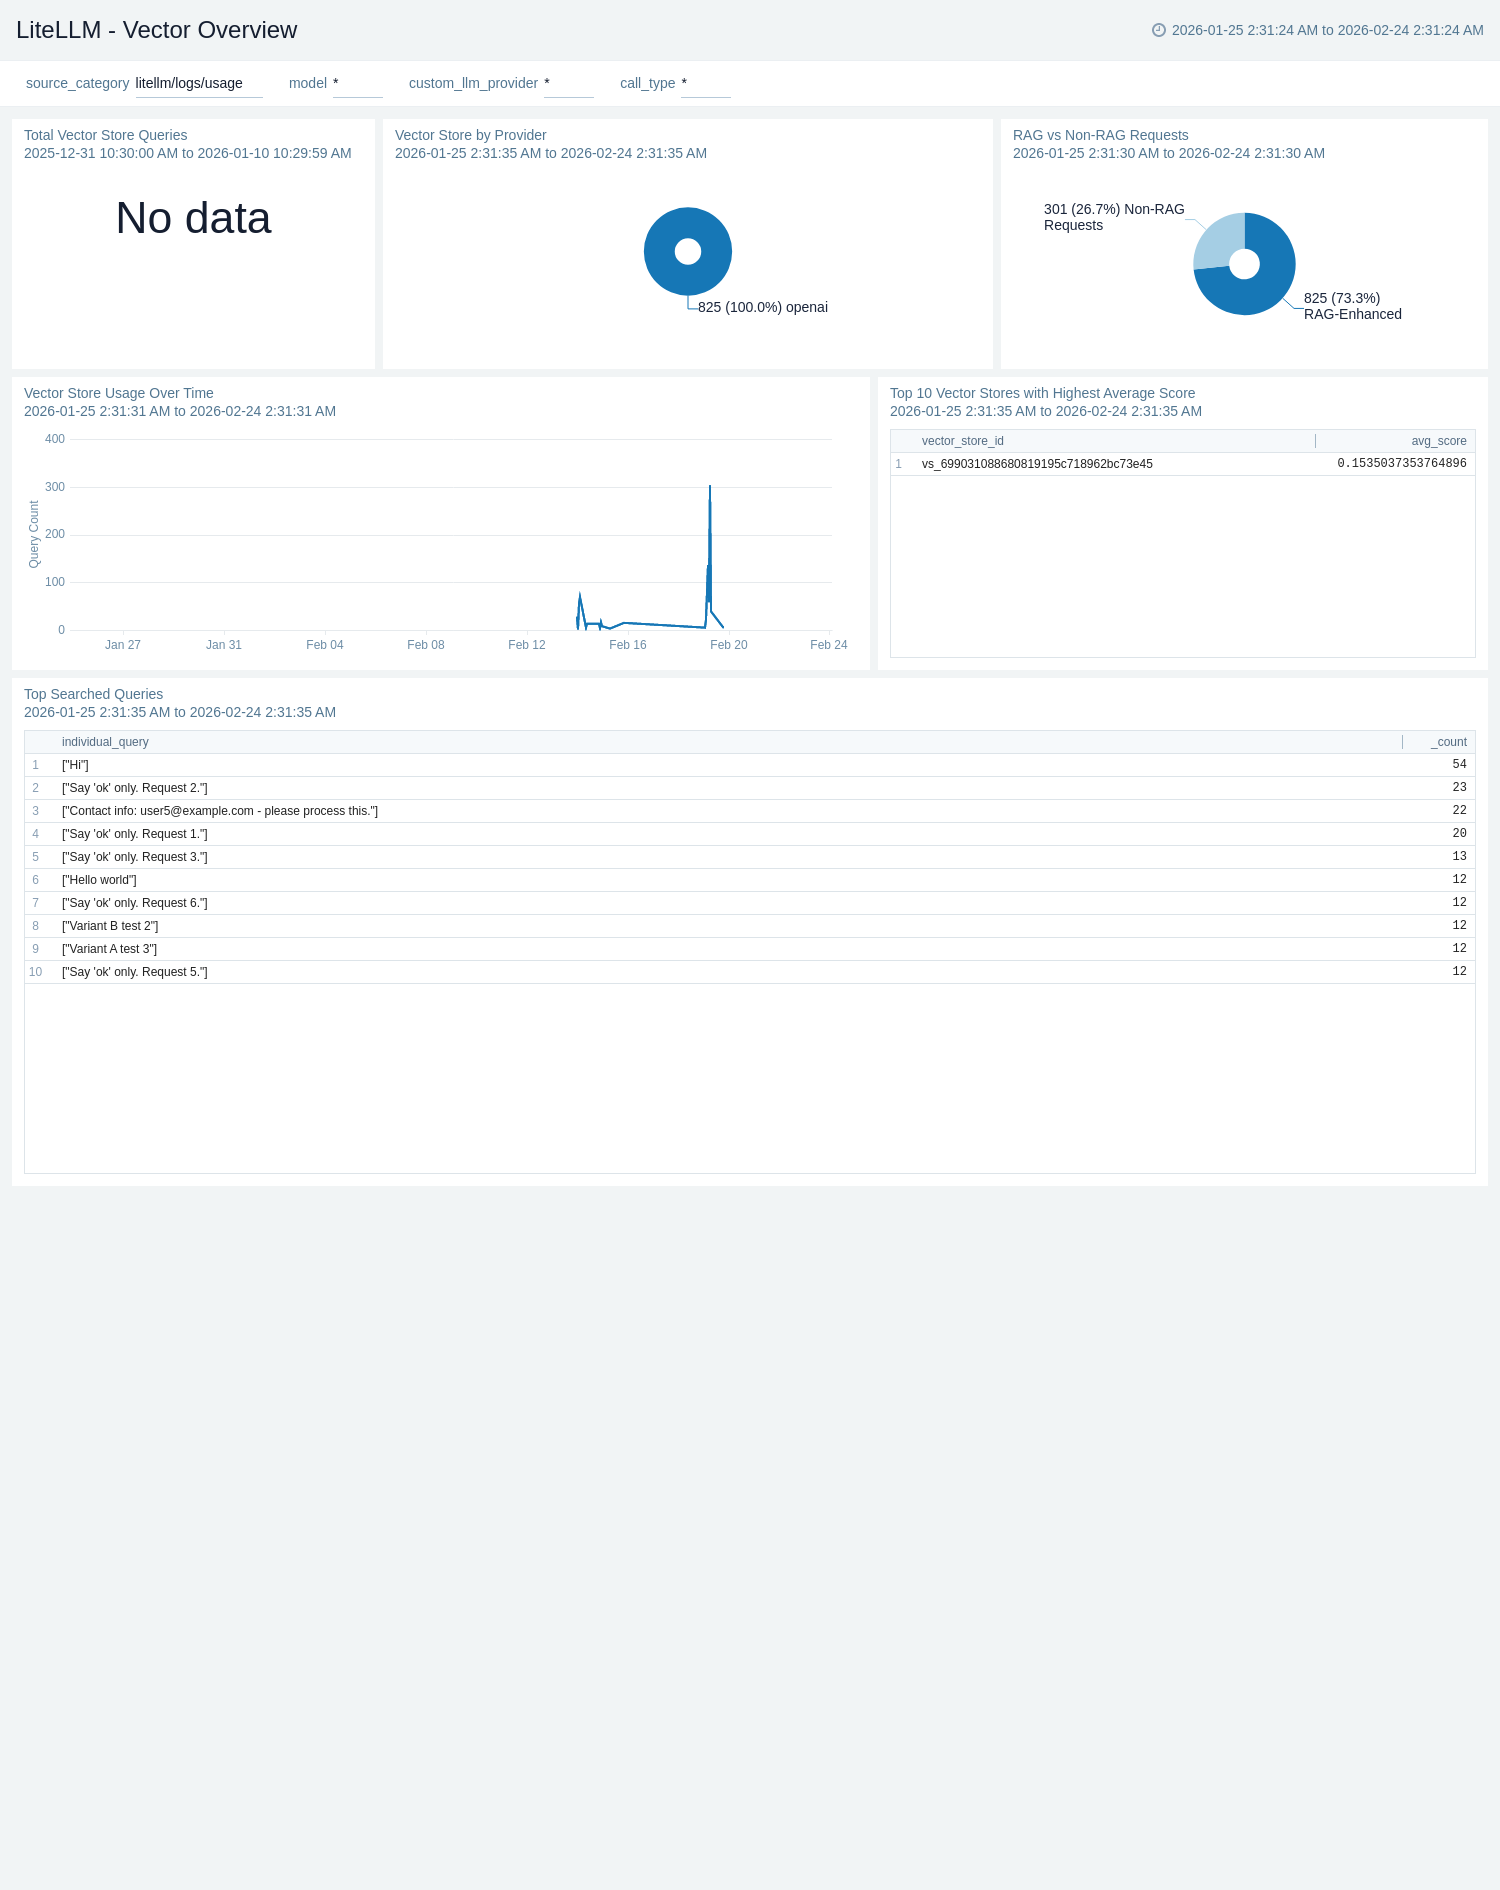
Vector Overview
The LiteLLM - Vector Overview dashboard provides comprehensive monitoring of vector store and RAG operations for LiteLLM including vector search performance, embedding latency, query success rates, and retrieval analytics.
Create monitors for LiteLLM app
From your App Catalog:
- From the Sumo Logic navigation, select App Catalog.
- In the Search Apps field, search for and then select your app.
- Make sure the app is installed.
- Navigate to What's Included tab and scroll down to the Monitors section.
- Click Create next to the pre-configured monitors. In the create monitors window, adjust the trigger conditions and notifications settings based on your requirements.
- Scroll down to Monitor Details.
- Under Location click on New Folder.
note
By default, monitor will be saved in the root folder. So to make the maintenance easier, create a new folder in the location of your choice.
- Enter Folder Name. Folder Description is optional.
tip
Using app version in the folder name will be helpful to determine the versioning for future updates.
- Click Create. Once the folder is created, click on Save.
LiteLLM alerts
| Name | Description | Alert Condition | Recover Condition |
|---|---|---|---|
LiteLLM - Callback Failures | This alert is triggered when the callback logging failure rate exceeds the threshold, indicating issues with observability pipelines such as logging or webhook callbacks. | Count > 0.01 | Count < = 0.01 |
LiteLLM - High End-to-End Latency | This alert is triggered when the average end-to-end request latency exceeds 25 seconds (warning) or 30 seconds (critical). High latency can indicate slow upstream LLM providers, network issues, or proxy overload. | Warning: Count > 25000ms, Critical: Count > 30000ms | Warning: Count < = 25000ms, Critical: Count < = 30000ms |
LiteLLM - High Global Error Rate | This alert is triggered when the percentage of failed requests relative to total requests exceeds 5%. A high error rate may indicate upstream provider outages, misconfigured routes, or authentication issues. | Count > 5% | Count < = 5% |
LiteLLM - Proxy Down No Traffic | This alert is triggered when no proxy traffic is detected, indicating the LiteLLM proxy may be down or unreachable. | Count < = 0 | Count > 0 |
LiteLLM - Team Budget Exhausted | This alert is triggered when the remaining budget for any team drops to zero or below, indicating the team has exhausted its allocated spend and new requests may be rejected. | Count < = 0 | Count > 0 |
Installing the LiteLLM app
To install the app, do the following:
Next-Gen App: To install or update the app, you must be an account administrator or a user with Manage Apps, Manage Monitors, Manage Fields, Manage Metric Rules, and Manage Collectors capabilities depending upon the different content types part of the app.
- Select App Catalog.
- In the 🔎 Search Apps field, run a search for your desired app, then select it.
- Click Install App.
note
Sometimes this button says Add Integration.
- Click Next in the Setup Data section.
- In the Configure section of your respective app, complete the following fields.
- Field Name. If you already have collectors and sources set up, select the configured metadata field name (eg _sourcecategory) or specify other custom metadata (eg: _collector) along with its metadata Field Value.
- Click Next. You will be redirected to the Preview & Done section.
Post-installation
Once your app is installed, it will appear in your Installed Apps folder, and dashboard panels will start to fill automatically.
Each panel slowly fills with data matching the time range query received since the panel was created. Results will not immediately be available but will be updated with full graphs and charts over time.
Upgrading the LiteLLM app
To update the app, do the following:
Next-Gen App: To install or update the app, you must be an account administrator or a user with Manage Apps, Manage Monitors, Manage Fields, Manage Metric Rules, and Manage Collectors capabilities depending upon the different content types part of the app.
- Select App Catalog.
- In the Search Apps field, search for and then select your app.
Optionally, you can identify apps that can be upgraded in the Upgrade available section. - To upgrade the app, select Upgrade from the Manage dropdown.
- If the upgrade does not have any configuration or property changes, you will be redirected to the Preview & Done section.
- If the upgrade has any configuration or property changes, you will be redirected to the Setup Data page.
- In the Configure section of your respective app, complete the following fields.
- Field Name. If you already have collectors and sources set up, select the configured metadata field name (eg _sourcecategory) or specify other custom metadata (eg: _collector) along with its metadata Field Value.
- Click Next. You will be redirected to the Preview & Done section.
Post-update
Your upgraded app will be installed in the Installed Apps folder and dashboard panels will start to fill automatically.
See our Release Notes changelog for new updates in the app.
To revert the app to a previous version, do the following:
- Select App Catalog.
- In the Search Apps field, search for and then select your app.
- To version down the app, select Revert to < previous version of your app > from the Manage dropdown.
Uninstalling the LiteLLM app
To uninstall the app, do the following:
- Select App Catalog.
- In the 🔎 Search Apps field, run a search for your desired app, then select it.
- Click Uninstall.