Microsoft Graph Azure AD Reporting

The Sumo Logic app for Microsoft Graph Azure AD Reporting enables you to access and monitor data, including audit information, user activity, sign-in patterns, and provisioning activities. It helps you to gain insights into how your organization uses Azure AD and identify potential security issues.
Key features of the Microsoft Graph Azure AD Reporting app include:
- Analyze Audit Activities. Provides real-time user activity for every resource category and shows the distribution of audits by operations and services.
- Monitor Sign-In activities. Monitor sign-in activities for your organization, including the number of successful and failed sign-ins, sign-ins by user location, sign-ins by application, and sign-ins from risky countries.
- Identify Suspicious Activities. Identify suspicious activity, such as sign-ins from unfamiliar/risky locations or multiple sign-in attempts.
- Analyze Provisioning Activities. Provides distribution of provisioning activities by status, actions, and initiators. It also shows the most frequent service principals used while provisioning.
Log types
This app uses Microsoft Graph Azure AD Reporting Source to collect Audit, Sign-in, and Provisioning activities.
Sample log messages
Audit Activity Message
{
  "_logType": "Directory Audit",
  "activityDateTime": "2026-03-24T07:25:02.8022947Z",
  "activityDisplayName": "Update device",
  "additionalDetails": [
    { "key": "DeviceId", "value": "9ca12f52-e67b-438d-81a6-d027566a4e" },
    { "key": "DeviceOSType", "value": "iOS" },
    { "key": "DeviceTrustType", "value": "Workplace" }
  ],
  "category": "Device",
  "correlationId": "91996e57-0c2e-47ef-9b87-0c00c571b9f45",
  "id": "Directory_91996e57-0c2e-47ef-9b87-0c0c571b9f45_HB0Y8_85919415",
  "initiatedBy": {
    "app": {
      "appId": null,
      "displayName": "Intune Application Protection CA Client",
      "servicePrincipalId": "78b7a0c0-9d95-4b82-868e-1ec35530eb02",
      "servicePrincipalName": null
    },
    "user": null
  },
  "loggedByService": "Core Directory",
  "operationType": "Update",
  "result": "success",
  "resultReason": "",
  "targetResources": [
    {
      "displayName": "iPhone 15 Plus",
      "groupType": null,
      "id": "46bb479d-f2bb-49c2-88d6-0d8dfaa6ade",
      "modifiedProperties": [
        {
          "displayName": "Included Updated Properties",
          "newValue": "\"\"",
          "oldValue": null
        },
        {
          "displayName": "TargetId.DeviceTrustType",
          "newValue": "\"Workplace\"",
          "oldValue": null
        }
      ],
      "type": "Device",
      "userPrincipalName": null
    }
  ]
}
Sign-In Activity
{
  "_logType": "Signin",
  "appDisplayName": "mindspark_app_services",
  "appId": "6b843aee-b82c-42de-813b-b46bdaffae5c",
  "appliedConditionalAccessPolicies": [
    {
      "displayName": "Microsoft-managed: Multifactor authentication and reauthentication for risky sign-ins",
      "enforcedGrantControls": [],
      "enforcedSessionControls": [],
      "id": "3ad74680-bec7-4a49-86e9-e8ba134cf257",
      "result": "notEnabled"
    },
    {
      "displayName": "D365 and Crossbeam App Access: Service Accounts Only",
      "enforcedGrantControls": [],
      "enforcedSessionControls": ["SignInFrequency"],
      "id": "3207786d-92a3-4040-b0eb-3399d0871c6f",
      "result": "reportOnlyNotApplied"
    },
    {
      "displayName": "Block legacy authentication - test",
      "enforcedGrantControls": ["Block"],
      "enforcedSessionControls": [],
      "id": "f061d024-7f81-49c4-a887-995d08fd8b9a",
      "result": "reportOnlyNotApplied"
    }
  ],
  "clientAppUsed": "Browser",
  "conditionalAccessStatus": "success",
  "correlationId": "1955ee1b-09b0-4107-a6bf-e3b4769838dd",
  "createdDateTime": "2026-03-24T07:27:02Z",
  "deviceDetail": {
    "browser": "Edge 146.0.0",
    "deviceId": "dbef03a1-c879-4155-83ed-73fe8415f669",
    "displayName": "W365-IND-648VX",
    "isCompliant": true,
    "isManaged": true,
    "operatingSystem": "Windows10",
    "trustType": "Azure AD joined"
  },
  "id": "7a556bdc-1fe5-4a4d-88d0-706231e51800",
  "ipAddress": "165.85.134.184",
  "isInteractive": true,
  "location": {
    "city": "Singapore",
    "countryOrRegion": "SG",
    "geoCoordinates": {
      "altitude": null,
      "latitude": 1.28795,
      "longitude": 103.85178
    },
    "state": "Central Singapore"
  },
  "resourceDisplayName": "Microsoft Graph",
  "resourceId": "00000003-0000-0000-c000-000000000000",
  "riskDetail": "none",
  "riskEventTypes": [],
  "riskEventTypes_v2": [],
  "riskLevelAggregated": "none",
  "riskLevelDuringSignIn": "none",
  "riskState": "none",
  "status": {
    "additionalDetails": null,
    "errorCode": 0,
    "failureReason": "Other."
  },
  "userDisplayName": "Mallaiah Sangi",
  "userId": "78e2ab33-67d5-4467-832a-f17b62ecd364",
  "userPrincipalName": "mallaiah_sangi@test.com"
}
Provisioning Activity
{
  "_logType": "Provisioning",
  "activityDateTime": "2026-03-24T07:23:47Z",
  "changeId": "eea3cad8-26b3-4bb9-8719-ce4affe92801",
  "cycleId": "8b52ae4b-53a8-41ef-ae7f-19435028c52a",
  "durationInMilliseconds": 91009,
  "id": "b504b5fb-38b8-8887-884d-fc4d48f1afab",
  "initiatedBy": {
    "displayName": "Azure AD Provisioning Service",
    "id": "",
    "initiatorType": "system"
  },
  "jobId": "airtable.7584ba9cdd9147459b7eb4de9da3be7b.fa64de6e-a5fe-40fe-bd5c-eb15a3638d3d",
  "modifiedProperties": [
    { "displayName": "active", "newValue": "True", "oldValue": null },
    {
      "displayName": "displayName",
      "newValue": "Craig Ranger",
      "oldValue": null
    },
    {
      "displayName": "userName",
      "newValue": "craig_ranger@test.com",
      "oldValue": null
    },
    { "displayName": "name.givenName", "newValue": "Craig", "oldValue": null },
    {
      "displayName": "name.familyName",
      "newValue": "Ranger",
      "oldValue": null
    },
    {
      "displayName": "name.formatted",
      "newValue": "Craig Ranger",
      "oldValue": null
    }
  ],
  "provisioningAction": "create",
  "provisioningStatusInfo": {
    "errorInformation": {
      "additionalDetails": null,
      "errorCategory": "nonServiceFailure",
      "errorCode": "SystemForCrossDomainIdentityManagementServiceIncompatibleFiltering",
      "reason": "StatusCode: Conflict\r\nMessage: Processing of the HTTP request resulted in an exception. Please see the HTTP response returned by the 'Response' property of this exception for details.\r\nWeb Response: \r\n{\"schemas\":[\"urn:ietf:params:scim:api:messages:2.0:Error\"],\"detail\":\"unclaimed user already exists for that email address.  Please claim user instead of provisioning them.\",\"status\":409,\"scimType\":\"uniqueness\"}. This operation was retried 1 times. It will be retried again after this date: 2026-03-24T13:23:44.9198514Z UTC",
      "recommendedAction": null
    },
    "status": "failure"
  },
  "provisioningSteps": [
    {
      "description": "We are retrying an operation that previously failed.\r\nIdentifier: craig_ranger@test .com\r\nObject type: User\r\nDirectory: Microsoft Entra ID",
      "details": {
        "CountProcessed": "0",
        "CreationTime": "2026-03-24T07:17:42.9099941Z",
        "Identifier": "b028a46a-9c4a-424a-954b-521d60f8e8da",
        "ModificationType": "Add",
        "NextAttempt": "3/24/2026 7:17:42 AM",
        "Origin": "Source",
        "TypeName": "EscrowedEntryDefault"
      },
      "name": "EntryEscrowRetry",
      "provisioningStepType": "import",
      "status": "success"
    },
    {
      "description": "Failed to create User 'craig_ranger@test.com' in Airtable",
      "details": {
        "ReportableIdentifier": "craig_ranger@test .com",
        "active": "True",
        "addresses[type eq \"work\"]country": "United States of America",
        "addresses[type eq \"work\"]formatted": "US - TX - Home Office",
        "addresses[type eq \"work\"]locality": "Austin",
        "addresses[type eq \"work\"]postalCode": "78701",
        "addresses[type eq \"work\"]region": "Texas",
        "addresses[type eq \"work\"]streetAddress": "123 Main Street",
        "displayName": "Craig Ranger",
        "emails[type eq \"work\"]value": "Craig_Ranger@test .com",
        "externalId": "b028a46a-9c4a-424a-954b-521d60f8e8da",
        "namefamilyName": "Ranger",
        "nameformatted": "Craig Ranger",
        "namegivenName": "Craig",
        "nickName": "CRanger",
        "preferredLanguage": "en_US",
        "title": "Manager - Services Endpoint",
        "urnietfparamsscimschemasextensionenterprise20UsercostCenter": "test  Services",
        "urnietfparamsscimschemasextensionenterprise20Userdepartment": "test  Services",
        "urnietfparamsscimschemasextensionenterprise20UseremployeeNumber": "016277",
        "userName": "craig_ranger@test .com"
      },
      "name": "EntryExportAdd",
      "provisioningStepType": "export",
      "status": "failure"
    }
  ],
  "servicePrincipal": {
    "displayName": "Airtable - test Corp",
    "id": "e394395f-7b85-4a43-a1be-365854c5a110"
  },
  "sourceIdentity": {
    "details": {
      "DisplayName": "Craig Ranger",
      "UserPrincipalName": "craig_ranger@test .com",
      "id": "b028a46a-9c4a-424a-954b-521d60f8e8da",
      "odatatype": "User"
    },
    "displayName": "Craig Ranger",
    "id": "b028a46a-9c4a-424a-954b-521d60f8e8da",
    "identityType": "User"
  },
  "sourceSystem": {
    "details": {},
    "displayName": "Microsoft Entra ID",
    "id": "05040880-a6d8-4899-bed4-b8056957edd0"
  },
  "targetIdentity": {
    "details": {},
    "displayName": "",
    "id": "",
    "identityType": "User"
  },
  "targetSystem": {
    "details": {
      "ApplicationId": "365401e1-2c0d-4990-b174-f48844df4fba",
      "ServicePrincipalDisplayName": "Airtable - test Corp",
      "ServicePrincipalId": "e394395f-7b85-4a43-a1be-365854c5a110"
    },
    "displayName": "Airtable",
    "id": "3e0cc32f-582d-4c52-8114-c1e199bb982c"
  },
  "tenantId": "7584ba9c-dd91-4745-9b7e-b4de9da3be7b"
}
Sample queries
View Sample Queries
_sourceCategory={{Logsdatasource}} (activityDisplayName  "Directory Audit")
| json "_logType","id","initiatedBy.user","result","operationType","category","loggedByService","activityDisplayName","targetResources[*].displayName","targetResources[*].type" as log_type,id,initiator_user,result,operation_type,category,logged_by_service,activity,targeted_resource_names,targeted_resource_types nodrop

| where log_type matches "Directory Audit"

// global filter
| if (isNull(initiator_user),"app","user") as initiator
| where if("{{initiator_type}}"="*",true,initiator matches "{{initiator_type}}")
| where if("{{result}}"="*",true,result matches "{{result}}")
| where if("{{operation_type}}"="*",true,operation_type matches "{{operation_type}}")
| where if("{{category}}"="*",true,category matches "{{category}}")
| where if("{{service}}"="*",true,logged_by_service matches "{{service}}")
| where if("{{activity}}"="*",true,activity matches "{{activity}}")
| extract field=targeted_resource_names "\"?(?<targeted_resource_name>[\w\s\-&.,]*)\"?[,\n\]]" multi
| where if("{{targeted_resource_name}}" = "*",true,targeted_resource_name matches "{{targeted_resource_name}}")
| extract field=targeted_resource_types "\"?(?<targeted_resource_type>[\w\s\-&.,]*)\"?[,\n\]]" multi
| where if("{{targeted_resource_type}}" = "*",true,targeted_resource_type matches "{{targeted_resource_type}}")
| where if("{{logged_by_service}}"="*",true,logged_by_service matches "{{logged_by_service}}")

// panel specific
| count by id
| count
_sourceCategory={{Logsdatasource}} Signin userDisplayName userPrincipalName failureReason
| json "_logType","id","clientAppUsed","conditionalAccessStatus","riskLevelAggregated","riskDetail","riskState","status.errorCode","deviceDetail.operatingSystem","location.countryOrRegion","isInteractive","appDisplayName","resourceDisplayName","userPrincipalName" as log_type,id,client_app_used,conditional_access_status,risk_level,risk_detail,risk_state,error_code,device_os,country,is_interactive,app_display_name,resource_name,user_principal nodrop

| where log_type matches "Signin"
| where !(error_code matches "0")

// Global filter
| where if("{{client_app_used}}"="*",true,client_app_used matches "{{client_app_used}}")
| where if("{{conditional_access_policy_status}}"="*",true,conditional_access_status matches "{{conditional_access_policy_status}}")
| where if("{{risk_level}}"="*",true,risk_level matches "{{risk_level}}")
| where if("{{risk_detail}}"="*",true,risk_detail matches "{{risk_detail}}")
| where if("{{risk_state}}"="*",true,risk_state matches "{{risk_state}}")
| where if("{{device_os}}"="*",true,device_os matches "{{device_os}}")
| where if("{{country}}"="*",true,country matches "{{country}}")
| where if("{{is_interactive}}" = "*",true,is_interactive matches "{{is_interactive}}")
| where if("{{app_display_name}}"="*",true,app_display_name matches "{{app_display_name}}")
| where if("{{resource_name}}"="*",true,resource_name matches "{{resource_name}}")
| where if("{{error_code}}"="*",true,error_code matches "{{error_code}}")
| where if("{{user_principal}}"="*",true,user_principal matches "{{user_principal}}")

// panel specific
| count by id
| count
_sourceCategory={{Logsdatasource}} (Provisioning provisioningAction provisioningSteps provisioningStatusInfo)
| json "_logType","id","initiatedBy.initiatorType","provisioningAction","provisioningStatusInfo.status","servicePrincipal.displayName","targetSystem.displayName","sourceIdentity.identityType","targetIdentity.identityType","tenantId","provisioningStatusInfo.errorInformation.errorCategory","provisioningStatusInfo.errorInformation.errorCode" as log_type,id,initiated_by,provisioning_action,provisioning_status,service_principal,target_system_name,source_identity_type,target_identity_type,tenant_id,error_category,error_code nodrop

| where log_type matches "Provisioning"

// global filter
| where if("{{initiated_by}}" = "*",true,initiated_by matches "{{initiated_by}}")
| where if("{{provisioning_action}}"="*",true,provisioning_action matches "{{provisioning_action}}")
| where if("{{provisioning_status}}"="*",true,provisioning_status matches "{{provisioning_status}}")
| where if("{{service_principal}}"="*",true,service_principal matches "{{service_principal}}")
| where if("{{target_system}}"="*",true,target_system_name matches "{{target_system}}")
| where if("{{source_identity_type}}"="*",true,source_identity_type matches "{{source_identity_type}}")
| where if("{{target_identity_type}}"="*",true,target_identity_type matches "{{target_identity_type}}")
| where if("{{tenant_id}}"="*",true,tenant_id matches"{{tenant_id}}")
| where if("{{error_code}}"="*",true,error_code matches "{{error_code}}")
| where if("{{error_category}}"="*",true,error_category matches "{{error_category}}")

// Panel specific
| where !isBlank(provisioning_status)
| count by id,provisioning_status
| if (provisioning_status matches "failure", 1, 0) as is_failure
| sum(is_failure) as total_failures, count as total_events
| round((total_failures * 100)/total_events,2) as failure_rate_pct
| concat(failure_rate_pct,"%") as percentage
| fields percentage
Collection configuration and app installation
Depending on the set up collection method, you can configure and install the app in three ways:
- Create a new collector and install the app. Create a new Sumo Logic Cloud-to-Cloud (C2C) source under a new Sumo Logic Collector and later install the app, or
- Use an existing collector and install the app. Create a new Sumo Logic Cloud-to-Cloud (C2C) source under an existing Sumo Logic Collector and later install the app, or
- Use existing source and install the app. Use your existing configured Sumo Logic Cloud-to-Cloud (C2C) source and install the app.
Use the Cloud-to-Cloud Integration for Microsoft Graph Azure AD Reporting to create the source and use the same source category while installing the app. By following these steps, you can ensure that your Microsoft Graph Azure AD Reporting app is properly integrated and configured to collect and analyze your Microsoft Graph Azure AD Reporting data.
Create a new collector and install the app
To set up collection and install the app, do the following:
Next-Gen App: To install or update the app, you must be an account administrator or a user with Manage Apps, Manage Monitors, Manage Fields, Manage Metric Rules, and Manage Collectors capabilities depending upon the different content types part of the app.
- Select App Catalog.
- In the 🔎 Search Apps field, run a search for your desired app, then select it.
- Click Install App.
note
Sometimes this button says Add Integration.
- In the Set Up Collection section of your respective app, select Create a new Collector.
- Collector Name. Enter a Name to display the Source in the Sumo Logic web application. The description is optional.
- Timezone. Set the default time zone when it is not extracted from the log timestamp. Time zone settings on Sources override a Collector time zone setting.
- (Optional) Metadata. Click the +Add Metadata link to add a custom log Metadata Fields. Define the fields you want to associate, each metadata field needs a name (key) and value.
 A green circle with a checkmark is shown when the field exists and is enabled in the Fields table schema.
 An orange triangle with an exclamation point is shown when the field doesn't exist, or is disabled in the Fields table schema. In this case, you'll see an option to automatically add or enable the nonexistent fields to the Fields table schema. If a field is sent to Sumo Logic but isn’t present or enabled in the schema, it’s ignored and marked as Dropped.
- Click Next.
- Configure the source as specified in the
Infobox above, ensuring all required fields are included. - In the Configure section of your respective app, complete the following fields.
- Field Name. If you already have collectors and sources set up, select the configured metadata field name (eg _sourcecategory) or specify other custom metadata (eg: _collector) along with its metadata Field Value.
- Click Next. You will be redirected to the Preview & Done section.
Post-installation
Once your app is installed, it will appear in your Installed Apps folder, and dashboard panels will start to fill automatically.
Each panel slowly fills with data matching the time range query received since the panel was created. Results will not immediately be available but will be updated with full graphs and charts over time.
Use an existing collector and install the app
To set up the source in the existing collector and install the app, do the following:
Next-Gen App: To install or update the app, you must be an account administrator or a user with Manage Apps, Manage Monitors, Manage Fields, Manage Metric Rules, and Manage Collectors capabilities depending upon the different content types part of the app.
- Select App Catalog.
- In the 🔎 Search Apps field, run a search for your desired app, then select it.
- Click Install App.
note
Sometimes this button says Add Integration.
- In the Set Up Collection section of your respective app, select Use an existing Collector.
- From the Select Collector dropdown, select the collector that you want to set up your source with and click Next.
- Configure the source as specified in the
Infobox above, ensuring all required fields are included. - In the Configure section of your respective app, complete the following fields.
- Field Name. If you already have collectors and sources set up, select the configured metadata field name (eg _sourcecategory) or specify other custom metadata (eg: _collector) along with its metadata Field Value.
- Click Next. You will be redirected to the Preview & Done section.
Post-installation
Once your app is installed, it will appear in your Installed Apps folder, and dashboard panels will start to fill automatically.
Each panel slowly fills with data matching the time range query received since the panel was created. Results will not immediately be available but will be updated with full graphs and charts over time.
Use an existing source and install the app
To skip collection and only install the app, do the following:
Next-Gen App: To install or update the app, you must be an account administrator or a user with Manage Apps, Manage Monitors, Manage Fields, Manage Metric Rules, and Manage Collectors capabilities depending upon the different content types part of the app.
- Select App Catalog.
- In the 🔎 Search Apps field, run a search for your desired app, then select it.
- Click Install App.
note
Sometimes this button says Add Integration.
- In the Set Up Collection section of your respective app, select Skip this step and use existing source and click Next.
- In the Configure section of your respective app, complete the following fields.
- Field Name. If you already have collectors and sources set up, select the configured metadata field name (eg _sourcecategory) or specify other custom metadata (eg: _collector) along with its metadata Field Value.
- Click Next. You will be redirected to the Preview & Done section.
Post-installation
Once your app is installed, it will appear in your Installed Apps folder, and dashboard panels will start to fill automatically.
Each panel slowly fills with data matching the time range query received since the panel was created. Results will not immediately be available but will be updated with full graphs and charts over time.
Viewing Microsoft Graph Azure AD Reporting dashboards
All dashboards have a set of filters that you can apply to the entire dashboard. Use these filters to drill down and examine the data to a granular level.
- You can change the time range for a dashboard or panel by selecting a predefined interval from a drop-down list, choosing a recently used time range, or specifying custom dates and times. Learn more.
- You can use template variables to drill down and examine the data on a granular level. For more information, see Filtering Dashboards with Template Variables.
- Most Next-Gen apps allow you to provide the scope at the installation time and are comprised of a key (
_sourceCategoryby default) and a default value for this key. Based on your input, the app dashboards will be parameterized with a dashboard variable, allowing you to change the dataset queried by all panels. This eliminates the need to create multiple copies of the same dashboard with different queries.
Audits
The Microsoft Graph Azure AD Reporting - Audits dashboard delivers a comprehensive view of directory audit activities, breaking down events by operation types, resource categories, services, initiators, and result types while surfacing top targeted resources and most active users. Geographic context maps audit activity and flags events from embargoed regions, while time-series trend analysis helps detect anomalies in administrative operations. Failure reason tracking and recent audit event summaries enable teams to investigate suspicious actions and troubleshoot configuration issues effectively.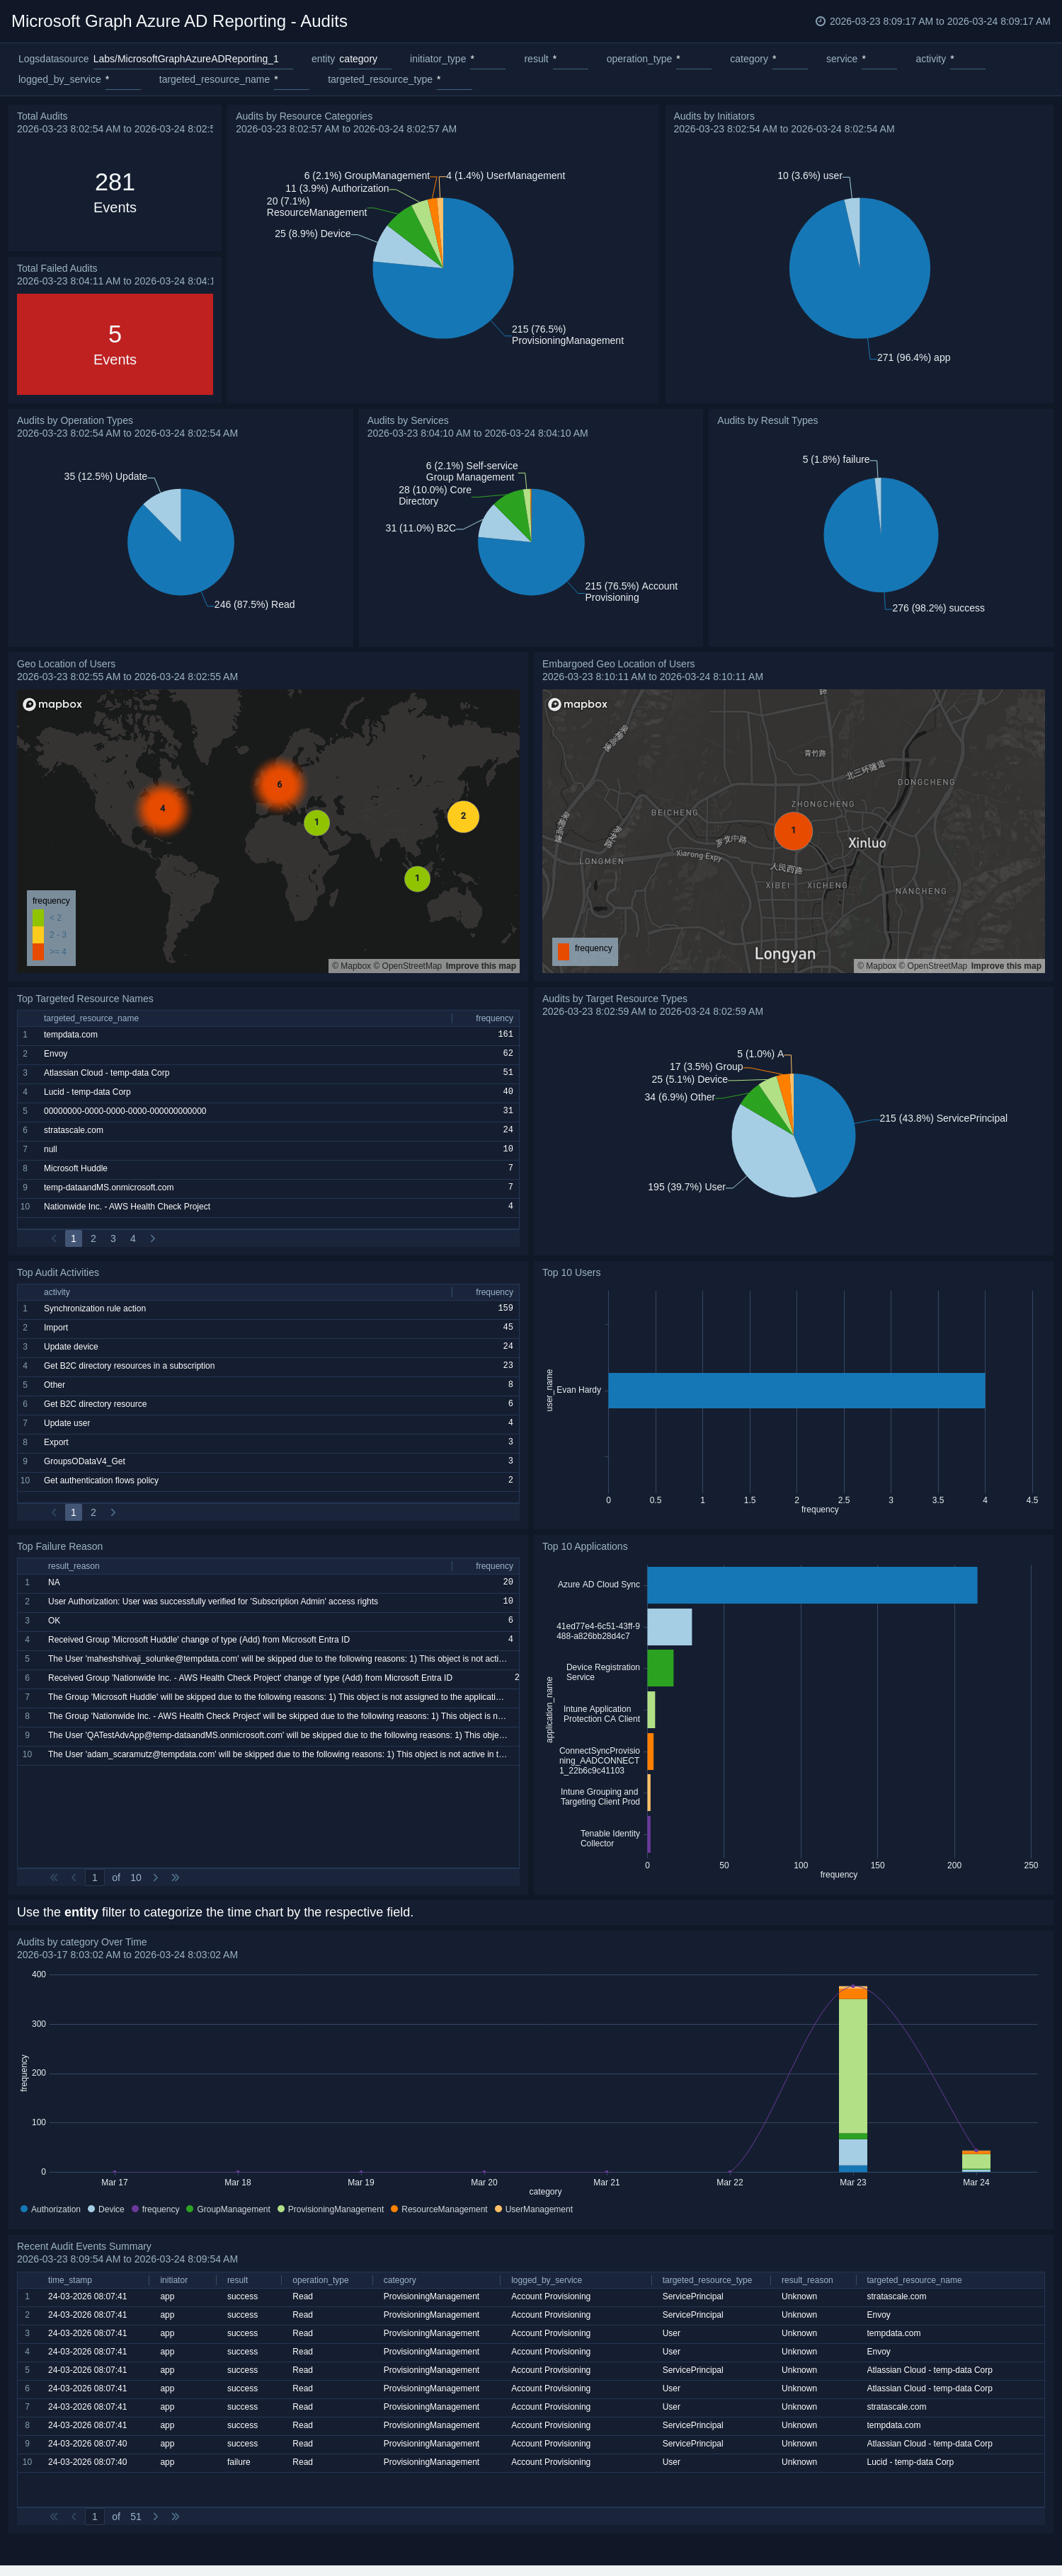
Sign-Ins
The Microsoft Graph Azure AD Reporting - Sign-Ins dashboard provides a broad operational view of all authentication activities, tracking total sign-ins, failure rates, and trends over time while breaking down data by client applications, operating systems, geographic locations, and error codes. It highlights the most active users and applications, distinguishes between interactive and non-interactive sign-ins, and maps authentication activity globally to identify regional patterns. Detailed summaries of recent and failed sign-in events, along with top failure reasons, guide administrators toward targeted fixes to improve the overall sign-in experience.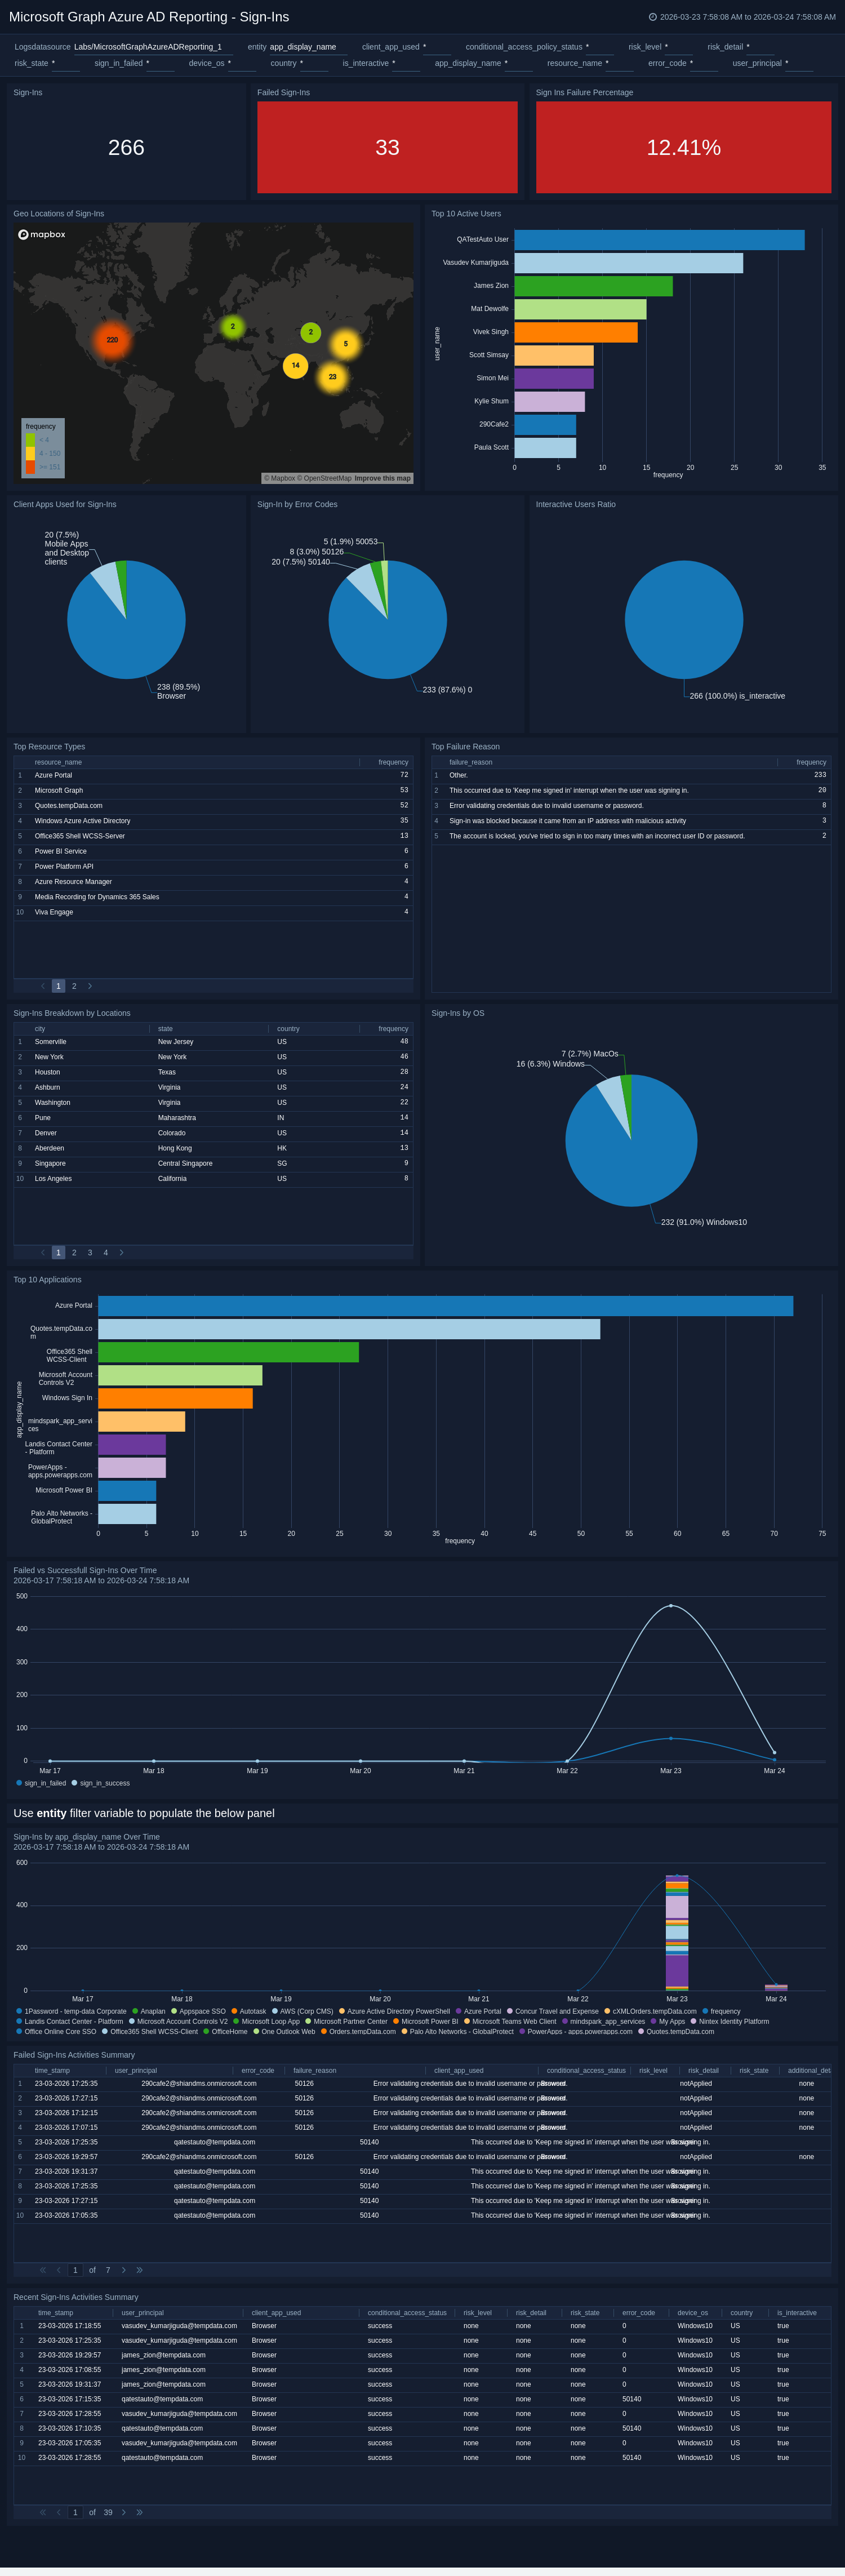
Sign-Ins Security Overview
The Microsoft Graph Azure AD Reporting - Sign-Ins Security Overview dashboard provides a security-focused view of authentication activities, highlighting risky sign-in events, risk levels, and sign-ins from embargoed countries to help analysts rapidly identify compromised accounts. It tracks conditional access policy effectiveness, non-compliant device sign-ins, and risk state transitions to assess how well security controls are enforcing access policies. Detailed panels for high-risk sign-ins and risky user details support granular investigation and incident response workflows.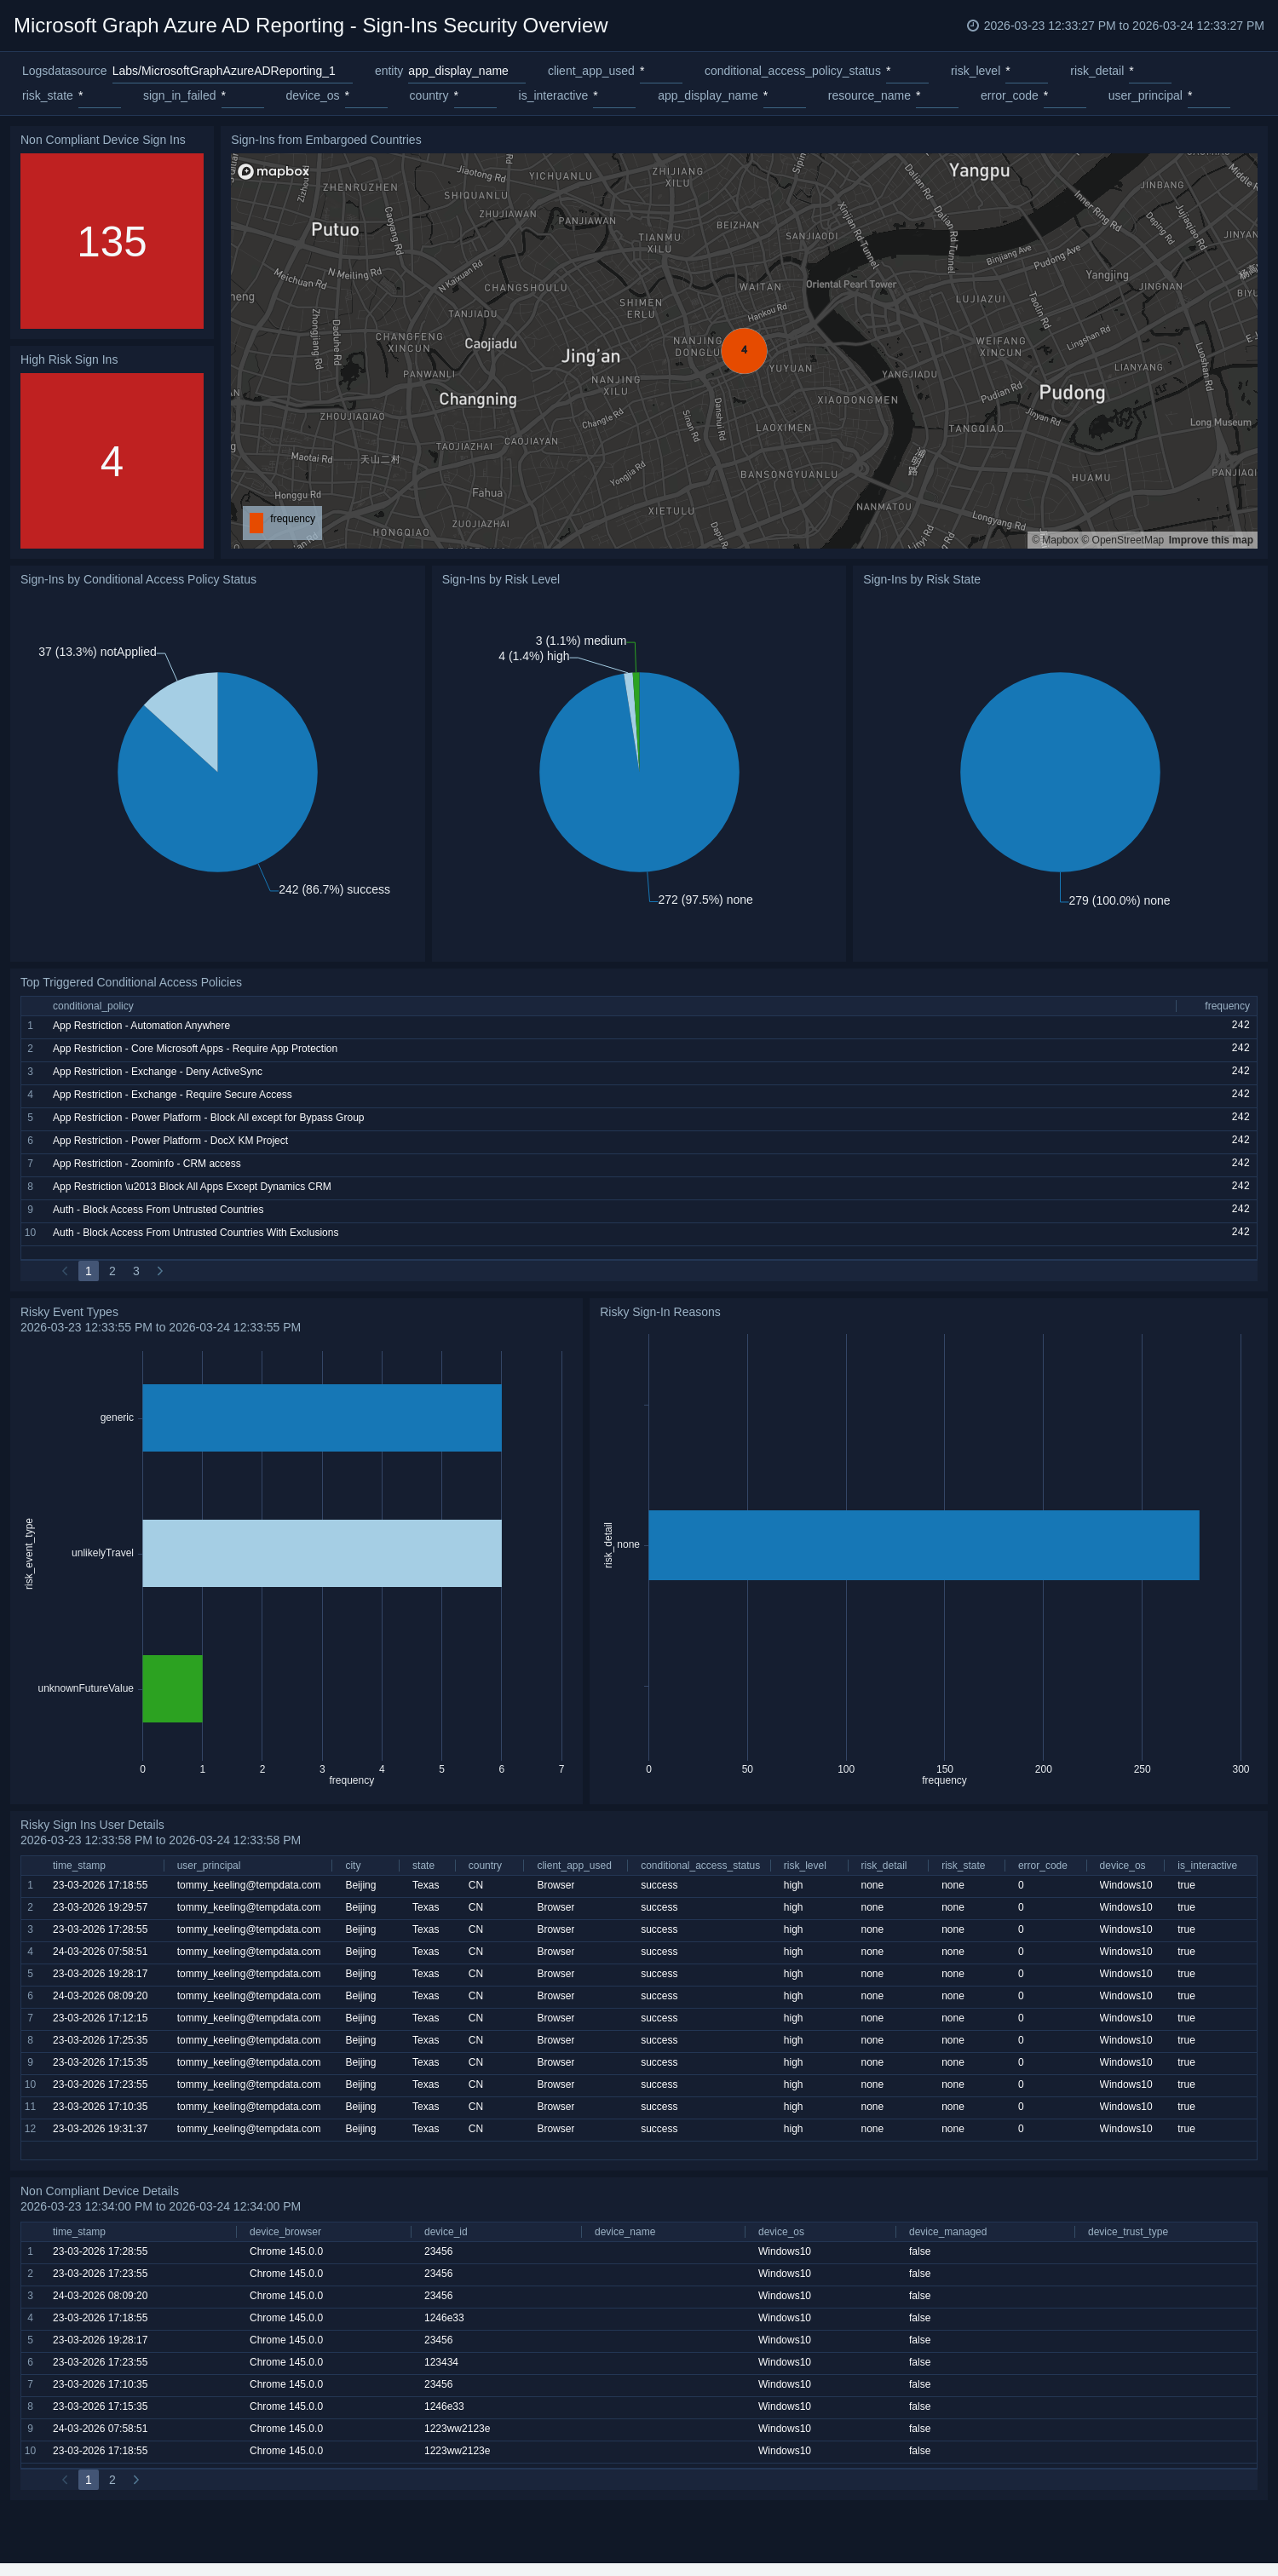
Provisioning Overview
The Microsoft Graph Azure AD Reporting - Provisioning Overview dashboard provides a holistic view of identity provisioning activities, presenting key metrics including total activities, failure rates, average duration, and breakdowns by action, initiator, status, and error categories. It highlights top service principals, source systems, targeted identity types, and most modified resources to reveal which integrations and objects are most active. Time-series trend analysis and recent activity details enable teams to identify performance degradations and troubleshoot provisioning issues in real time.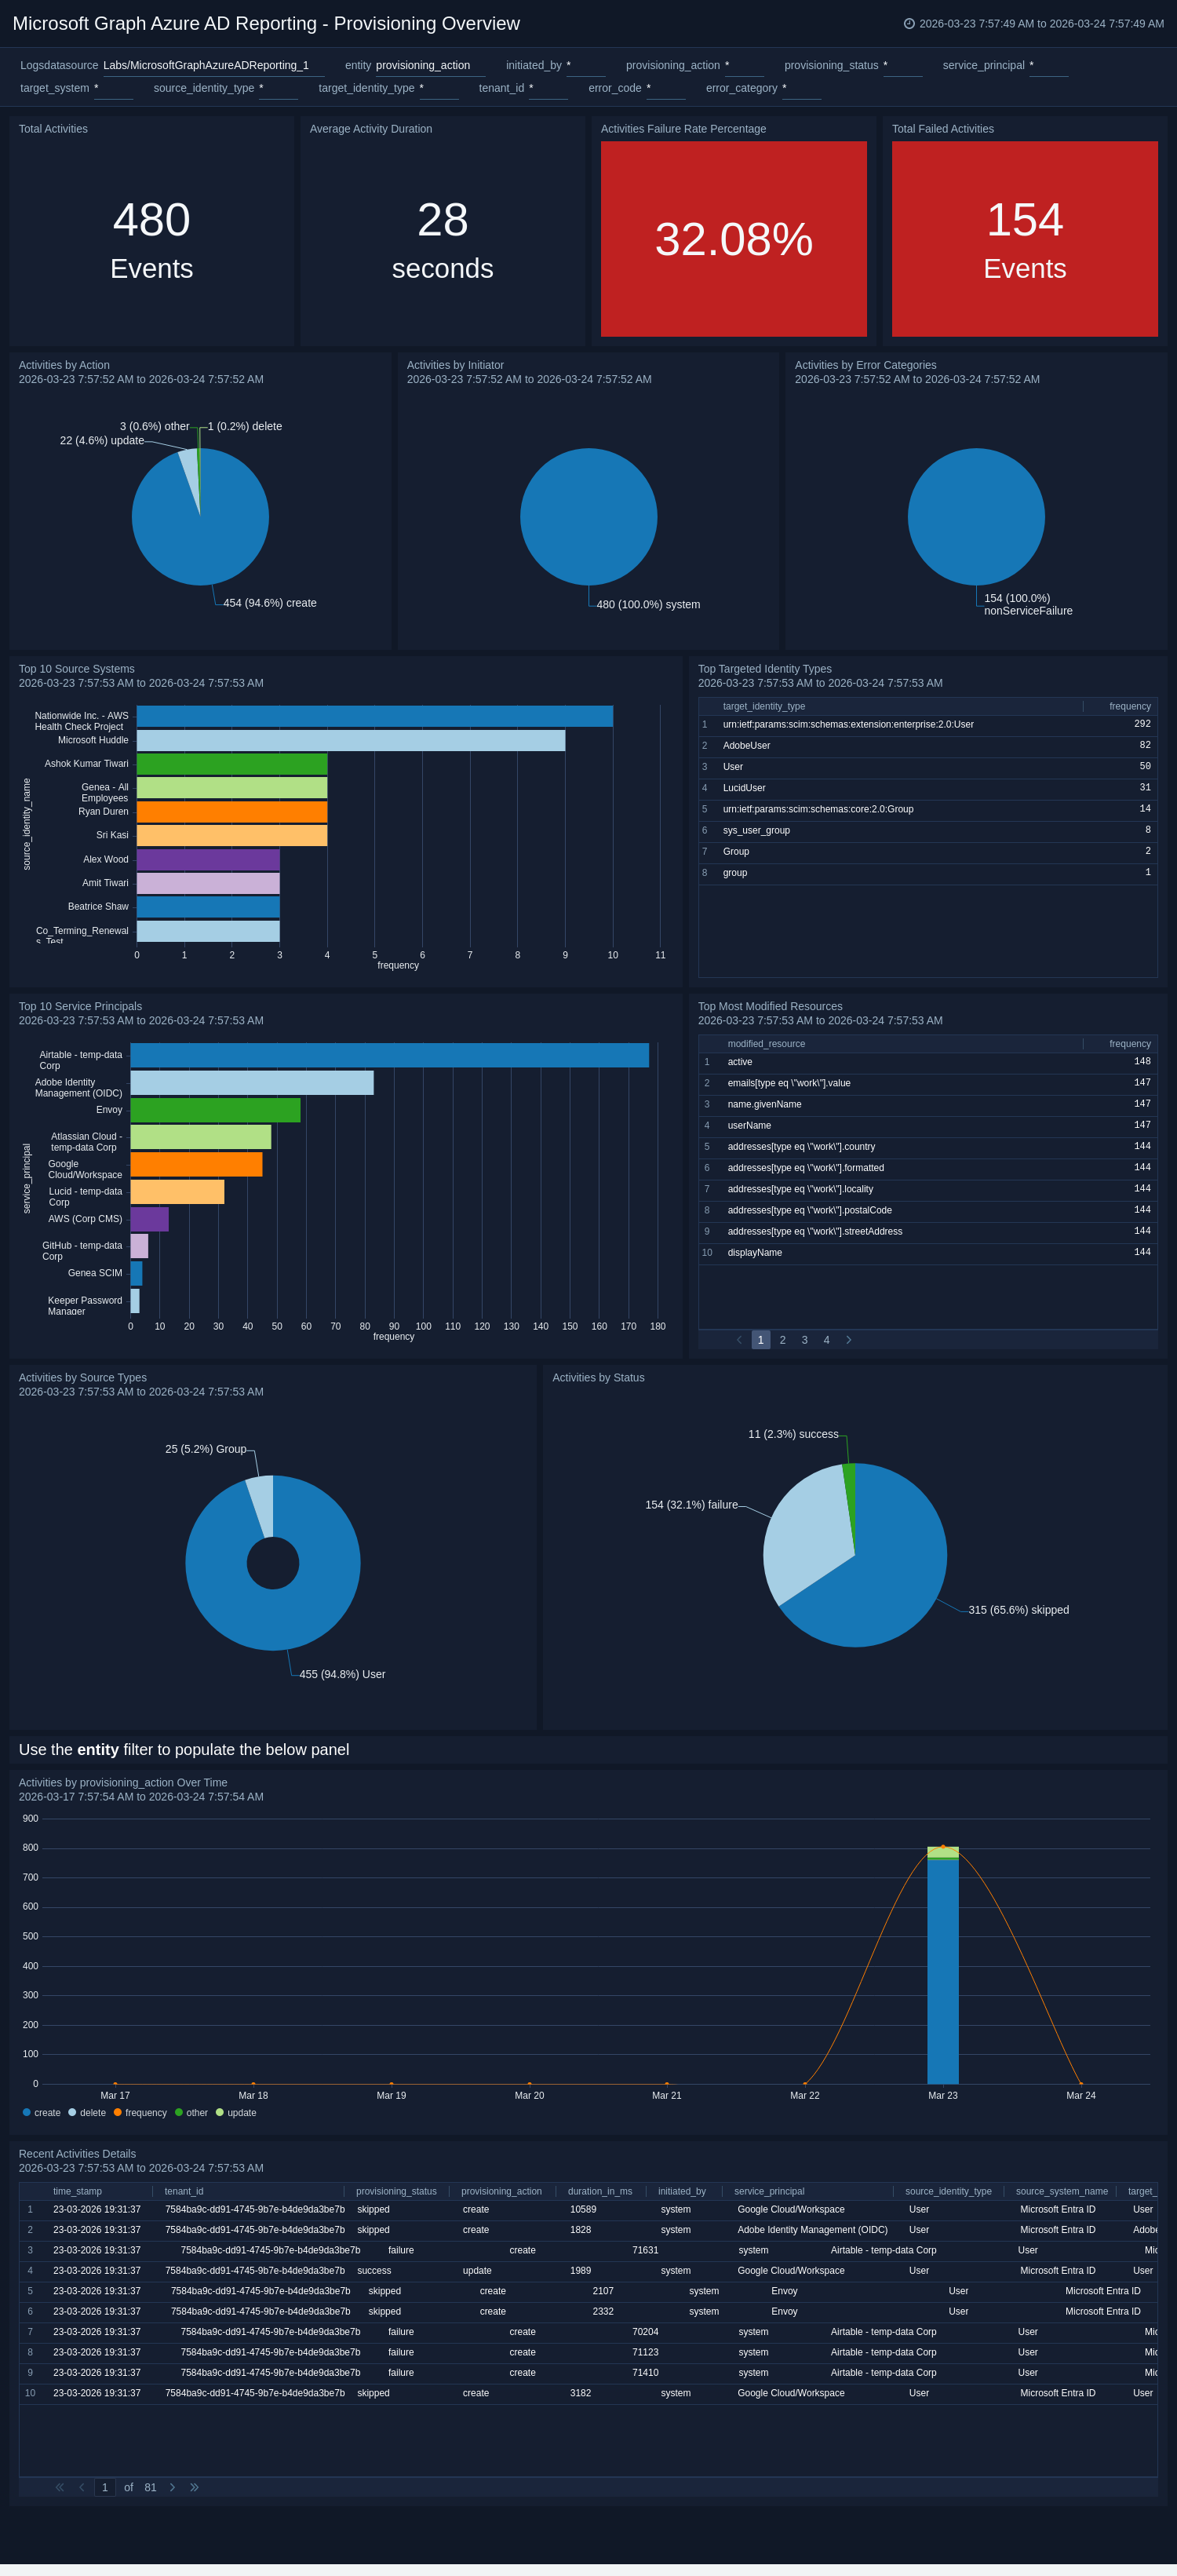
Provisioning Error Analysis
The Microsoft Graph Azure AD Reporting - Provisioning Error Analysis dashboard offers a deep-dive view into provisioning failures, identifying top targeted systems, most frequent error codes, and error categories to reveal systemic issues such as schema mismatches or permission problems. The error code trend panel visualizes how errors evolve over time, helping teams assess whether issues are recurring or resolving after remediation efforts. Failed activity details and long-running activity panels provide event-level context for troubleshooting individual failures and surfacing performance bottlenecks.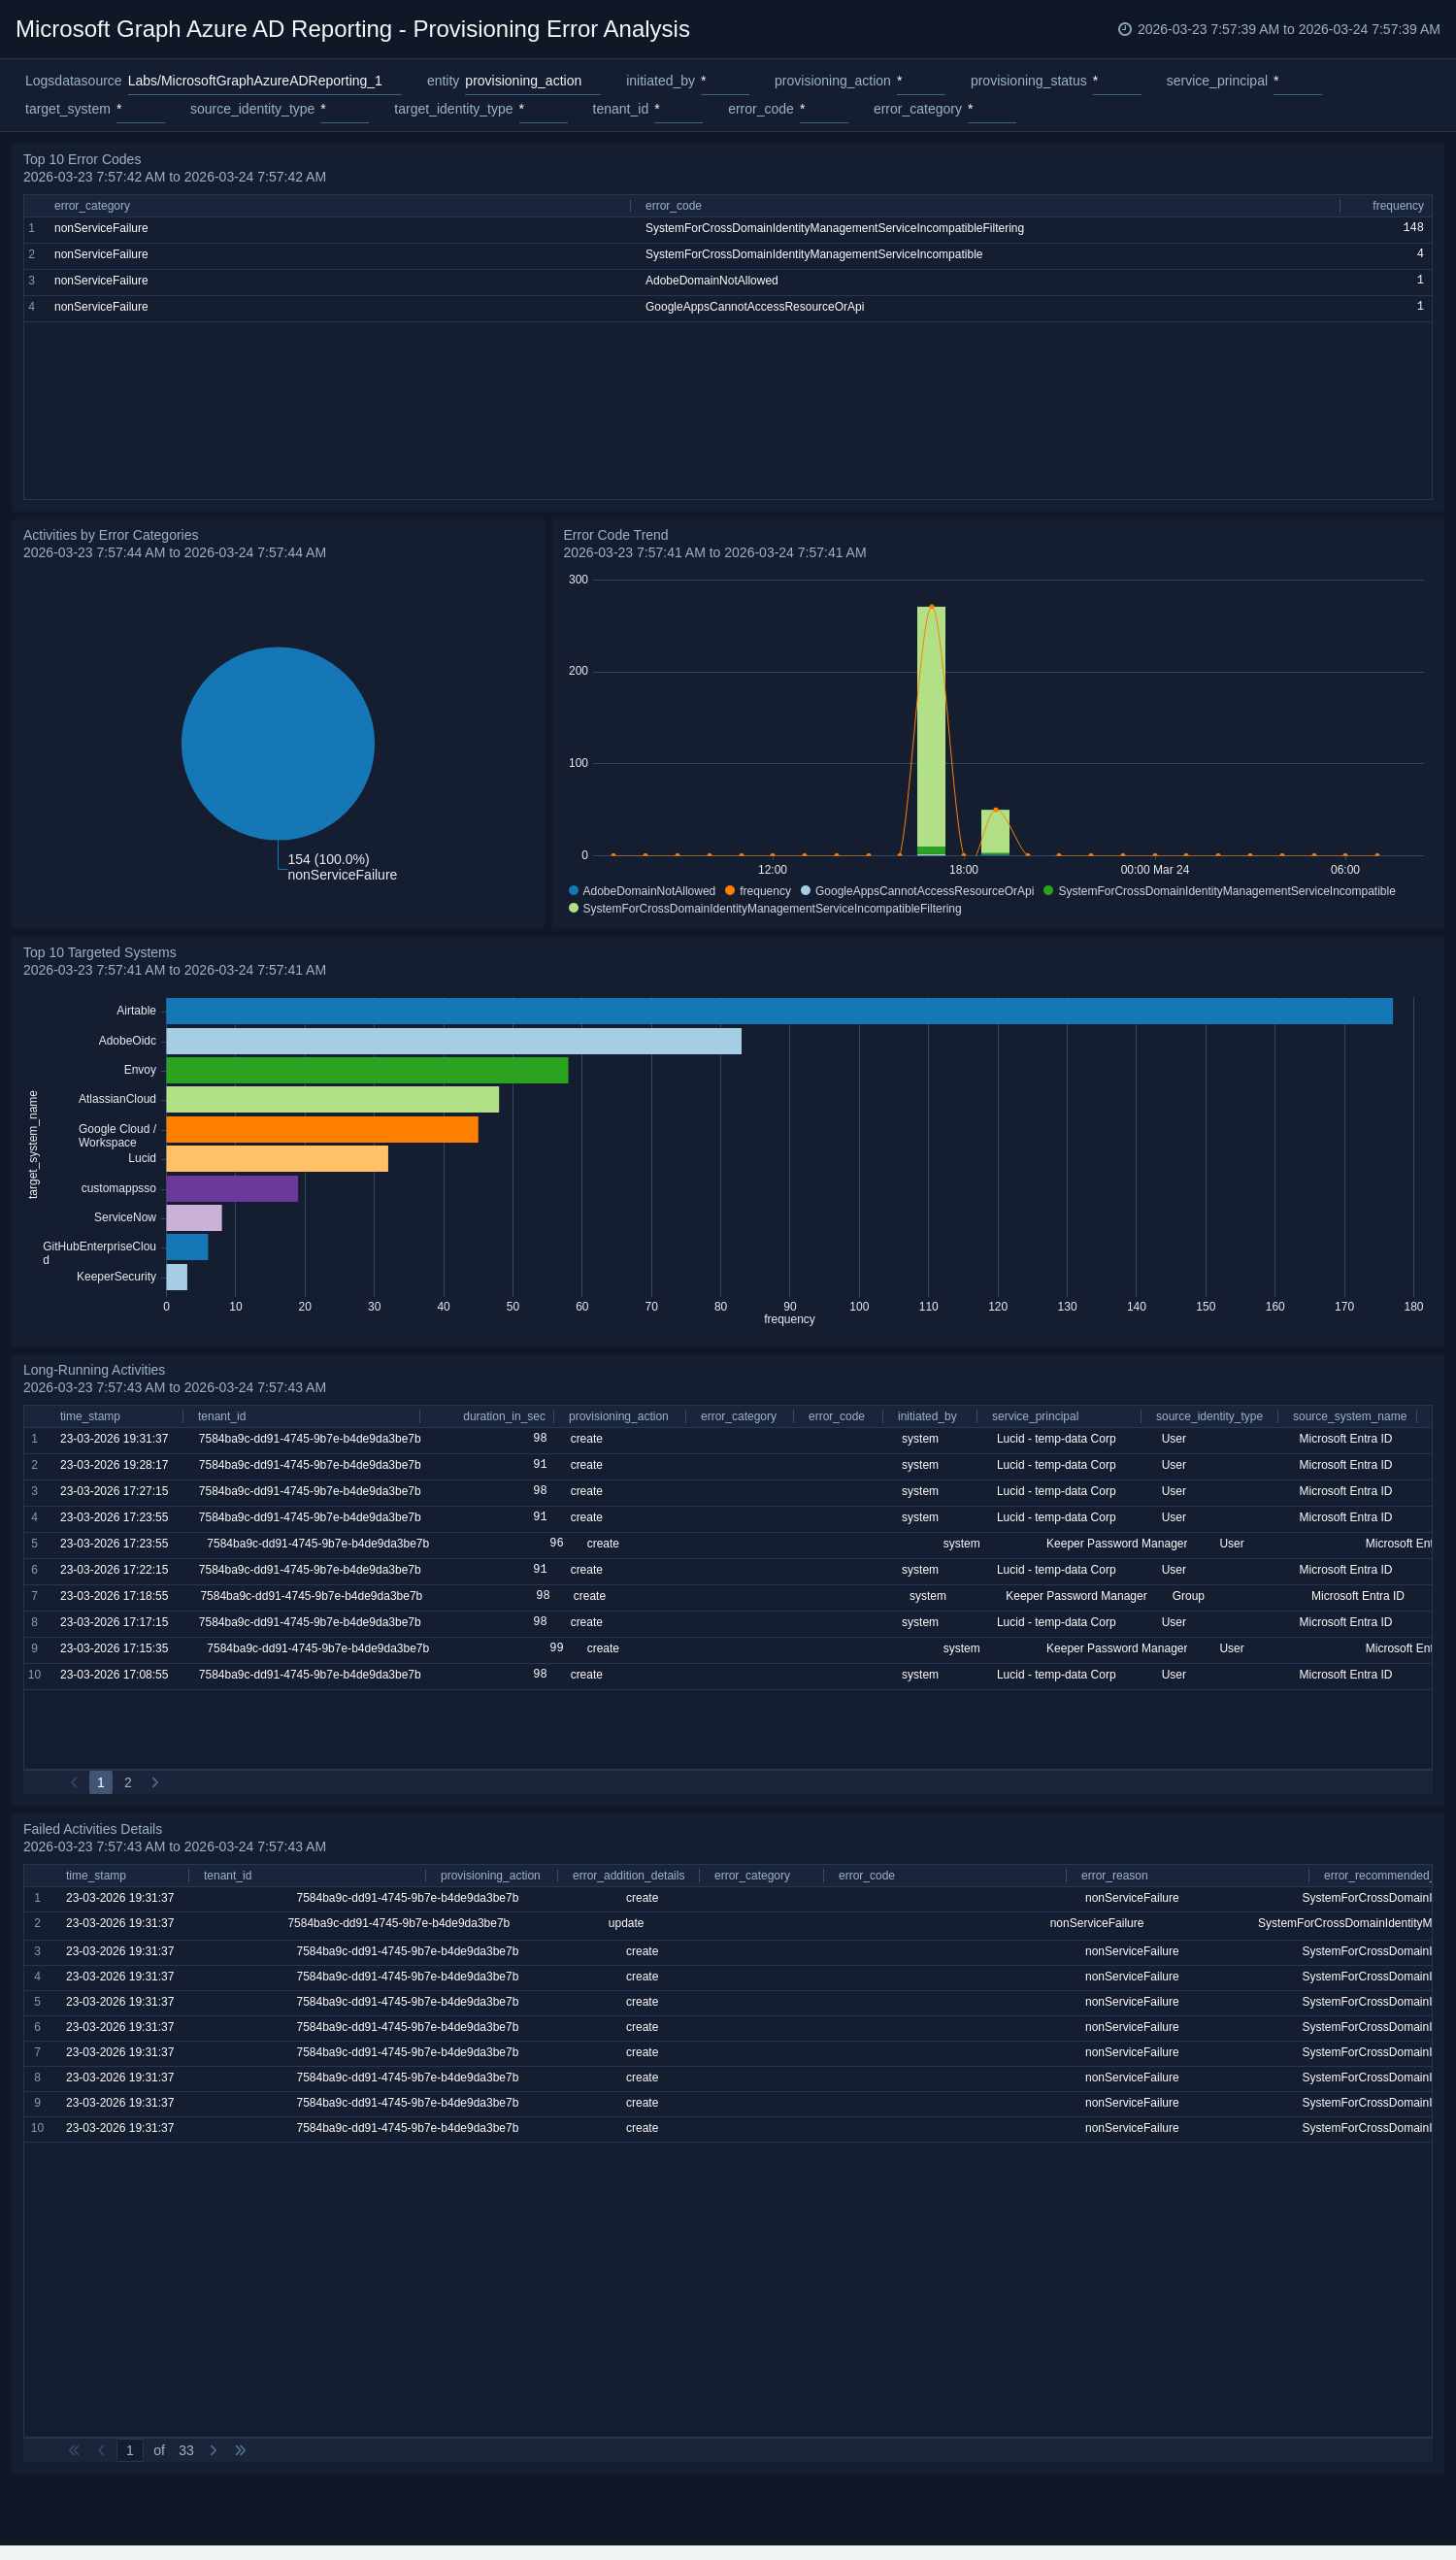
Create monitors for Microsoft Graph Azure AD Reporting app
From your App Catalog:
- From the Sumo Logic navigation, select App Catalog.
- In the Search Apps field, search for and then select your app.
- Make sure the app is installed.
- Navigate to What's Included tab and scroll down to the Monitors section.
- Click Create next to the pre-configured monitors. In the create monitors window, adjust the trigger conditions and notifications settings based on your requirements.
- Scroll down to Monitor Details.
- Under Location click on New Folder.
note
By default, monitor will be saved in the root folder. So to make the maintenance easier, create a new folder in the location of your choice.
- Enter Folder Name. Folder Description is optional.
tip
Using app version in the folder name will be helpful to determine the versioning for future updates.
- Click Create. Once the folder is created, click on Save.
Microsoft Graph Azure AD Reporting Alerts
| Name | Description | Alert Condition |
|---|---|---|
Microsoft Graph Azure AD Reporting - Abnormal Multi-Device Sign-In Activity Detected | This alert is triggered when abnormal sign-in patterns occur, such as a single user account being used across multiple unique devices within a short timeframe. This indicates potential credential misuse, session hijacking, or unauthorized access from multiple threat actors. | Count > 5 |
Microsoft Graph Azure AD Reporting - Audit Activity Detected from Embargoed Geo Location | This alert is triggered when administrative or audit activity originates from embargoed or restricted regions, indicating potential policy violations or suspicious access. | Count > 0 |
Microsoft Graph Azure AD Reporting - High-Risk Sign-In Detected | This alert is triggered when a user sign-in is flagged as high risk by Azure AD Identity Protection, indicating possible credential compromise or unauthorized use. | Count > 0 |
Microsoft Graph Azure AD Reporting - Multiple Consecutive Failed Sign-Ins Detected | This alert is triggered when repeated failed sign-in attempts occur for a single user or account, indicating potential brute-force or credential guessing activity. | Count > 5 |
Microsoft Graph Azure AD Reporting - Repeated Failed Operations on Source System | This alert is triggered when multiple failed activities are performed from the same source, indicating potential misuse or misconfiguration that requires investigation. | Count > 5 |
Microsoft Graph Azure AD Reporting - Repeated Failed Operations on Target Resource | This alert is triggered when multiple failed activities are performed on the same target, indicating potential targeted attacks or repeated access issues. | Count > 5 |
Microsoft Graph Azure AD Reporting - Sign-In Attempt from Embargoed Location | This alert is triggered when a sign-in attempt originates from an embargoed or restricted region, indicating potential unauthorized access or policy violations. | Count > 0 |
Upgrade/Downgrade the Microsoft Graph Azure AD Reporting app (Optional)
To update the app, do the following:
Next-Gen App: To install or update the app, you must be an account administrator or a user with Manage Apps, Manage Monitors, Manage Fields, Manage Metric Rules, and Manage Collectors capabilities depending upon the different content types part of the app.
- Select App Catalog.
- In the Search Apps field, search for and then select your app.
Optionally, you can identify apps that can be upgraded in the Upgrade available section. - To upgrade the app, select Upgrade from the Manage dropdown.
- If the upgrade does not have any configuration or property changes, you will be redirected to the Preview & Done section.
- If the upgrade has any configuration or property changes, you will be redirected to the Setup Data page.
- In the Configure section of your respective app, complete the following fields.
- Field Name. If you already have collectors and sources set up, select the configured metadata field name (eg _sourcecategory) or specify other custom metadata (eg: _collector) along with its metadata Field Value.
- Click Next. You will be redirected to the Preview & Done section.
Post-update
Your upgraded app will be installed in the Installed Apps folder and dashboard panels will start to fill automatically.
See our Release Notes changelog for new updates in the app.
To revert the app to a previous version, do the following:
- Select App Catalog.
- In the Search Apps field, search for and then select your app.
- To version down the app, select Revert to < previous version of your app > from the Manage dropdown.
Uninstalling the Microsoft Graph Azure AD Reporting app (Optional)
To uninstall the app, do the following:
- Select App Catalog.
- In the 🔎 Search Apps field, run a search for your desired app, then select it.
- Click Uninstall.