Salesforce
The Sumo Logic app for Salesforce analyzes logs generated by Salesforce Event Monitoring, which provides insight into your Salesforce instance and Salesforce apps. This app allows you to monitor APEX and API overview, logins, report performance, setup audit activity, user activity, and user agents.
Salesforce generates event logs during non-peak hours, every 24 hours. This means that you may not see data fill your Dashboard Panels for at least 24 hours. If you do not see data in 48 hours, contact Salesforce customer support.
Log types
The Sumo Logic app for Salesforce uses Salesforce Event Log Files. The number of log types you receive depends on the Event Monitoring Edition that you sign up for.
For details, see the Salesforce Event Monitoring Quick Start Guide.
For the complete list of available events and fields, see Event Monitoring Event Types.
Sample log messages
{
   "EVENT_TYPE":"Report",
   "TIMESTAMP":"20171002172229.677",
   "REQUEST_ID":"423LBHidMGMvdMH5Tie2a-",
   "ORGANIZATION_ID":"00XT0000000ABmu",
   "USER_ID":"006X0000006TZhh",
   "RUN_TIME":"606",
   "CPU_TIME":"90",
   "CLIENT_IP":"38.99.50.98",
   "URI":"/00OE0000003MThb",
   "REQUEST_STATUS":"S",
   "DB_TOTAL_TIME":"475884875",
   "ENTITY_NAME":"",
   "DISPLAY_TYPE":"S",
   "RENDERING_TYPE":"W",
   "REPORT_ID":"00OE0000003MThb",
   "NUMBER_EXCEPTION_FILTERS":"0",
   "NUMBER_COLUMNS":"3",
   "SORT":"",
   "DB_BLOCKS":"65351",
   "DB_CPU_TIME":"430",
   "NUMBER_BUCKETS":"2",
   "TIMESTAMP_DERIVED":"2016-02-08T21:55:55.667Z",
   "USER_ID_DERIVED":"006X0000006TZhhIAG",
   "USER_ID_DERIVED_LOOKUP":"saad@acme.com",
   "URI_ID_DERIVED":"00OE0000003MThbMAG",
   "REPORT_ID_DERIVED":"00OE0000003MThbMAG",
   "REPORT_ID_DERIVED_LOOKUP":"g Current Q MQL(C) by LC"
}
Sample queries
_sourceCategory=salesforce EVENT_TYPE REPORT_ID_DERIVED Report
| json "EVENT_TYPE", "REPORT_ID_DERIVED", "REPORT_ID_DERIVED_LOOKUP", "REQUEST_STATUS" as event_type, report_id, report_name, request_status nodrop
| where event_type matches "Report"

| if (request_status matches "S", "Success", if (request_status matches "F", "Failed", if (request_status matches "R", "Redirect", if (request_status matches "N", "Not Found", if (request_status matches "U", "Uninitialized", if (request_status matches "A", "Authorization Error", "Unknown")))))) as request_status

// global filters
| where if ("{{request_status}}" = "*", true, request_status matches "{{request_status}}")

| where !isEmpty(report_id) and !isEmpty(report_name)
| count as count by report_id, report_name
| sort by count, report_id, report_name asc
Prerequisites
Before you begin setting up log collection, review the required prerequisites and process overview described in the following sections. Installing the Sumo Logic App for Salesforce requires the following:
- Your Salesforce subscription must include the Salesforce Event Monitoring add-on, which is required to obtain all of the data presented in the app dashboards. The add-on enables access to all event types in the Salesforce EventLogFile, the LoginEvent object, Transaction Security, and the Event Monitoring Analytics App. For more information, see Get Started with Event Monitoring and Enable Event Monitoring.
- You will need a user with the permissions API Enabled and View Event Log Files (or View All Data). For assistance, you may need to contact your Salesforce administrator. (See Salesforce Configuration for steps.)
- Your system must run JRE 7. If you do not meet this requirement, you may see an exception similar to:
Exception in thread "main" java.lang.UnsupportedClassVersionError: \
com/sumologic/content/tools/apiclient/SumoJanus : Unsupported major.minor version 51.0- If your Salesforce instance does not support Transport Layer Security (TLS) v1.0, you will be required to run JRE 8 instead of JRE 7. Specifically, if you see an error message like this when the script queries data:
TLS 1.0 has been disabled in this organization.
Please use TLS 1.1 or higher when connecting to Salesforce using https. - You may do the configuration steps on a system with a web browser for authentication via OAuth2, and then move the configuration folder to your production system. Or if your production system has a web browser, all steps may be done on that system.
Collection configuration and app installation
Depending on the set up collection method, you can configure and install the app in three ways:
- Create a new collector and install the app. Create a new Sumo Logic Cloud-to-Cloud (C2C) source under a new Sumo Logic Collector and later install the app, or
- Use an existing collector and install the app. Create a new Sumo Logic Cloud-to-Cloud (C2C) source under an existing Sumo Logic Collector and later install the app, or
- Use existing source and install the app. Use your existing configured Sumo Logic Cloud-to-Cloud (C2C) source and install the app.
Use the Cloud-to-Cloud Integration for Salesforce to create the source and use the same source category while installing the app. By following these steps, you can ensure that your Salesforce app is properly integrated and configured to collect and analyze your Salesforce data.
Create a new collector and install the app
To set up collection and install the app, do the following:
Next-Gen App: To install or update the app, you must be an account administrator or a user with Manage Apps, Manage Monitors, Manage Fields, Manage Metric Rules, and Manage Collectors capabilities depending upon the different content types part of the app.
- Select App Catalog.
- In the 🔎 Search Apps field, run a search for your desired app, then select it.
- Click Install App.
note
Sometimes this button says Add Integration.
- In the Set Up Collection section of your respective app, select Create a new Collector.
- Collector Name. Enter a Name to display the Source in the Sumo Logic web application. The description is optional.
- Timezone. Set the default time zone when it is not extracted from the log timestamp. Time zone settings on Sources override a Collector time zone setting.
- (Optional) Metadata. Click the +Add Metadata link to add a custom log Metadata Fields. Define the fields you want to associate, each metadata field needs a name (key) and value.
 A green circle with a checkmark is shown when the field exists and is enabled in the Fields table schema.
 An orange triangle with an exclamation point is shown when the field doesn't exist, or is disabled in the Fields table schema. In this case, you'll see an option to automatically add or enable the nonexistent fields to the Fields table schema. If a field is sent to Sumo Logic but isn’t present or enabled in the schema, it’s ignored and marked as Dropped.
- Click Next.
- Configure the source as specified in the
Infobox above, ensuring all required fields are included. - In the Configure section of your respective app, complete the following fields.
- Field Name. If you already have collectors and sources set up, select the configured metadata field name (eg _sourcecategory) or specify other custom metadata (eg: _collector) along with its metadata Field Value.
- Click Next. You will be redirected to the Preview & Done section.
Post-installation
Once your app is installed, it will appear in your Installed Apps folder, and dashboard panels will start to fill automatically.
Each panel slowly fills with data matching the time range query received since the panel was created. Results will not immediately be available but will be updated with full graphs and charts over time.
Use an existing collector and install the app
To set up the source in the existing collector and install the app, do the following:
Next-Gen App: To install or update the app, you must be an account administrator or a user with Manage Apps, Manage Monitors, Manage Fields, Manage Metric Rules, and Manage Collectors capabilities depending upon the different content types part of the app.
- Select App Catalog.
- In the 🔎 Search Apps field, run a search for your desired app, then select it.
- Click Install App.
note
Sometimes this button says Add Integration.
- In the Set Up Collection section of your respective app, select Use an existing Collector.
- From the Select Collector dropdown, select the collector that you want to set up your source with and click Next.
- Configure the source as specified in the
Infobox above, ensuring all required fields are included. - In the Configure section of your respective app, complete the following fields.
- Field Name. If you already have collectors and sources set up, select the configured metadata field name (eg _sourcecategory) or specify other custom metadata (eg: _collector) along with its metadata Field Value.
- Click Next. You will be redirected to the Preview & Done section.
Post-installation
Once your app is installed, it will appear in your Installed Apps folder, and dashboard panels will start to fill automatically.
Each panel slowly fills with data matching the time range query received since the panel was created. Results will not immediately be available but will be updated with full graphs and charts over time.
Use an existing source and install the app
To skip collection and only install the app, do the following:
Next-Gen App: To install or update the app, you must be an account administrator or a user with Manage Apps, Manage Monitors, Manage Fields, Manage Metric Rules, and Manage Collectors capabilities depending upon the different content types part of the app.
- Select App Catalog.
- In the 🔎 Search Apps field, run a search for your desired app, then select it.
- Click Install App.
note
Sometimes this button says Add Integration.
- In the Set Up Collection section of your respective app, select Skip this step and use existing source and click Next.
- In the Configure section of your respective app, complete the following fields.
- Field Name. If you already have collectors and sources set up, select the configured metadata field name (eg _sourcecategory) or specify other custom metadata (eg: _collector) along with its metadata Field Value.
- Click Next. You will be redirected to the Preview & Done section.
Post-installation
Once your app is installed, it will appear in your Installed Apps folder, and dashboard panels will start to fill automatically.
Each panel slowly fills with data matching the time range query received since the panel was created. Results will not immediately be available but will be updated with full graphs and charts over time.
Viewing Salesforce dashboards
All dashboards have a set of filters that you can apply to the entire dashboard. Use these filters to drill down and examine the data to a granular level.
- You can change the time range for a dashboard or panel by selecting a predefined interval from a drop-down list, choosing a recently used time range, or specifying custom dates and times. Learn more.
- You can use template variables to drill down and examine the data on a granular level. For more information, see Filtering Dashboards with Template Variables.
- Most Next-Gen apps allow you to provide the scope at the installation time and are comprised of a key (
_sourceCategoryby default) and a default value for this key. Based on your input, the app dashboards will be parameterized with a dashboard variable, allowing you to change the dataset queried by all panels. This eliminates the need to create multiple copies of the same dashboard with different queries.
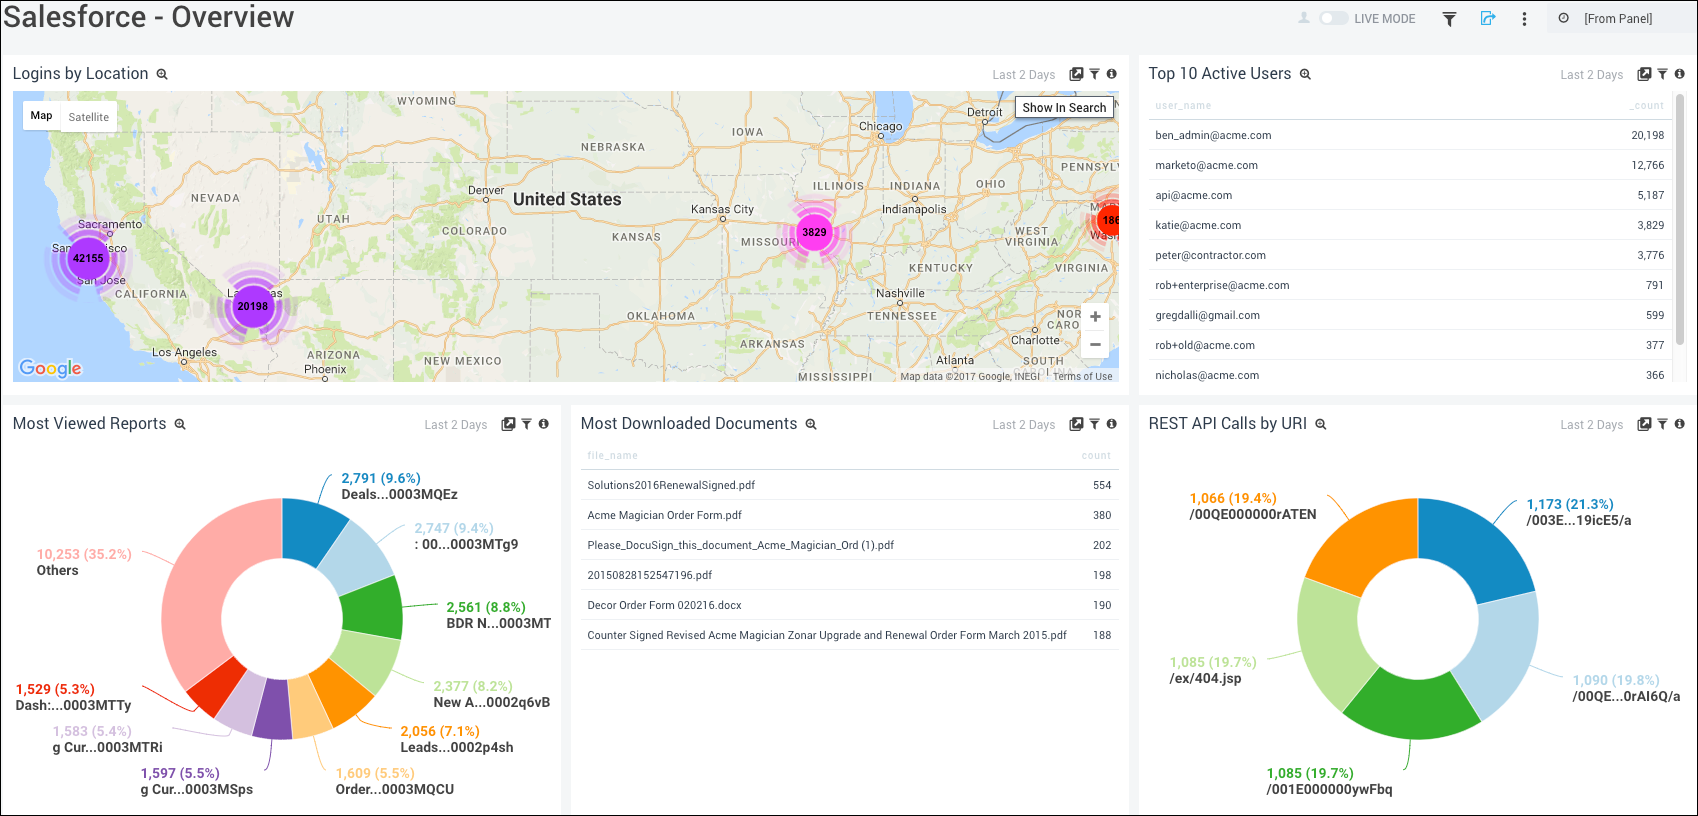
Overview
The Salesforce - Overview dashboard provides a high-level summary of user activity within your Salesforce environment. It helps teams monitor overall platform usage and quickly identify unusual behavior.
The Total Activities widget shows the overall volume of events, while Activities by Event Type and Top 10 Event Types highlight the most common actions performed. The Activities Over Time by Event Type panel helps track trends and detect spikes or anomalies. The Recent Activities section provides visibility into the latest events for quick investigation and response.
Together, these widgets offer clear visibility into Salesforce activity to support monitoring and security efforts.
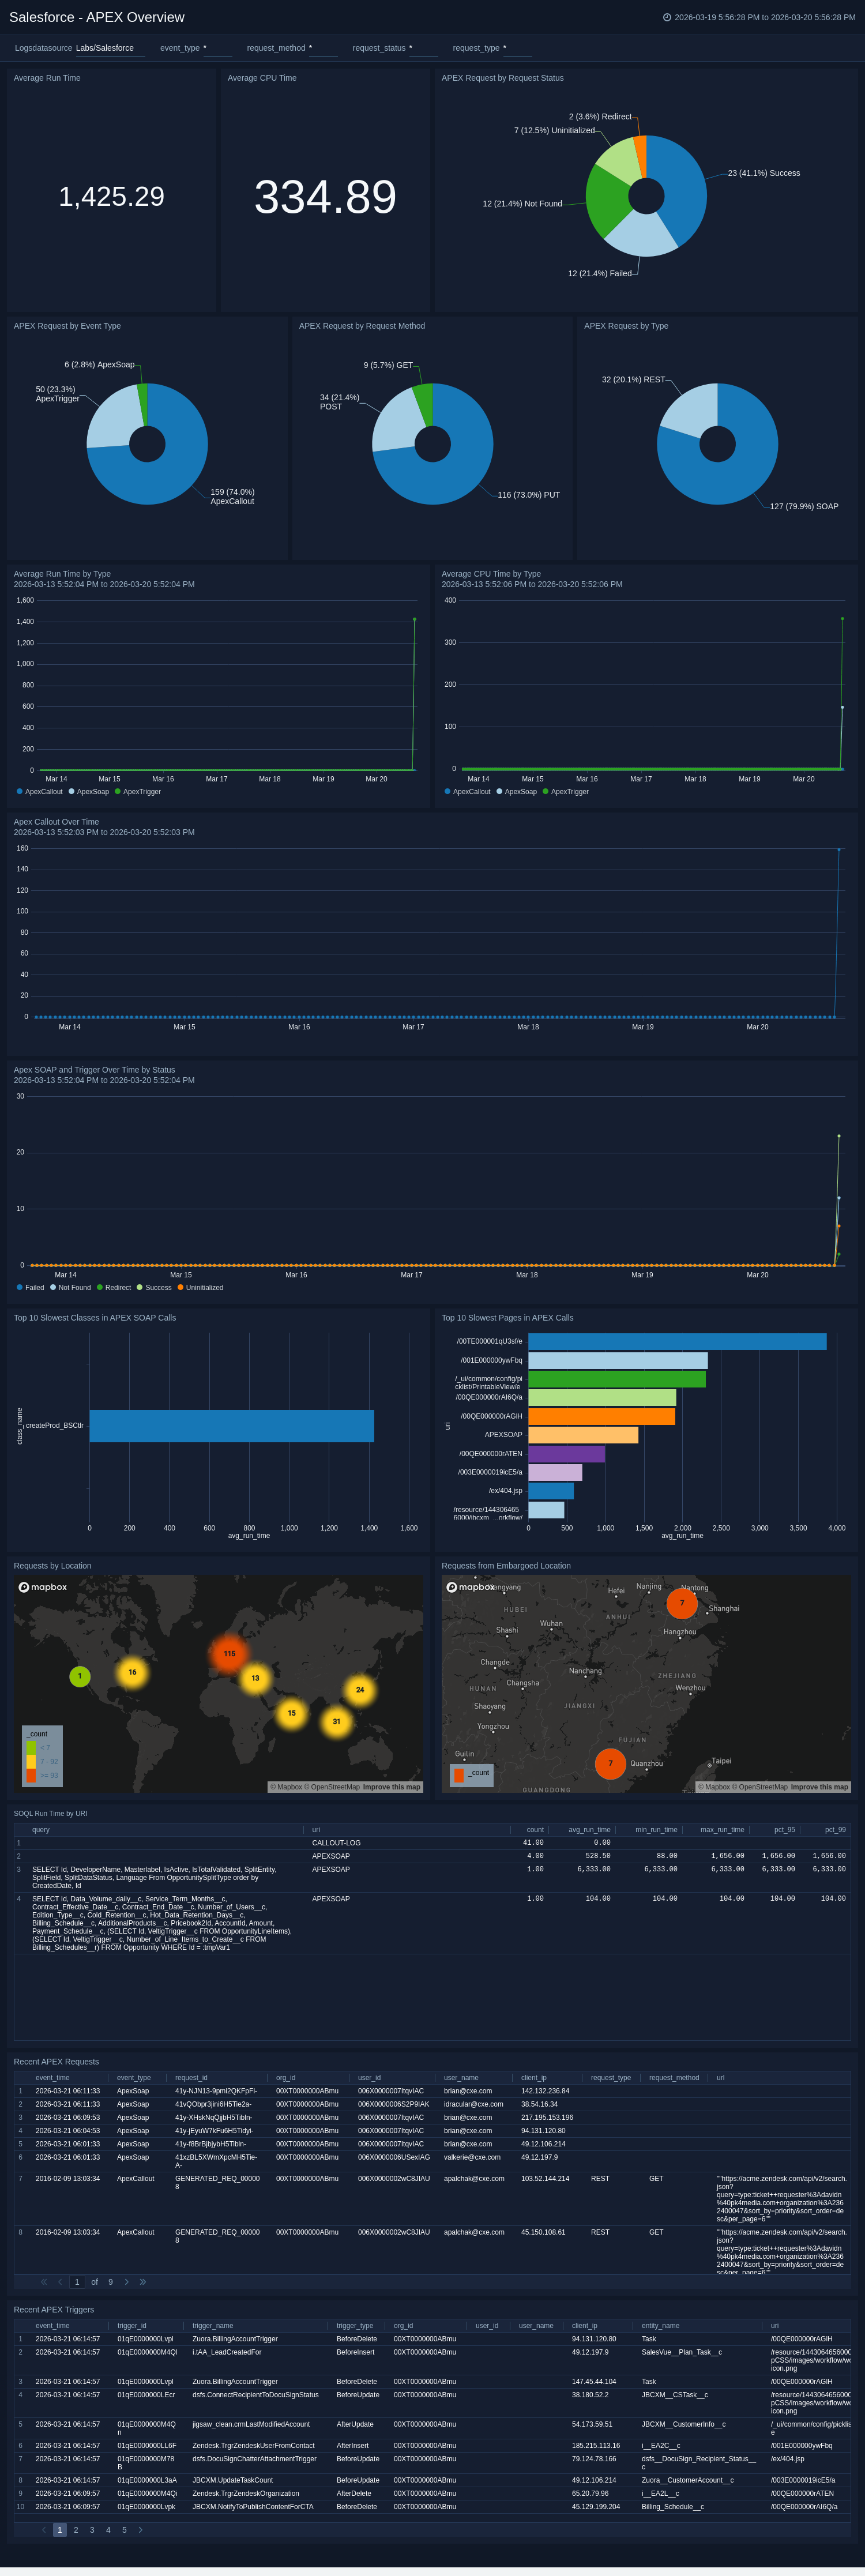
APEX Overview
The Salesforce – APEX Overview dashboard provides comprehensive visibility into Apex activity, performance, and request patterns within your Salesforce environment. It helps teams monitor execution health, detect performance bottlenecks, and identify potentially risky or abnormal behavior.
The dashboard highlights key performance metrics such as Average Run Time and Average CPU Time, offering insight into overall Apex execution efficiency. The APEX Requests by Status, Request Type, and API Type panels break down request distribution, helping you understand how Apex services are being accessed and whether failures or unusual patterns are occurring.
Trend widgets such as Average Run Time by Type and Average CPU Time by Type allow you to monitor performance fluctuations over time and quickly detect spikes that may indicate inefficient code or excessive resource consumption. Additional panels showcasing Apex Callout Over Time, SOAP and Trigger Over Time, and Top Classes/Pages in Apex Calls provide deeper insight into system usage and heavily utilized components.
Geolocation views, including Requests by Location and Requests from Embargoed Locations, help identify potentially suspicious access patterns based on geographic origin. Detailed tables of Recent Apex Executions and Trigger Activity enable quick investigation and troubleshooting.
Together, these insights support proactive performance monitoring, security analysis, and operational optimization of Salesforce Apex activity.
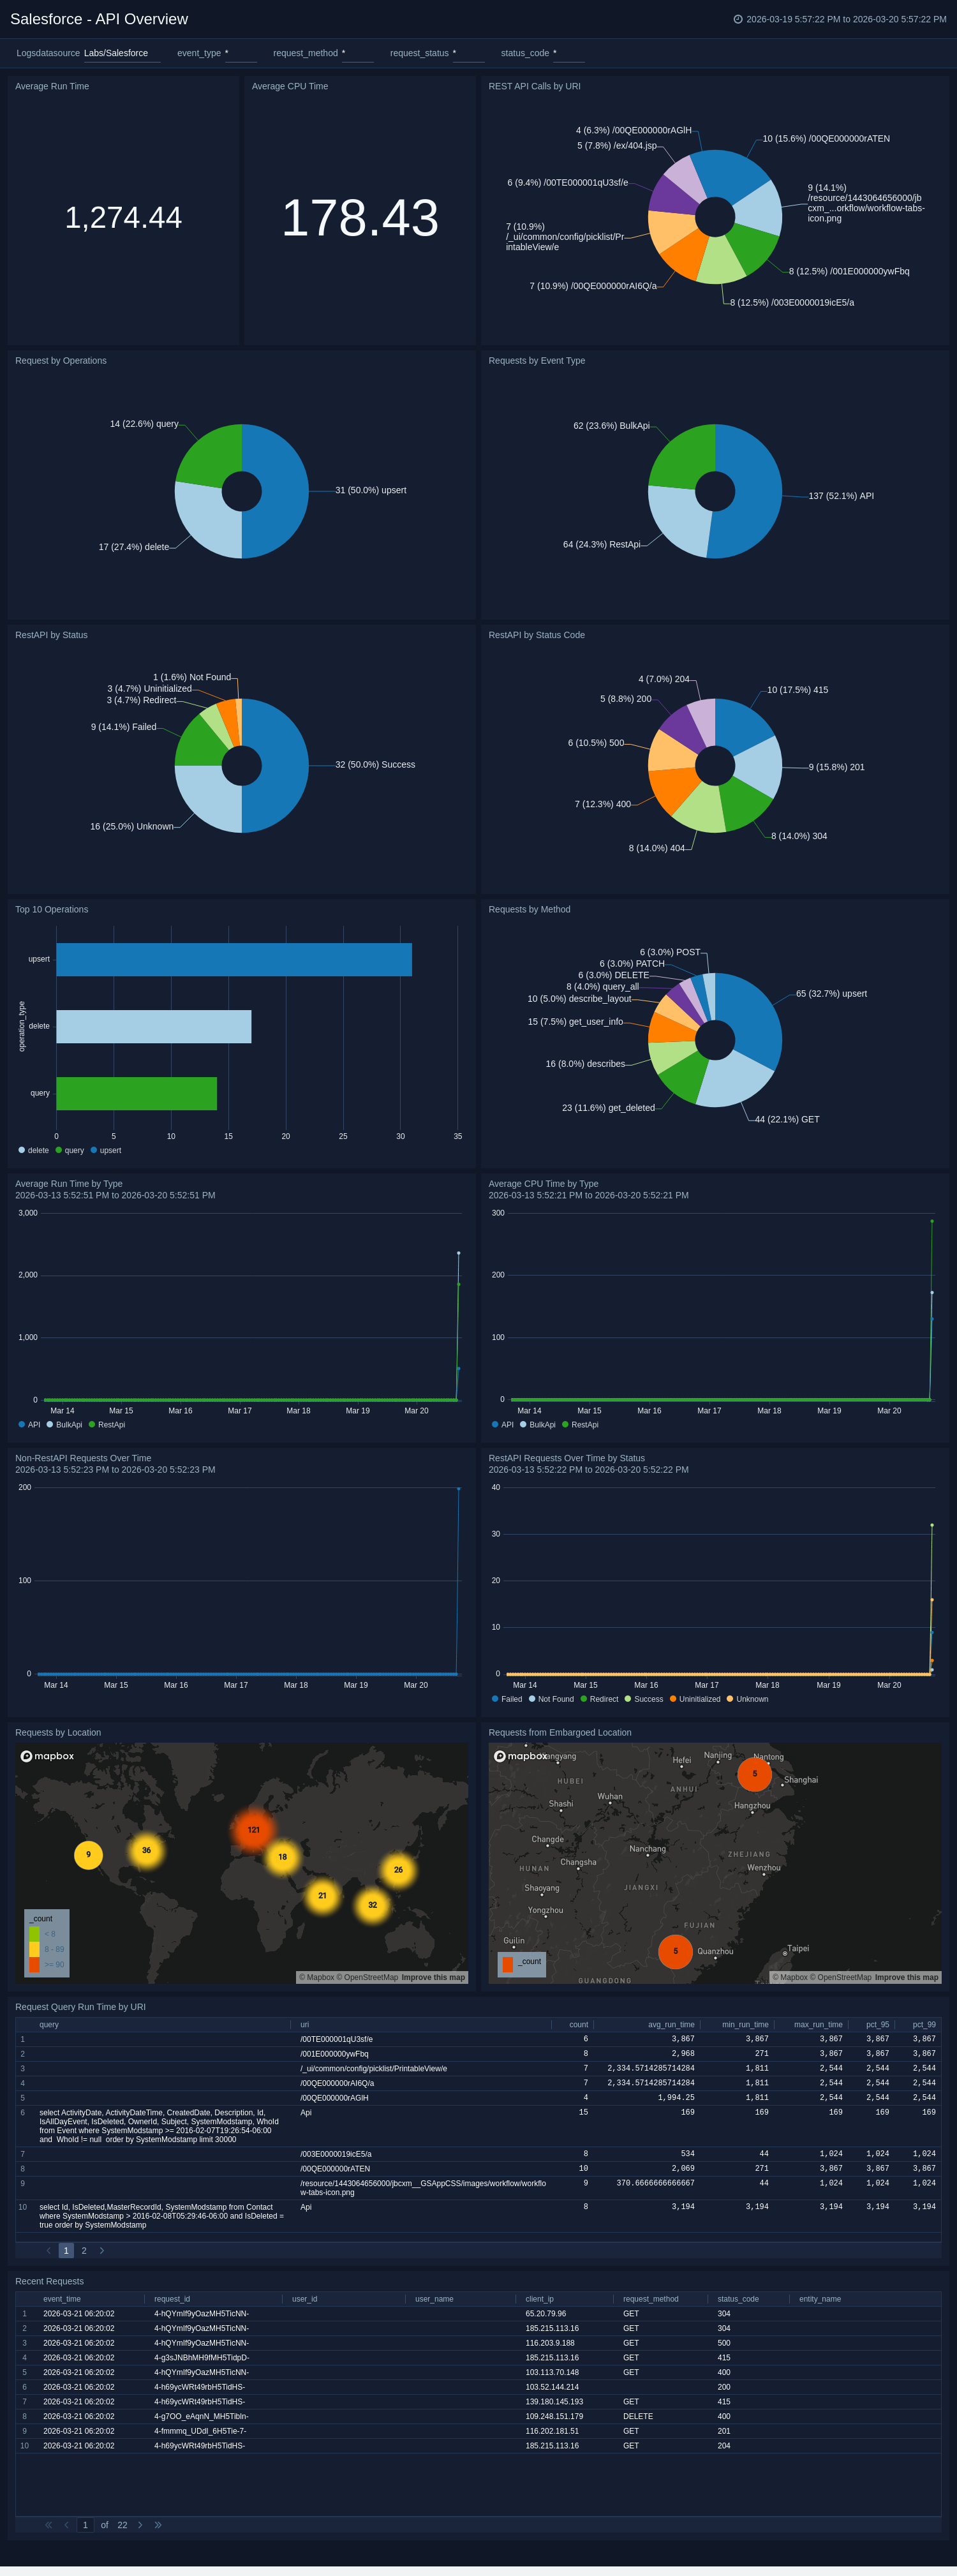
API Overview
The Salesforce – API Overview dashboard provides end-to-end visibility into API activity, performance, and request patterns across your Salesforce environment. It helps monitor API usage, detect failures, and identify unusual access behavior.
Key metrics such as Average Run Time and Average CPU Time offer insight into overall API performance. Panels displaying Requests by Operation, Event Type, Method, and URI help you understand how APIs are being utilized. The Status and Status Code breakdowns highlight success and error rates, enabling quick identification of failed or problematic requests.
Trend charts track API activity and performance over time, while geolocation panels such as Requests by Location and Requests from Embargoed Locations help detect potentially suspicious access patterns. Detailed request logs support faster investigation and troubleshooting.
Together, these insights strengthen API monitoring, performance optimization, and security oversight within Salesforce.
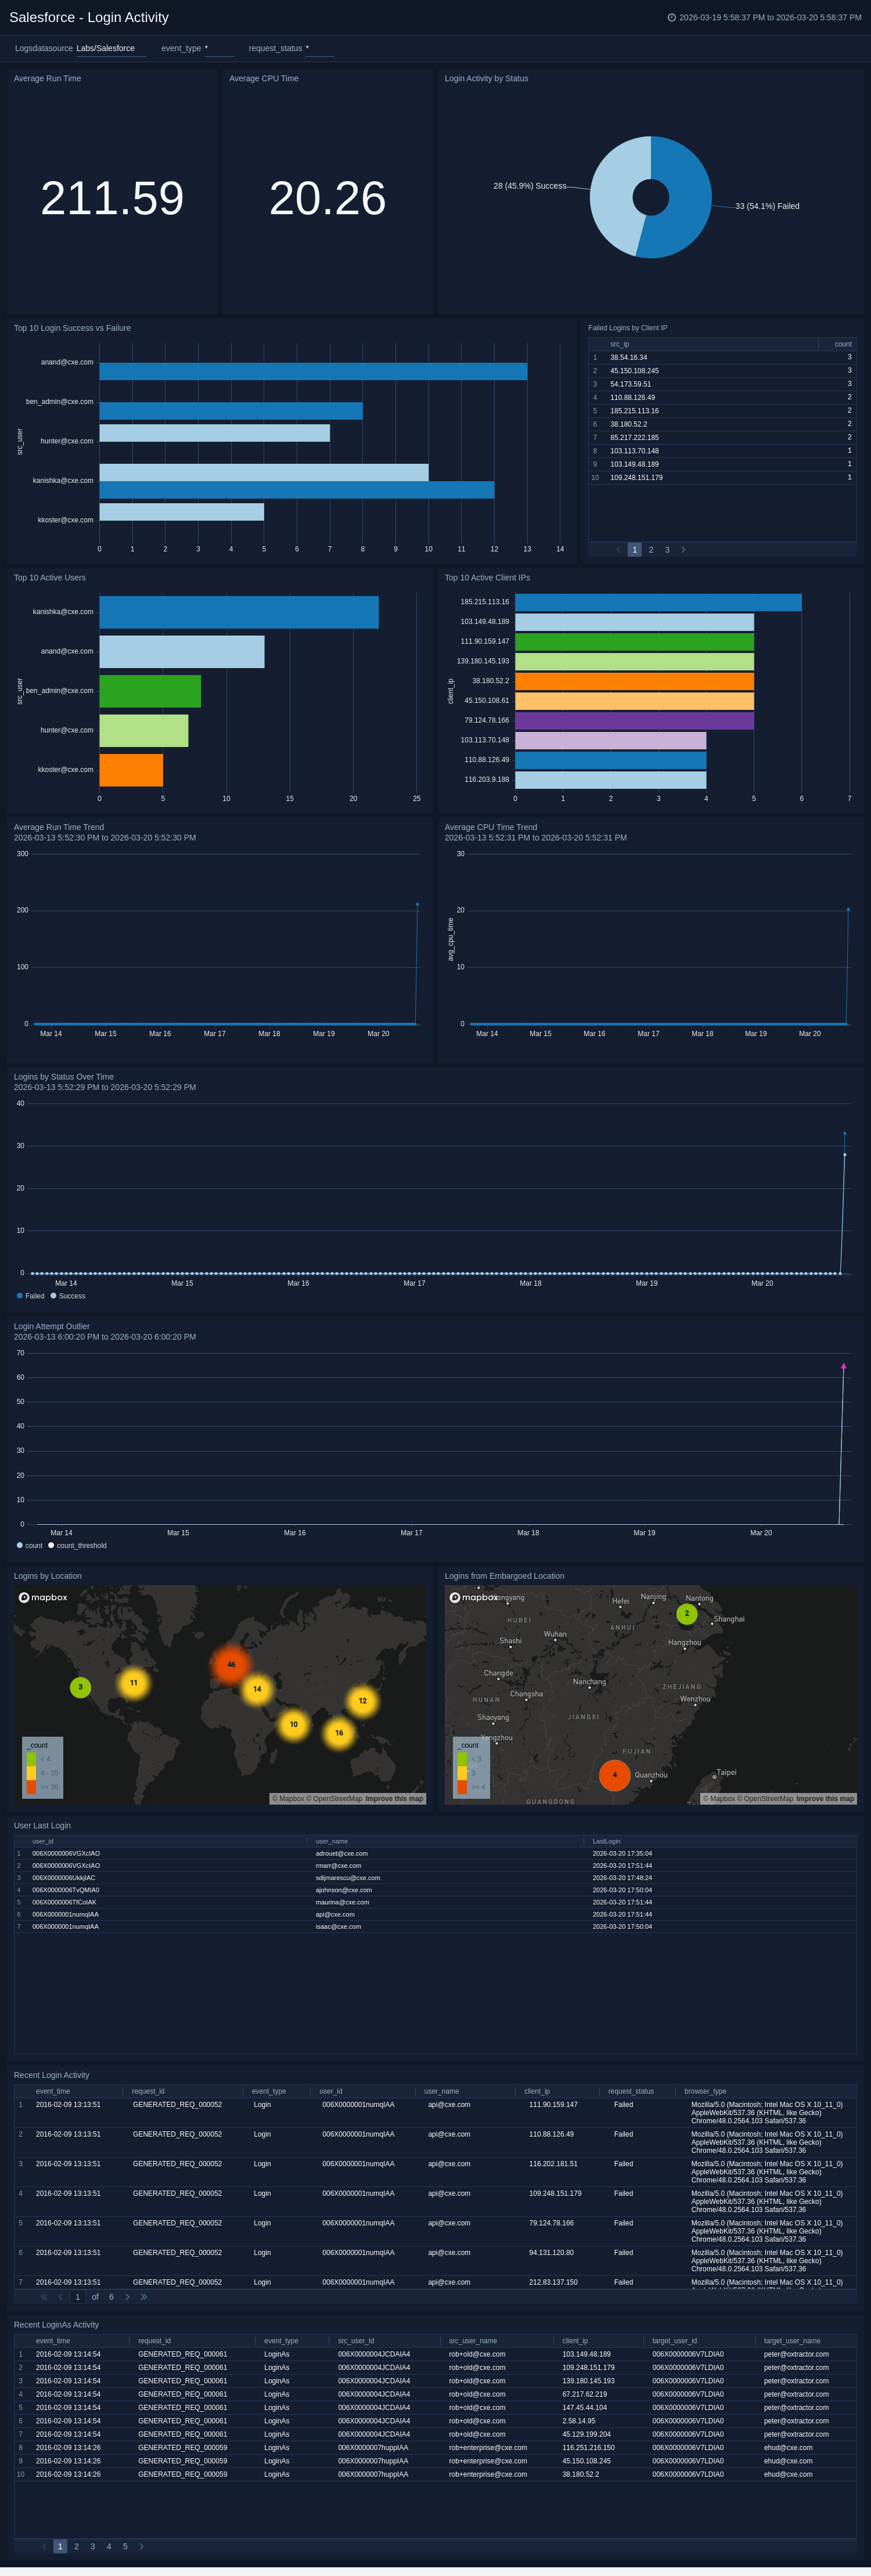
Login Activity
The Salesforce – Login Activity dashboard provides comprehensive visibility into user authentication activity across your Salesforce environment. It helps monitor login behavior, detect suspicious access attempts, and identify potential security risks.
Key metrics such as Average Run Time and Average CPU Time provide performance insights, while the Login Activity by Status panel highlights successful and failed login attempts. Widgets showcasing Top Login Sources, Top Active Users, and Top Failed Users help identify high-usage accounts and users experiencing repeated login failures.
Trend panels such as Logins by Status Over Time and Login Attempt Outliers enable teams to detect spikes, anomalies, or brute-force attempts. Geolocation views, including Logins by Location and Logins from Embargoed Locations, help uncover potentially risky access from unusual or restricted regions.
Detailed login logs at the bottom of the dashboard support quick investigation and response. Together, these insights strengthen authentication monitoring and enhance overall Salesforce security posture.
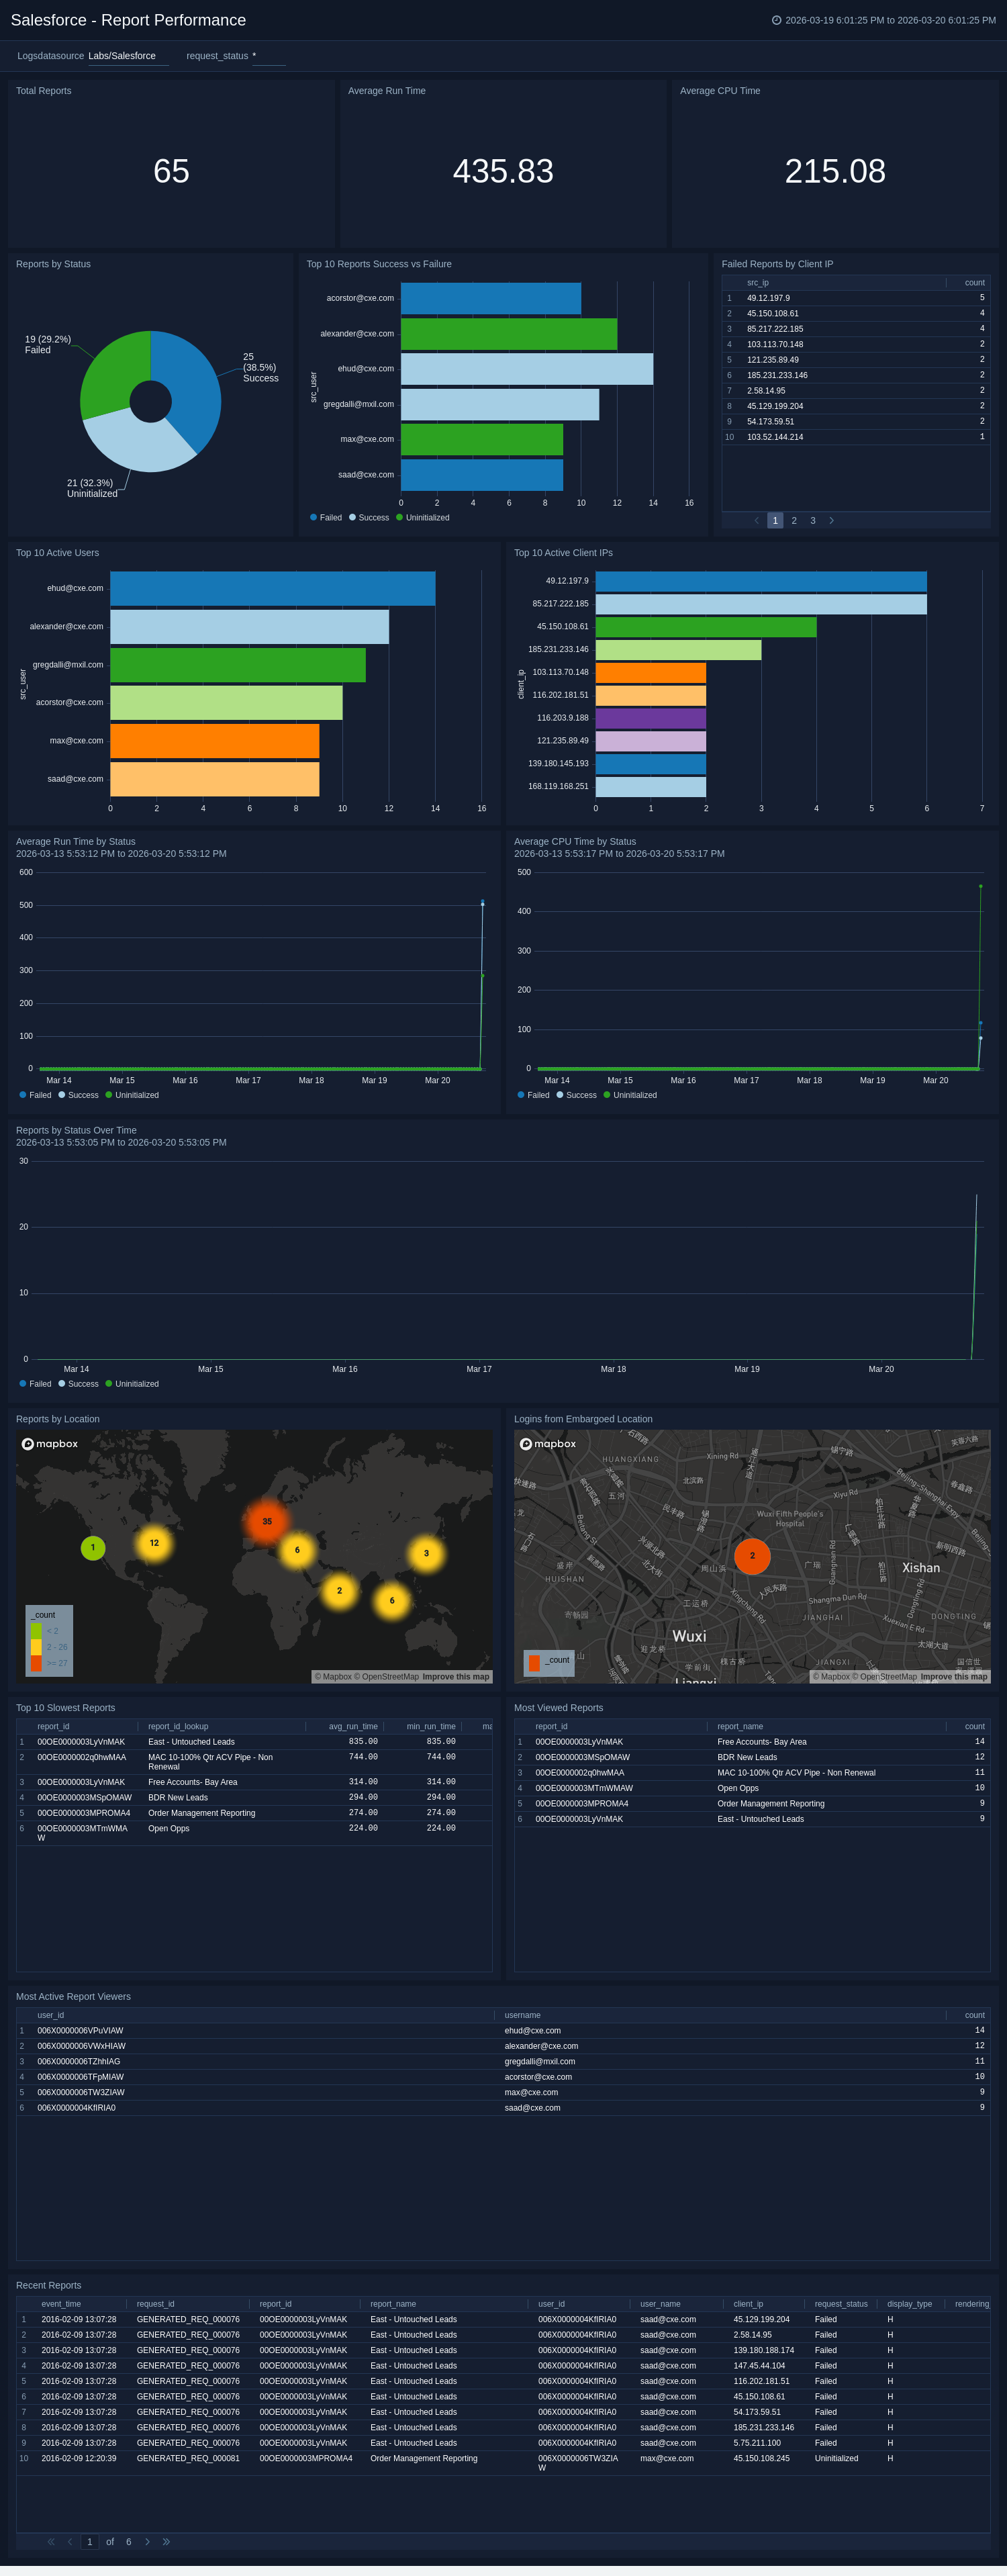
Report Performance
The Salesforce – Report Performance dashboard provides visibility into report execution activity, performance metrics, and usage patterns across your Salesforce environment. It helps teams monitor report efficiency, identify failures, and detect performance bottlenecks.
Key metrics such as Total Reports, Average Run Time, and Average CPU Time offer insight into overall report performance. The Reports by Status and Top 10 Reports (Success vs. Failure) panels highlight execution outcomes, enabling quick identification of failed or problematic reports. Insights into Top Active Users and Top Active Client IPs help track heavy usage and access patterns.
Trend charts for Run Time and CPU Time by Status and Reports by Status Over Time allow teams to detect spikes or anomalies. Geolocation views provide visibility into where report activity originates, including access from embargoed locations.
Detailed tables showcasing Top Slowest Reports, Most Viewed Reports, Active Report Viewers, and Recent Reports support deeper analysis and troubleshooting. Together, these insights help optimize report performance, improve user experience, and strengthen monitoring within Salesforce.
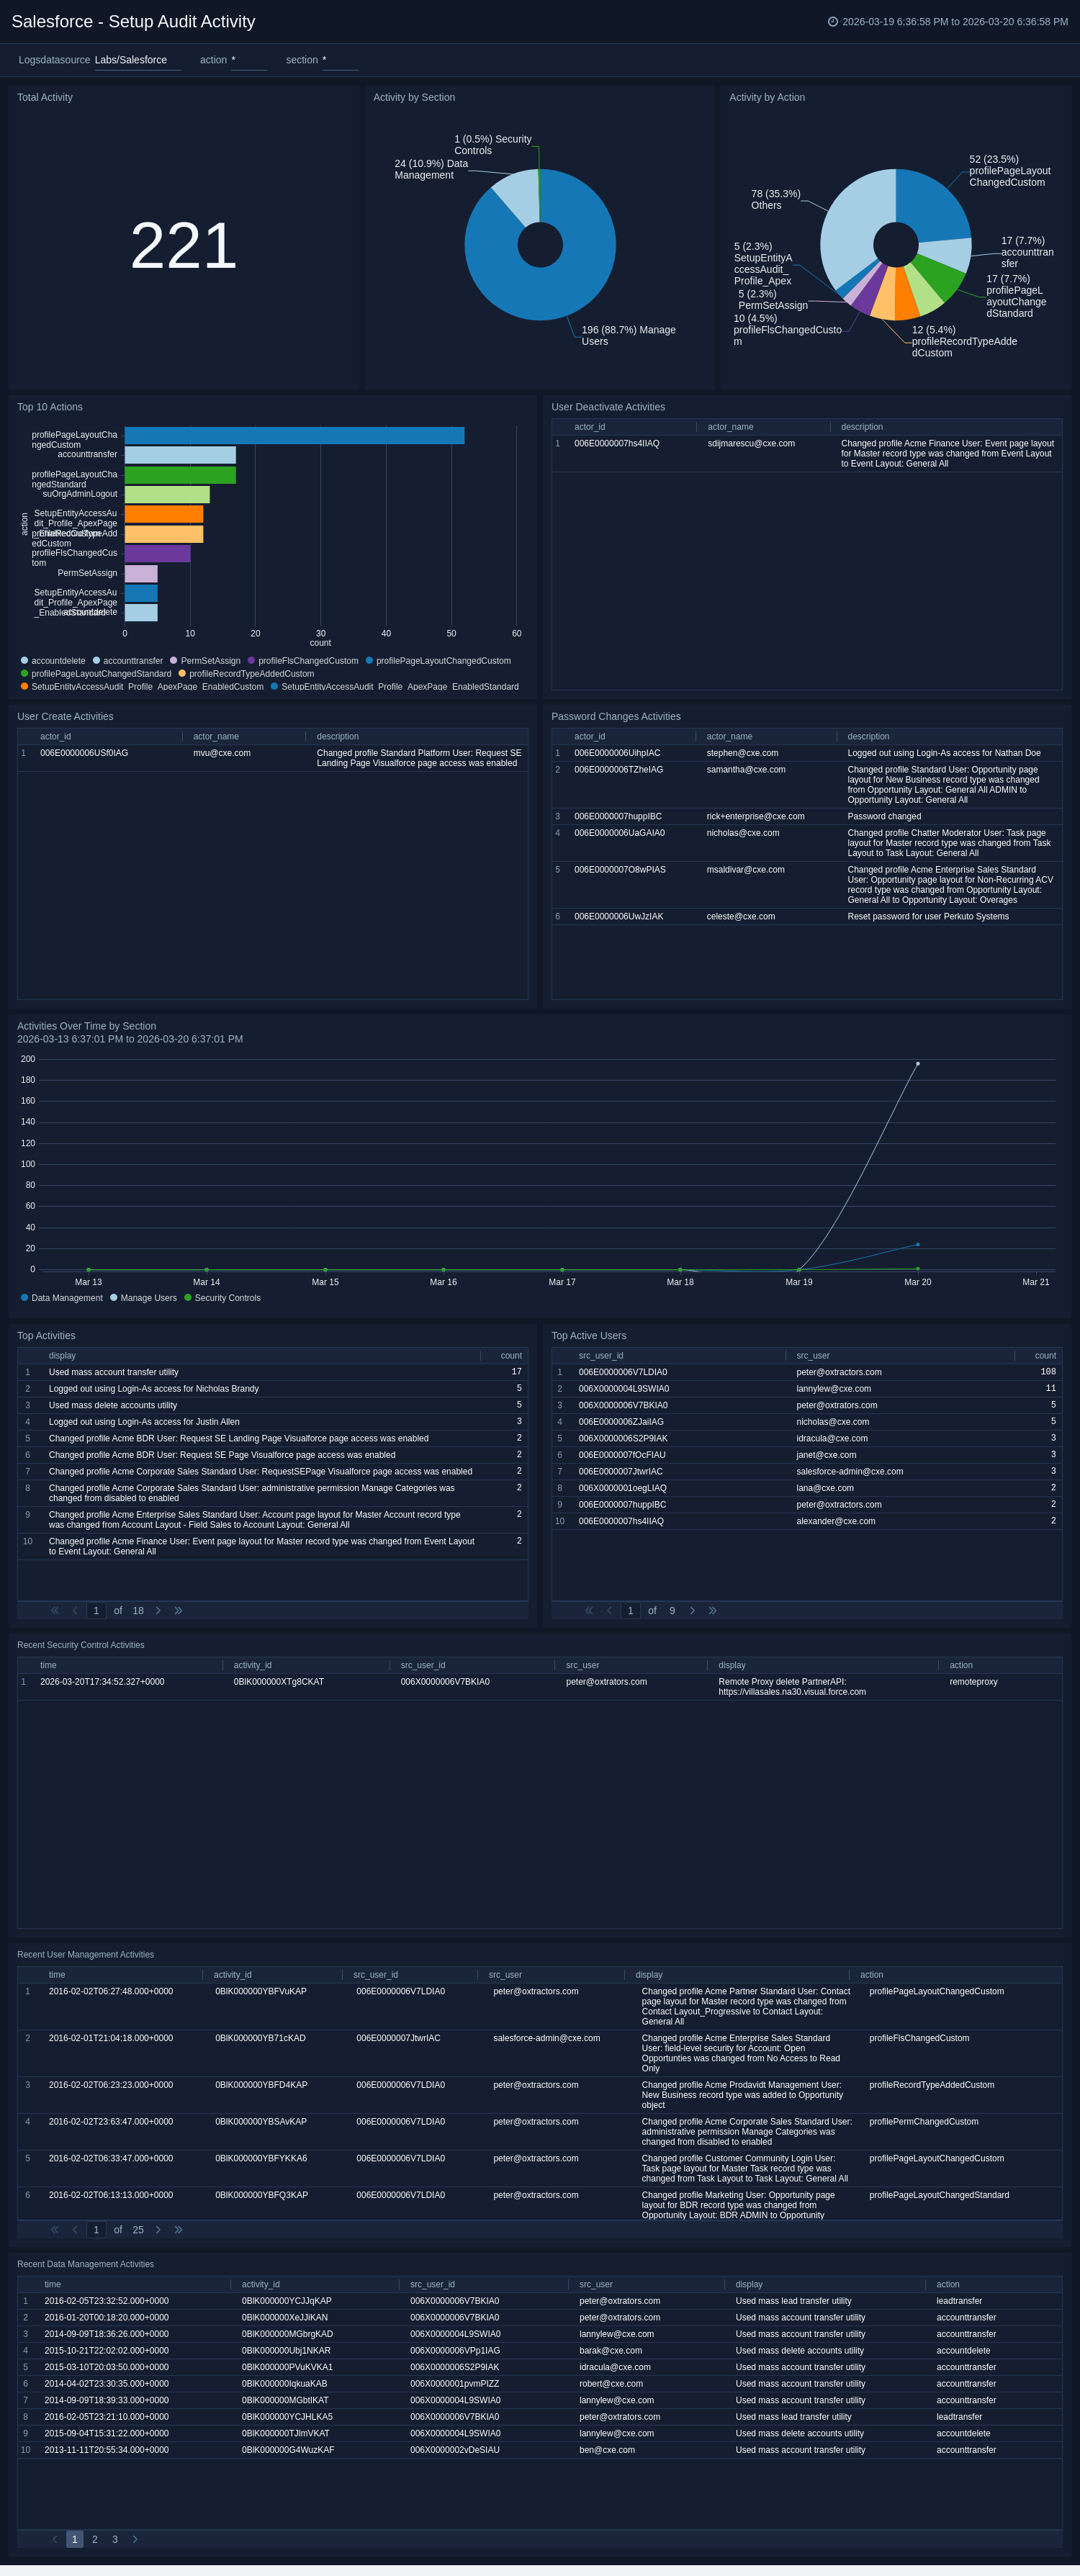
Setup Audit Activity
The Salesforce – Setup Audit Activity dashboard provides comprehensive visibility into administrative and configuration changes within your Salesforce environment. It helps security and compliance teams monitor system modifications, track sensitive changes, and detect potentially unauthorized administrative actions.
The Total Activity metric offers a snapshot of overall setup changes, while Activity by Section and Activity by Action break down modifications across areas such as user management, security controls, and data management. The Top 10 Actions and Top Active Users panels highlight the most frequent configuration changes and the users performing them.
Dedicated views for User Deactivation Activities, Password Change Activities, and User Create Activities provide focused insight into high-impact security events. Trend charts such as Activities Over Time by Section help detect spikes or unusual administrative behavior.
Detailed audit logs at the bottom of the dashboard support investigation, compliance reporting, and change tracking. Together, these insights strengthen governance, improve transparency, and enhance overall security monitoring within Salesforce.
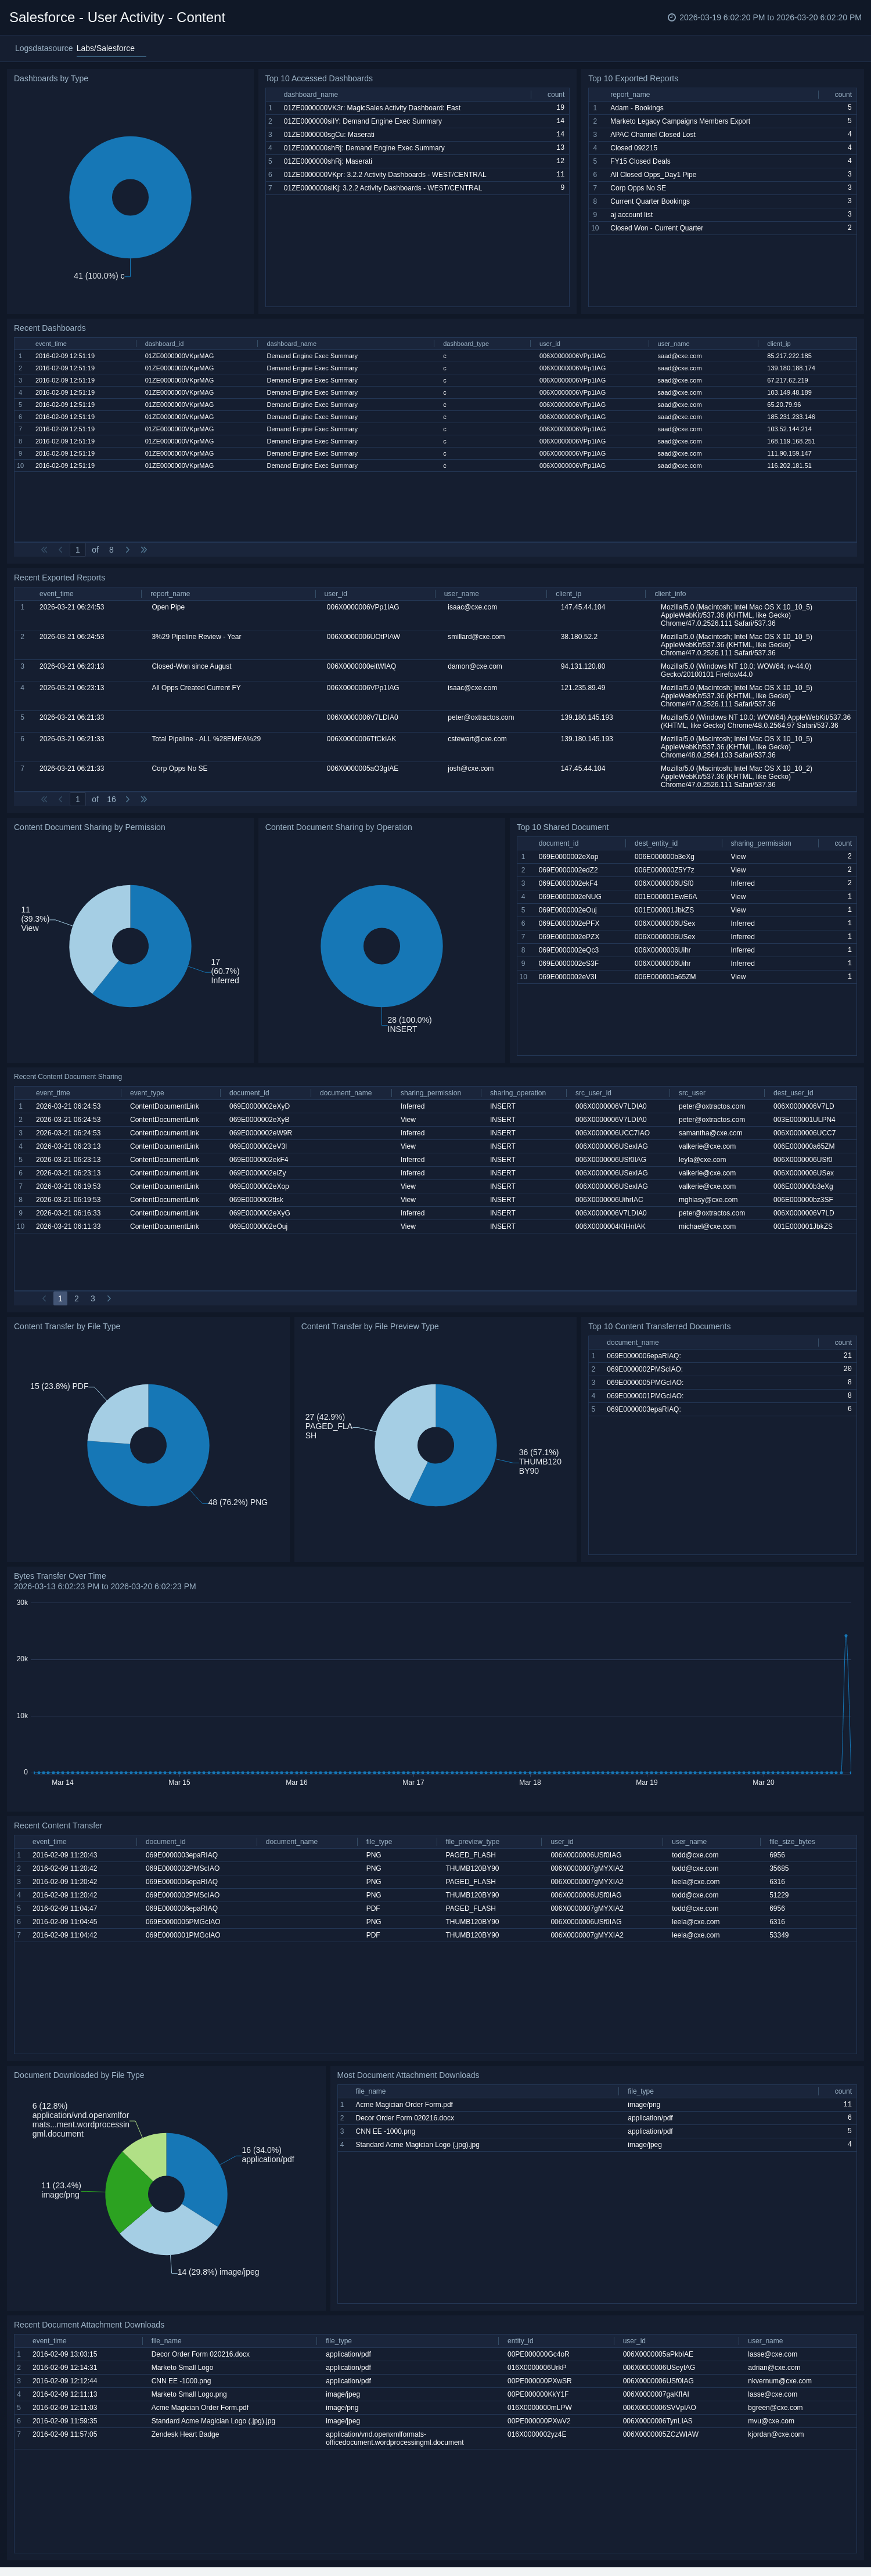
User Activity - Content
The Salesforce – User Activity - Content dashboard provides visibility into how dashboards, reports, and content documents are accessed, shared, and downloaded within your Salesforce environment. It helps monitor user engagement, track content usage patterns, and identify potential data exposure risks.
Panels such as Dashboards by Type, Top 10 Accessed Dashboards, and Top 10 Exported Reports highlight frequently viewed and exported content. Insights into Content Document Sharing by Permission and Operation help track how files are being shared and accessed across users.
The dashboard also includes visibility into Content Transfers by File Type, Top 10 Shared Documents, and Most Downloaded Documents, enabling teams to detect high-volume sharing or unusual file activity. Trend charts such as Bytes Transferred Over Time help identify spikes in data movement.
Detailed activity logs support investigation and auditing of recent dashboard views, exports, document sharing, and downloads. Together, these insights strengthen content governance, improve monitoring of sensitive data, and enhance overall security within Salesforce.
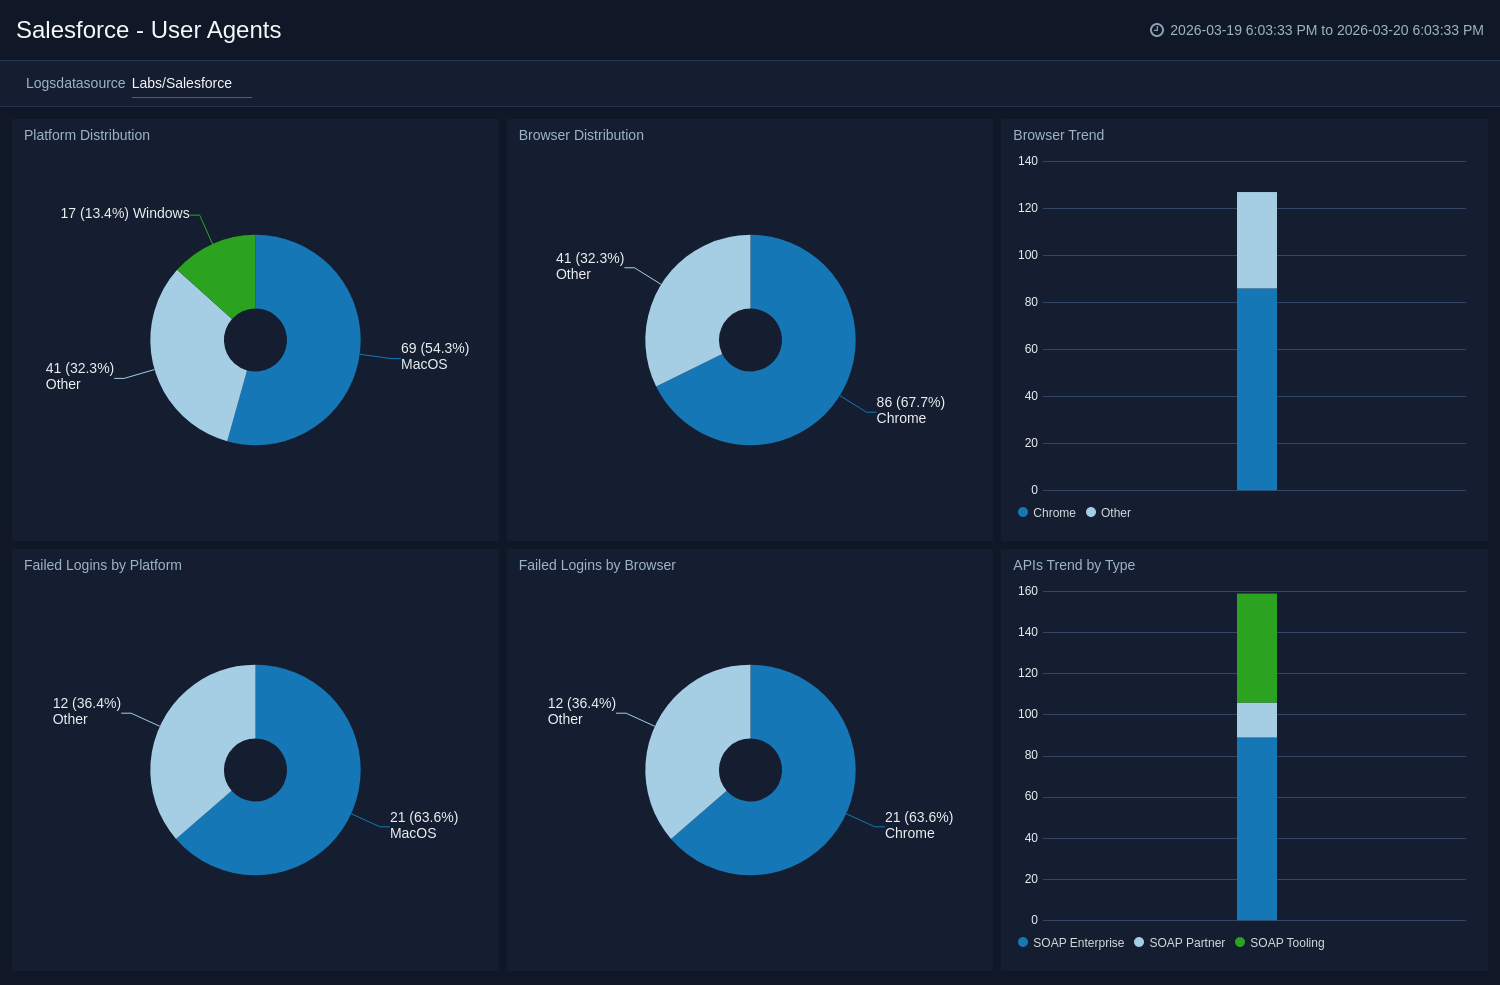
User Agents
The Salesforce – User Agents dashboard provides visibility into the platforms, browsers, and API types used to access your Salesforce environment. It helps monitor user access patterns, detect unusual login behavior, and identify potential security risks.
The Platform Distribution and Browser Distribution panels highlight the operating systems and browsers most commonly used to access Salesforce. The Browser Trend widget tracks browser usage over time, helping identify sudden changes or anomalies.
Dedicated panels for Failed Logins by Platform and Failed Logins by Browser help pinpoint authentication issues or suspicious activity tied to specific devices or browsers. Additionally, the APIs Trend by Type panel provides insight into SOAP API usage patterns, enabling monitoring of integration and automation activity.
Together, these insights support improved access monitoring, anomaly detection, and overall security visibility within Salesforce.
Create monitors for Salesforce app
From your App Catalog:
- From the Sumo Logic navigation, select App Catalog.
- In the Search Apps field, search for and then select your app.
- Make sure the app is installed.
- Navigate to What's Included tab and scroll down to the Monitors section.
- Click Create next to the pre-configured monitors. In the create monitors window, adjust the trigger conditions and notifications settings based on your requirements.
- Scroll down to Monitor Details.
- Under Location click on New Folder.
note
By default, monitor will be saved in the root folder. So to make the maintenance easier, create a new folder in the location of your choice.
- Enter Folder Name. Folder Description is optional.
tip
Using app version in the folder name will be helpful to determine the versioning for future updates.
- Click Create. Once the folder is created, click on Save.
Salesforce alerts
| Name | Description | Trigger Type (Critical / Warning / MissingData) | Alert Condition |
|---|---|---|---|
Activity Detected from Embargoed Locations | This alert triggers when an activity is detected from a location identified as high-risk. This helps you to monitor activity from unusual or restricted geographic locations, enhancing your ability to identify suspicious activity. | Critical | Count > 0 |
Consecutive Failed Login | This alert triggers when multiple consecutive failed login attempts are detected for a user account. This helps you monitor potential unauthorised access attempts and identify suspicious activity, such as brute-force attacks, enabling faster response to potential security threats. | Critical | Count > 0 |
Large Size File Transfer Activity Detected | This alert is triggered when a large volume of file transfer activity is detected(>500MB) over the network by the client. You can also adjust the "threshold" as per your requirement. | Critical | Count > 0 |
Upgrade/Downgrade the Salesforce app (Optional)
To update the app, do the following:
Next-Gen App: To install or update the app, you must be an account administrator or a user with Manage Apps, Manage Monitors, Manage Fields, Manage Metric Rules, and Manage Collectors capabilities depending upon the different content types part of the app.
- Select App Catalog.
- In the Search Apps field, search for and then select your app.
Optionally, you can identify apps that can be upgraded in the Upgrade available section. - To upgrade the app, select Upgrade from the Manage dropdown.
- If the upgrade does not have any configuration or property changes, you will be redirected to the Preview & Done section.
- If the upgrade has any configuration or property changes, you will be redirected to the Setup Data page.
- In the Configure section of your respective app, complete the following fields.
- Field Name. If you already have collectors and sources set up, select the configured metadata field name (eg _sourcecategory) or specify other custom metadata (eg: _collector) along with its metadata Field Value.
- Click Next. You will be redirected to the Preview & Done section.
Post-update
Your upgraded app will be installed in the Installed Apps folder and dashboard panels will start to fill automatically.
See our Release Notes changelog for new updates in the app.
To revert the app to a previous version, do the following:
- Select App Catalog.
- In the Search Apps field, search for and then select your app.
- To version down the app, select Revert to < previous version of your app > from the Manage dropdown.
Uninstalling the Salesforce app (Optional)
To uninstall the app, do the following:
- Select App Catalog.
- In the 🔎 Search Apps field, run a search for your desired app, then select it.
- Click Uninstall.