Slack

The Sumo Logic app for Slack provides monitoring and data analytics for Slack users, channels, and access logs for workspaces with free, standard, plus, and enterprise plans. The app is focused on public channels only.
Slack is a cloud-based suite of software tools and online services that enable secure collaboration across teams, departments, offices, and countries.
Log types
Slack logs are in JSON format. The Slack app utilizes the following log types:
Sumo Logic’s Slack collector enhances the logs by adding a few metadata fields, so the raw logs from Slack APIs might differ in format. The availability of all types of logs is determined by the Slack plans.
| Log Type | Free plan | Standard plan | Plus plan | Enterprise plan |
|---|---|---|---|---|
| User logs | ✓ | ✓ | ✓ | ✓ |
| Public Channel logs | ✓ | ✓ | ✓ | ✓ |
| Public Message logs | ✓ | ✓ | ✓ | ✓ |
| Access logs | ✓ | ✓ | ✓ | |
| Audit logs | ✓ |
Sample log messages
The following table provides sample log messages for the different log types.
User logs
{
  "id": "UM27LNGHK",
  "name": "test",
  "deleted": false,
  "real_name": "test",
  "tz": "Asia/Kolkata",
  "tz_label": "India Standard Time",
  "is_admin": false,
  "is_owner": false,
  "is_primary_owner": false,
  "is_restricted": false,
  "is_ultra_restricted": false,
  "is_bot": false,
  "is_app_user": false,
  "updated": 1565005724,
  "has_2fa": false,
  "teamName": "TestSlack",
  "email": "test@test.com",
  "billable": true,
  "logType": "UserLog"
}
Public Channel logs
{
  "channel_id": "CKN1D8010",
  "channel_name": "testchannel",
  "members": 2,
  "logType": "ChannelDetail",
  "teamName": "TestSlack"
}
Public Message logs
{
  "type": "message",
  "text": "Test",
  "files": [
    {
      "name": "Test",
      "fileType": "epub",
      "fileSize": 1258,
      "urlPrivate": "https://files.slack.com/files-pri/TJ...htyhomsdconmps",
      "urlPrivateDownload": "https://files.slack.com/files-pri/TJ...htyhomsdconmps",
      "permalink": "https://testslack-xj11408.slack.com/...htyhomsdconmps"
    }
  ],
  "attachments": [
    {
      "id": 16,
      "text": "Test",
      "author_name": "",
      "author_link": "",
      "pretext": "",
      "fallback": "Messages Sent"
    }
  ],
  "upload": true,
  "user": "e65b0bd8",
  "display_as_bot": false,
  "ts": "1566215592",
  "client_msg_id": "23849274-580c-4644-9478-8328e5716b89",
  "userName": "roy",
  "channelId": "e65b0d0e",
  "channelName": "app-for-slack",
  "teamName": "TestSlack",
  "logType": "ConversationLog"
}
Access logs
{
  "user_id": "e65b0476",
  "username": "dave",
  "date_first": 1566215532,
  "date_last": 1566215532,
  "count": 2,
  "ip": "213.14.129.105",
  "user_agent": "Mozilla/5.0 (Windows NT 6.2) AppleWebKit/537.36 (KHTML, like Gecko) Chrome/28.0.1467.0 Safari/537.36",
  "isp": "Inetbroadband",
  "country": "PA",
  "region": "EU",
  "teamName": "TestSlack",
  "logType": "AccessLog"
}
Audit logs
{
  "logType": "UserAuditLog",
  "id": "bdcb13e3-28a3-41f0-9ace-a20952def3a0",
  "date_create": 1566215192,
  "action": "user_created",
  "actor": {
    "type": "user",
    "user": {
      "id": "e65b0f5c",
      "name": "roy",
      "email": "aaron@demo.com"
    }
  },
  "entity": {
    "id": "e65b107e",
    "privacy": "public",
    "name": "BigCo ISP",
    "is_shared": false,
    "is_org_shared": false,
    "filetype": "text/csv",
    "title": "john",
    "is_distributed": false,
    "is_directory_approved": false,
    "scopes": [
      "identify",
      "bot",
      "incoming-webhook",
      "channels:read",
      "groups:read",
      "im:read",
      "users:read",
      "chat:write:bot",
      "users:read.email",
      "groups:write",
      "channels:write",
      "team:read",
      "chat:write:user"
    ]
  },
  "context": {
    "location": {
      "type": "workspace",
      "id": "e65b11aa",
      "name": "Docker",
      "domain": "Docker"
    },
    "ua": "Mozilla/5.0 (Windows NT 6.1; Win64; x64; rv:23.0) Gecko/20131011 Firefox/23.0",
    "ip_address": "120.188.0.246"
  },
  "details": {
    "id": "USLACKUSER",
    "name": "himanshu",
    "email": "kumar@demo.com"
  }
}
Sample queries
The sample query is from the Channel Summary panel of the Slack - Public Channels dashboard.
=Labs/slack
| join ("logType":"channelDetail"
| json "channel_name", "channel_id", "teamName", "members" as Channel, ChannelId, Workspace, Members
| withtime Members
| most_recent(Members_withtime) as Members by Channel, ChannelId, Workspace) as T1,("logType":"ConversationLog" | json "user", "userName", "type", "subtype", "ts", "text", "channelId", "channelName", "teamName" as ID, User, Type, SubType, Time, Text, ChannelId, Channel, Workspace nodrop
| count_distinct(Time) as Messages by ID, ChannelId, Workspace) as T2 on T1.ChannelId = T2.ChannelId and T1.Workspace=T2.Workspace
| T2_Workspace as Workspace | T2_ID as User| T1_Channel as Channel
| where Workspace matches {{Workspace}} and Channel matches {{Channel}}
| T1_Members as %"Team Members"
| fields Workspace, Channel, User, %"Team Members" ,T2_Messages
| where [subquery:"logType":"UserLog"
| json "id", "name", "deleted", "is_bot", "teamName" as User, Name, Deleted, Bot, Workspace nodrop
| where Bot matches "false" and !(Name matches "slackbot") and Deleted matches "false"
| withtime Name
| most_recent(Name_withtime) as Name by User, Workspace
| compose User, Workspace]
| sum(T2_Messages) as %"Total Messages", count_distinct(User) as %"Members Posted Messages" by Workspace, Channel, %"Team Members"
| fields Workspace, Channel, %"Team Members", %"Total Messages", %"Members Posted Messages"
| sort by %"Total Messages"
| limit 20
Collection configuration and app installation
Depending on the set up collection method, you can configure and install the app in three ways:
- Create a new collector and install the app. Create a new Sumo Logic Cloud-to-Cloud (C2C) source under a new Sumo Logic Collector and later install the app, or
- Use an existing collector and install the app. Create a new Sumo Logic Cloud-to-Cloud (C2C) source under an existing Sumo Logic Collector and later install the app, or
- Use existing source and install the app. Use your existing configured Sumo Logic Cloud-to-Cloud (C2C) source and install the app.
Use the Cloud-to-Cloud Integration for Slack to create the source and use the same source category while installing the app. By following these steps, you can ensure that your Slack app is properly integrated and configured to collect and analyze your Slack data.
Create a new collector and install the app
To set up collection and install the app, do the following:
Next-Gen App: To install or update the app, you must be an account administrator or a user with Manage Apps, Manage Monitors, Manage Fields, Manage Metric Rules, and Manage Collectors capabilities depending upon the different content types part of the app.
- Select App Catalog.
- In the 🔎 Search Apps field, run a search for your desired app, then select it.
- Click Install App.
note
Sometimes this button says Add Integration.
- In the Set Up Collection section of your respective app, select Create a new Collector.
- Collector Name. Enter a Name to display the Source in the Sumo Logic web application. The description is optional.
- Timezone. Set the default time zone when it is not extracted from the log timestamp. Time zone settings on Sources override a Collector time zone setting.
- (Optional) Metadata. Click the +Add Metadata link to add a custom log Metadata Fields. Define the fields you want to associate, each metadata field needs a name (key) and value.
 A green circle with a checkmark is shown when the field exists and is enabled in the Fields table schema.
 An orange triangle with an exclamation point is shown when the field doesn't exist, or is disabled in the Fields table schema. In this case, you'll see an option to automatically add or enable the nonexistent fields to the Fields table schema. If a field is sent to Sumo Logic but isn’t present or enabled in the schema, it’s ignored and marked as Dropped.
- Click Next.
- Configure the source as specified in the
Infobox above, ensuring all required fields are included. - In the Configure section of your respective app, complete the following fields.
- Field Name. If you already have collectors and sources set up, select the configured metadata field name (eg _sourcecategory) or specify other custom metadata (eg: _collector) along with its metadata Field Value.
- Click Next. You will be redirected to the Preview & Done section.
Post-installation
Once your app is installed, it will appear in your Installed Apps folder, and dashboard panels will start to fill automatically.
Each panel slowly fills with data matching the time range query received since the panel was created. Results will not immediately be available but will be updated with full graphs and charts over time.
Use an existing collector and install the app
To set up the source in the existing collector and install the app, do the following:
Next-Gen App: To install or update the app, you must be an account administrator or a user with Manage Apps, Manage Monitors, Manage Fields, Manage Metric Rules, and Manage Collectors capabilities depending upon the different content types part of the app.
- Select App Catalog.
- In the 🔎 Search Apps field, run a search for your desired app, then select it.
- Click Install App.
note
Sometimes this button says Add Integration.
- In the Set Up Collection section of your respective app, select Use an existing Collector.
- From the Select Collector dropdown, select the collector that you want to set up your source with and click Next.
- Configure the source as specified in the
Infobox above, ensuring all required fields are included. - In the Configure section of your respective app, complete the following fields.
- Field Name. If you already have collectors and sources set up, select the configured metadata field name (eg _sourcecategory) or specify other custom metadata (eg: _collector) along with its metadata Field Value.
- Click Next. You will be redirected to the Preview & Done section.
Post-installation
Once your app is installed, it will appear in your Installed Apps folder, and dashboard panels will start to fill automatically.
Each panel slowly fills with data matching the time range query received since the panel was created. Results will not immediately be available but will be updated with full graphs and charts over time.
Use an existing source and install the app
To skip collection and only install the app, do the following:
Next-Gen App: To install or update the app, you must be an account administrator or a user with Manage Apps, Manage Monitors, Manage Fields, Manage Metric Rules, and Manage Collectors capabilities depending upon the different content types part of the app.
- Select App Catalog.
- In the 🔎 Search Apps field, run a search for your desired app, then select it.
- Click Install App.
note
Sometimes this button says Add Integration.
- In the Set Up Collection section of your respective app, select Skip this step and use existing source and click Next.
- In the Configure section of your respective app, complete the following fields.
- Field Name. If you already have collectors and sources set up, select the configured metadata field name (eg _sourcecategory) or specify other custom metadata (eg: _collector) along with its metadata Field Value.
- Click Next. You will be redirected to the Preview & Done section.
Post-installation
Once your app is installed, it will appear in your Installed Apps folder, and dashboard panels will start to fill automatically.
Each panel slowly fills with data matching the time range query received since the panel was created. Results will not immediately be available but will be updated with full graphs and charts over time.
Viewing Slack dashboards
All dashboards have a set of filters that you can apply to the entire dashboard. Use these filters to drill down and examine the data to a granular level.
- You can change the time range for a dashboard or panel by selecting a predefined interval from a drop-down list, choosing a recently used time range, or specifying custom dates and times. Learn more.
- You can use template variables to drill down and examine the data on a granular level. For more information, see Filtering Dashboards with Template Variables.
- Most Next-Gen apps allow you to provide the scope at the installation time and are comprised of a key (
_sourceCategoryby default) and a default value for this key. Based on your input, the app dashboards will be parameterized with a dashboard variable, allowing you to change the dataset queried by all panels. This eliminates the need to create multiple copies of the same dashboard with different queries.
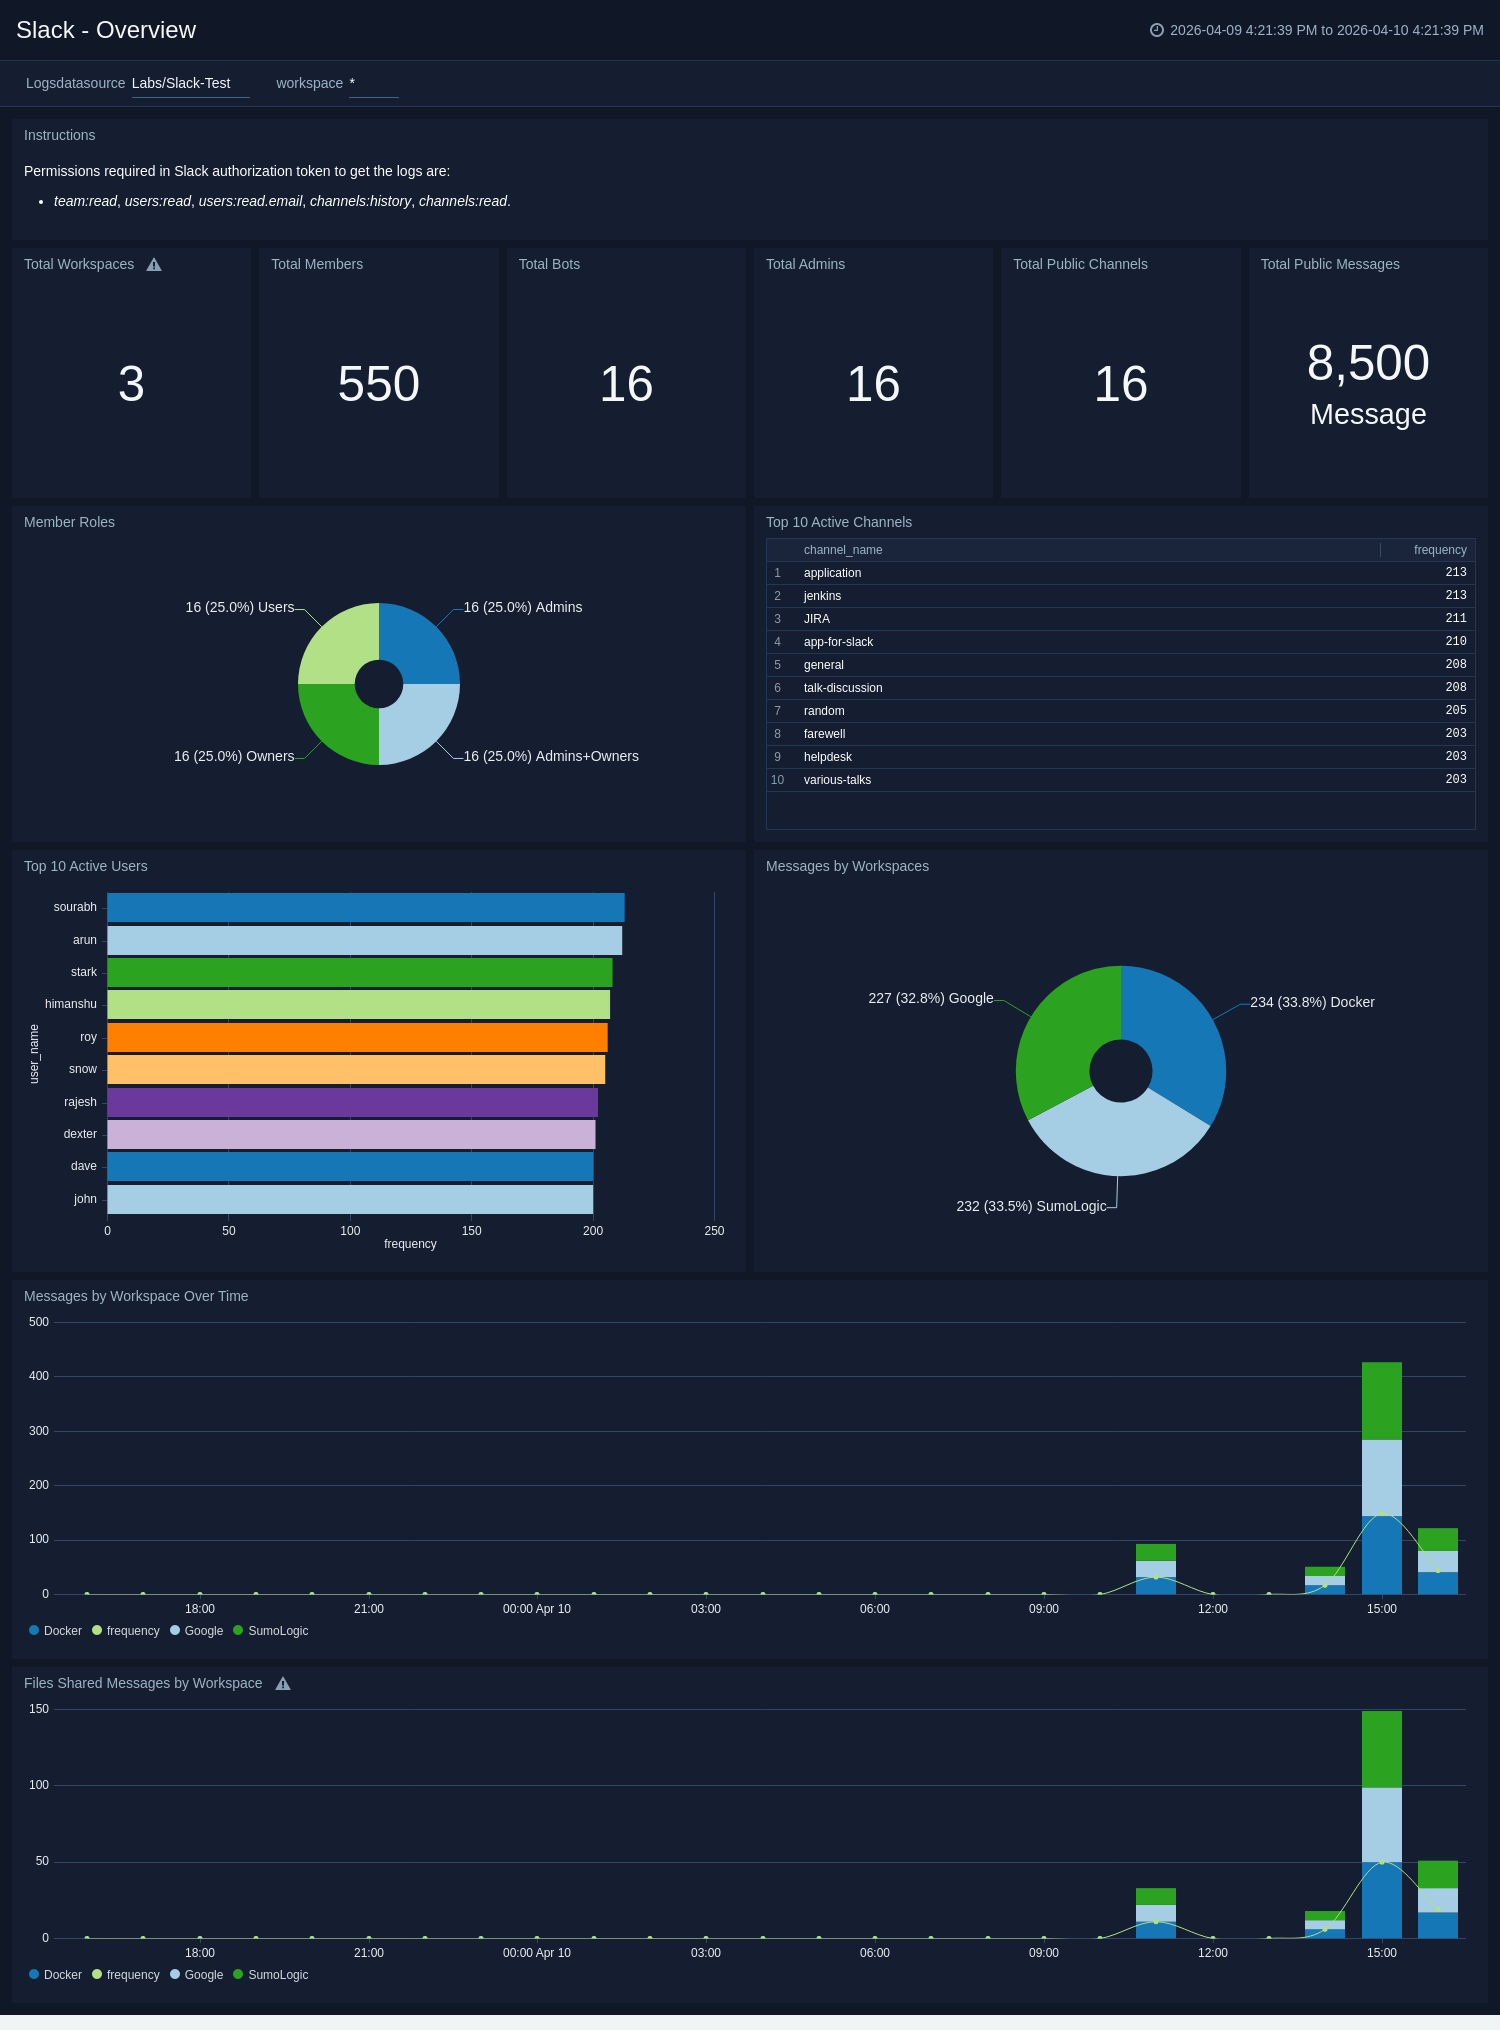
Overview
The Slack - Overview dashboard provides an at-a-glance view of the number of workspaces, members, bots, admins, public channels, and public messages. Panels also show geographic access locations and key statistics around public messages and files.
Use this dashboard to:
- Monitor the admins, bots, and members across workspaces.
- Identify the trends around public messages and files shared.
- Monitor locations from which workspaces are being accessed.
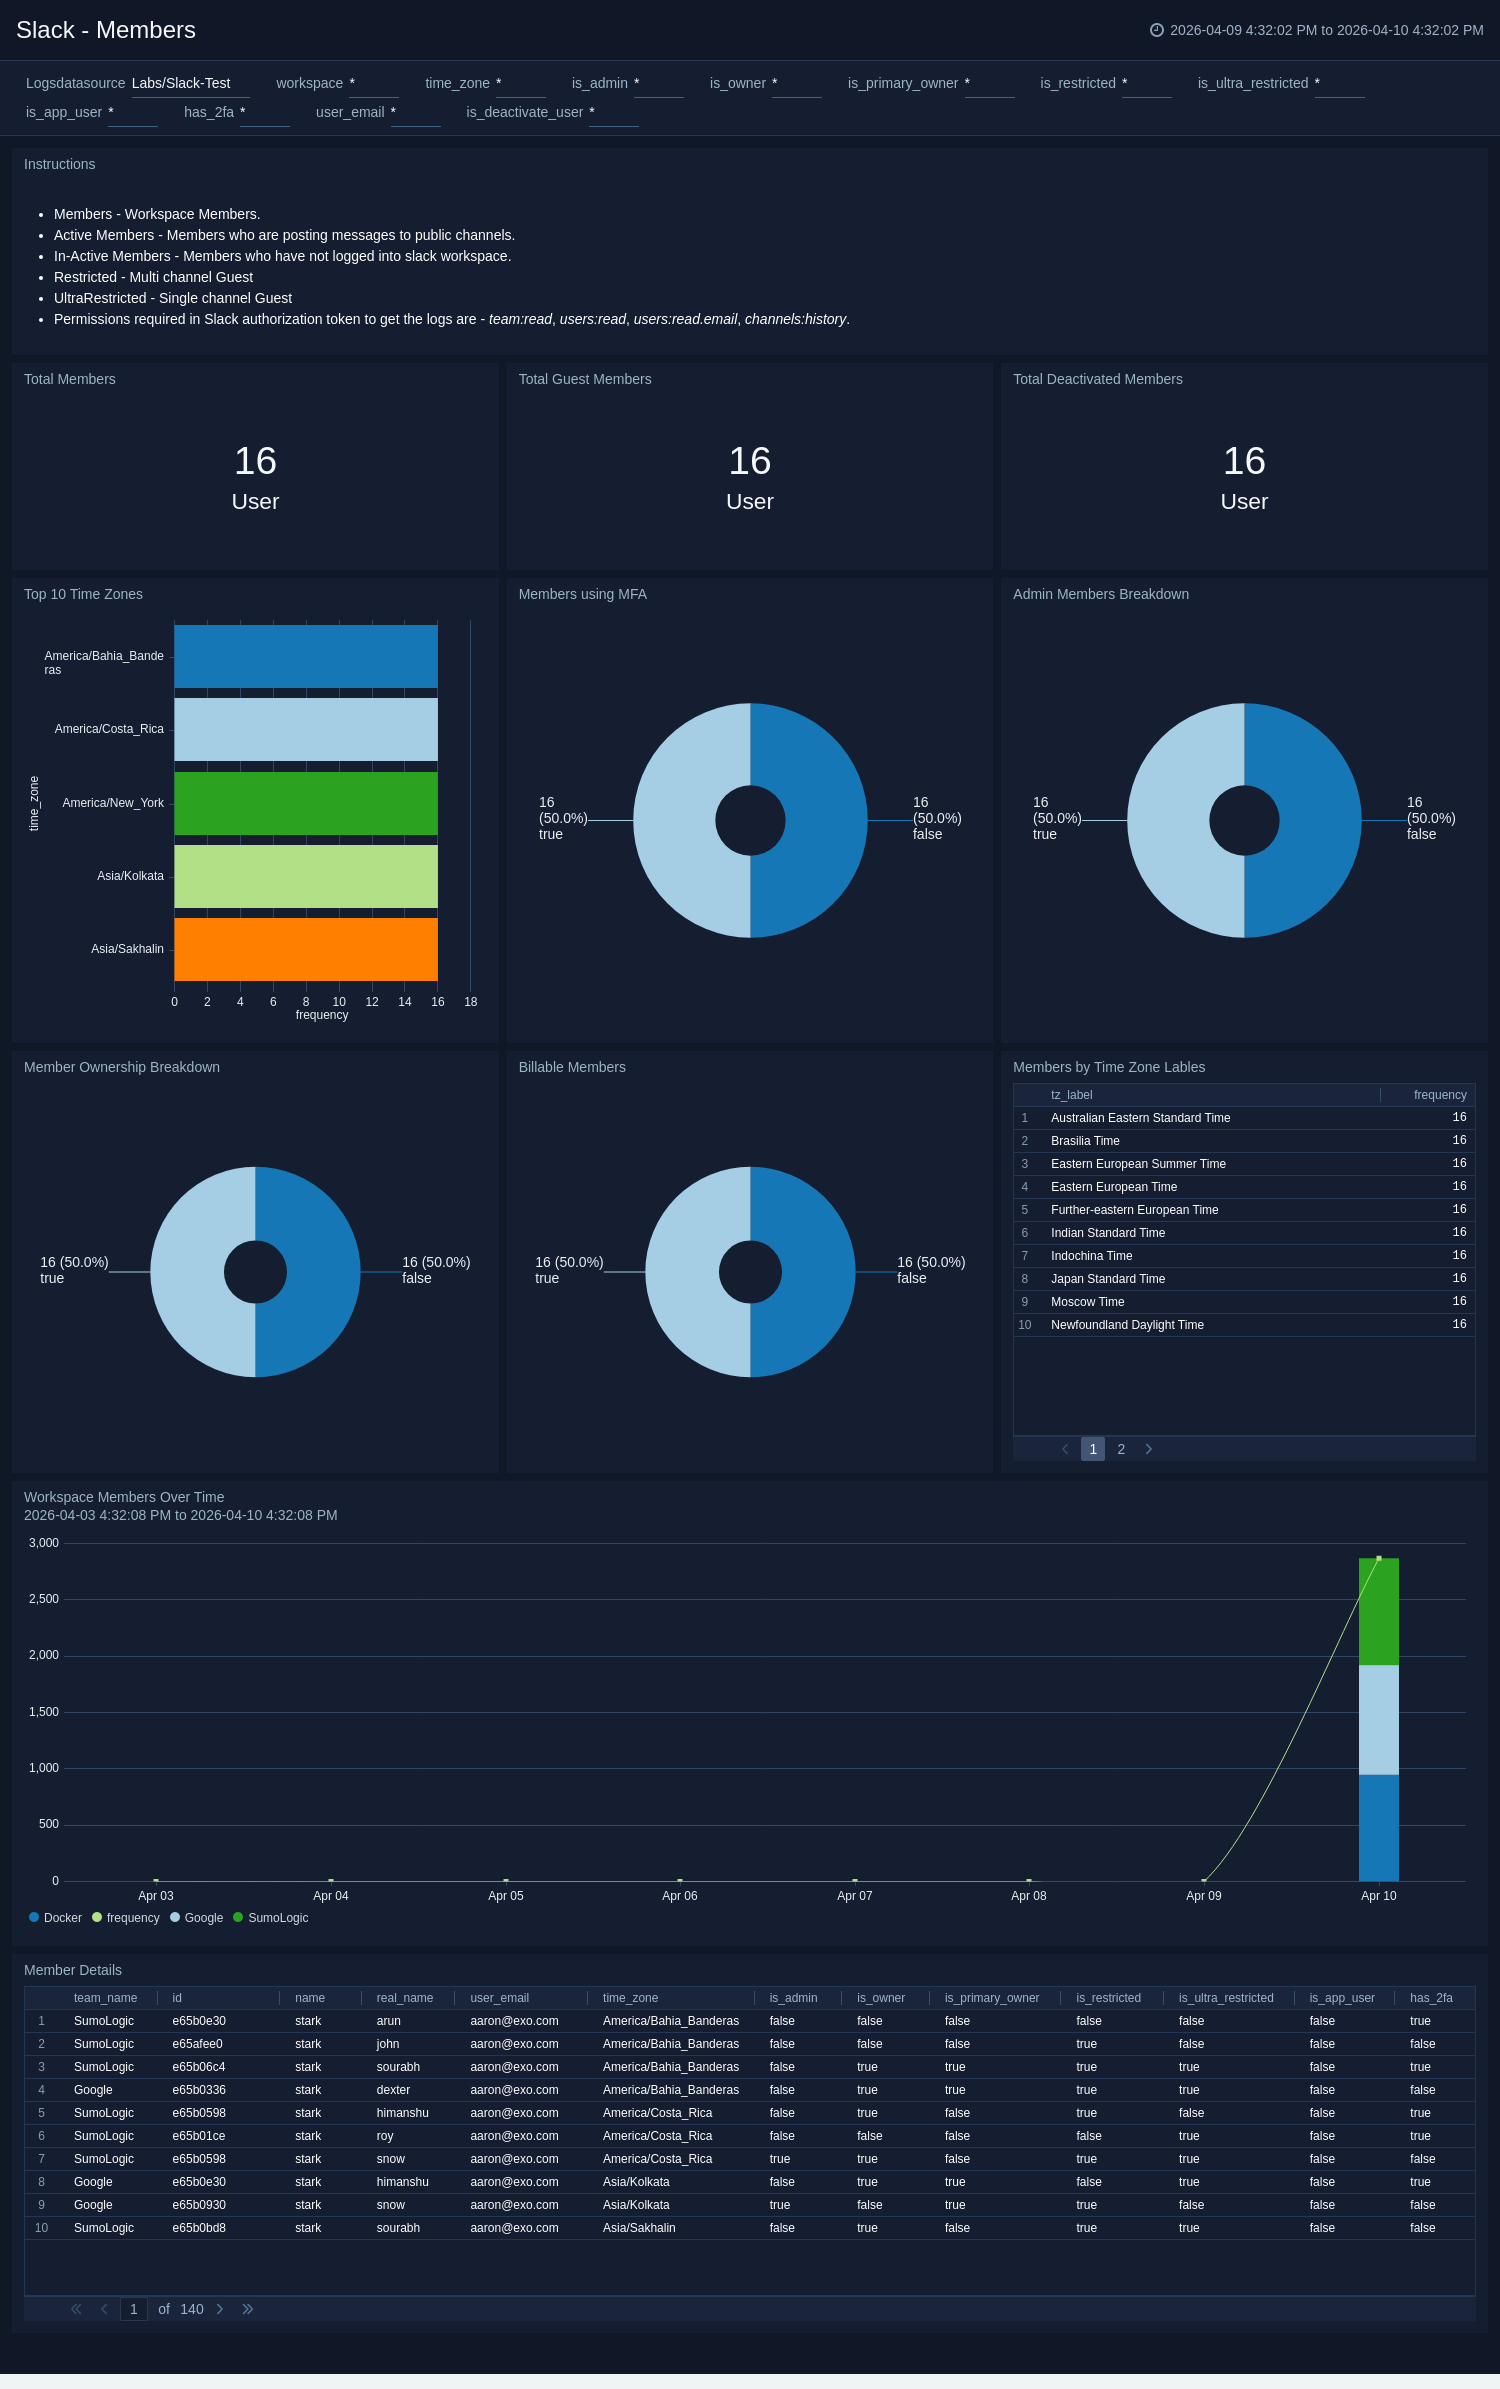
Members
The Slack - Members dashboard summarizes membership activity and composition across Slack. It reports total, guest, and deactivated members, MFA adoption, roles, and time-zone-based distributions.
Use this dashboard to:
- Track membership changes and activity over time.
- Assess use of security features such as MFA.
- Identify member distributions by ownership, billing, and role.
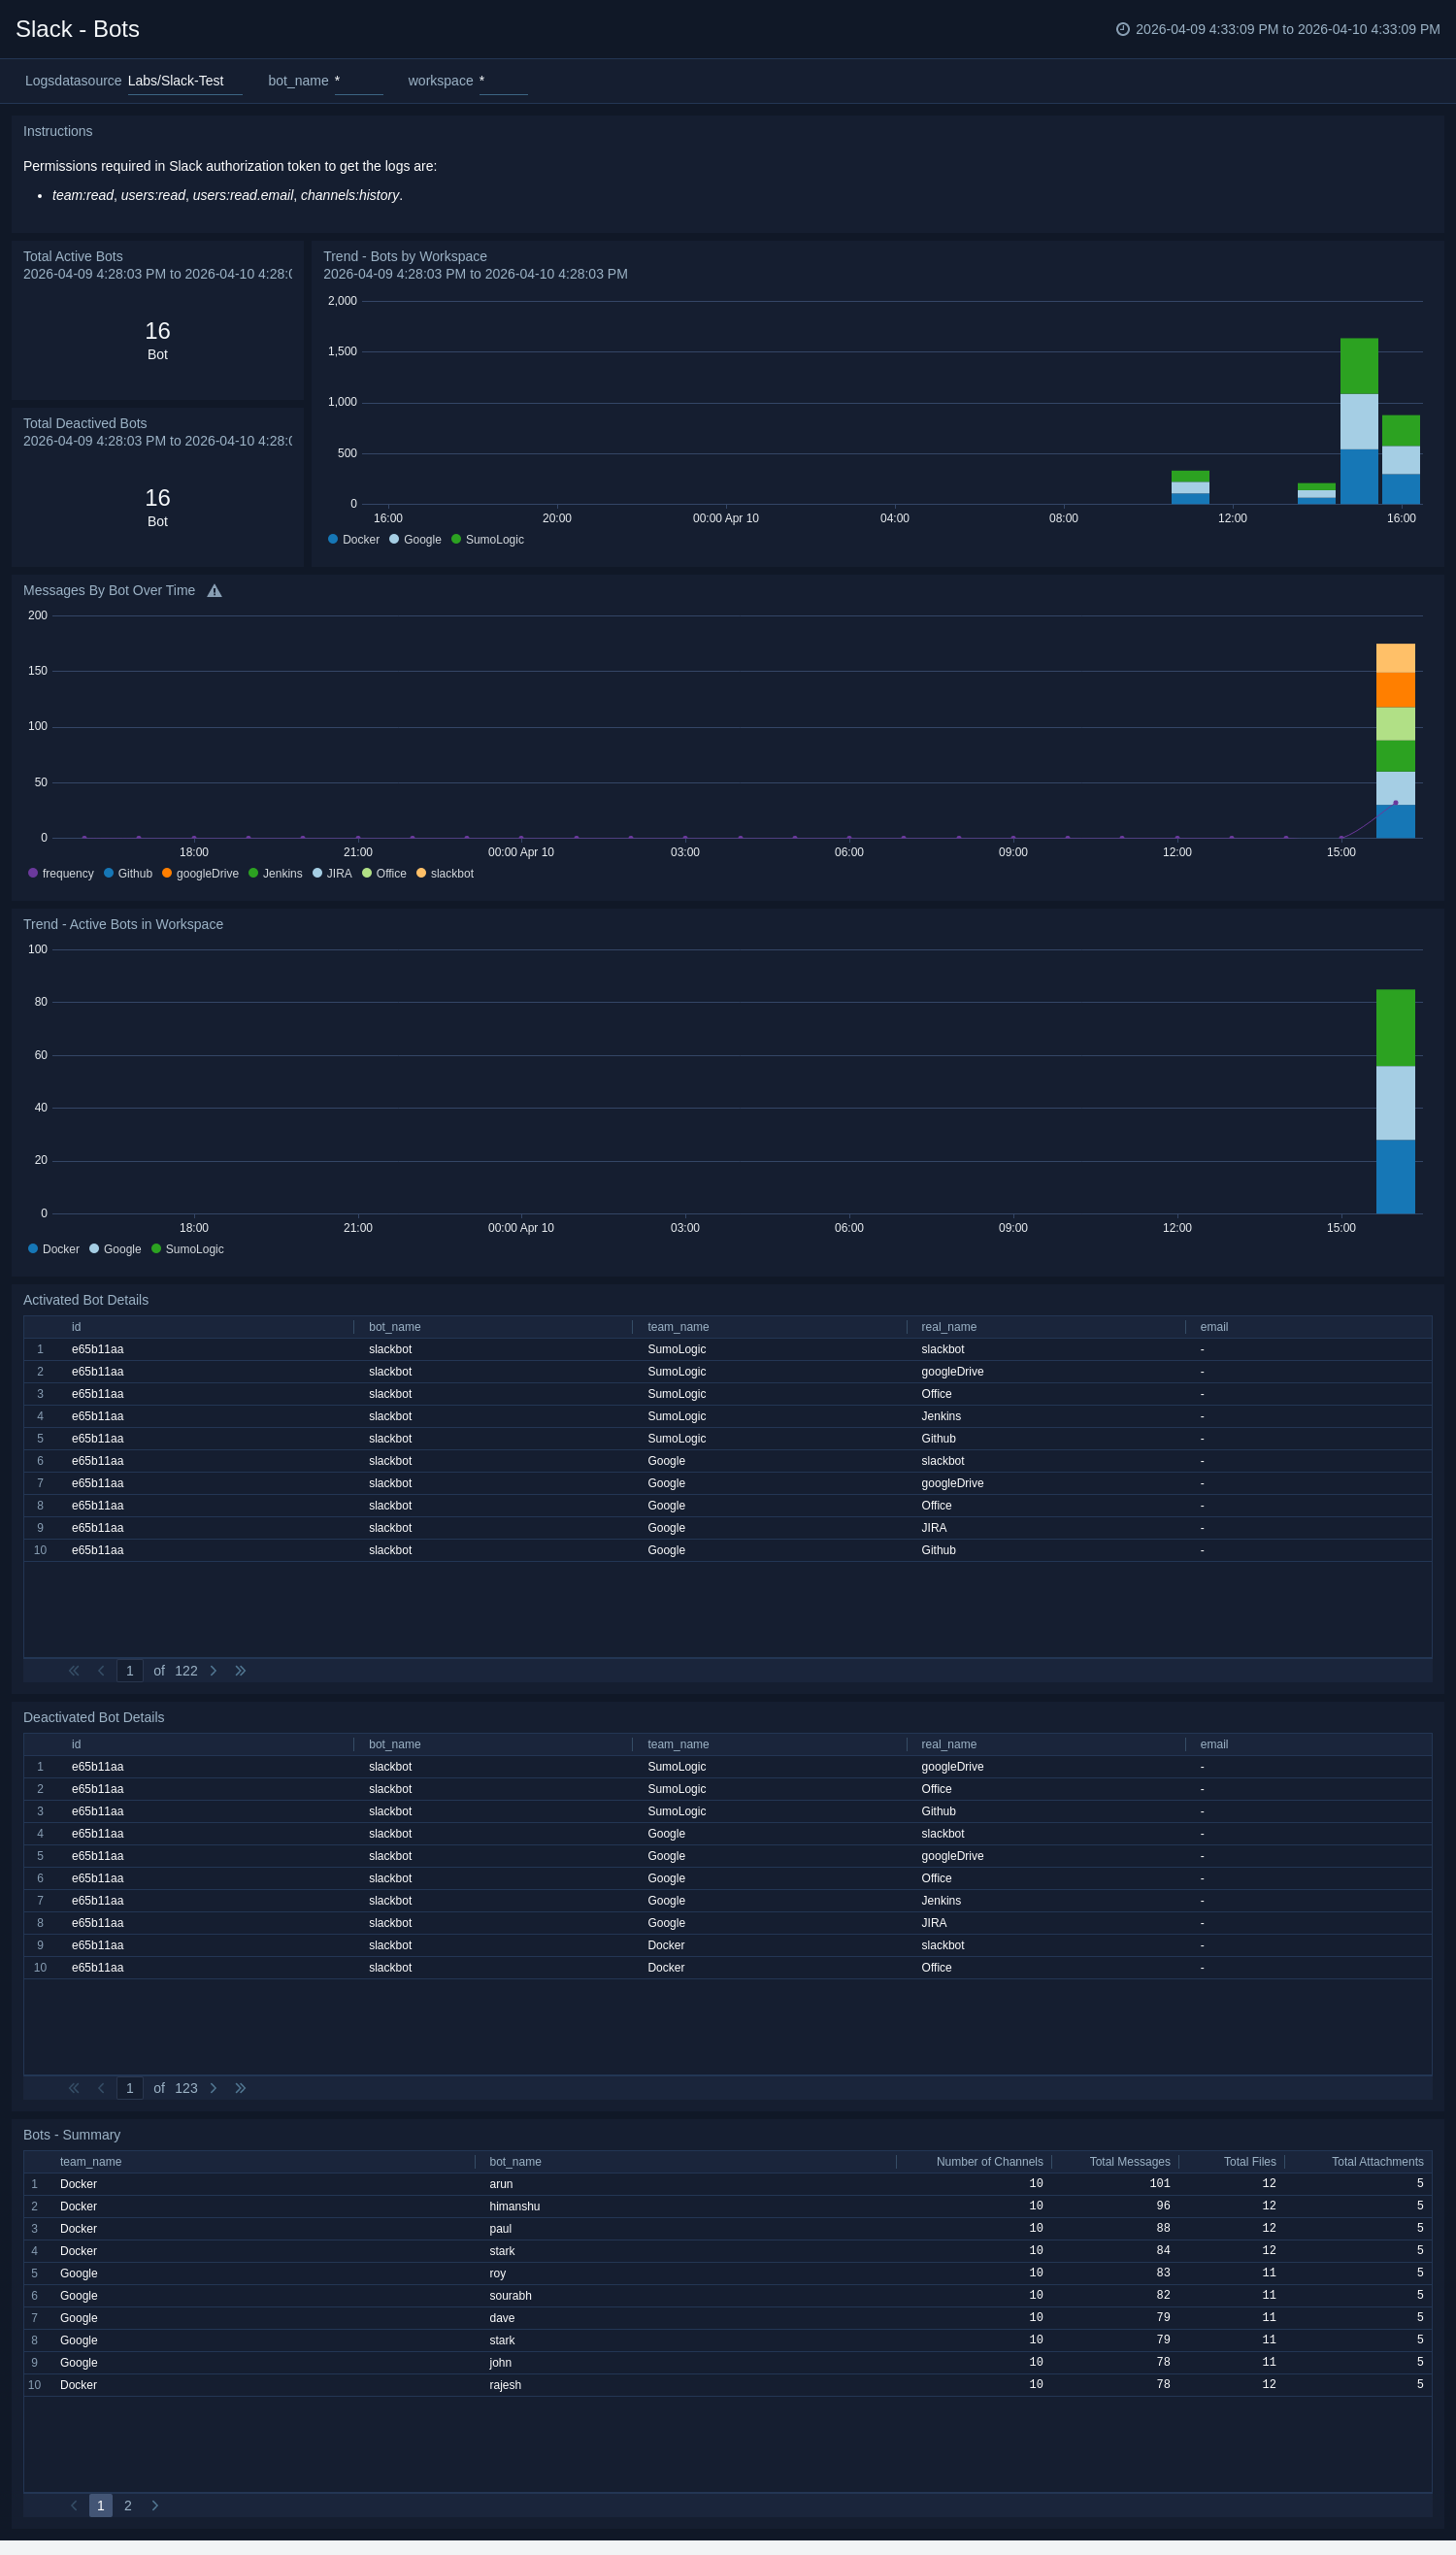
Bots
The Slack - Bots dashboard provides visibility into all automated bots within the organization. It tracks activation and deactivation trends, bot message volume, and top active bots by workspace.
Use this dashboard to:
- Monitor active and deactivated bots across workspaces.
- Analyze bot activity trends to ensure appropriate usage.
- Identify automation patterns and messages generated by bots.
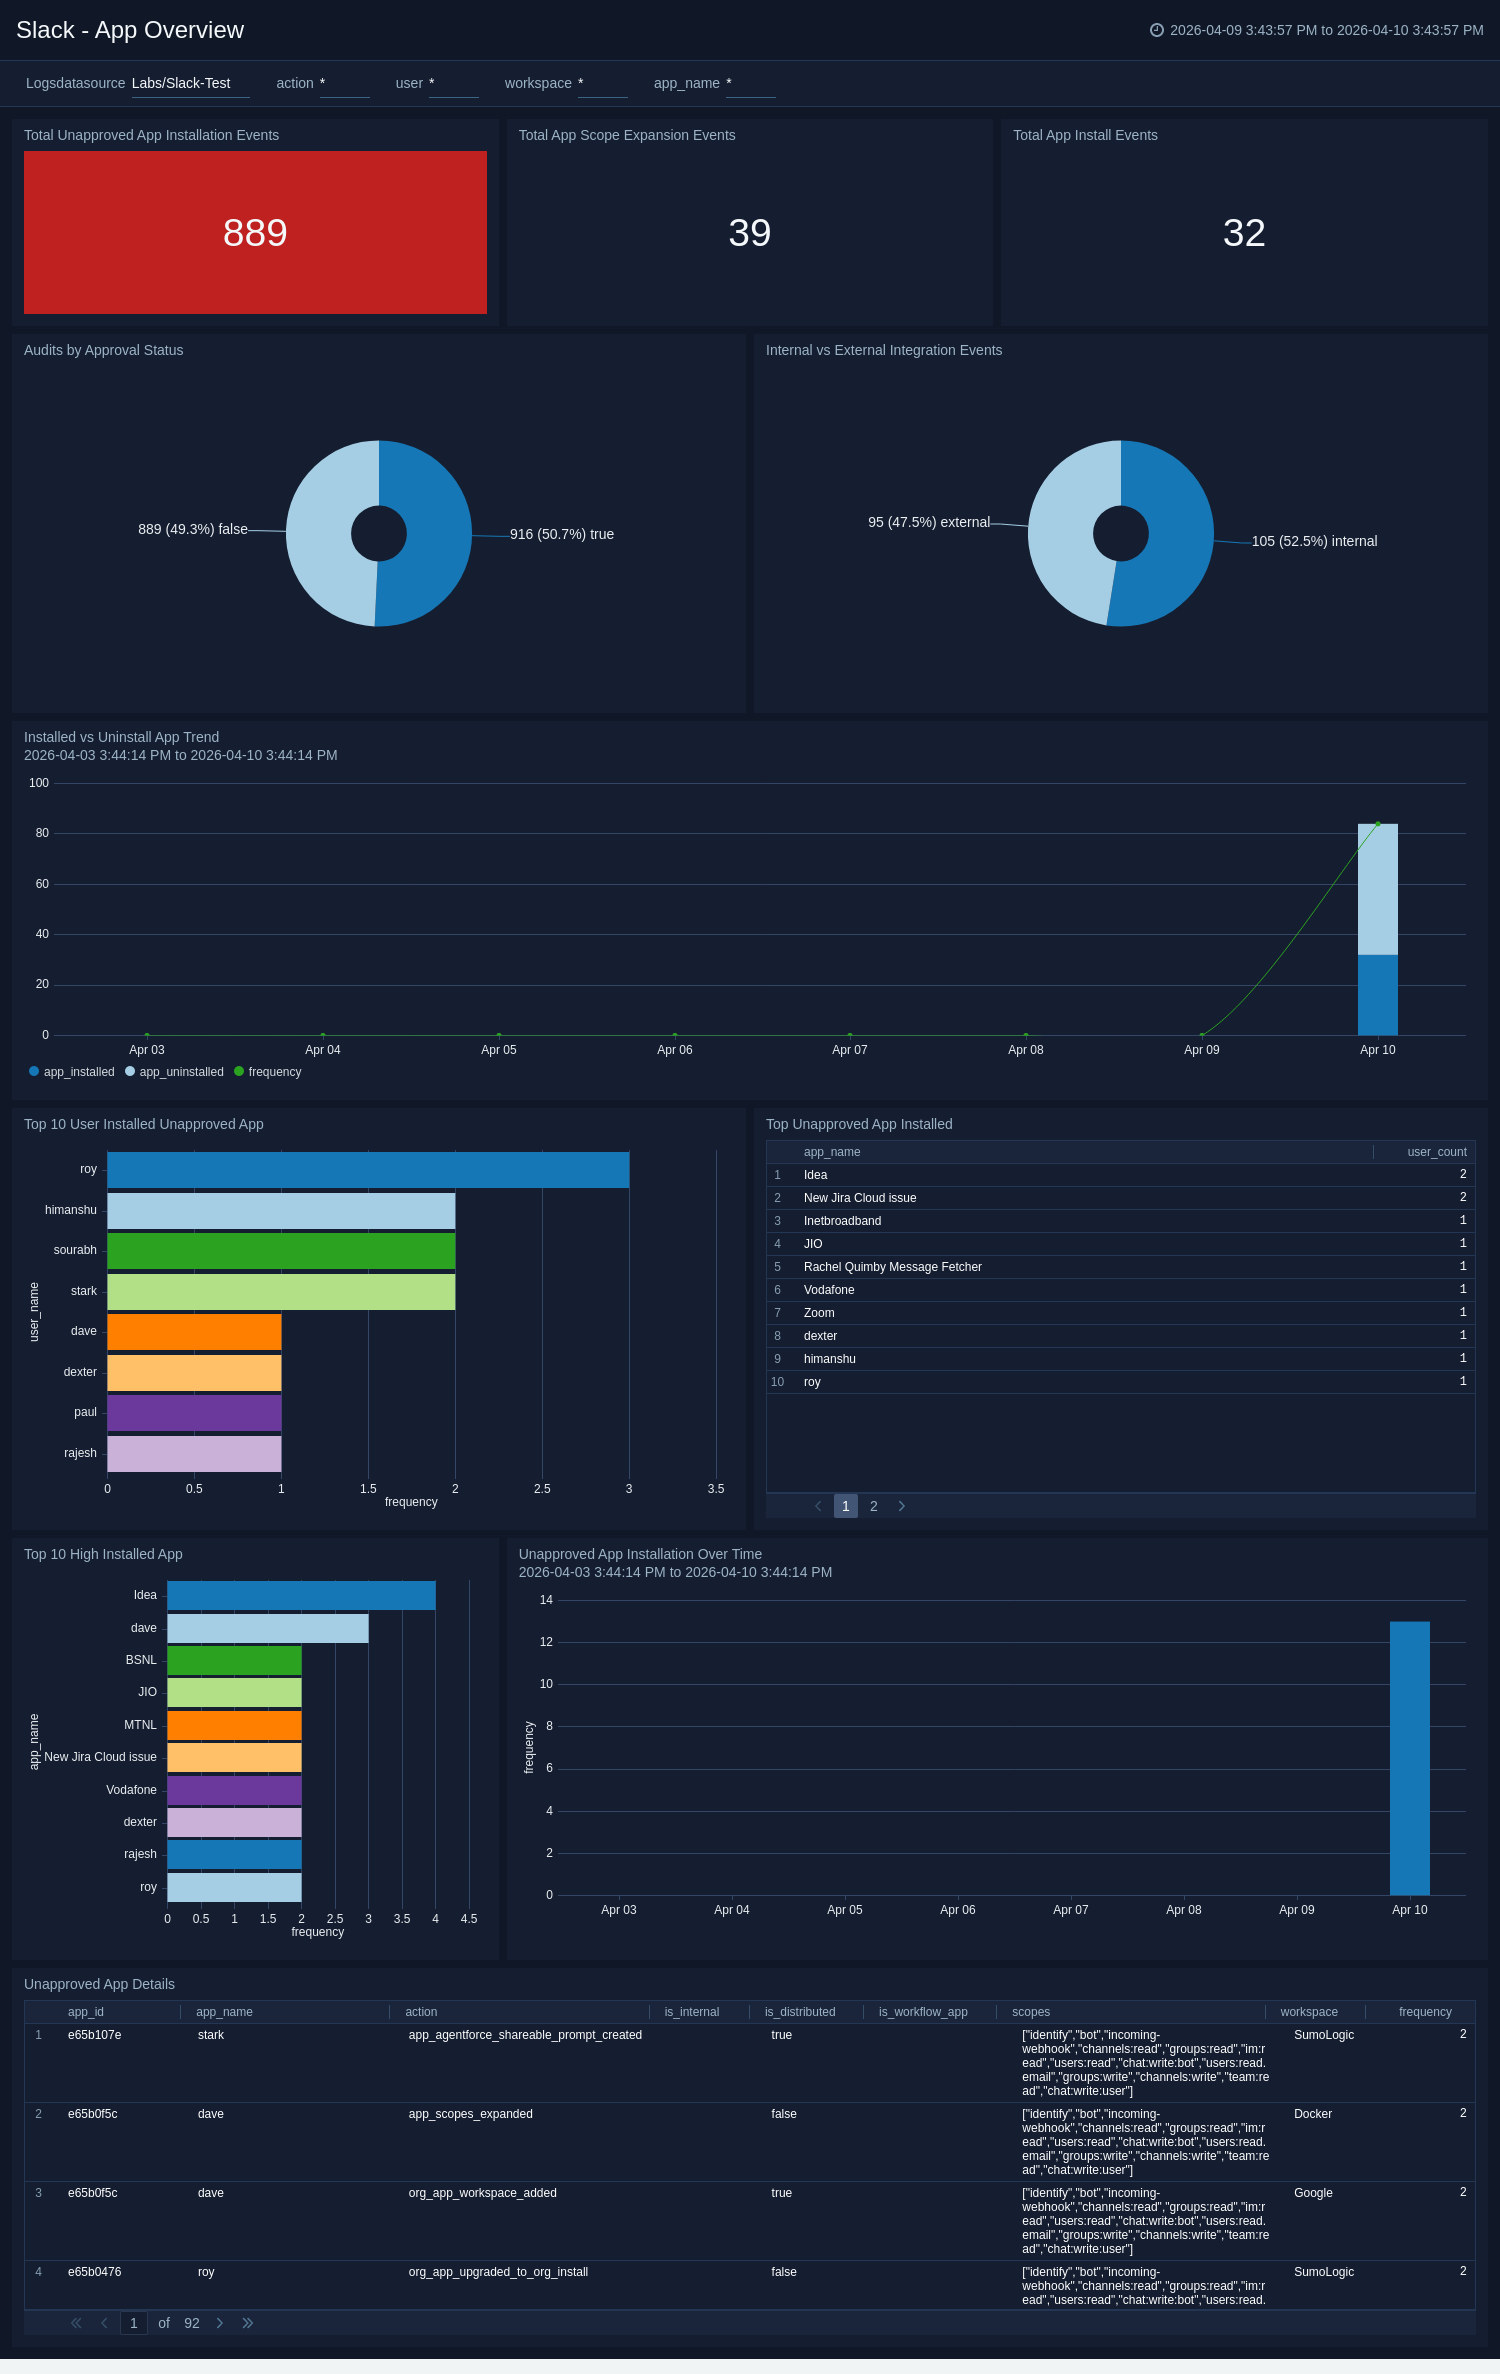
App Overview
The Slack - App Overview dashboard summarizes application activity across Slack, including installations, uninstalls, scope expansions, and approval statuses. It identifies high-risk or unapproved apps and highlights top-installed and unapproved user apps.
Use this dashboard to:
- Track app installation and uninstallation trends across users.
- Identify unapproved or risky app usage within the organization.
- Monitor integration events and maintain app compliance.
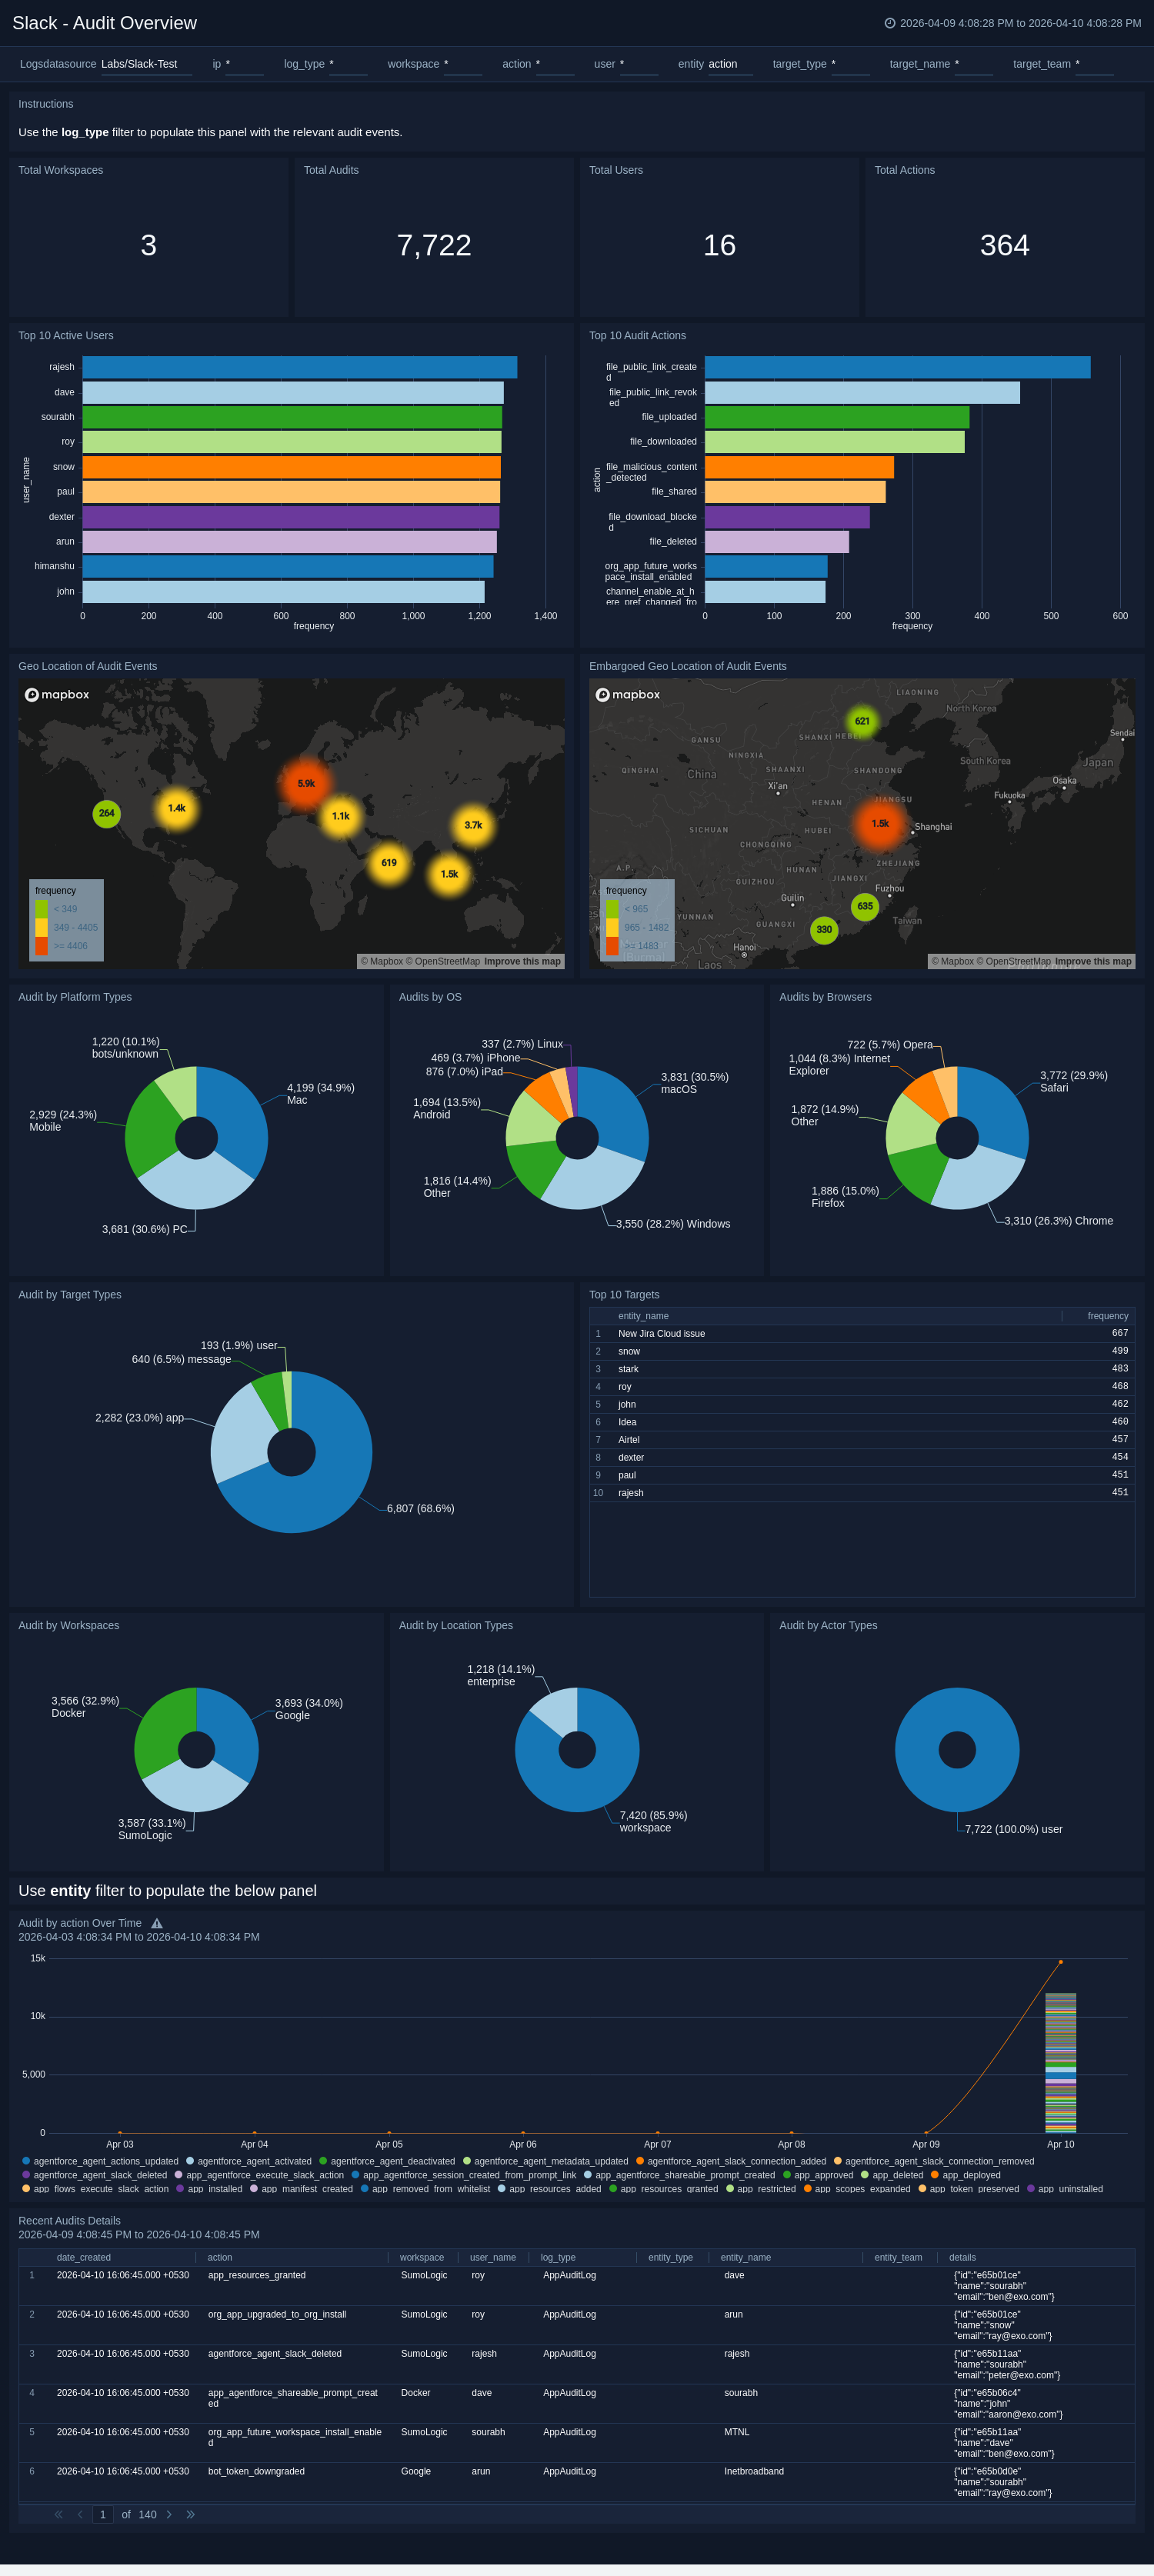
Audit Overview
The Slack - Audit Overview dashboard provides visibility into every audited event across devices, browsers, and geographic locations. It details user actions, targets, and actor types to help identify unusual activity or compliance issues.
Use this dashboard to:
- Review all audited events across users and workspaces.
- Identify patterns or anomalies by geography, OS, or device.
- Gain insight into who performed what actions on which resources.
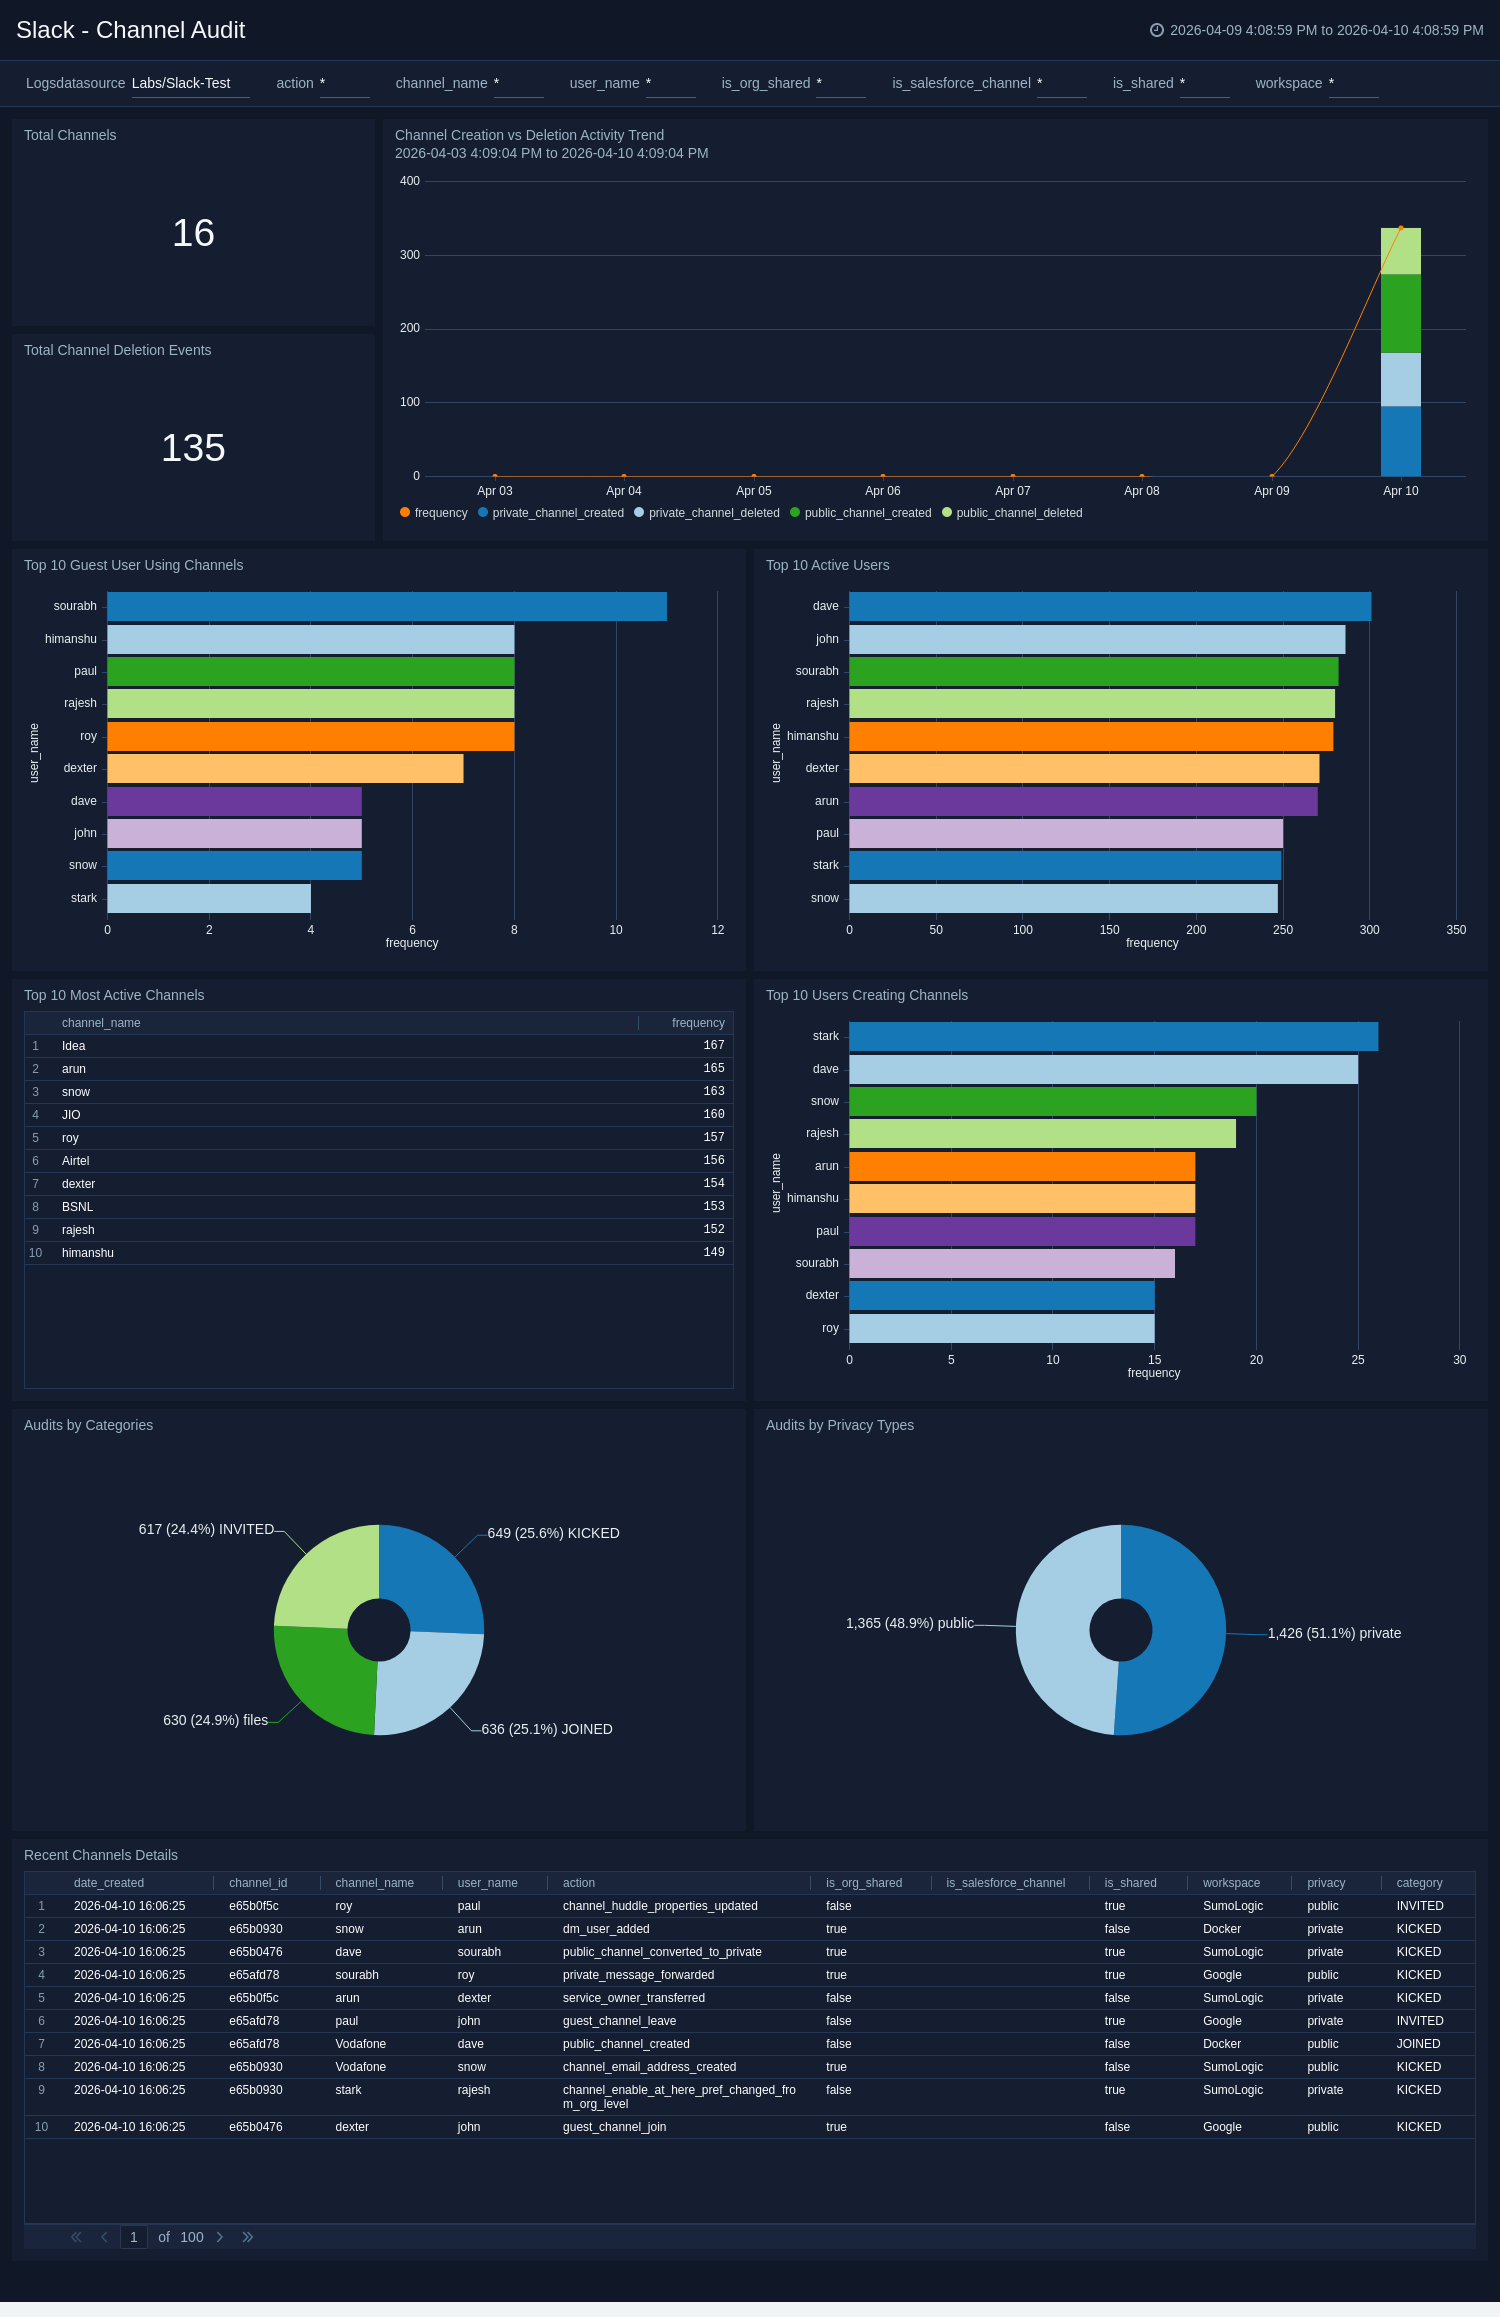
Channel Audit
The Slack - Channel Audit dashboard tracks the creation, deletion, and usage of channels, including activity distribution by privacy and category. It identifies the most active channels, creators, and guest participants.
Use this dashboard to:
- Monitor overall channel creation and deletion activity.
- Identify the most active or high-risk channels.
- Analyze guest and user participation across channels.
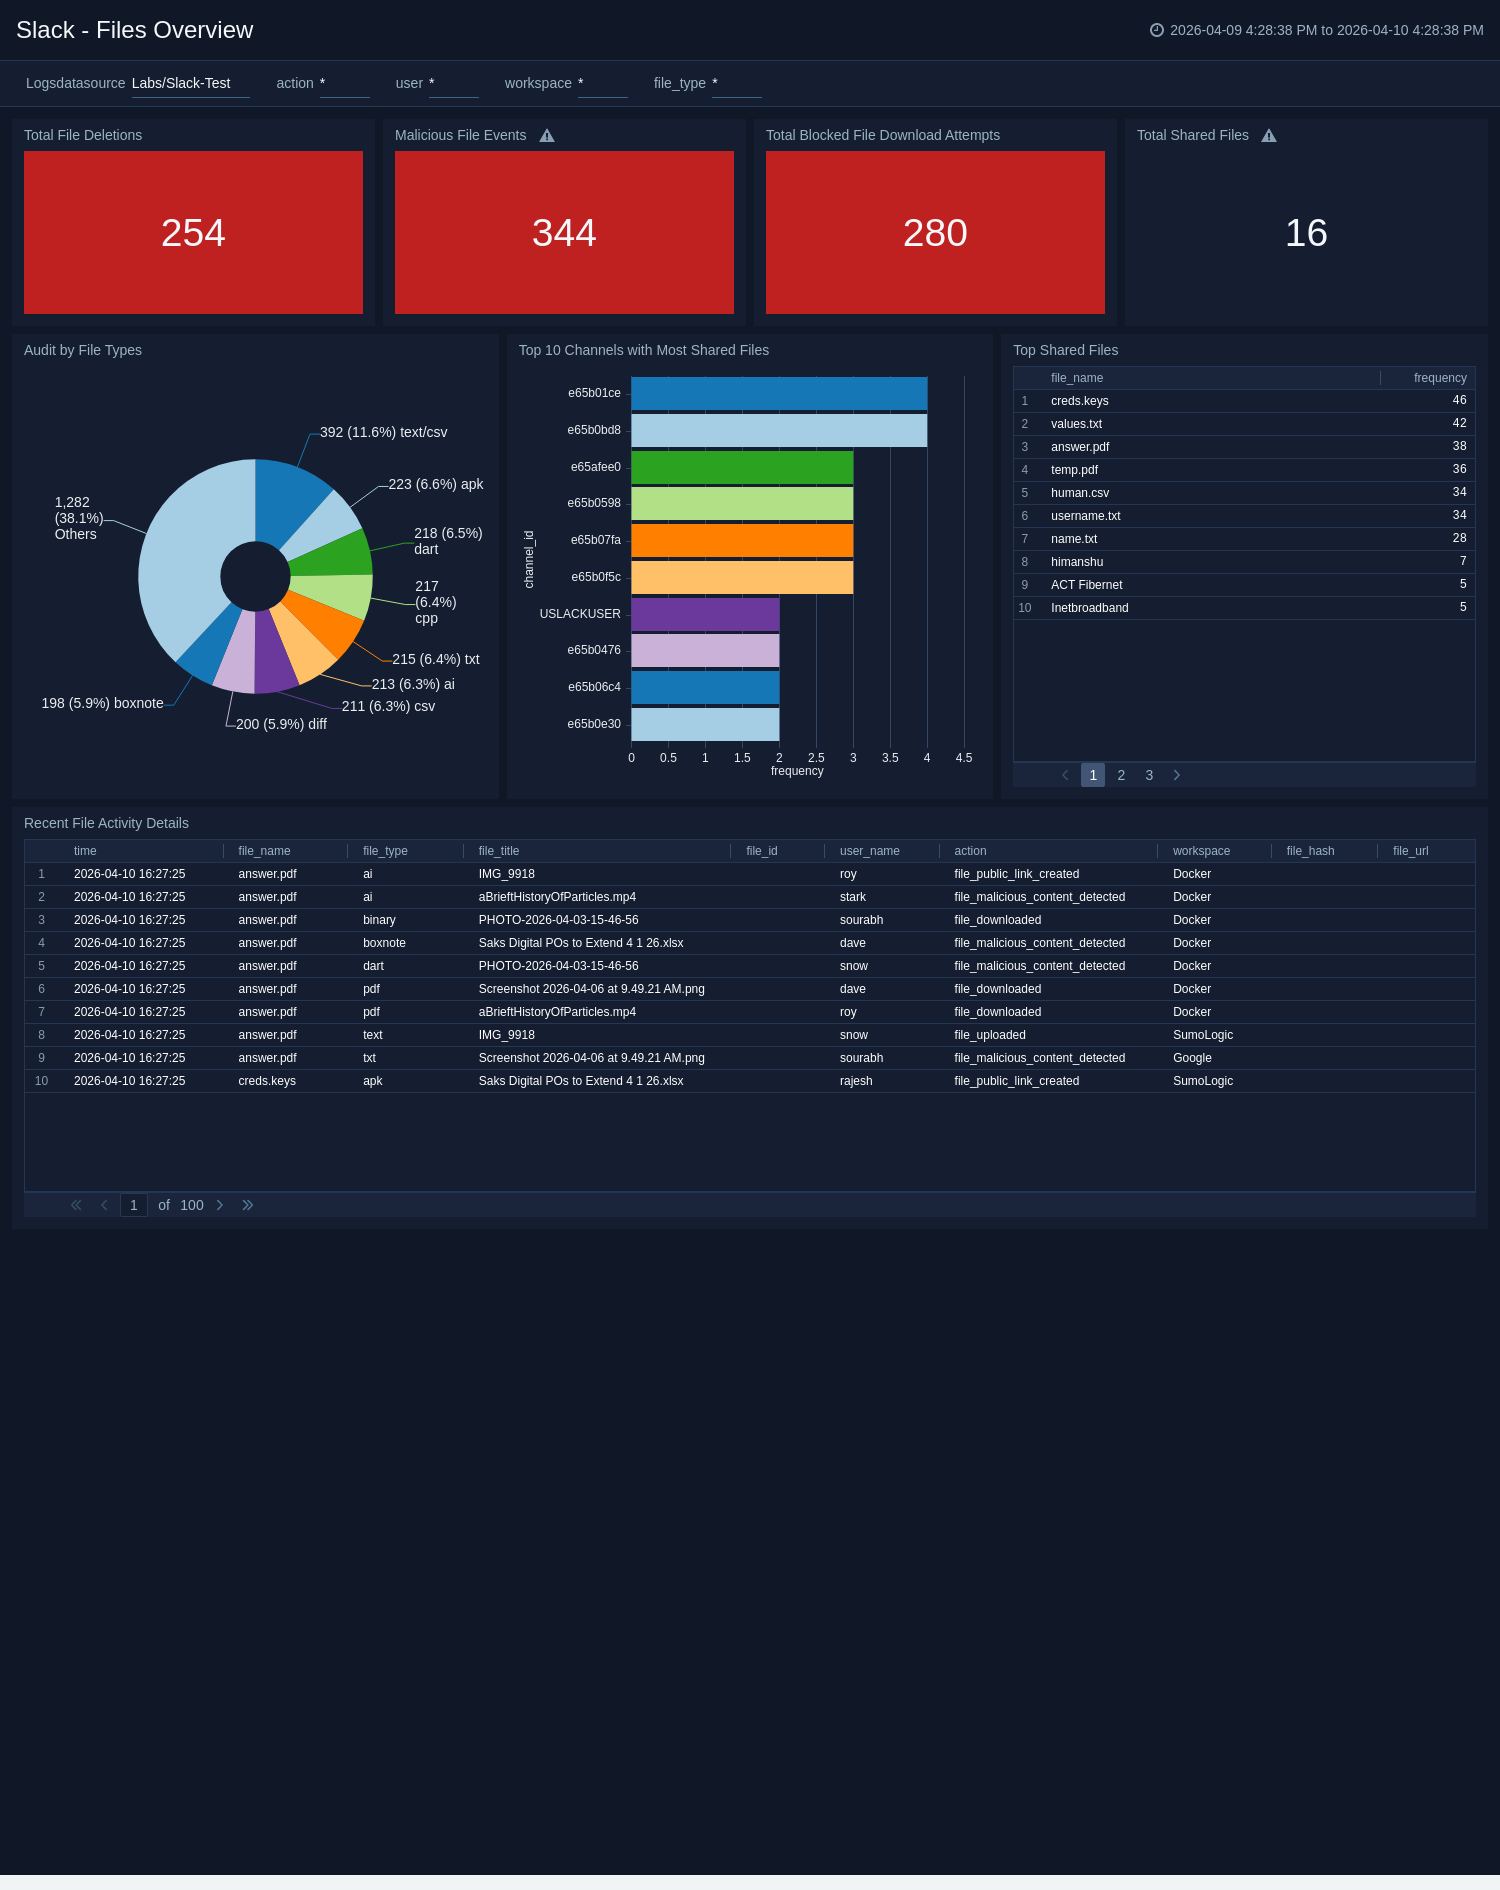
Files Overview
The Slack - Files Overview dashboard monitors file events, including uploads, shares, deletions, and blocked downloads. It also tracks malicious file events and common file types shared across workspaces.
Use this dashboard to:
- Detect unusual or potentially malicious file activity.
- Track blocked download and file-sharing events.
- Identify top channels and users driving file-sharing activity.
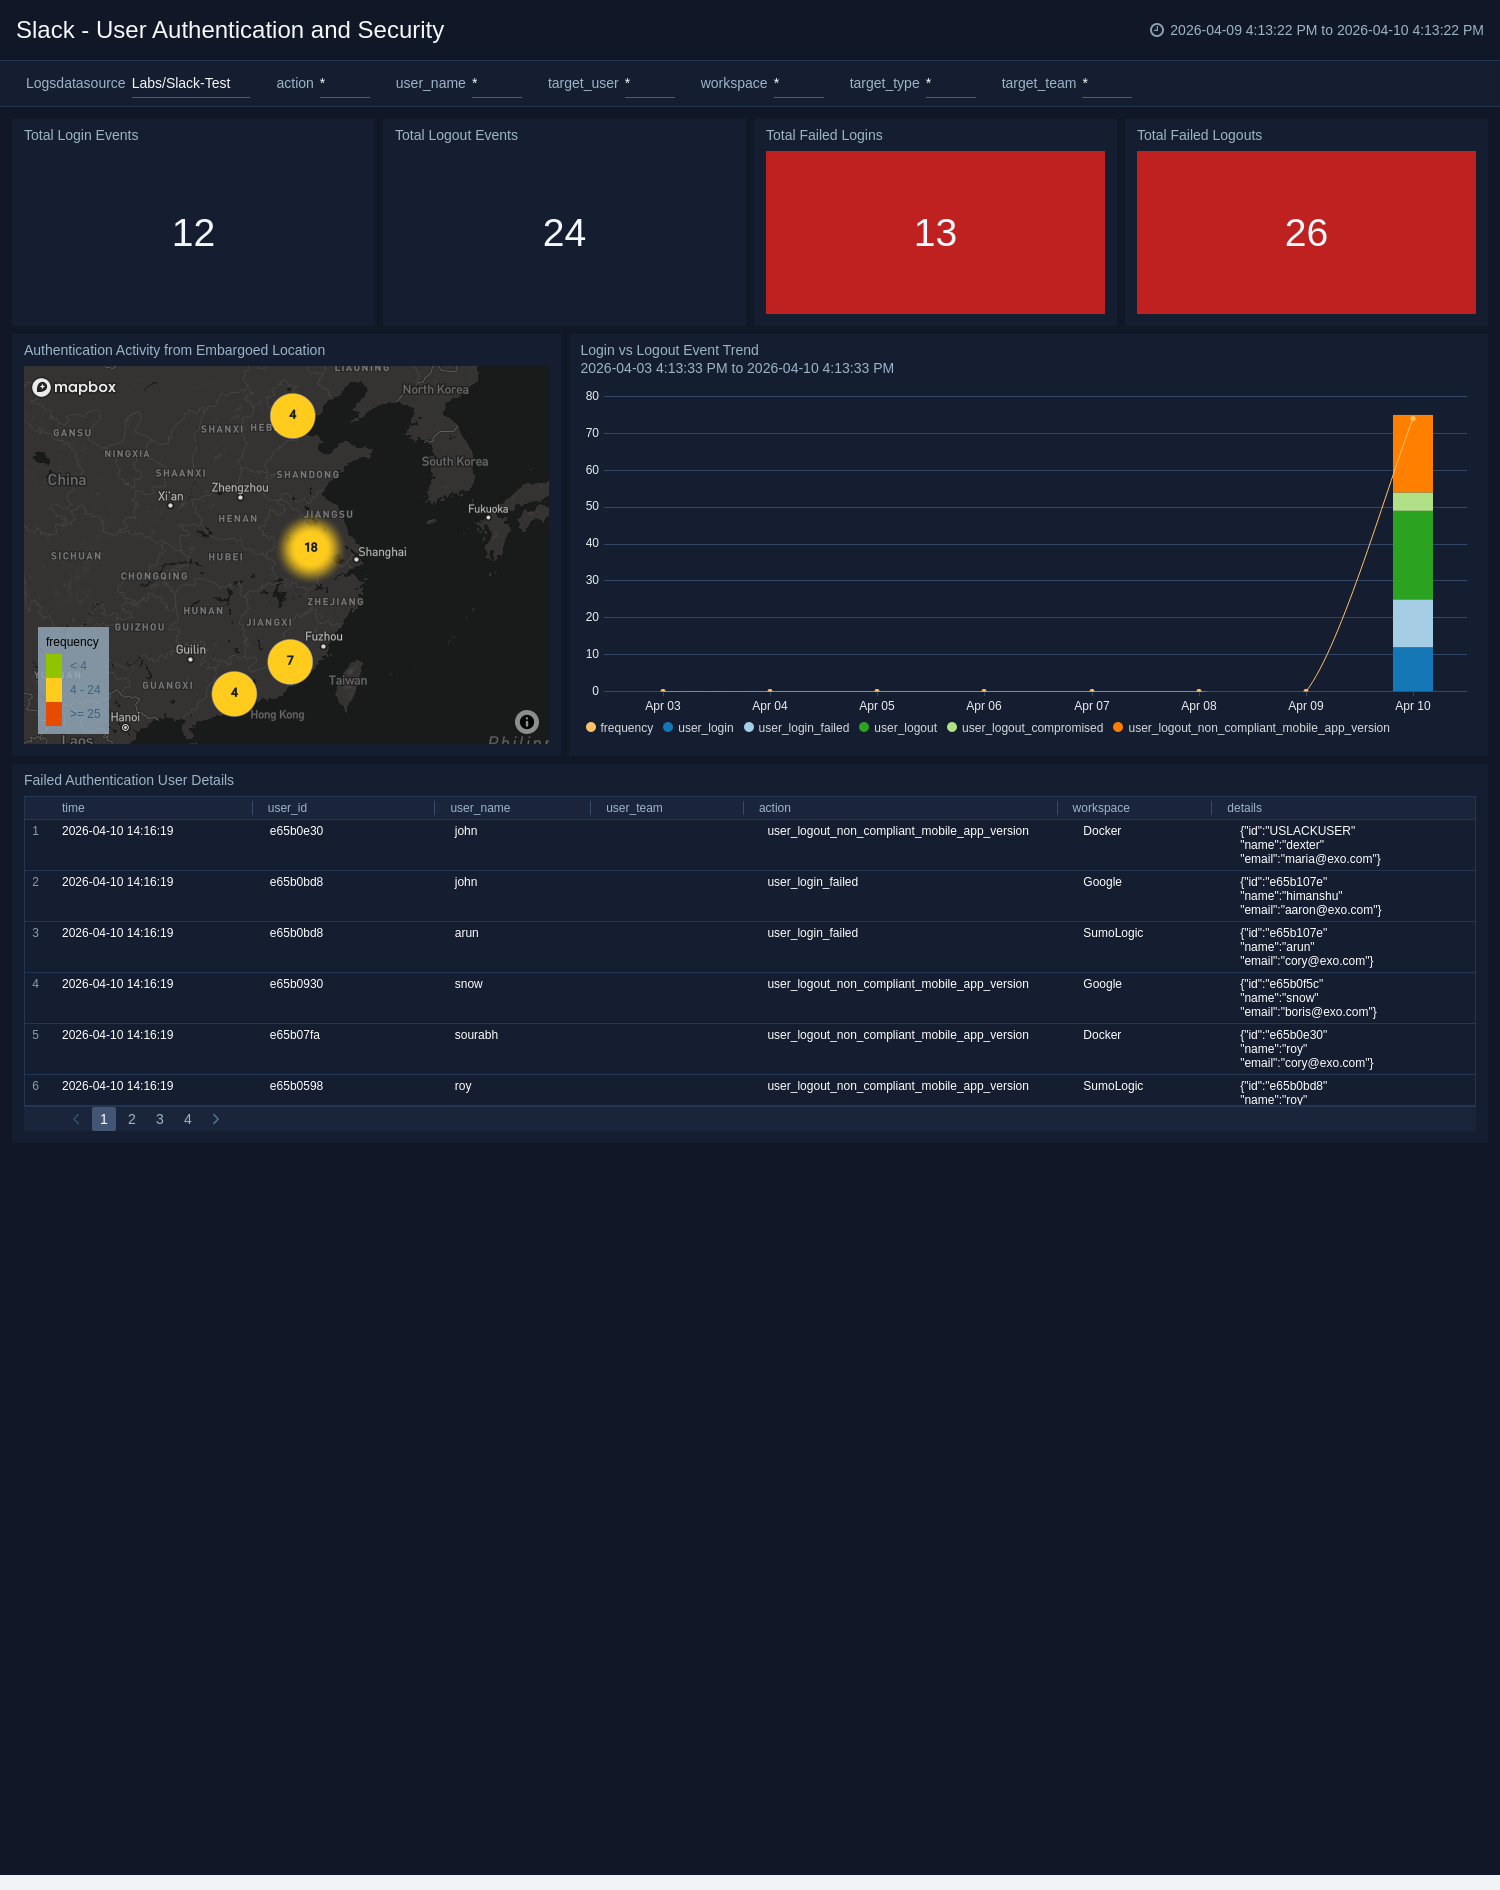
User Authentication and Security
The Slack - User Authentication and Security dashboard displays all login and logout events, including successes and failures. It also tracks SAML configuration changes and access attempts from embargoed regions.
Use this dashboard to:
- Monitor login success, failure, and logout patterns.
- Identify failed authentication trends and access risks.
- Review configuration changes impacting authentication and access security.
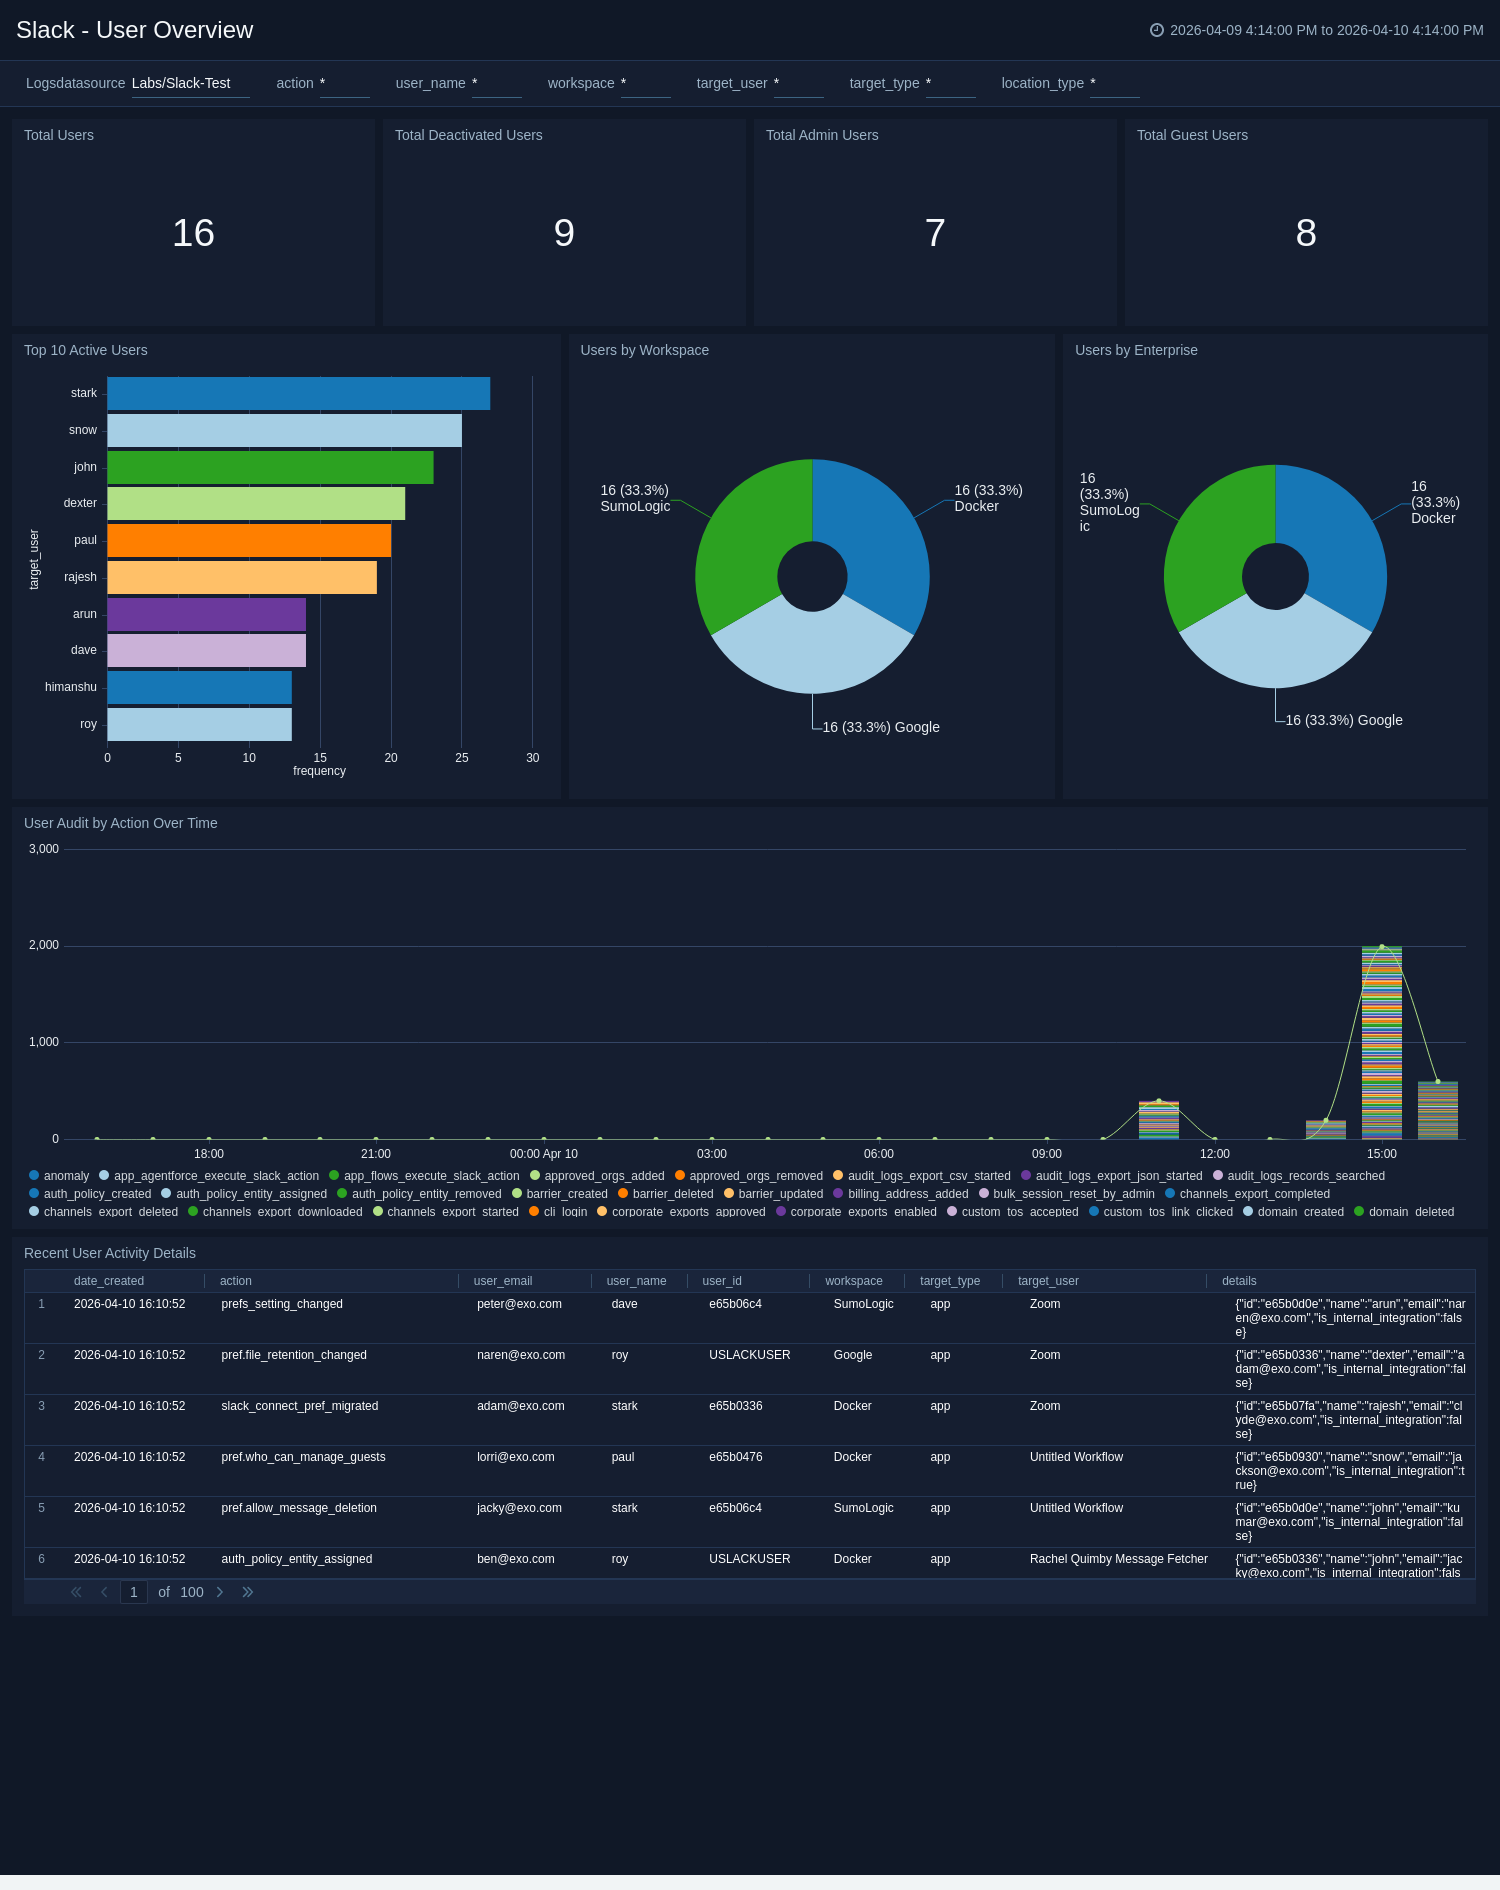
User Overview
The Slack - User Overview dashboard provides insight into user lifecycles and activity across the environment. It displays counts of total, deactivated, admin, and guest users, and tracks activity by workspace and enterprise.
Use this dashboard to:
- Monitor active, inactive, and administrative users.
- Understand user distribution across enterprises and workspaces.
- Review recent user actions for audit and compliance.
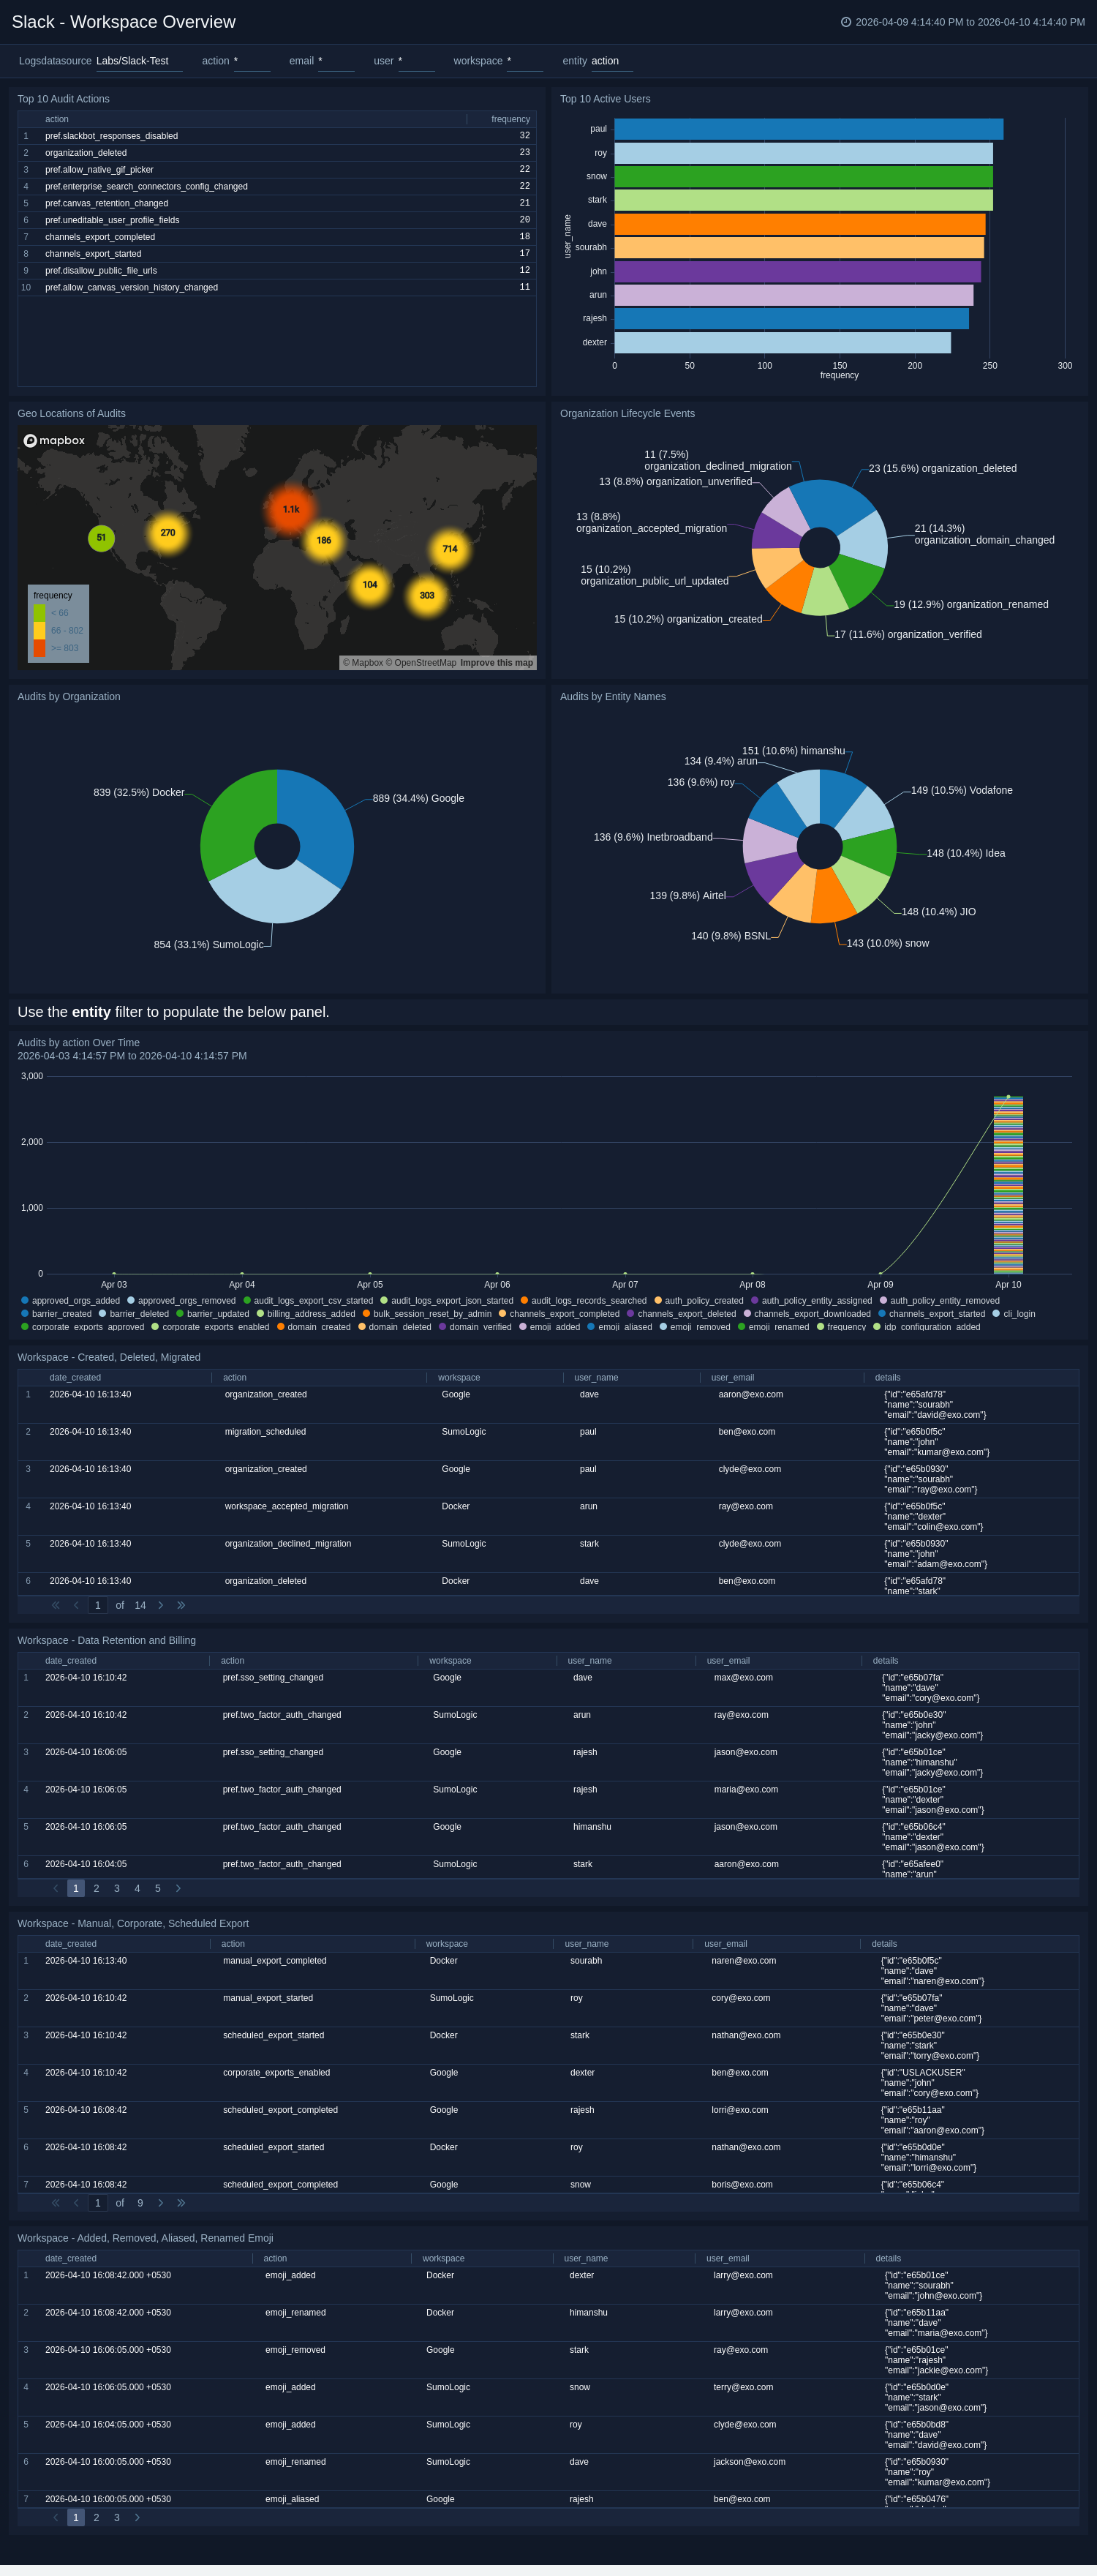
Workspace Overview
The Slack - Workspace Overview dashboard presents key metrics and changes related to workspace lifecycle and configuration. It shows creation, deletion, migration, billing, and retention events as well as geographic audits.
Use this dashboard to:
- Assess workspace creation and deletion trends.
- Review configuration and billing changes across organizations.
- Track audit actions by entity and workspace over time.
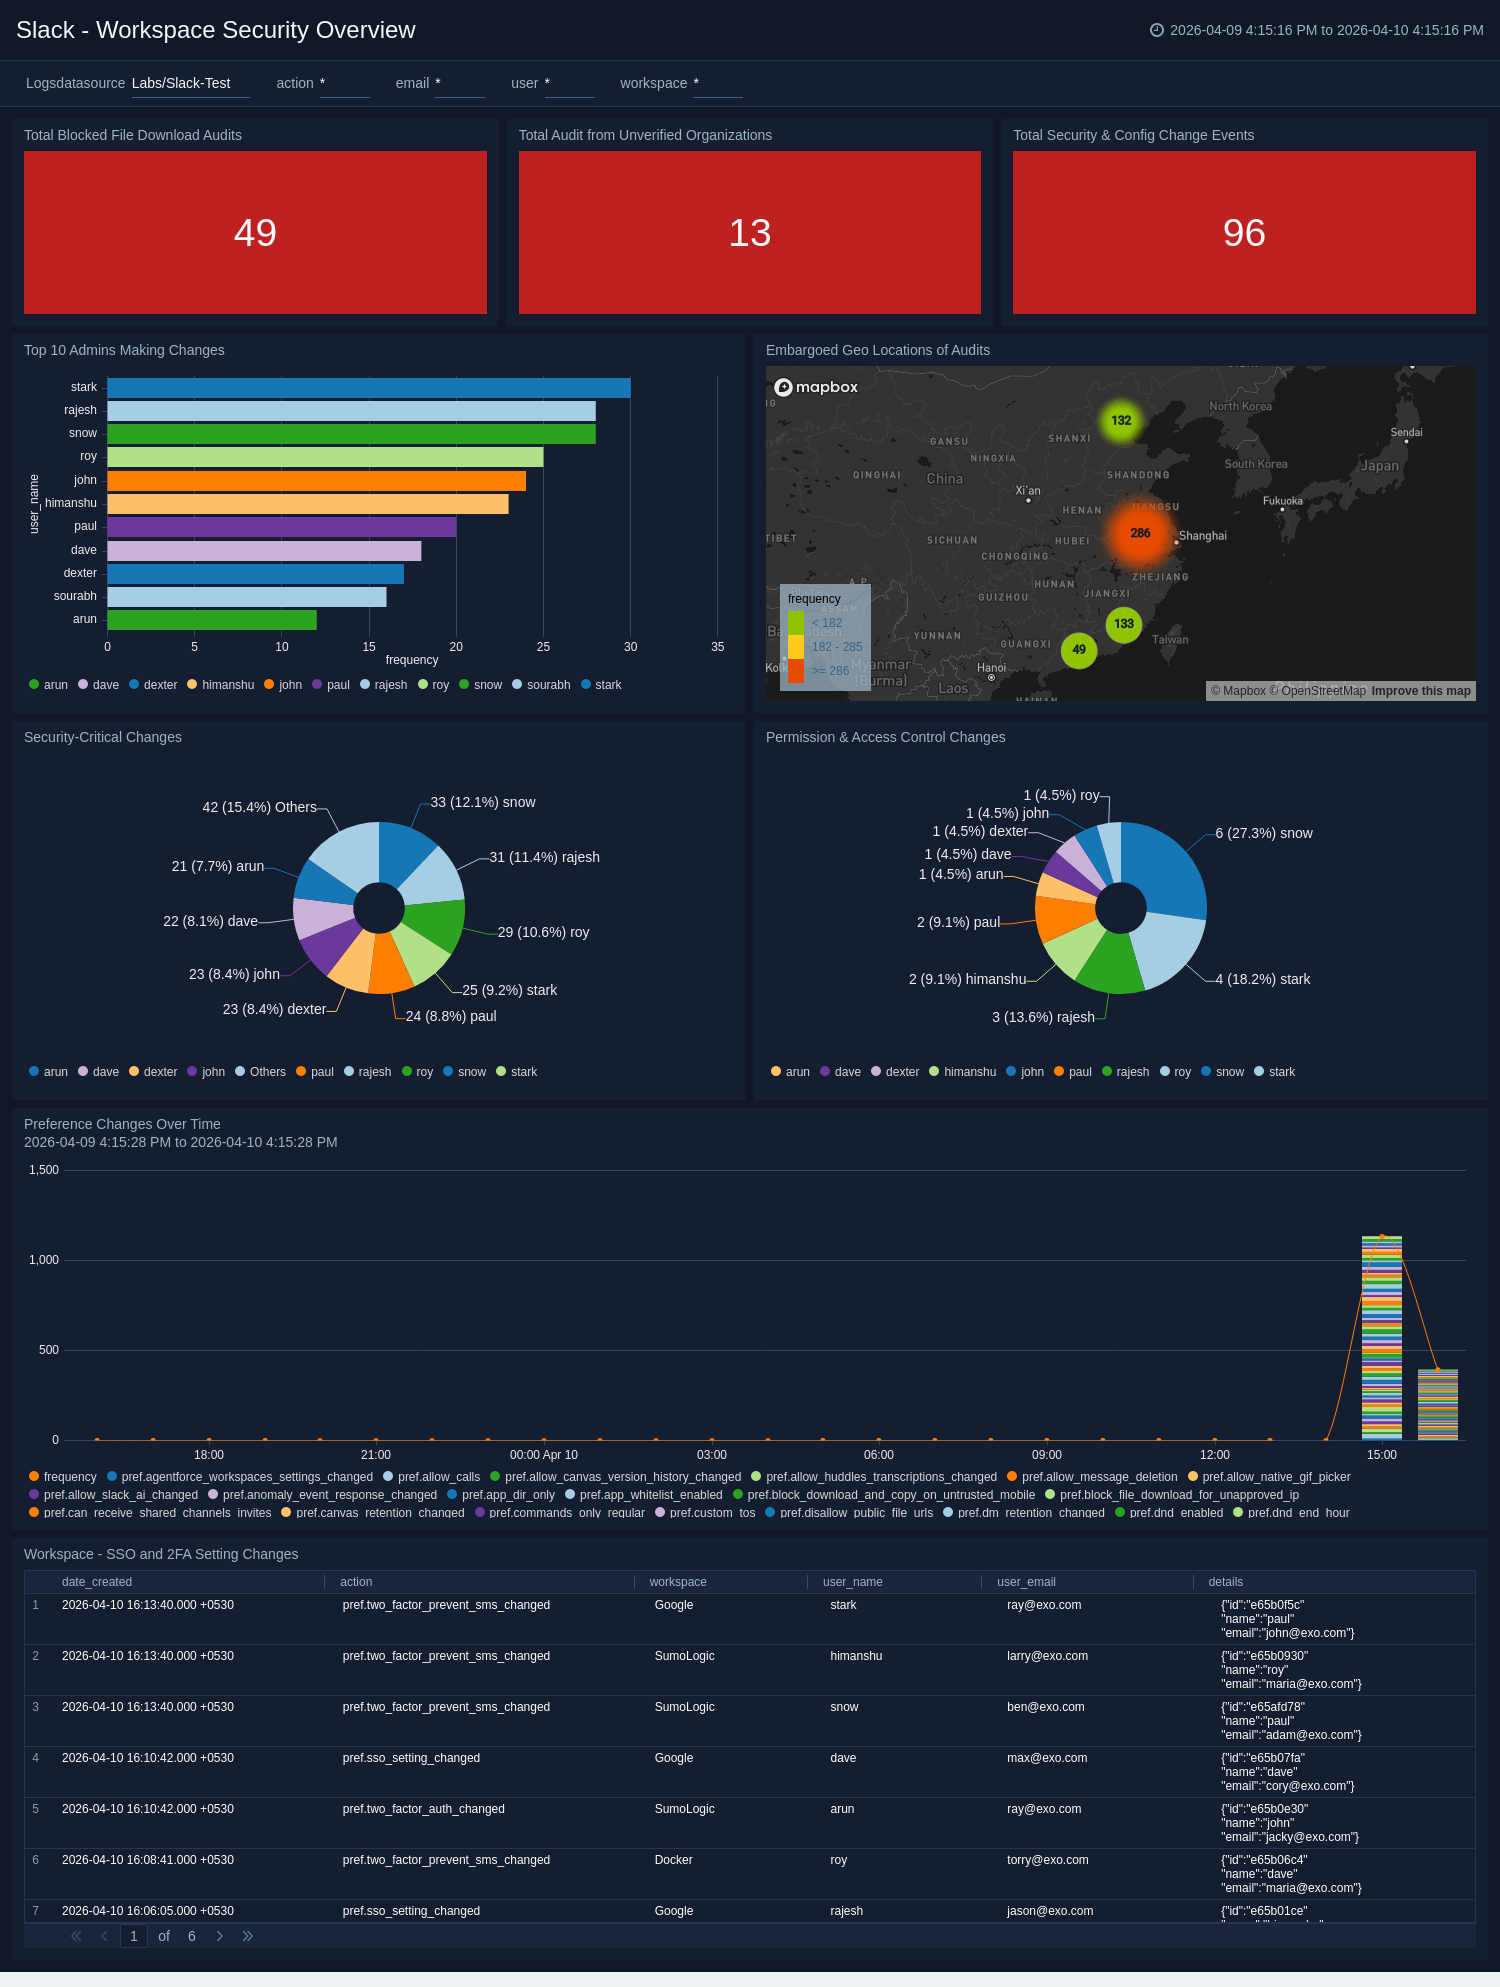
Workspace Security Overview
The Slack - Workspace Security Overview dashboard tracks critical workspace-level security activities, including SSO and 2FA setting changes, embargoed access locations, and permission updates.
Use this dashboard to:
- Monitor configuration changes affecting workspace security.
- Identify unverified organization audits or embargoed access.
- Review administrative and permission changes impacting access control.
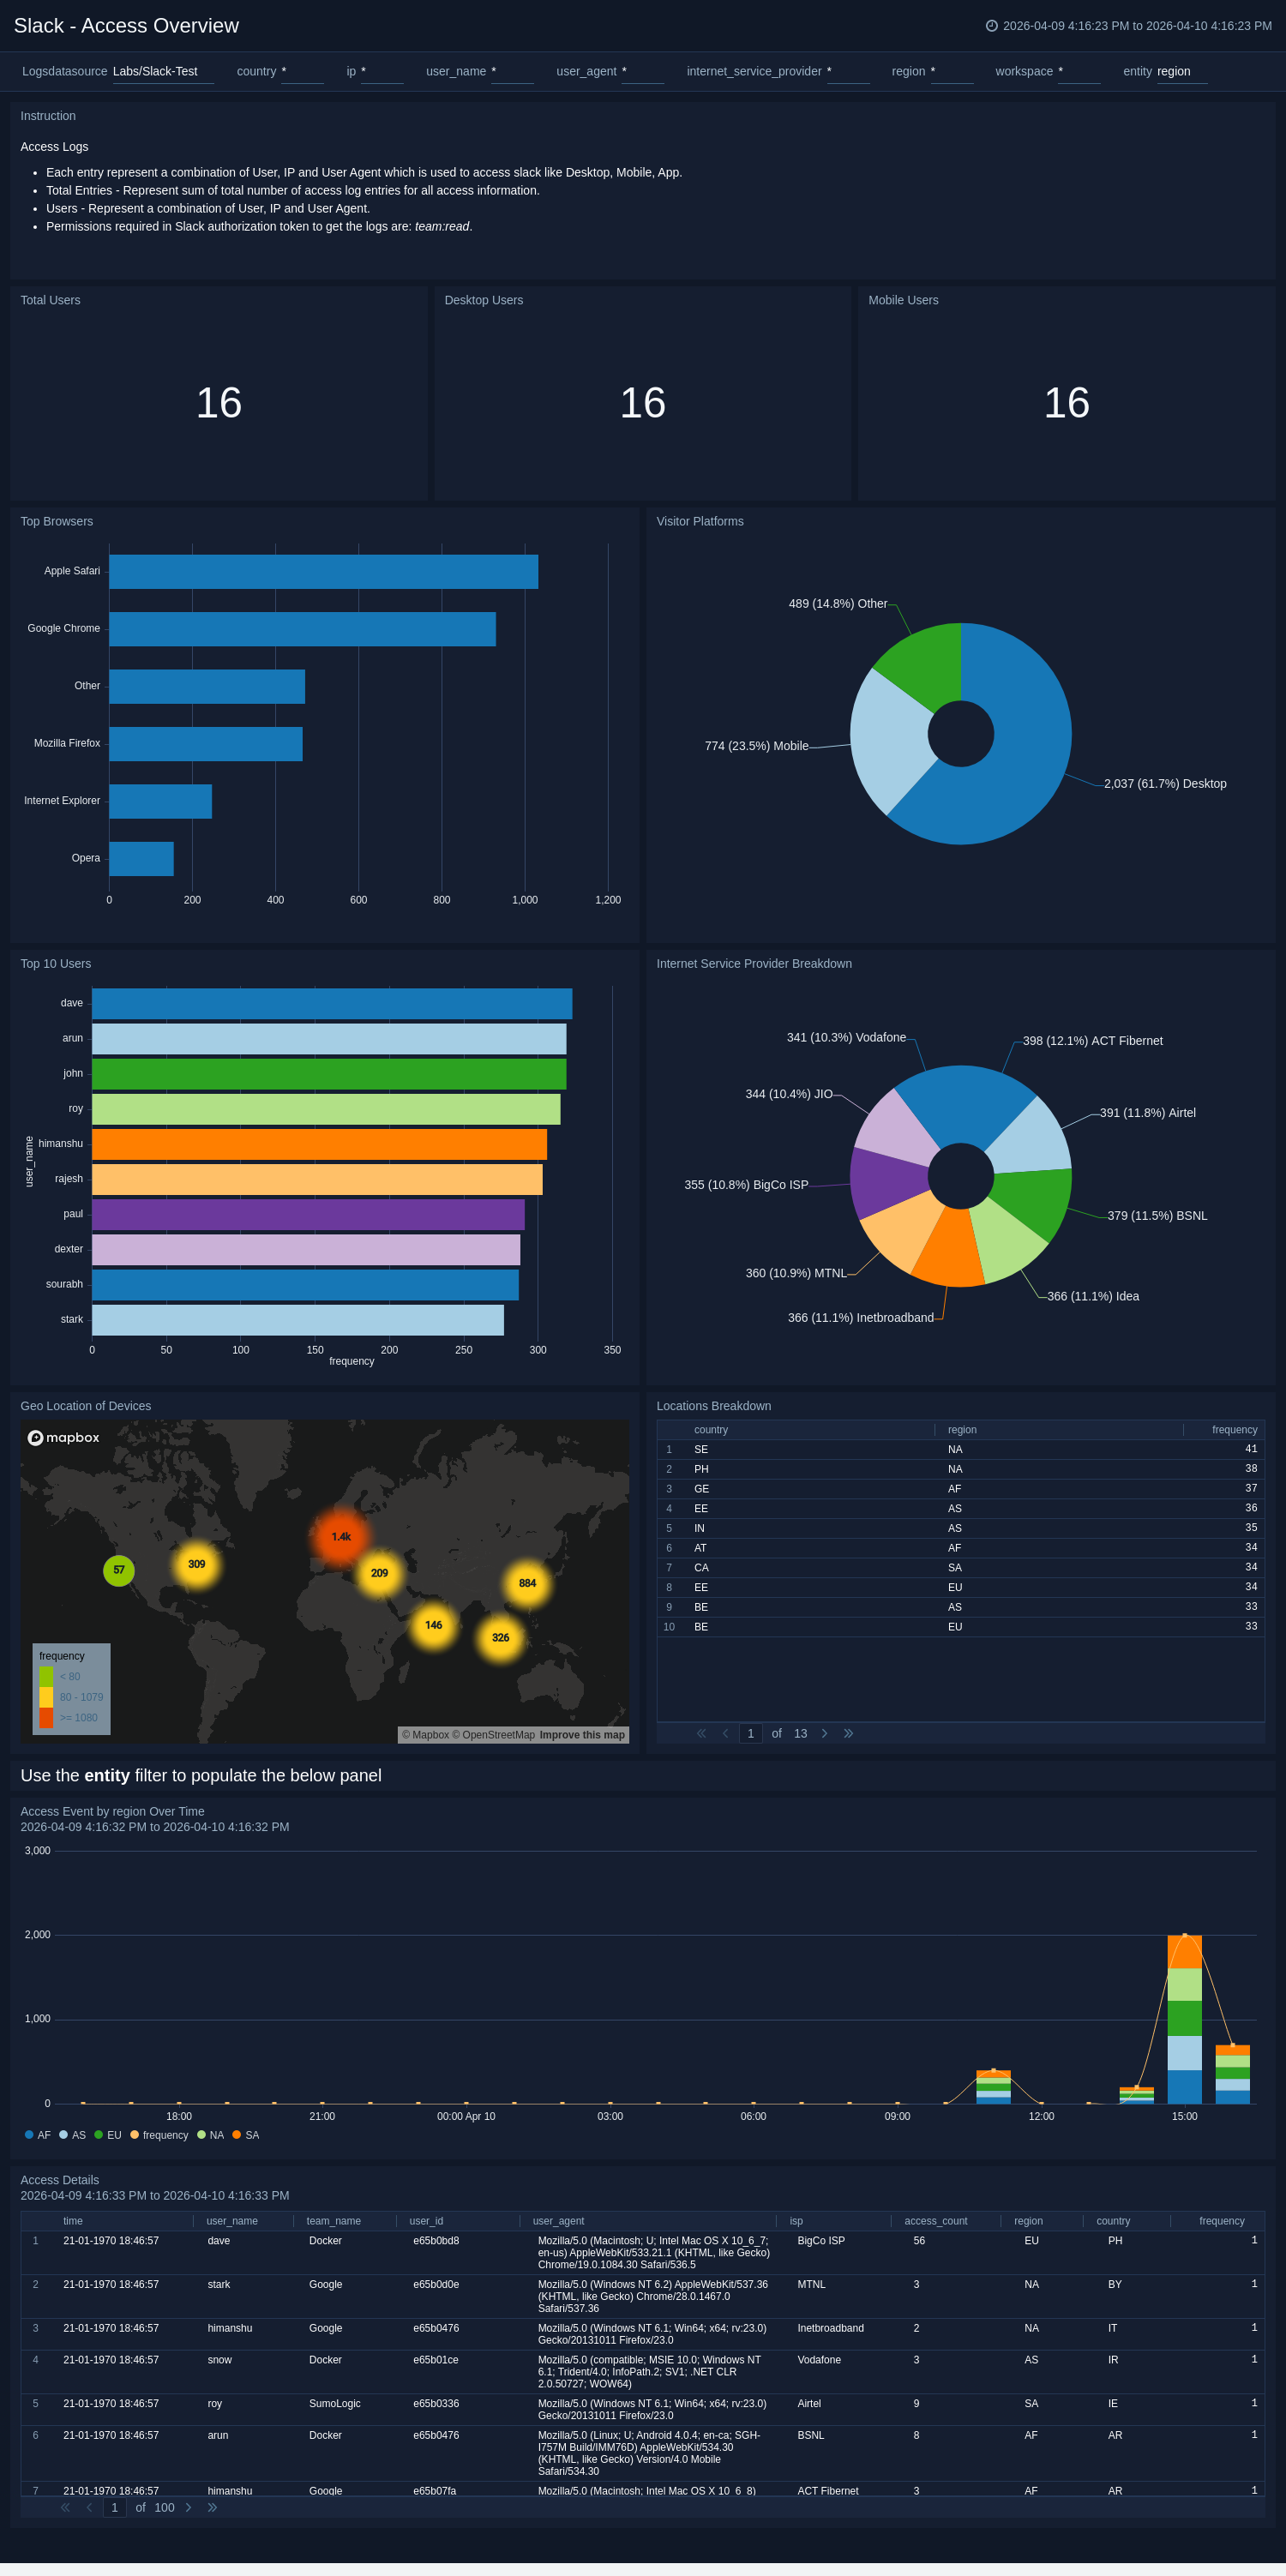
Access Overview
The Slack - Access Overview dashboard analyzes how users connect to Slack—by device, platform, browser, or ISP—and visualizes usage trends and geographic access points.
Use this dashboard to:
- Monitor where and how users access Slack.
- Identify mobile, desktop, and web usage trends.
- Detect unusual access behavior or new connection sources.
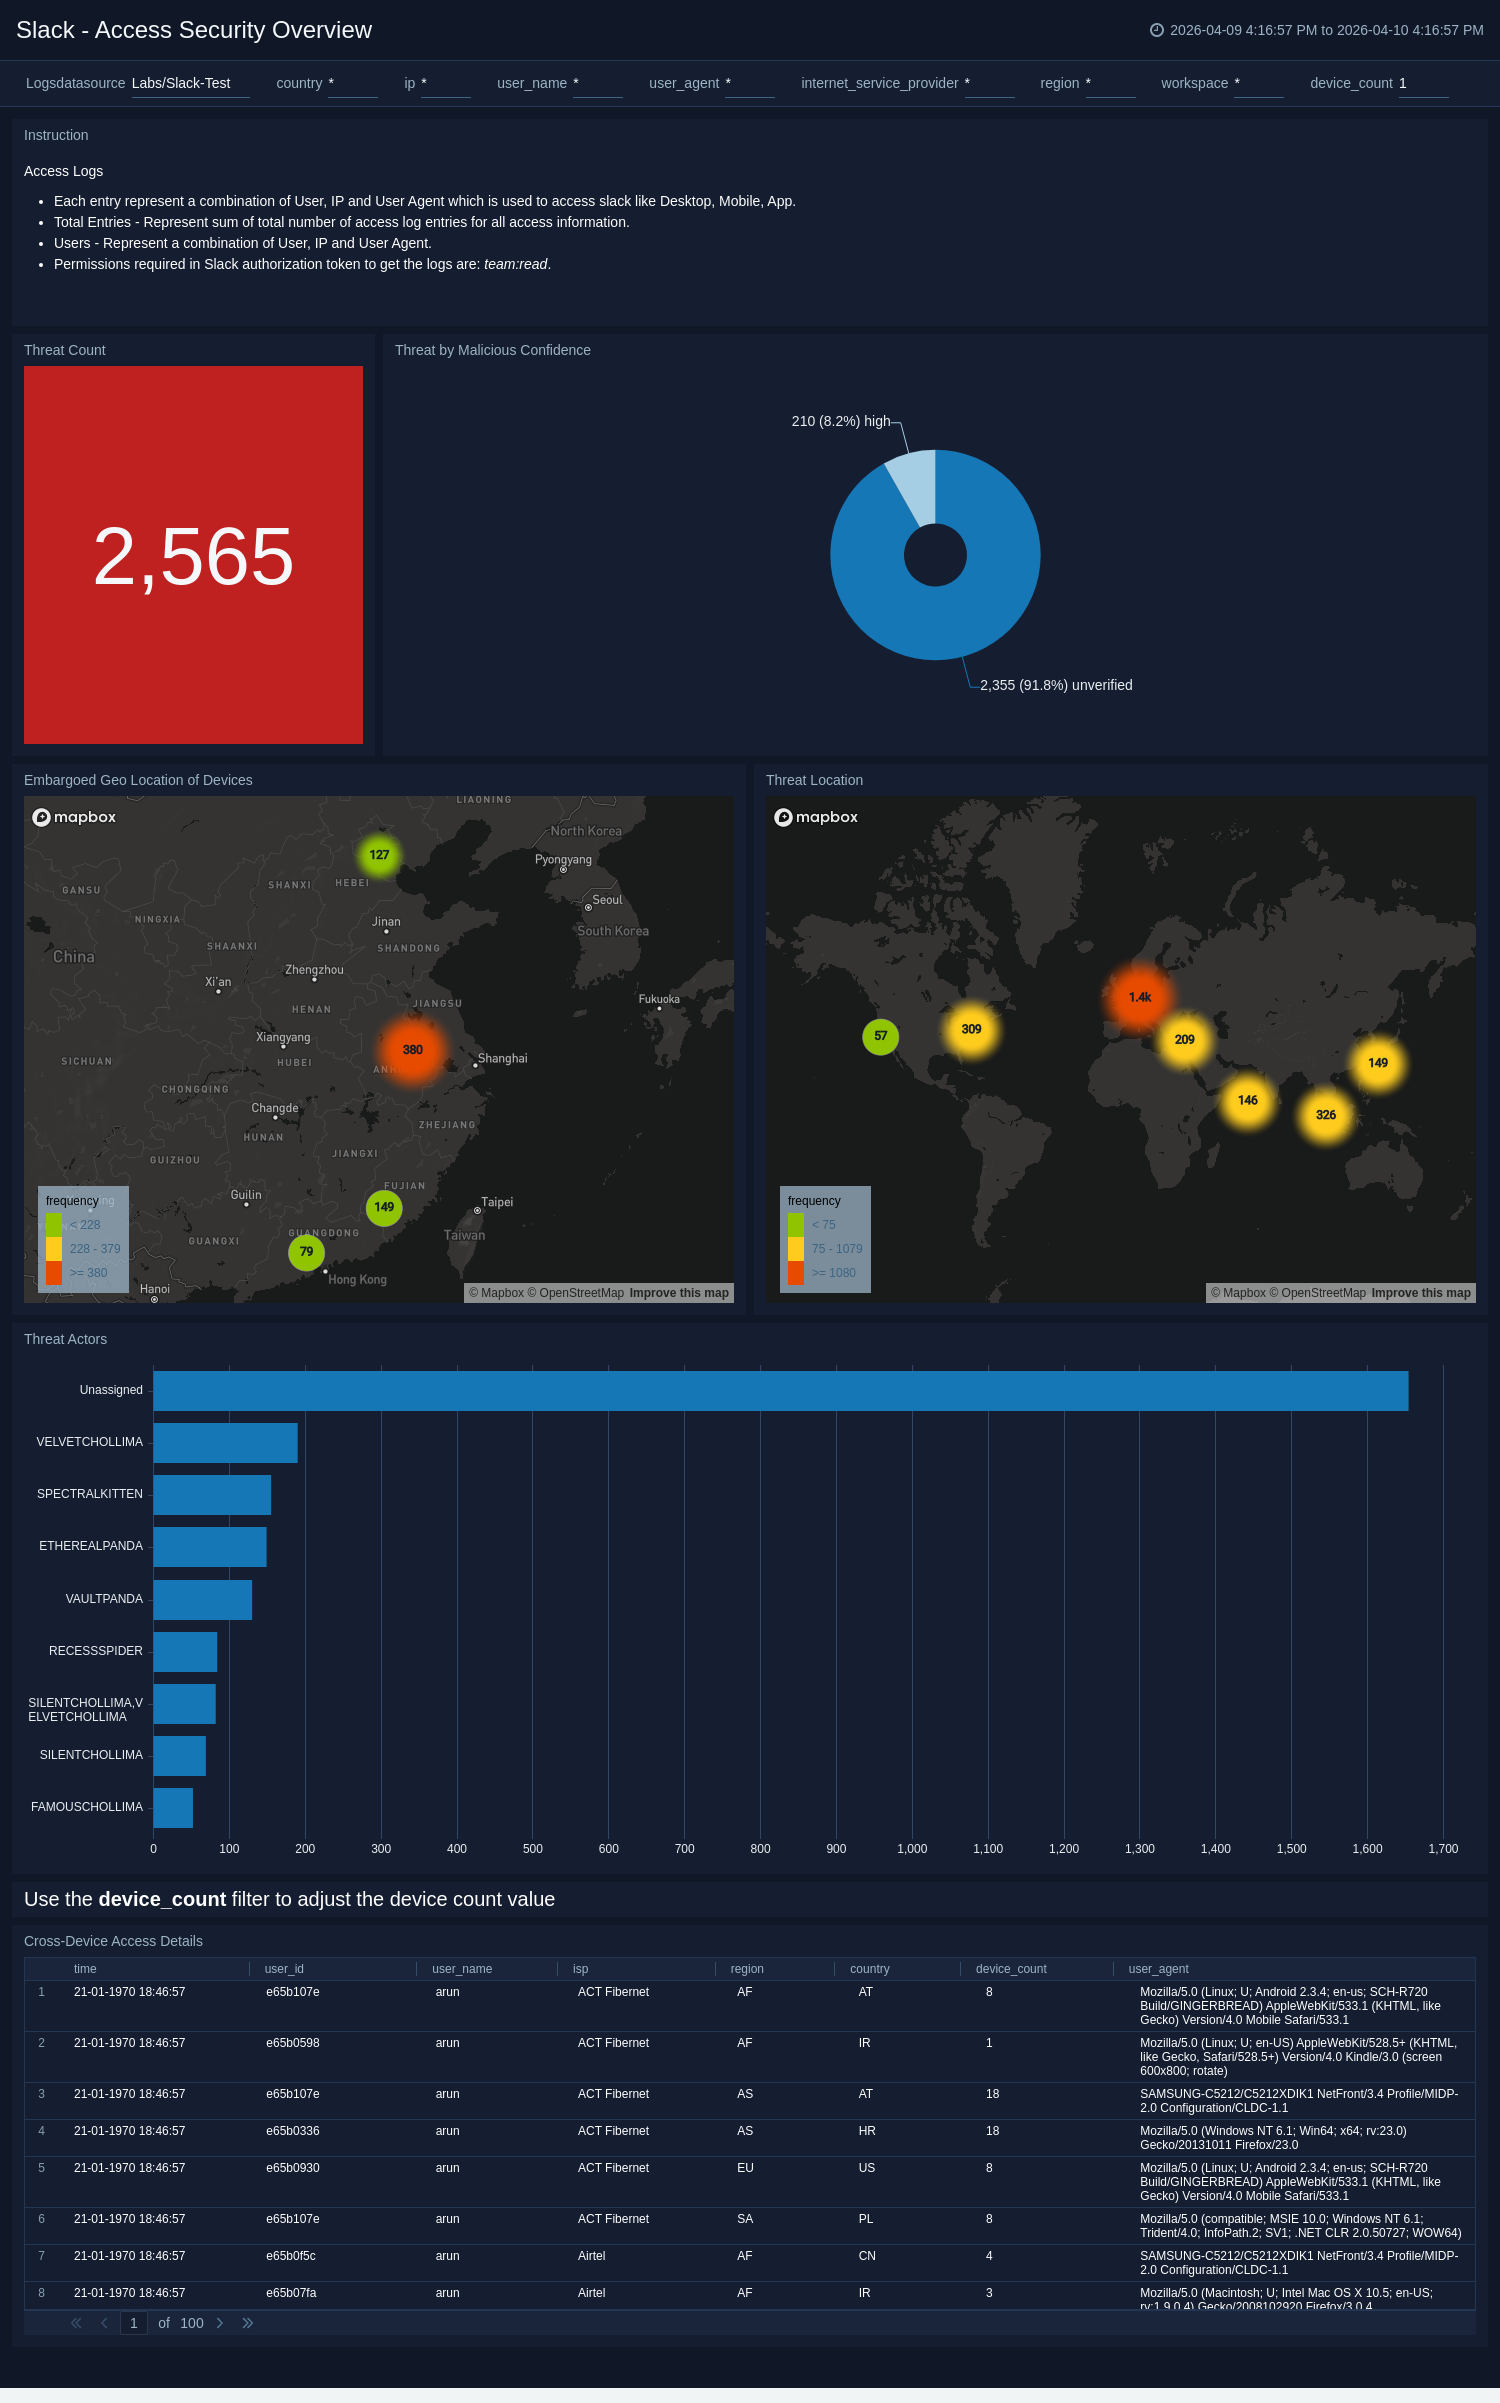
Access Security Overview
The Slack - Access Security Overview dashboard highlights security threats tied to Slack access. It categorizes threats by actor, location, and confidence level, while tracking suspicious cross-device or embargoed logins.
Use this dashboard to:
- Identify access-related threats and their sources.
- Monitor activity from embargoed or unusual locations.
- Correlate malicious confidence scores with actor behavior.
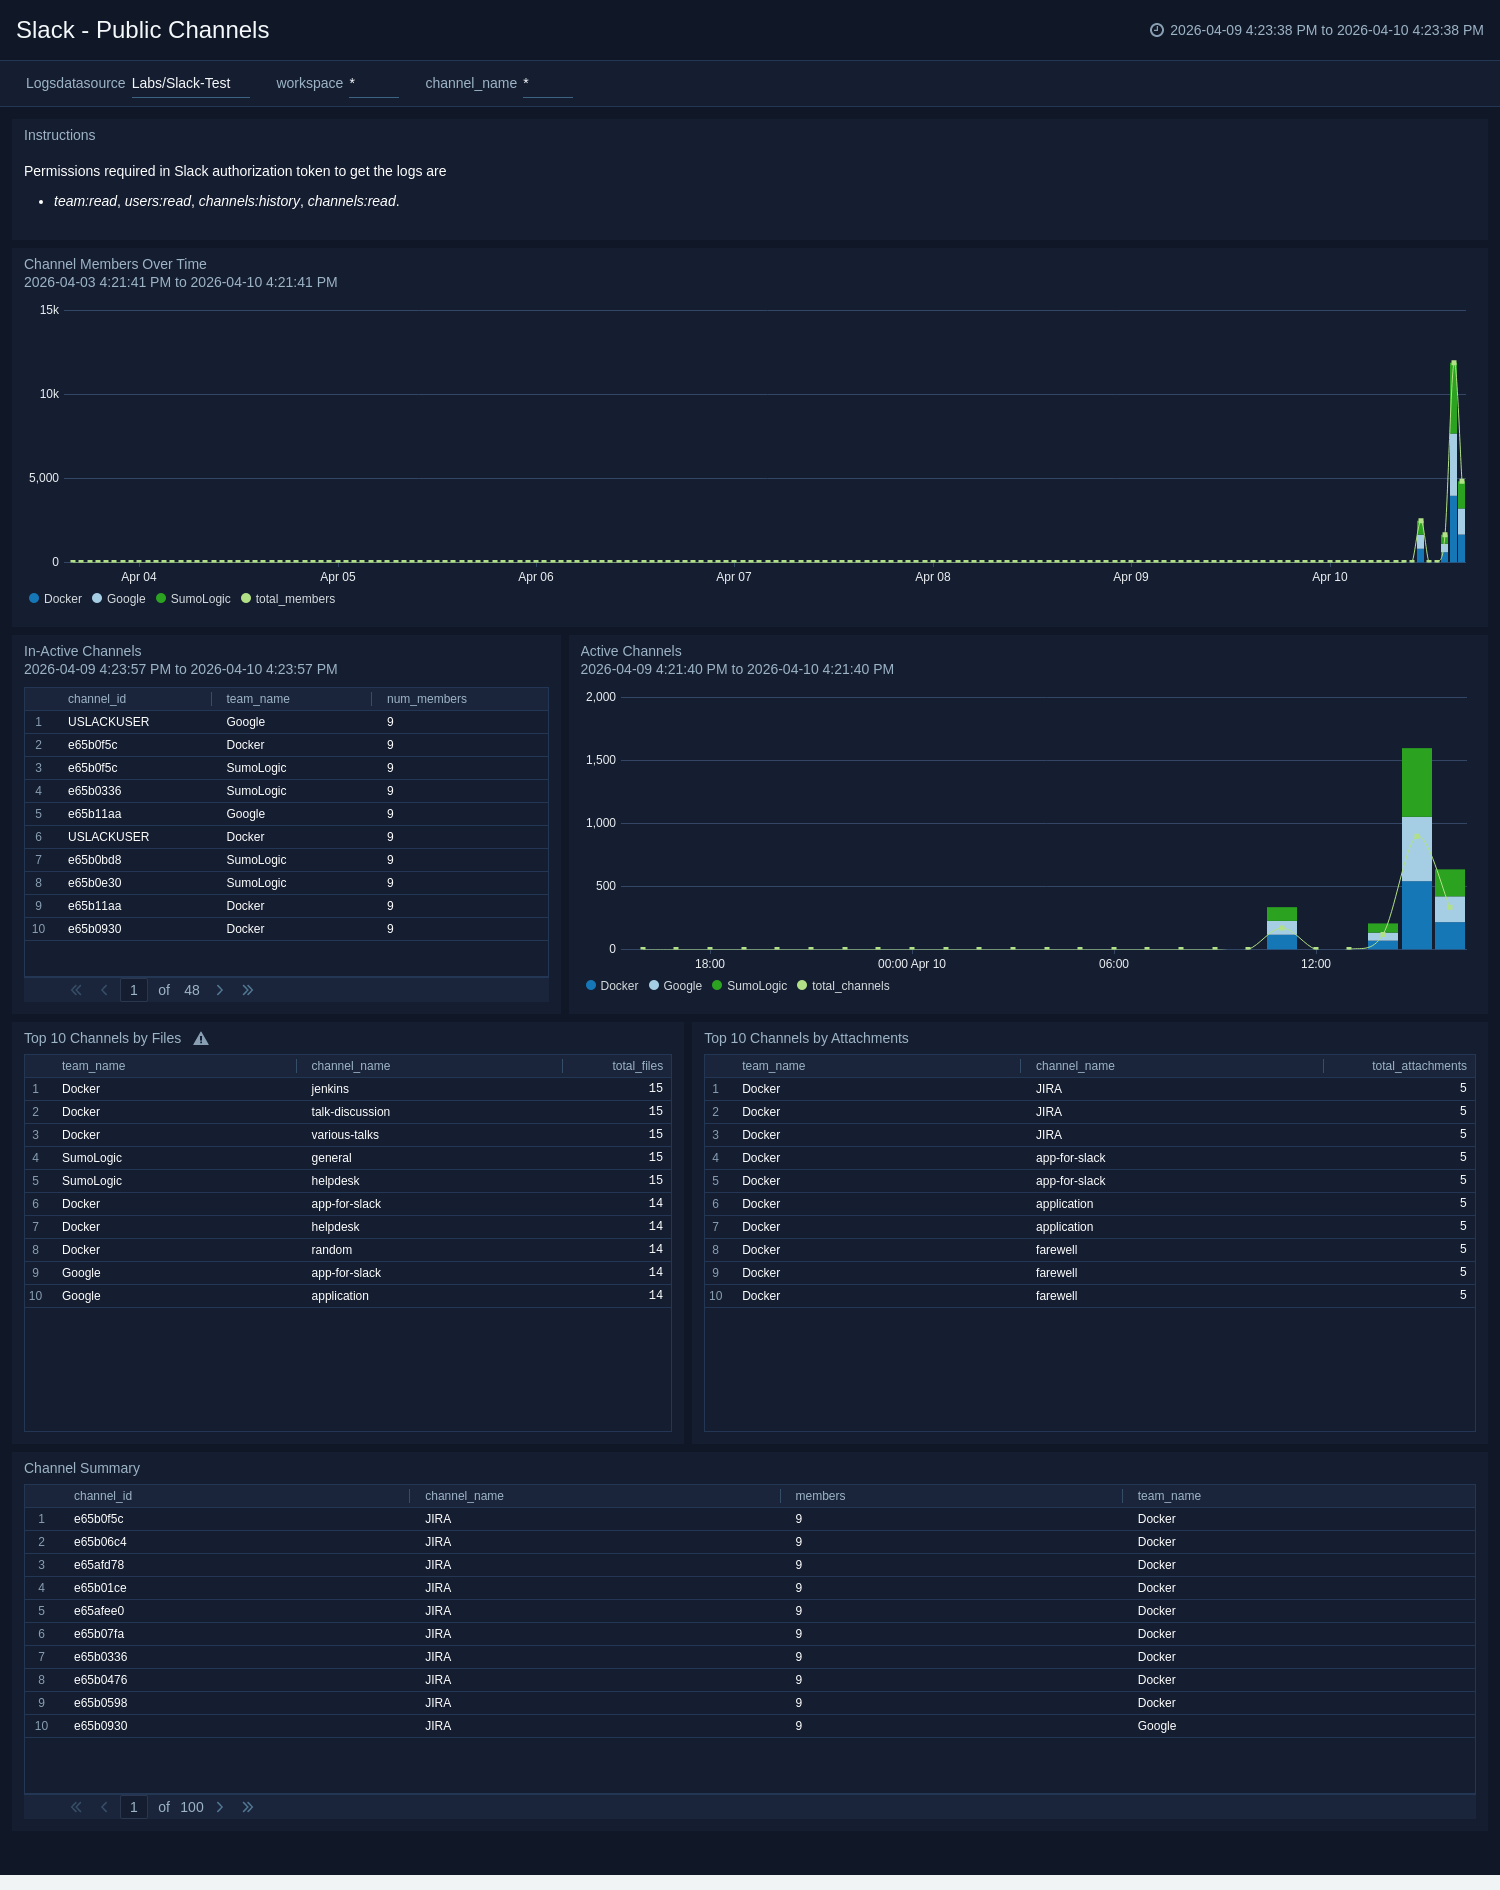
Public Channels
The Slack - Public Channels dashboard tracks engagement and file activity within public channels. It identifies active and inactive channels and highlights those with the most attachments and shared files.
Use this dashboard to:
- Monitor overall public channel activity and participation.
- Identify top channels contributing to collaboration.
- Assess file-sharing trends across public channels.
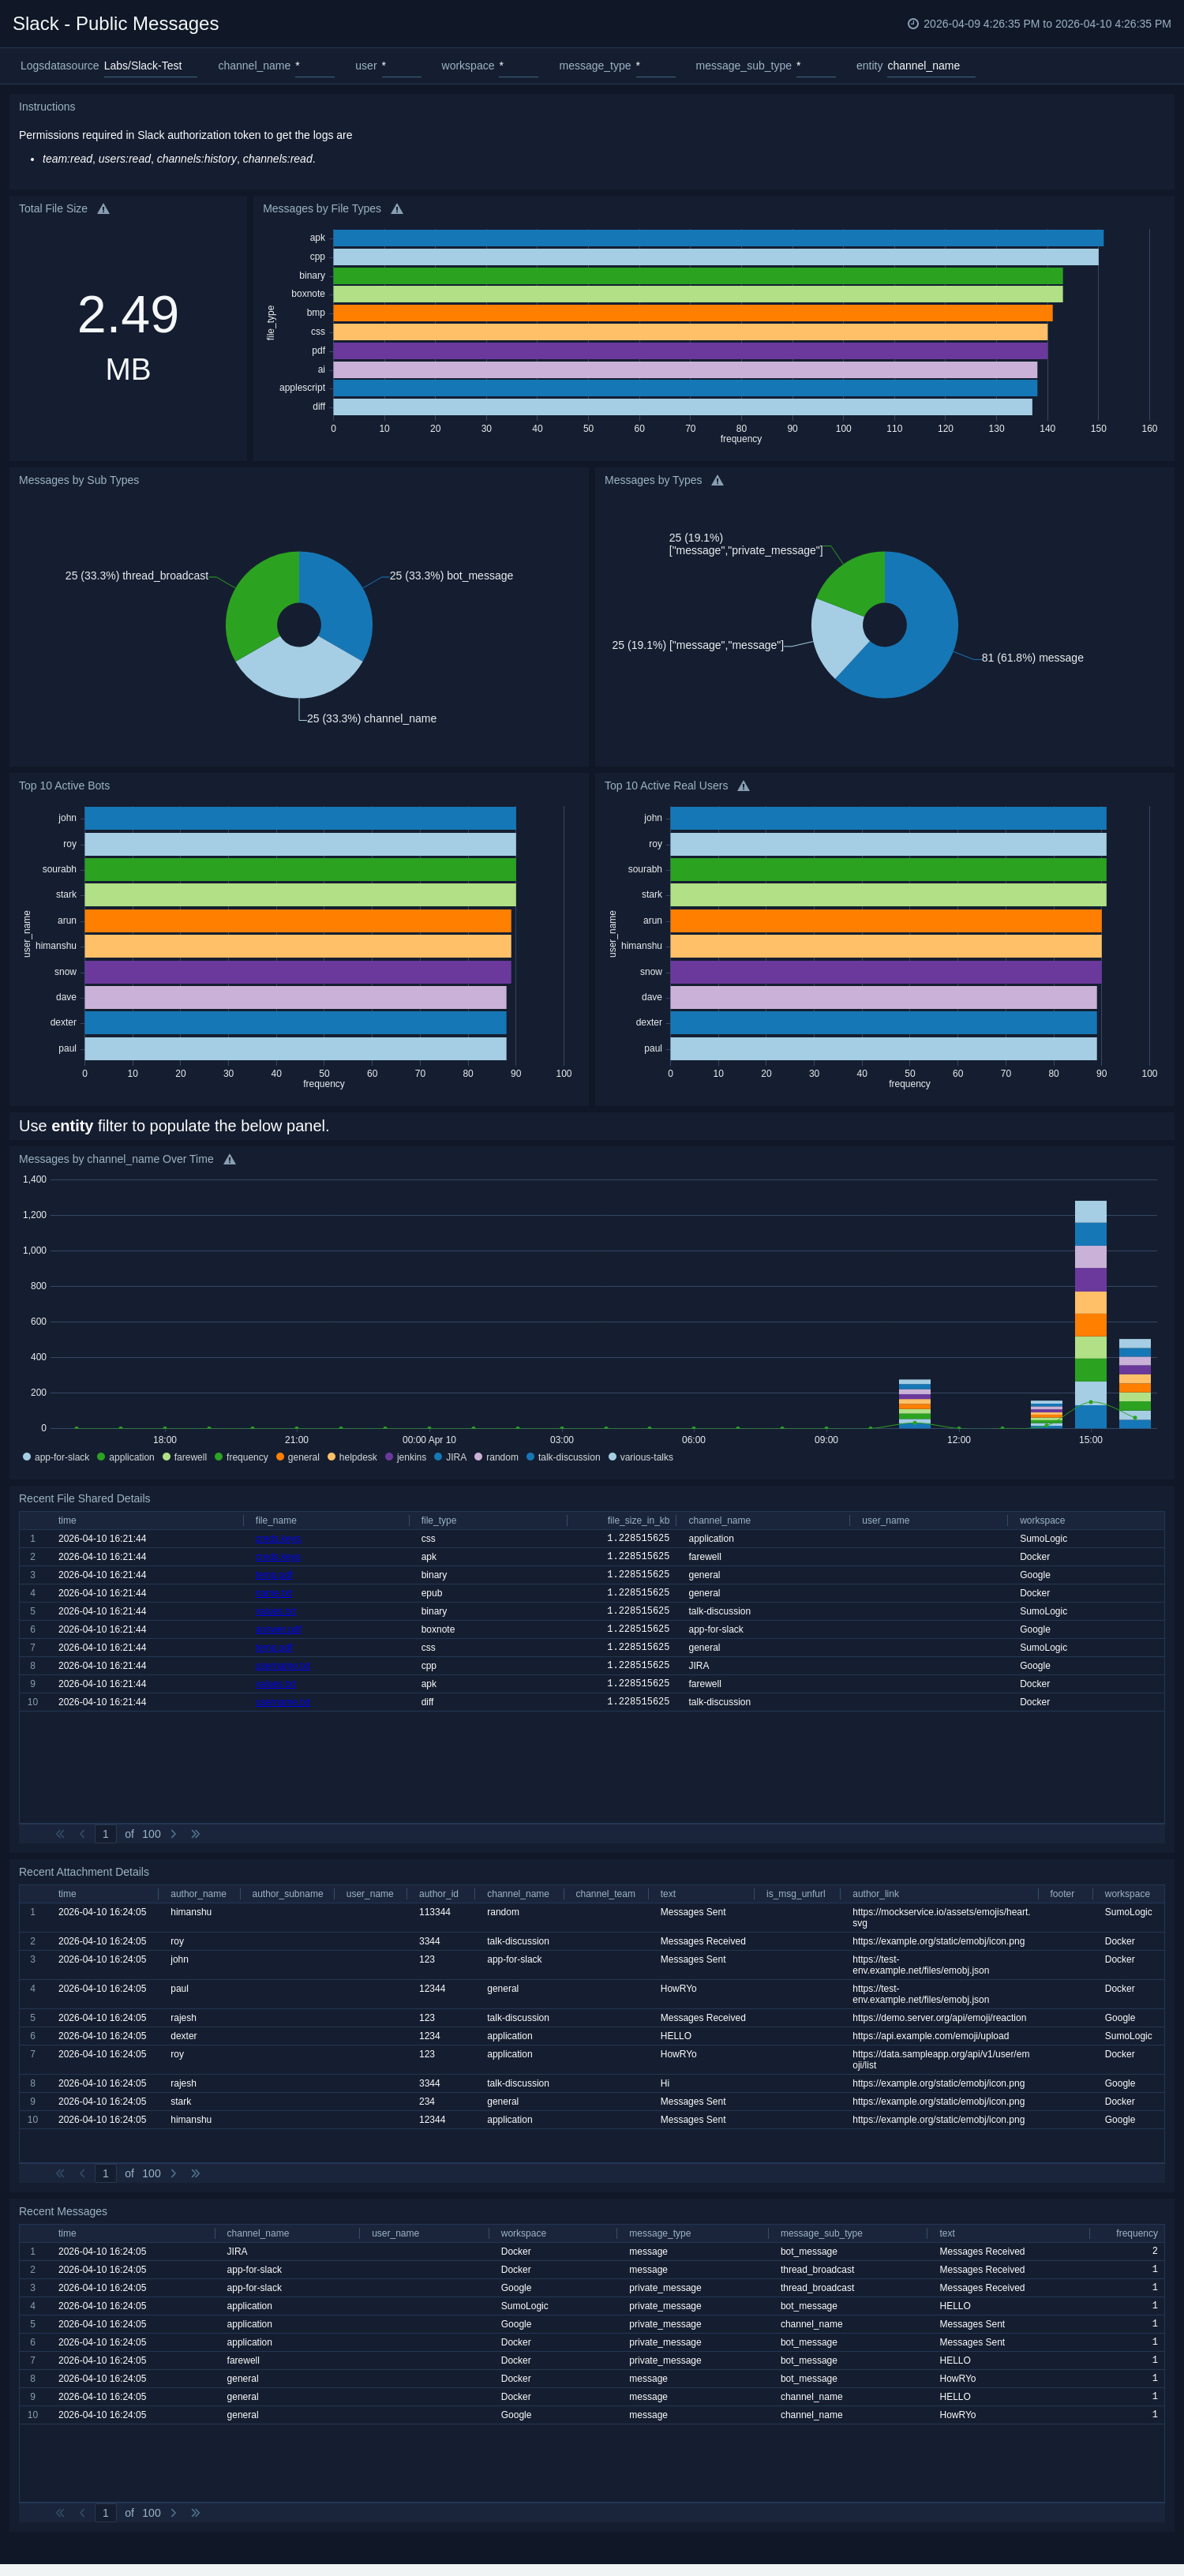
Public Messages
The Slack - Public Messages dashboard provides visibility into message and file-sharing activity within public channels. It includes statistics on message volumes, attachments, and file types, along with detailed message and file metadata.
Use this dashboard to:
- Track message and attachment activity across public channels.
- Analyze file type trends and message volume changes over time.
- Review recent message and file details for audit purposes.
Create monitors for Slack app
From your App Catalog:
- From the Sumo Logic navigation, select App Catalog.
- In the Search Apps field, search for and then select your app.
- Make sure the app is installed.
- Navigate to What's Included tab and scroll down to the Monitors section.
- Click Create next to the pre-configured monitors. In the create monitors window, adjust the trigger conditions and notifications settings based on your requirements.
- Scroll down to Monitor Details.
- Under Location click on New Folder.
note
By default, monitor will be saved in the root folder. So to make the maintenance easier, create a new folder in the location of your choice.
- Enter Folder Name. Folder Description is optional.
tip
Using app version in the folder name will be helpful to determine the versioning for future updates.
- Click Create. Once the folder is created, click on Save.
Slack alerts
| Name | Description | Alert Condition | Recover Condition |
|---|---|---|---|
Slack - Audit Event Detected from Embargoed Geo Location | This alert is triggered when Slack audit log events originate from embargoed or restricted regions. The audit activity can span across multiple entity types, including users, apps, workspaces, canvases, channels, and files. Such activity may indicate potential policy violations, compromised credentials, or attempts to bypass geographic controls. | Count > 0 | Count < = 0 |
Slack - Blocked File Download Detected | This alert is triggered when Slack blocks a file download due to security or policy restrictions, helping identify potential policy violations or unauthorized data access. | Count > 0 | Count < = 0 |
Slack - Malicious File Activity Detected | This alert is triggered when Slack detects file activity flagged as malicious or suspicious. File-based threats in Slack can span across channels, direct messages, and workspaces, making it a common vector for malware propagation and data exfiltration. Security teams should investigate the associated file, user account, and session context immediately upon trigger. | Count > 0 | Count < = 0 |
Slack - Multiple Device Access Activity Detected | This alert is triggered when a Slack user account is accessed from multiple devices within a short time window, suggesting possible credential sharing or account compromise. | Count > 0 | Count < = 0 |
Slack - Repeated Failed Login or Logout Activity Detected | This alert is triggered when repeated failed login or logout attempts occur on a Slack user account, indicating potential brute-force or credential-stuffing attacks. | Count > 5 | Count < = 5 |
Upgrade/Downgrade the Slack app (Optional)
To update the app, do the following:
Next-Gen App: To install or update the app, you must be an account administrator or a user with Manage Apps, Manage Monitors, Manage Fields, Manage Metric Rules, and Manage Collectors capabilities depending upon the different content types part of the app.
- Select App Catalog.
- In the Search Apps field, search for and then select your app.
Optionally, you can identify apps that can be upgraded in the Upgrade available section. - To upgrade the app, select Upgrade from the Manage dropdown.
- If the upgrade does not have any configuration or property changes, you will be redirected to the Preview & Done section.
- If the upgrade has any configuration or property changes, you will be redirected to the Setup Data page.
- In the Configure section of your respective app, complete the following fields.
- Field Name. If you already have collectors and sources set up, select the configured metadata field name (eg _sourcecategory) or specify other custom metadata (eg: _collector) along with its metadata Field Value.
- Click Next. You will be redirected to the Preview & Done section.
Post-update
Your upgraded app will be installed in the Installed Apps folder and dashboard panels will start to fill automatically.
See our Release Notes changelog for new updates in the app.
To revert the app to a previous version, do the following:
- Select App Catalog.
- In the Search Apps field, search for and then select your app.
- To version down the app, select Revert to < previous version of your app > from the Manage dropdown.
Uninstalling the Slack app (Optional)
To uninstall the app, do the following:
- Select App Catalog.
- In the 🔎 Search Apps field, run a search for your desired app, then select it.
- Click Uninstall.