Workday

The Sumo Logic app for Workday provides insights into authentication activity, user activity, and administrator activity. The pre-configured dashboards help identify events that identify compliance and incident reporting, common security events, and real-time analysis of suspicious activities.
Workday is a cloud-based ERP system that manages business processes and allows organizations to use an integrated application. Workday is a coherent cloud ERP system for financial analysis, analytical solutions, HCM suites, and better business processes.
Log types
The Sumo Logic app for Workday collects all logs in JSON format. It uses the following two types of logs:
- SignOn Logs
- Activity Logs
Sample log messages
Workday app logs are all in JSON format. The Workday app uses two types of logs, and this section provides examples of the log types.
{
	"Request_Originator":"UI",
	"Session_End":"2020-02-16T00:07:52-08:00",
	"Signon":"wd-environments / Workday Production Automation: 2020 02 16 00 07 52 329 -0800",
	"Device_is_Trusted":"0",
	"Password_Changed":"0",
	"Session_Start":"2020-03-19T00:07:52-08:00",
	"Invalid_Credentials":"0",
	"Workday_Account":"wd-environments / Workday Production Automation",
	"Is_Device_Managed":"0",
	"Required_Multi-Factor":"0",
	"Failed_Signon":"0",
	"Session_IP_Address":"127.0.0.1",
	"Account_Locked__Disabled_or_Expired":"0",
	"Authentication_Type_for_Signon":"User Name Password",
	"Session_ID":"863734",
  "tenant_name":"SumoLogic"
}
{
	"activityAction":"READ",
	"systemAccount":"wd-environments",
	"requestTime":"2020-03-26T07:12:07.006Z",
	"taskDisplayName":"Workday System Status",
	"taskId":"dc3e4ee2446c11de98360015c5e6daf6",
	"sessionId":"d245fc",
	"ipAddress":"127.0.0.1",
  "tenant_name":"SumoLogic"
}
Sample queries
The query sample provided in this section is from the Failed Login Reasons panel of the Workday - Login Activity dashboard.
Parameters
Failed_Signon:*Authentication_Failure_Message:*
_sourceCategory=workday_logs and _sourceName=signonlogs
| json auto
| where Failed_Signon=1
| count by Authentication_Failure_Message
| if (isBlank(Authentication_Failure_Message), "Unknown", Authentication_Failure_Message) as Authentication_Failure_Message
| sort by _count
Before You Deploy
Sumo Logic collects data from the User Activity and Signon Activity Reports via the Workday APIs. Once data collection is set up, the data in the Sumo Logic platform is analyzed via the Workday app in the Sumo Logic App catalog.
User activity data is collected through the Workday Activity Logs API. To ensure that no sensitive information is being sent to Sumo Logic via this report, please run the “User Activity” Report and check the columns (specifically the Target column). If the data contains sensitive info, you can enable data masking for the security group created in the steps outlined below by following the instructions in this Workday doc.
Collection configuration and app installation
Depending on the set up collection method, you can configure and install the app in three ways:
- Create a new collector and install the app. Create a new Sumo Logic Cloud-to-Cloud (C2C) source under a new Sumo Logic Collector and later install the app, or
- Use an existing collector and install the app. Create a new Sumo Logic Cloud-to-Cloud (C2C) source under an existing Sumo Logic Collector and later install the app, or
- Use existing source and install the app. Use your existing configured Sumo Logic Cloud-to-Cloud (C2C) source and install the app.
Use the Cloud-to-Cloud Integration for Workday to create the source and use the same source category while installing the app. By following these steps, you can ensure that your Workday app is properly integrated and configured to collect and analyze your Workday data.
Create a new collector and install the app
To set up collection and install the app, do the following:
Next-Gen App: To install or update the app, you must be an account administrator or a user with Manage Apps, Manage Monitors, Manage Fields, Manage Metric Rules, and Manage Collectors capabilities depending upon the different content types part of the app.
- Select App Catalog.
- In the 🔎 Search Apps field, run a search for your desired app, then select it.
- Click Install App.
note
Sometimes this button says Add Integration.
- In the Set Up Collection section of your respective app, select Create a new Collector.
- Collector Name. Enter a Name to display the Source in the Sumo Logic web application. The description is optional.
- Timezone. Set the default time zone when it is not extracted from the log timestamp. Time zone settings on Sources override a Collector time zone setting.
- (Optional) Metadata. Click the +Add Metadata link to add a custom log Metadata Fields. Define the fields you want to associate, each metadata field needs a name (key) and value.
 A green circle with a checkmark is shown when the field exists and is enabled in the Fields table schema.
 An orange triangle with an exclamation point is shown when the field doesn't exist, or is disabled in the Fields table schema. In this case, you'll see an option to automatically add or enable the nonexistent fields to the Fields table schema. If a field is sent to Sumo Logic but isn’t present or enabled in the schema, it’s ignored and marked as Dropped.
- Click Next.
- Configure the source as specified in the
Infobox above, ensuring all required fields are included. - In the Configure section of your respective app, complete the following fields.
- Field Name. If you already have collectors and sources set up, select the configured metadata field name (eg _sourcecategory) or specify other custom metadata (eg: _collector) along with its metadata Field Value.
- Click Next. You will be redirected to the Preview & Done section.
Post-installation
Once your app is installed, it will appear in your Installed Apps folder, and dashboard panels will start to fill automatically.
Each panel slowly fills with data matching the time range query received since the panel was created. Results will not immediately be available but will be updated with full graphs and charts over time.
Use an existing collector and install the app
To set up the source in the existing collector and install the app, do the following:
Next-Gen App: To install or update the app, you must be an account administrator or a user with Manage Apps, Manage Monitors, Manage Fields, Manage Metric Rules, and Manage Collectors capabilities depending upon the different content types part of the app.
- Select App Catalog.
- In the 🔎 Search Apps field, run a search for your desired app, then select it.
- Click Install App.
note
Sometimes this button says Add Integration.
- In the Set Up Collection section of your respective app, select Use an existing Collector.
- From the Select Collector dropdown, select the collector that you want to set up your source with and click Next.
- Configure the source as specified in the
Infobox above, ensuring all required fields are included. - In the Configure section of your respective app, complete the following fields.
- Field Name. If you already have collectors and sources set up, select the configured metadata field name (eg _sourcecategory) or specify other custom metadata (eg: _collector) along with its metadata Field Value.
- Click Next. You will be redirected to the Preview & Done section.
Post-installation
Once your app is installed, it will appear in your Installed Apps folder, and dashboard panels will start to fill automatically.
Each panel slowly fills with data matching the time range query received since the panel was created. Results will not immediately be available but will be updated with full graphs and charts over time.
Use an existing source and install the app
To skip collection and only install the app, do the following:
Next-Gen App: To install or update the app, you must be an account administrator or a user with Manage Apps, Manage Monitors, Manage Fields, Manage Metric Rules, and Manage Collectors capabilities depending upon the different content types part of the app.
- Select App Catalog.
- In the 🔎 Search Apps field, run a search for your desired app, then select it.
- Click Install App.
note
Sometimes this button says Add Integration.
- In the Set Up Collection section of your respective app, select Skip this step and use existing source and click Next.
- In the Configure section of your respective app, complete the following fields.
- Field Name. If you already have collectors and sources set up, select the configured metadata field name (eg _sourcecategory) or specify other custom metadata (eg: _collector) along with its metadata Field Value.
- Click Next. You will be redirected to the Preview & Done section.
Post-installation
Once your app is installed, it will appear in your Installed Apps folder, and dashboard panels will start to fill automatically.
Each panel slowly fills with data matching the time range query received since the panel was created. Results will not immediately be available but will be updated with full graphs and charts over time.
Viewing the Workday dashboards
All dashboards have a set of filters that you can apply to the entire dashboard. Use these filters to drill down and examine the data to a granular level.
- You can change the time range for a dashboard or panel by selecting a predefined interval from a drop-down list, choosing a recently used time range, or specifying custom dates and times. Learn more.
- You can use template variables to drill down and examine the data on a granular level. For more information, see Filtering Dashboards with Template Variables.
- Most Next-Gen apps allow you to provide the scope at the installation time and are comprised of a key (
_sourceCategoryby default) and a default value for this key. Based on your input, the app dashboards will be parameterized with a dashboard variable, allowing you to change the dataset queried by all panels. This eliminates the need to create multiple copies of the same dashboard with different queries.
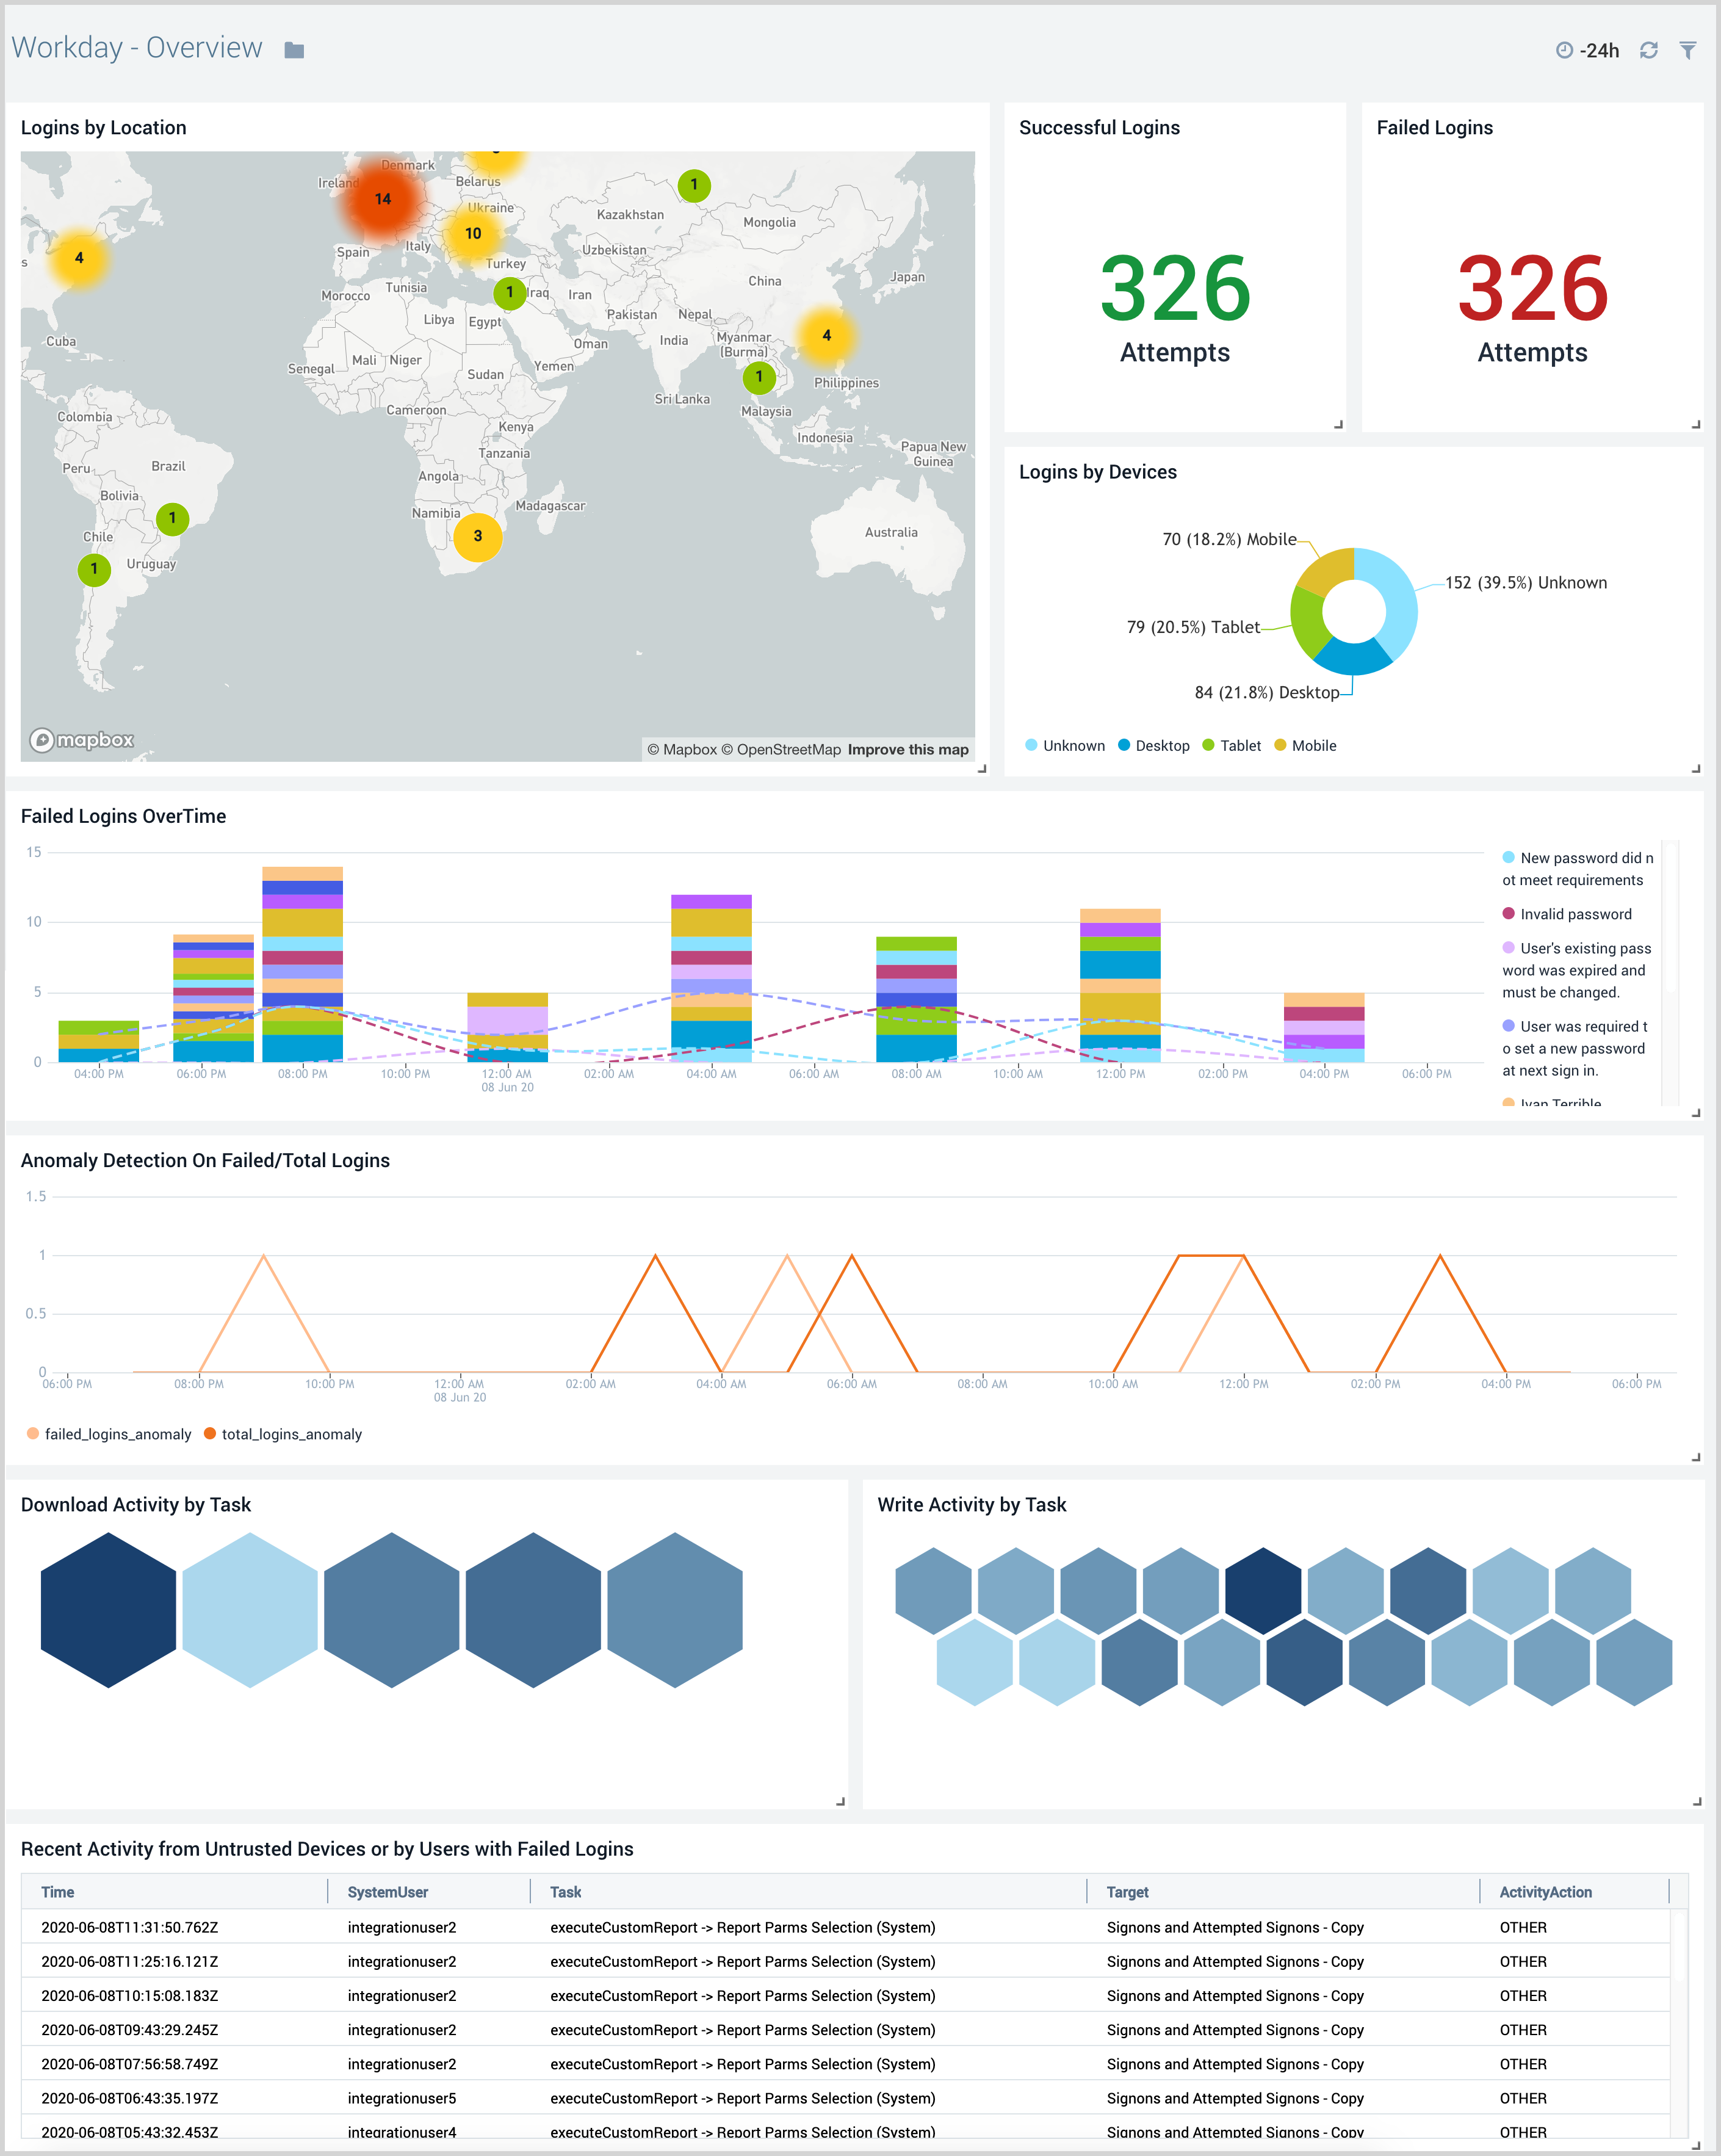
Overview
The Workday - Overview dashboard provides an at-a-glance view of the security posture of your Workday instance. This panel identifies login activity, user activity, and activity from untrusted devices or users with failed logins. It also helps you in monitoring failed logins by devices and the recent activities from untrusted devices.
Use this dashboard to:
- Quickly identify anomalous increases in total and failed logins.
- Monitor recent user activities from untrusted devices and users with multiple failed login attempts to determine the extent of a potential breach.
- Quickly identify if users are logging in from expected locations and using supported devices.
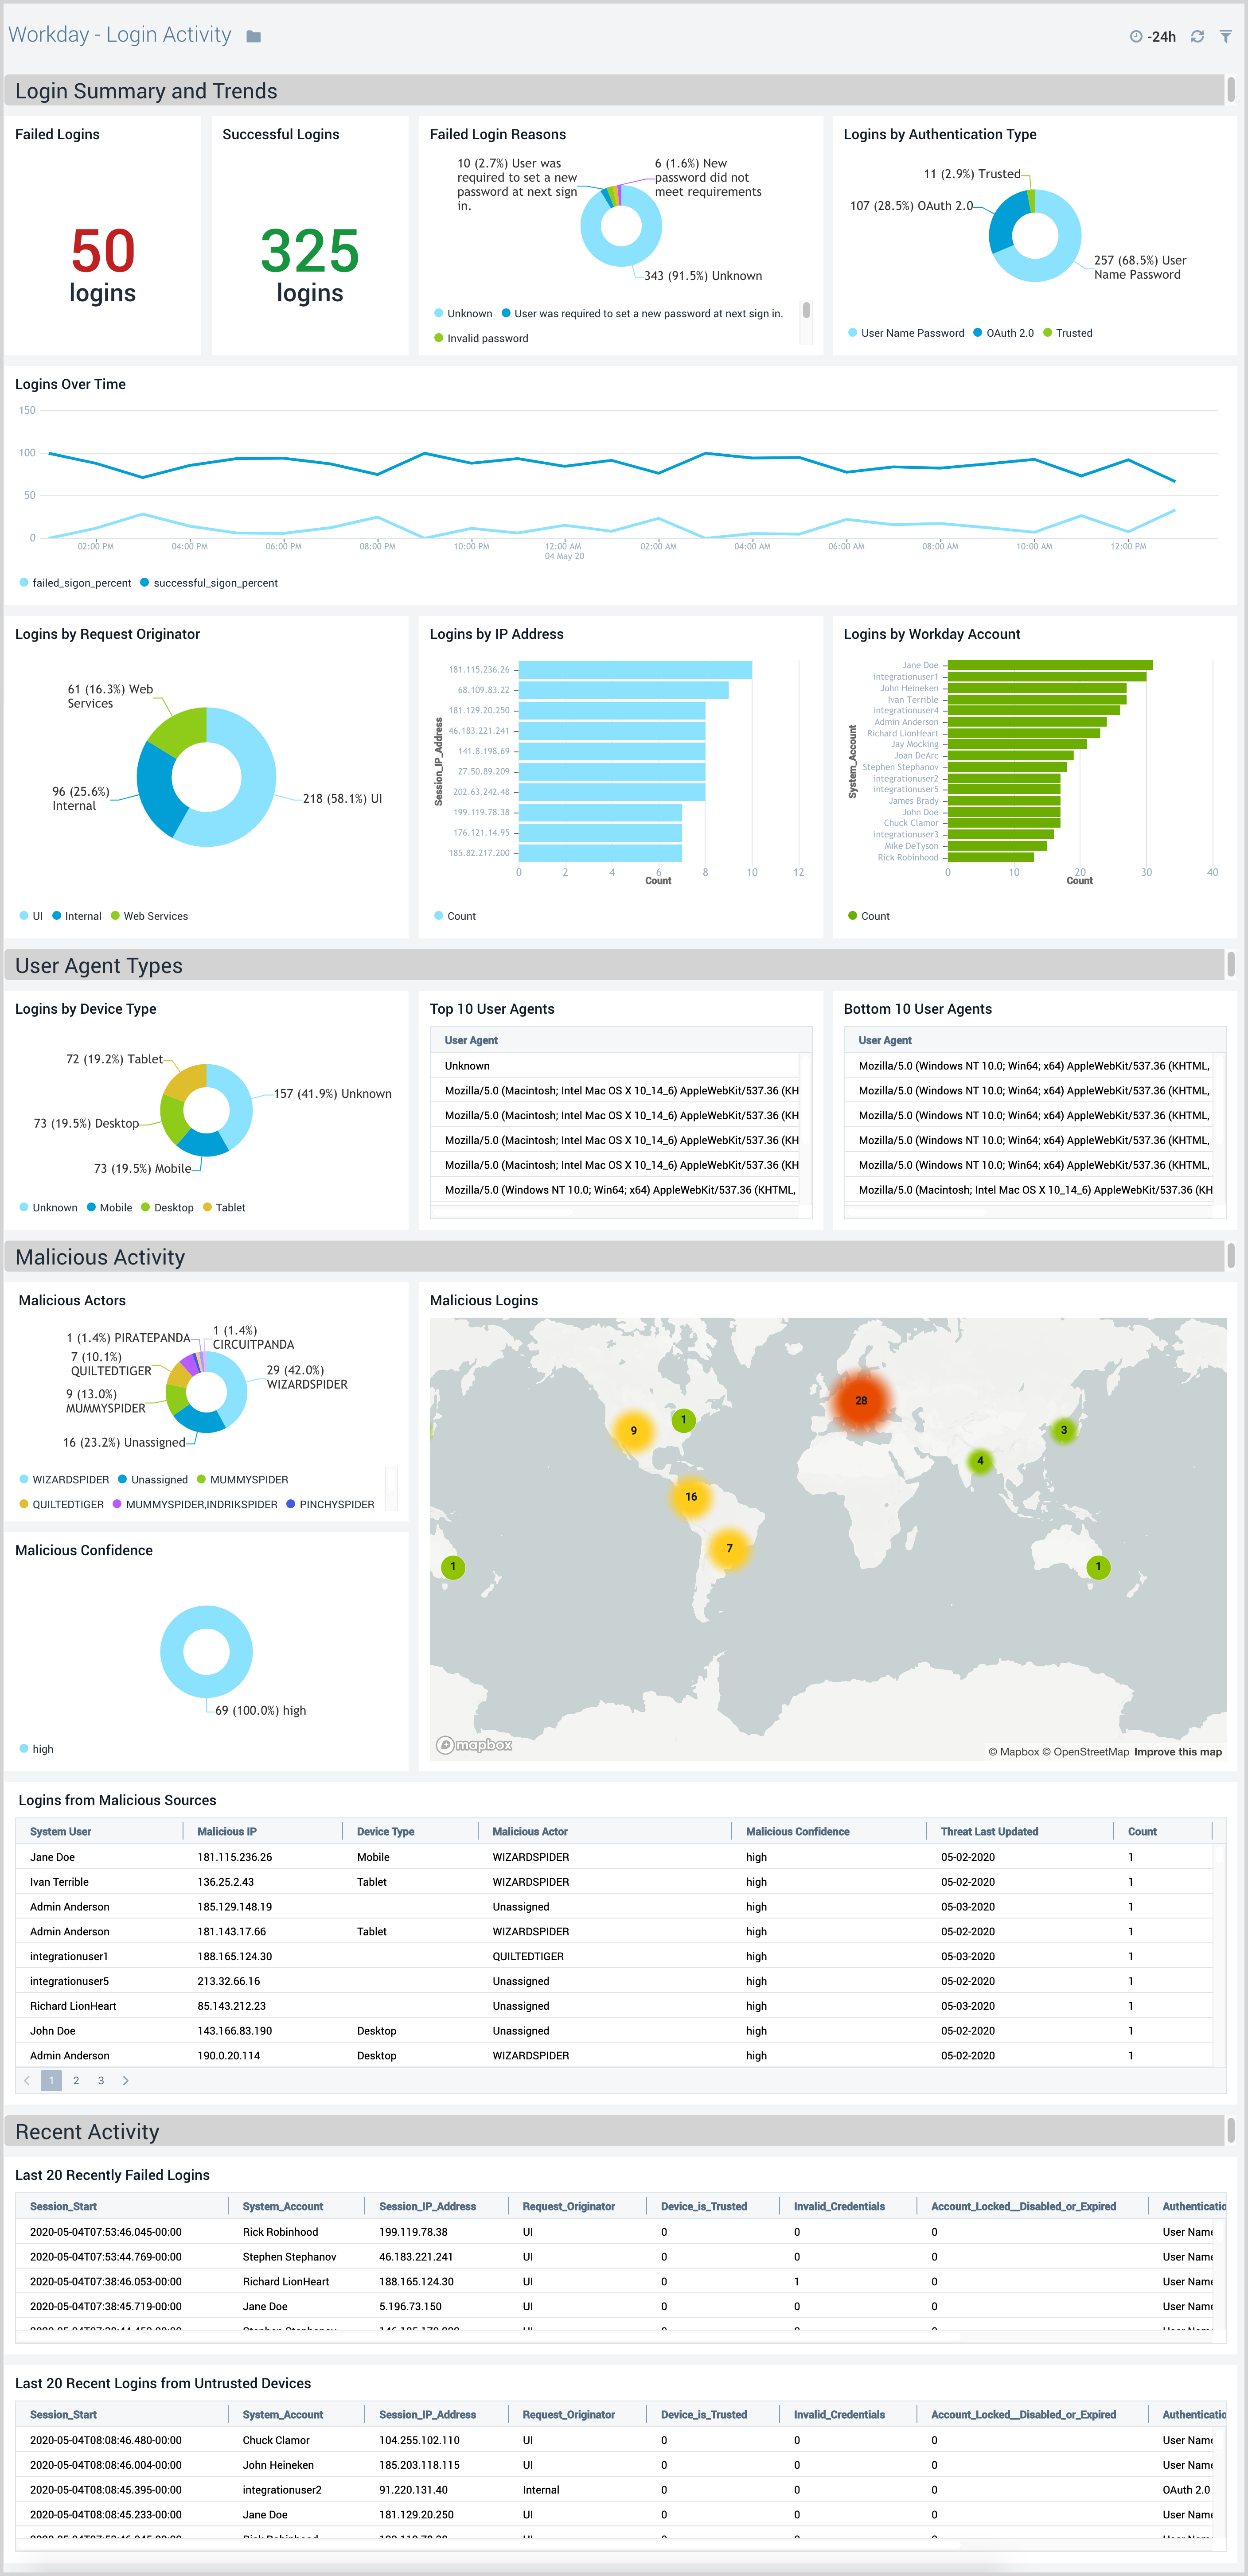
Login Activity
The Workday - Login Activity dashboard provides detailed insights into login summary, trends, and malicious activities. This panel also displays recent login activity and details of devices and browsers used to log in to the Workday portal.
Use this dashboard to:
- Identify login requests received from malicious remote IPs and untrusted devices.
- Quickly identify if users are logging in from expected locations and using devices supported by your IT teams.
- Get insight into trends around login events to determine the times of day your Workday instance is being used the most.
- Quickly identify if there is an unusually high number of failed logins.
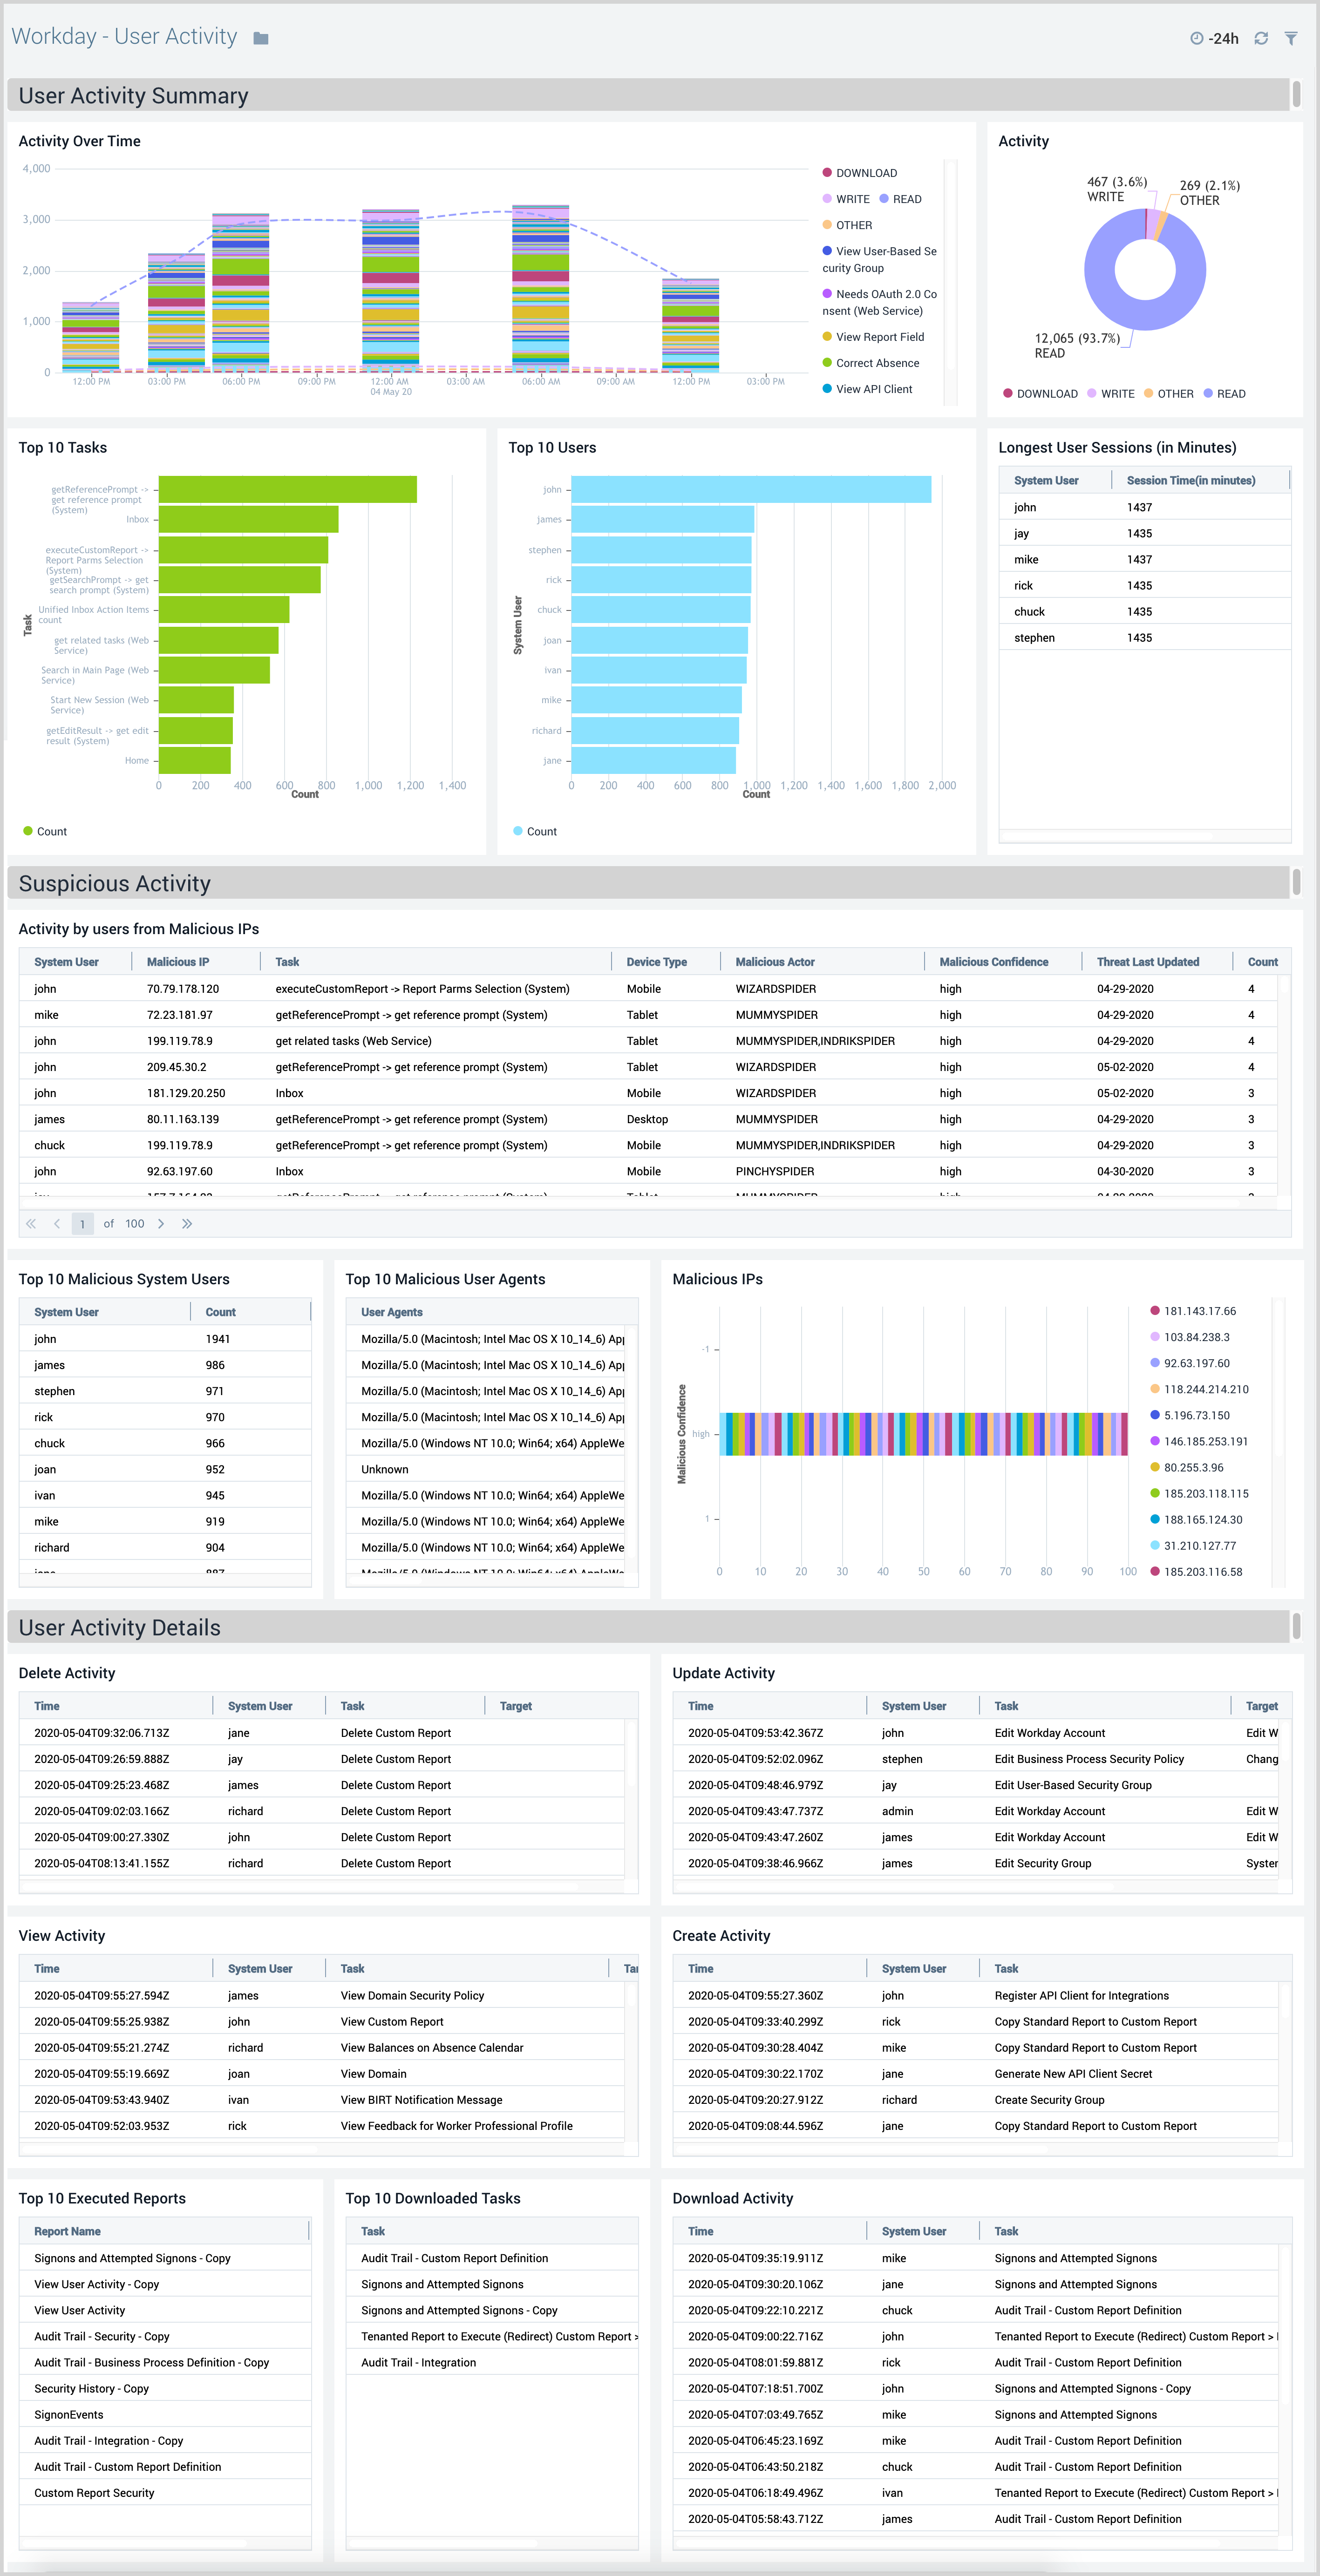
User Activity
The Workday - User Activity dashboard provides detailed insight into all user activity and potential suspicious activities in your Workday instance.
Use this dashboard to:
- Monitor if Workday tasks executed by users are according to expectations.
- Get insights into CRUD(Create/Read/Update/Delete) and download activity.
- Quickly identify if login and user activity are originating from known malicious IP addresses.
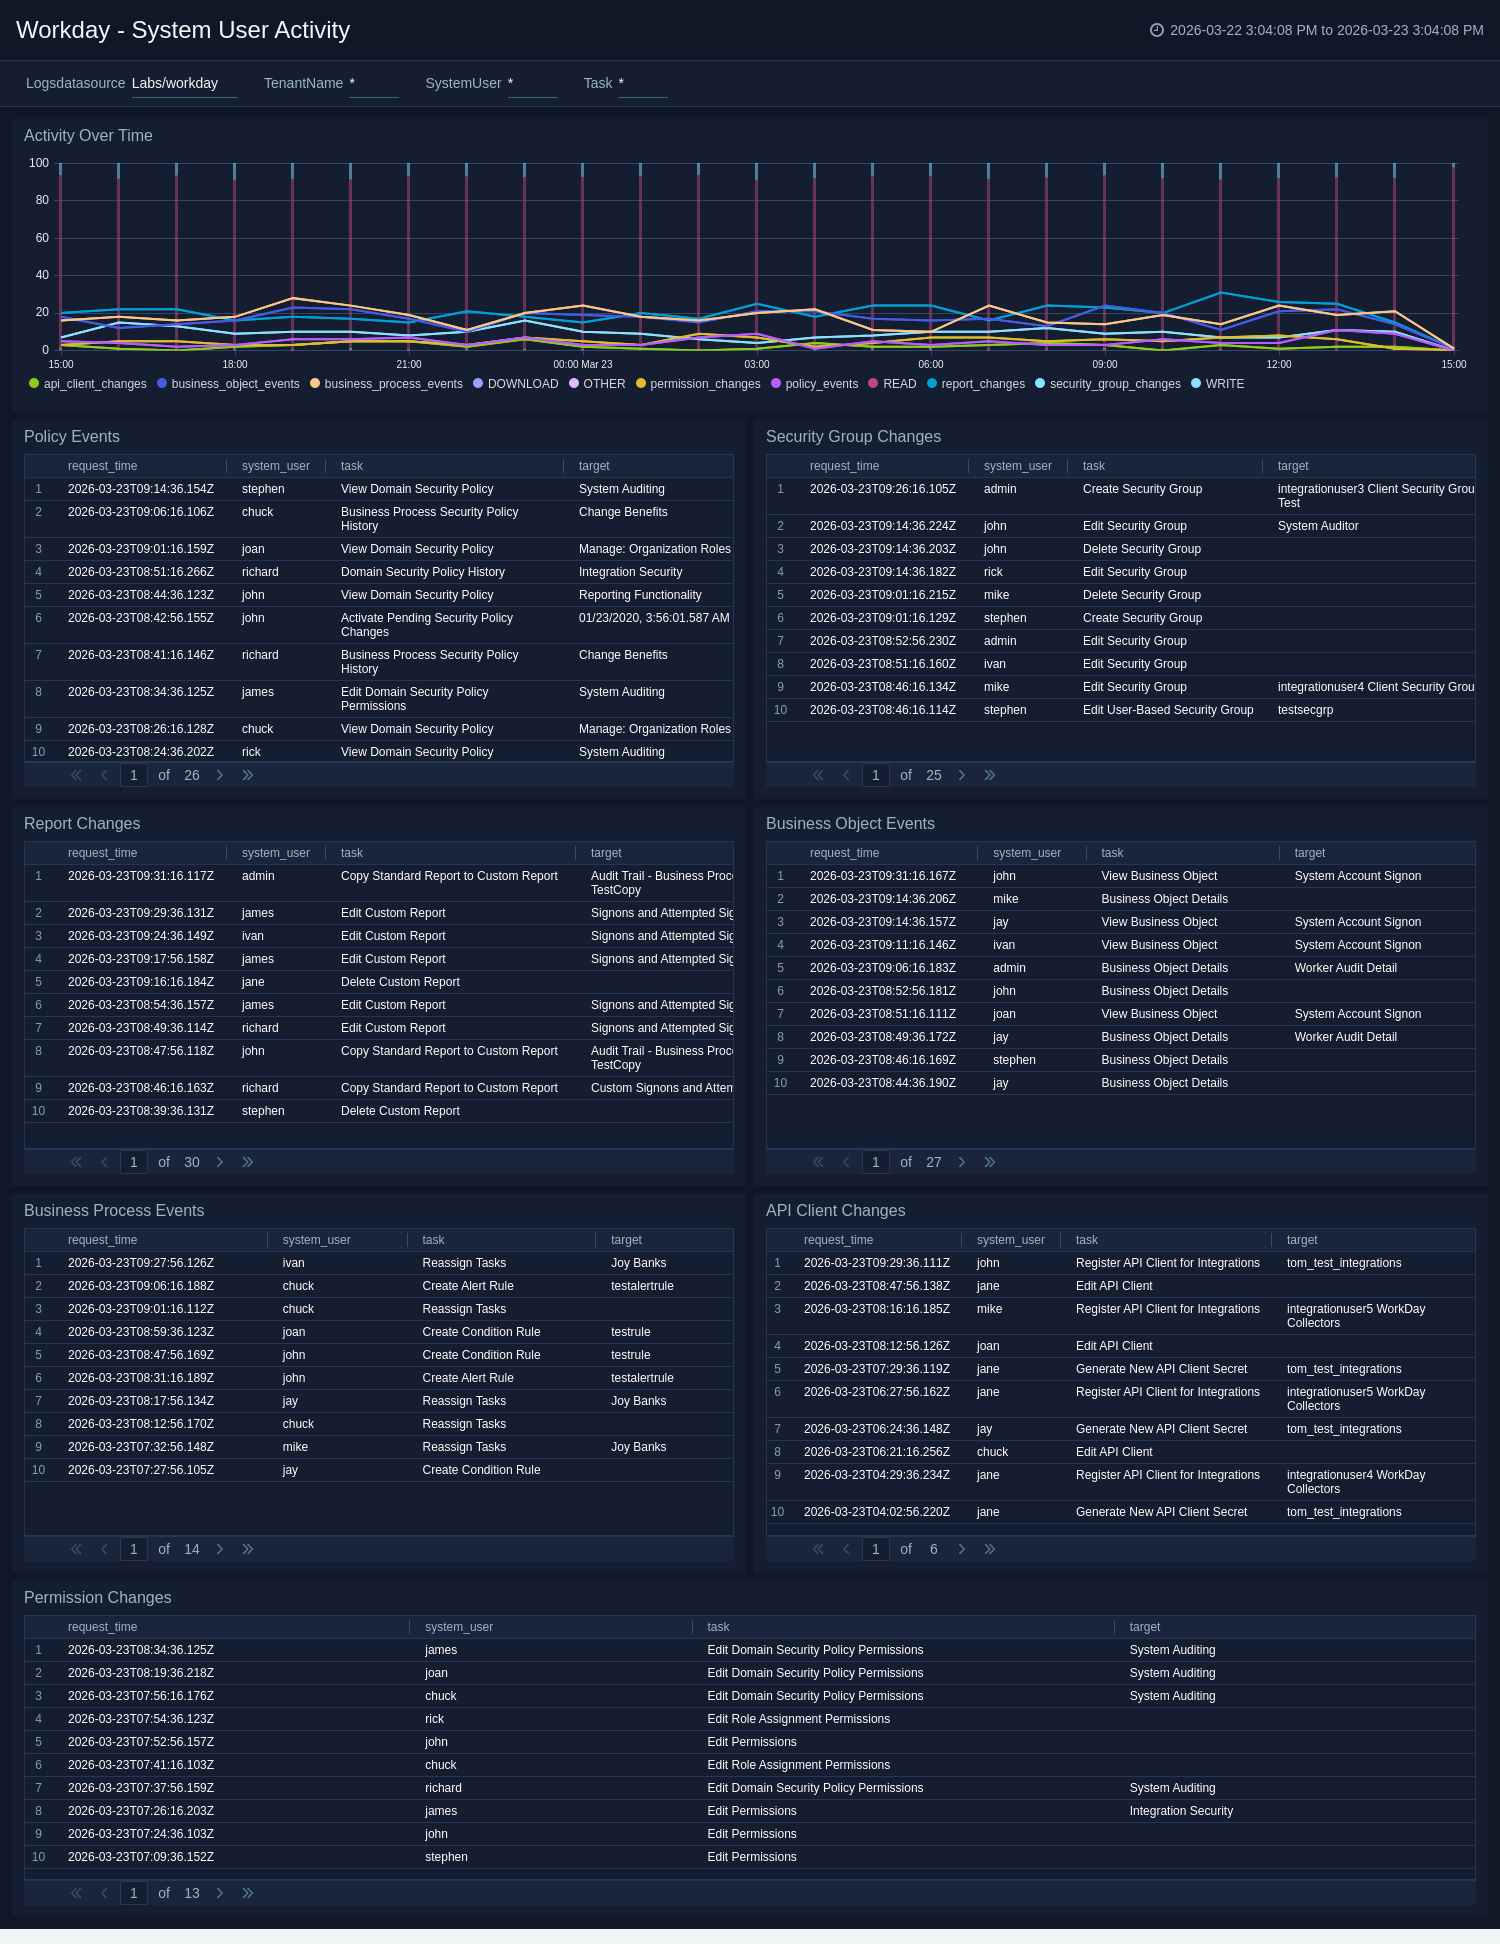
System User Activity
The Workday - System User Activity dashboard monitors the system user activities. This panel also identifies all configuration changes related to domain security, business processes, security groups, and API client modules.
Use this dashboard to:
- Identify if key configuration changes are in line with expectations.
- Identify changes related to permission and role assignments.
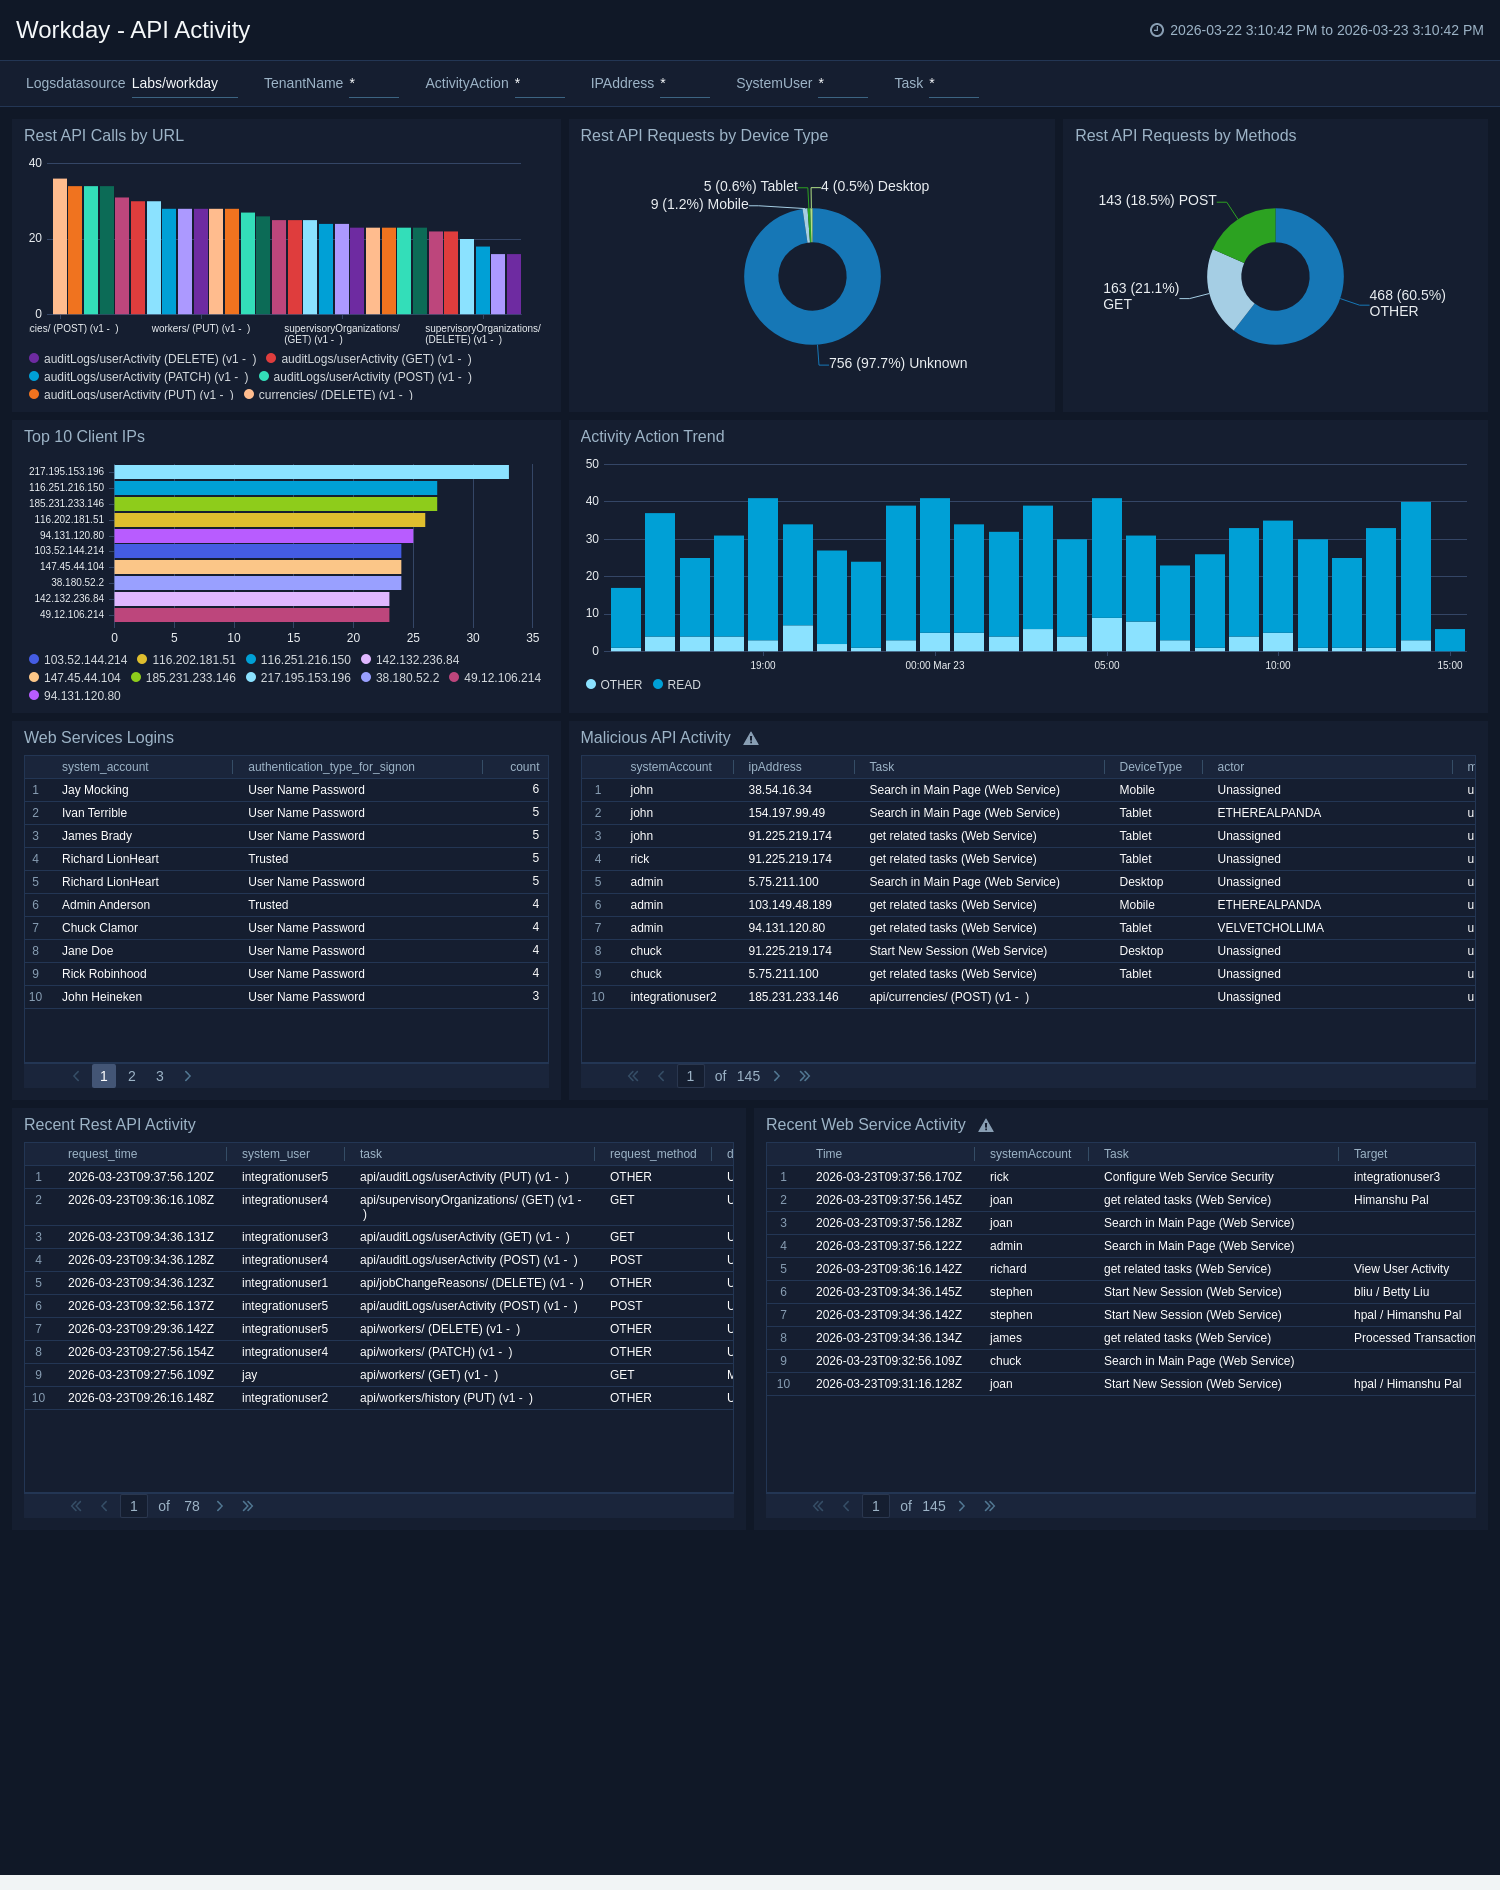
API Activity
The Workday - API Activity dashboard gives you insight into all analytics for REST API calls and web service-related authentications and monitors access attempts from known malicious IP addresses.
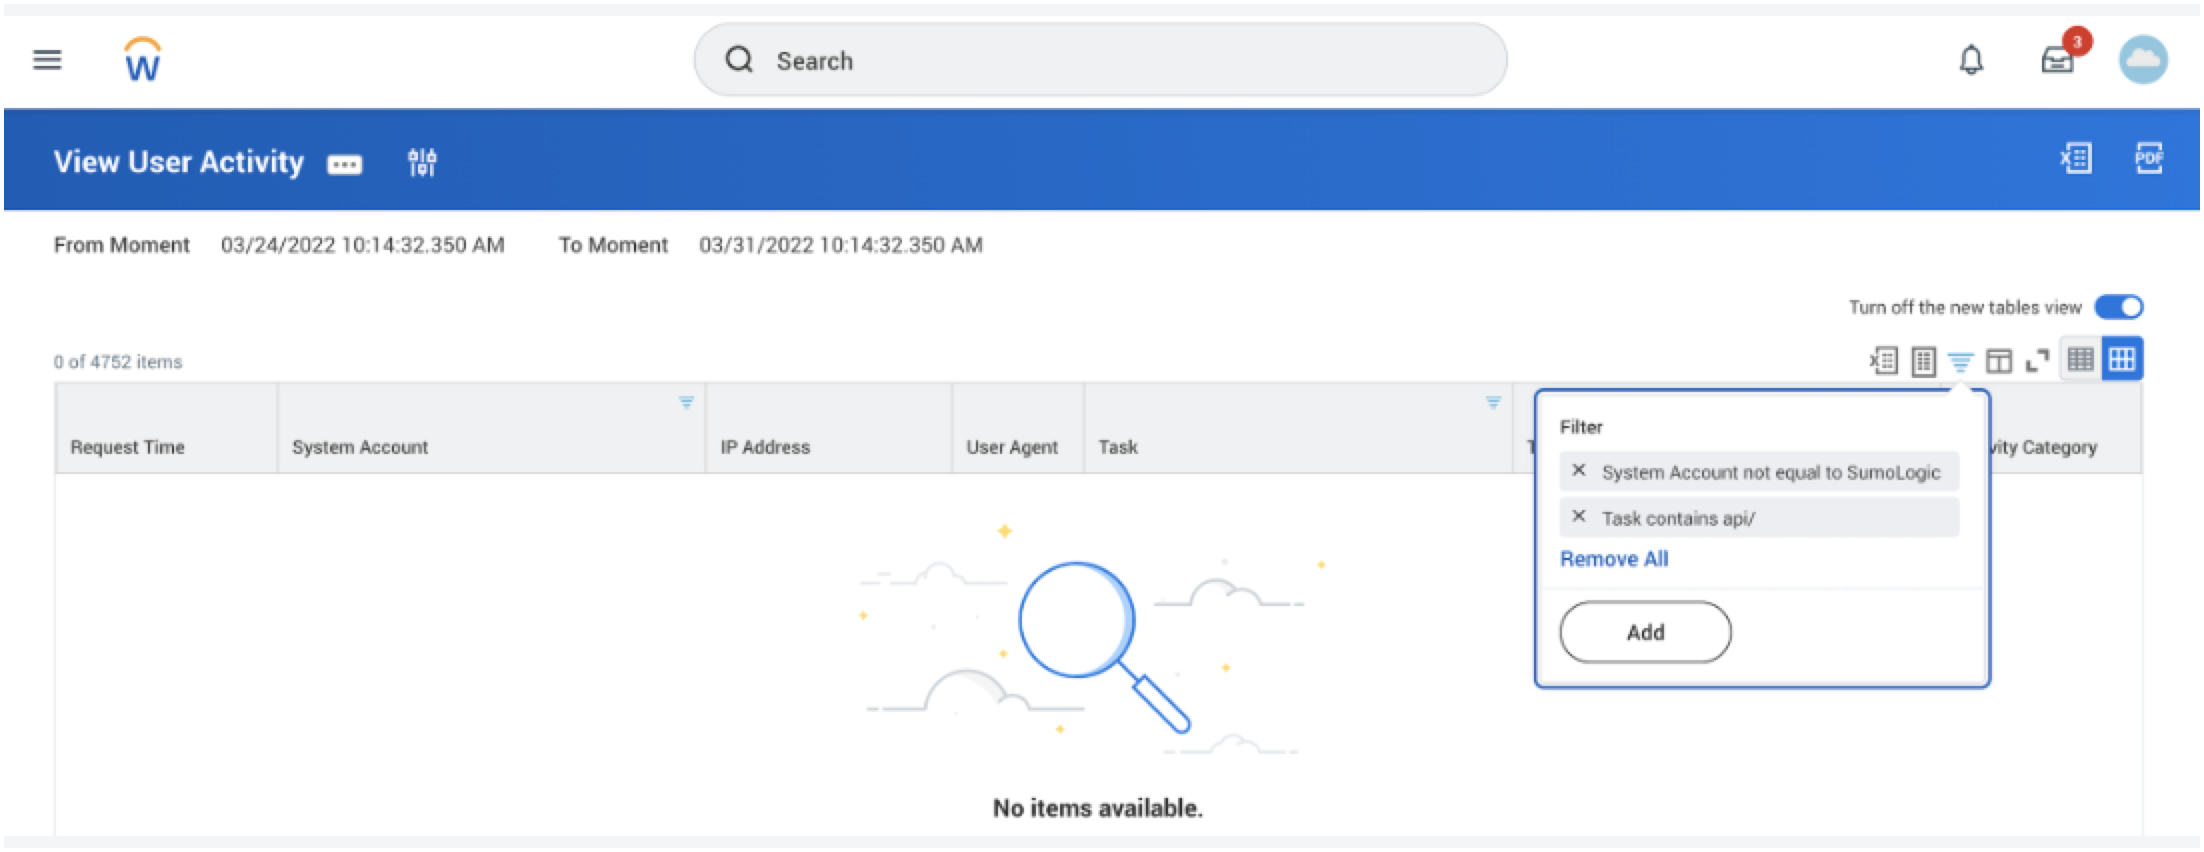
The API activity dashboard populates if there is any API activity happening in their tenant. If there aren't any Workday rest APIs (not SOAP) they are using, they can verify this by going to the User Activity report in their Workday tenant and running the report with the following filters.
Task contains api/ and System Account is not equal to SumoLogic_ISU.
Use this dashboard to:
- Monitor API related read, write, and other activities to ensure they match the expectations.
- Quickly identify any API requests originating from malicious IP addresses.
- Identify if API requests are being received from devices not supported by your IT teams.
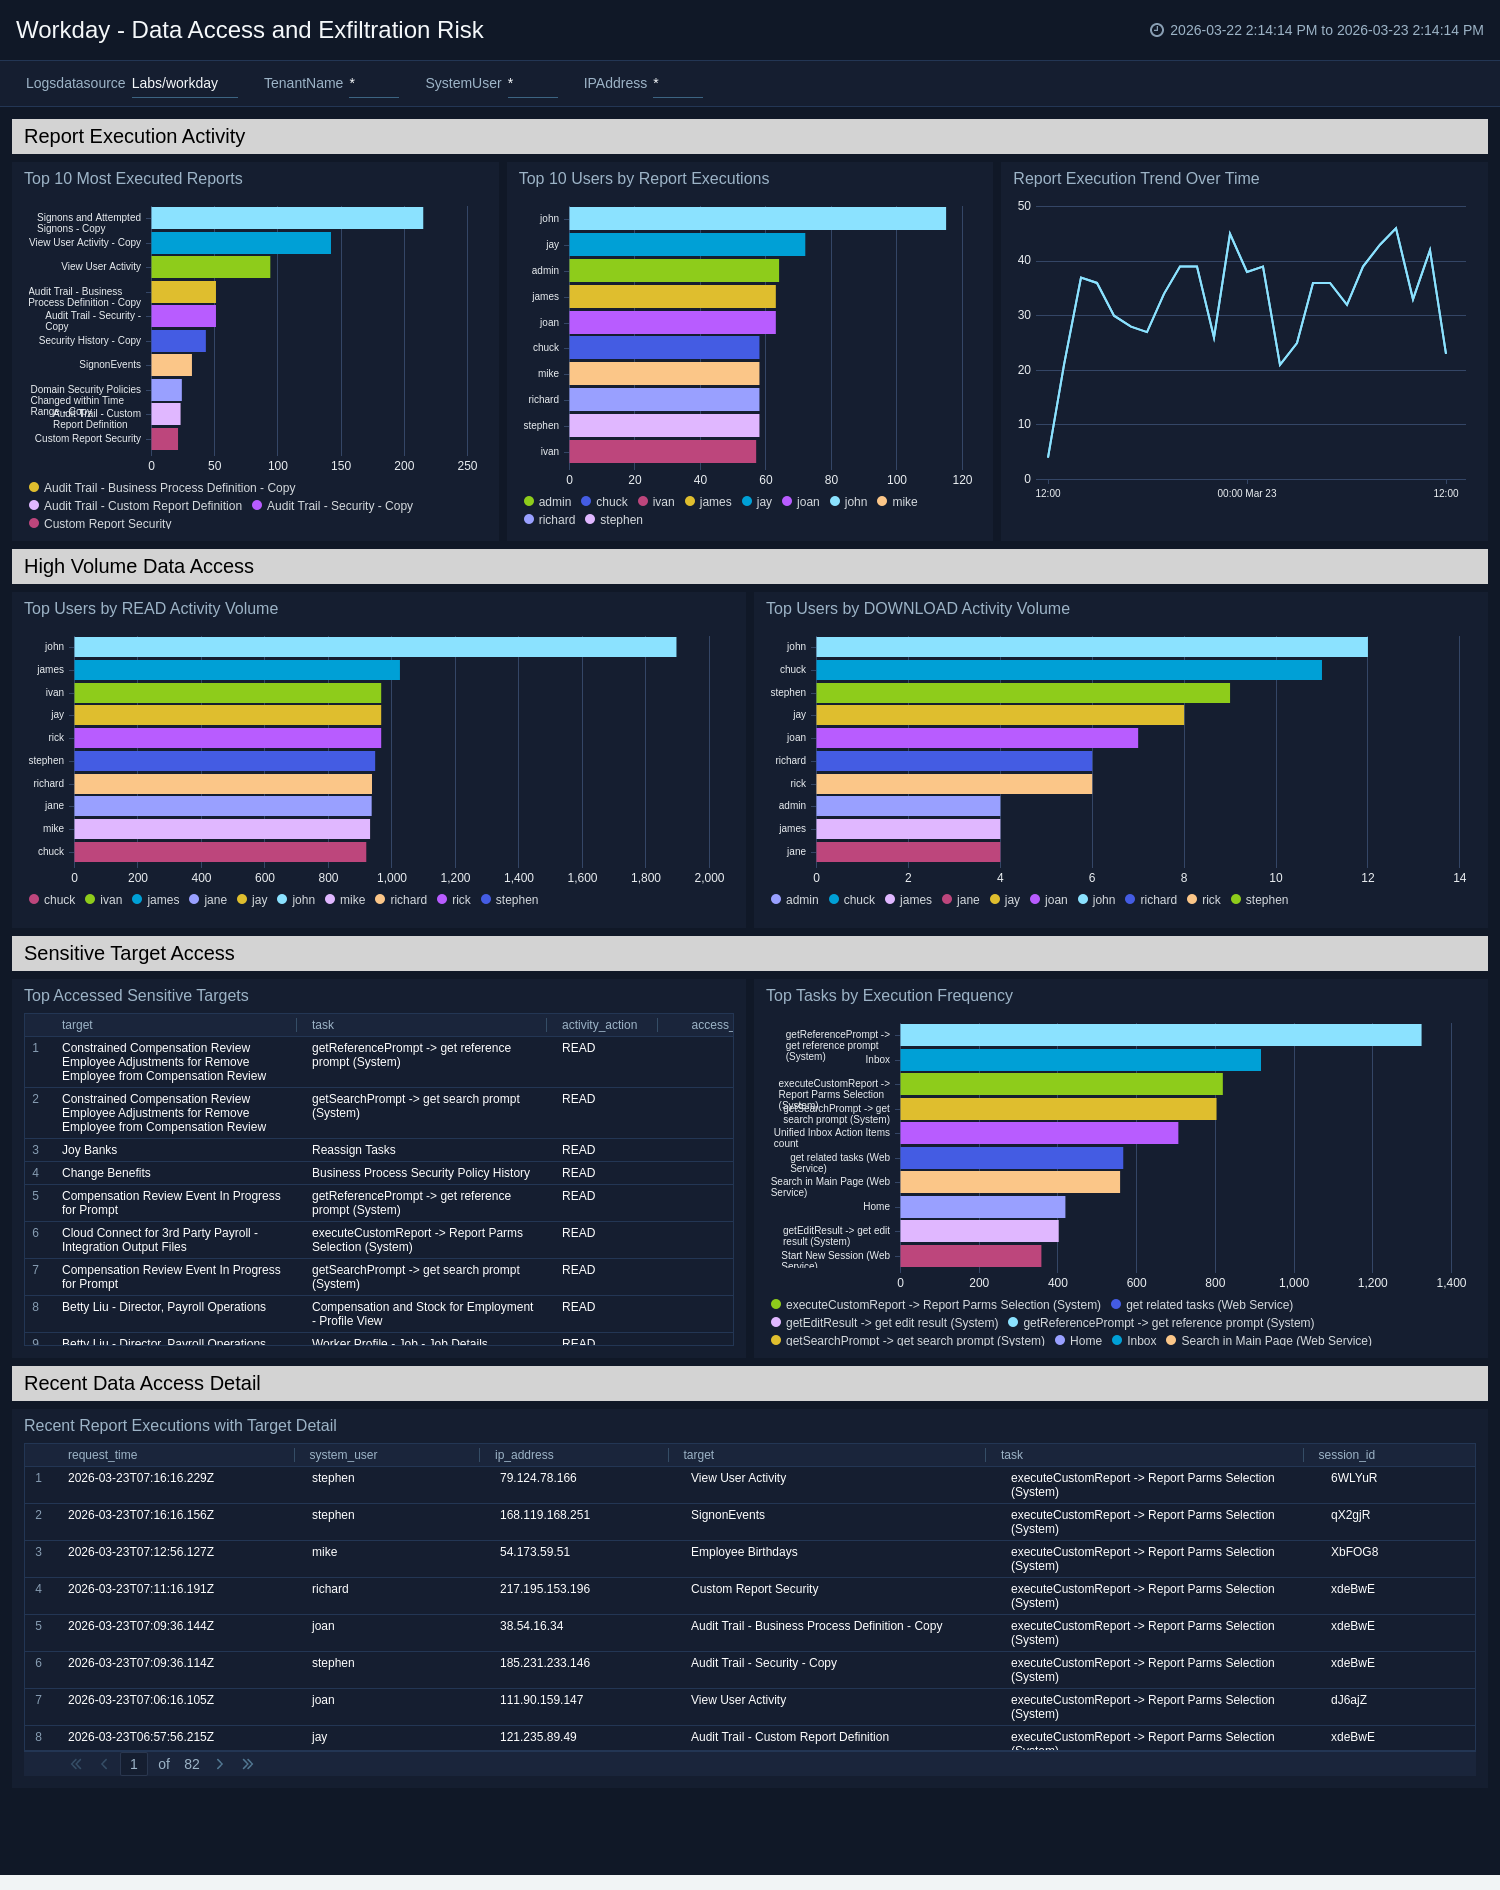
Data Access and Exfiltration Risk
The Workday - Data Access and Exfiltration Risk dashboard tracks report execution patterns, high-volume data access sessions, sensitive task targets, and users with anomalous read or download activity volumes that may indicate data exfiltration risk.
Use this dashboard to:
- Identify users executing an unusually high number of custom reports or DOWNLOAD operations that may indicate data harvesting.
- Quickly pinpoint access to sensitive targets such as payroll, compensation, and personal data objects.
- Get insight into which task IDs and report names are most frequently executed across your environment.
- Investigate session-level data access patterns to detect bulk extraction attempts before they become incidents.
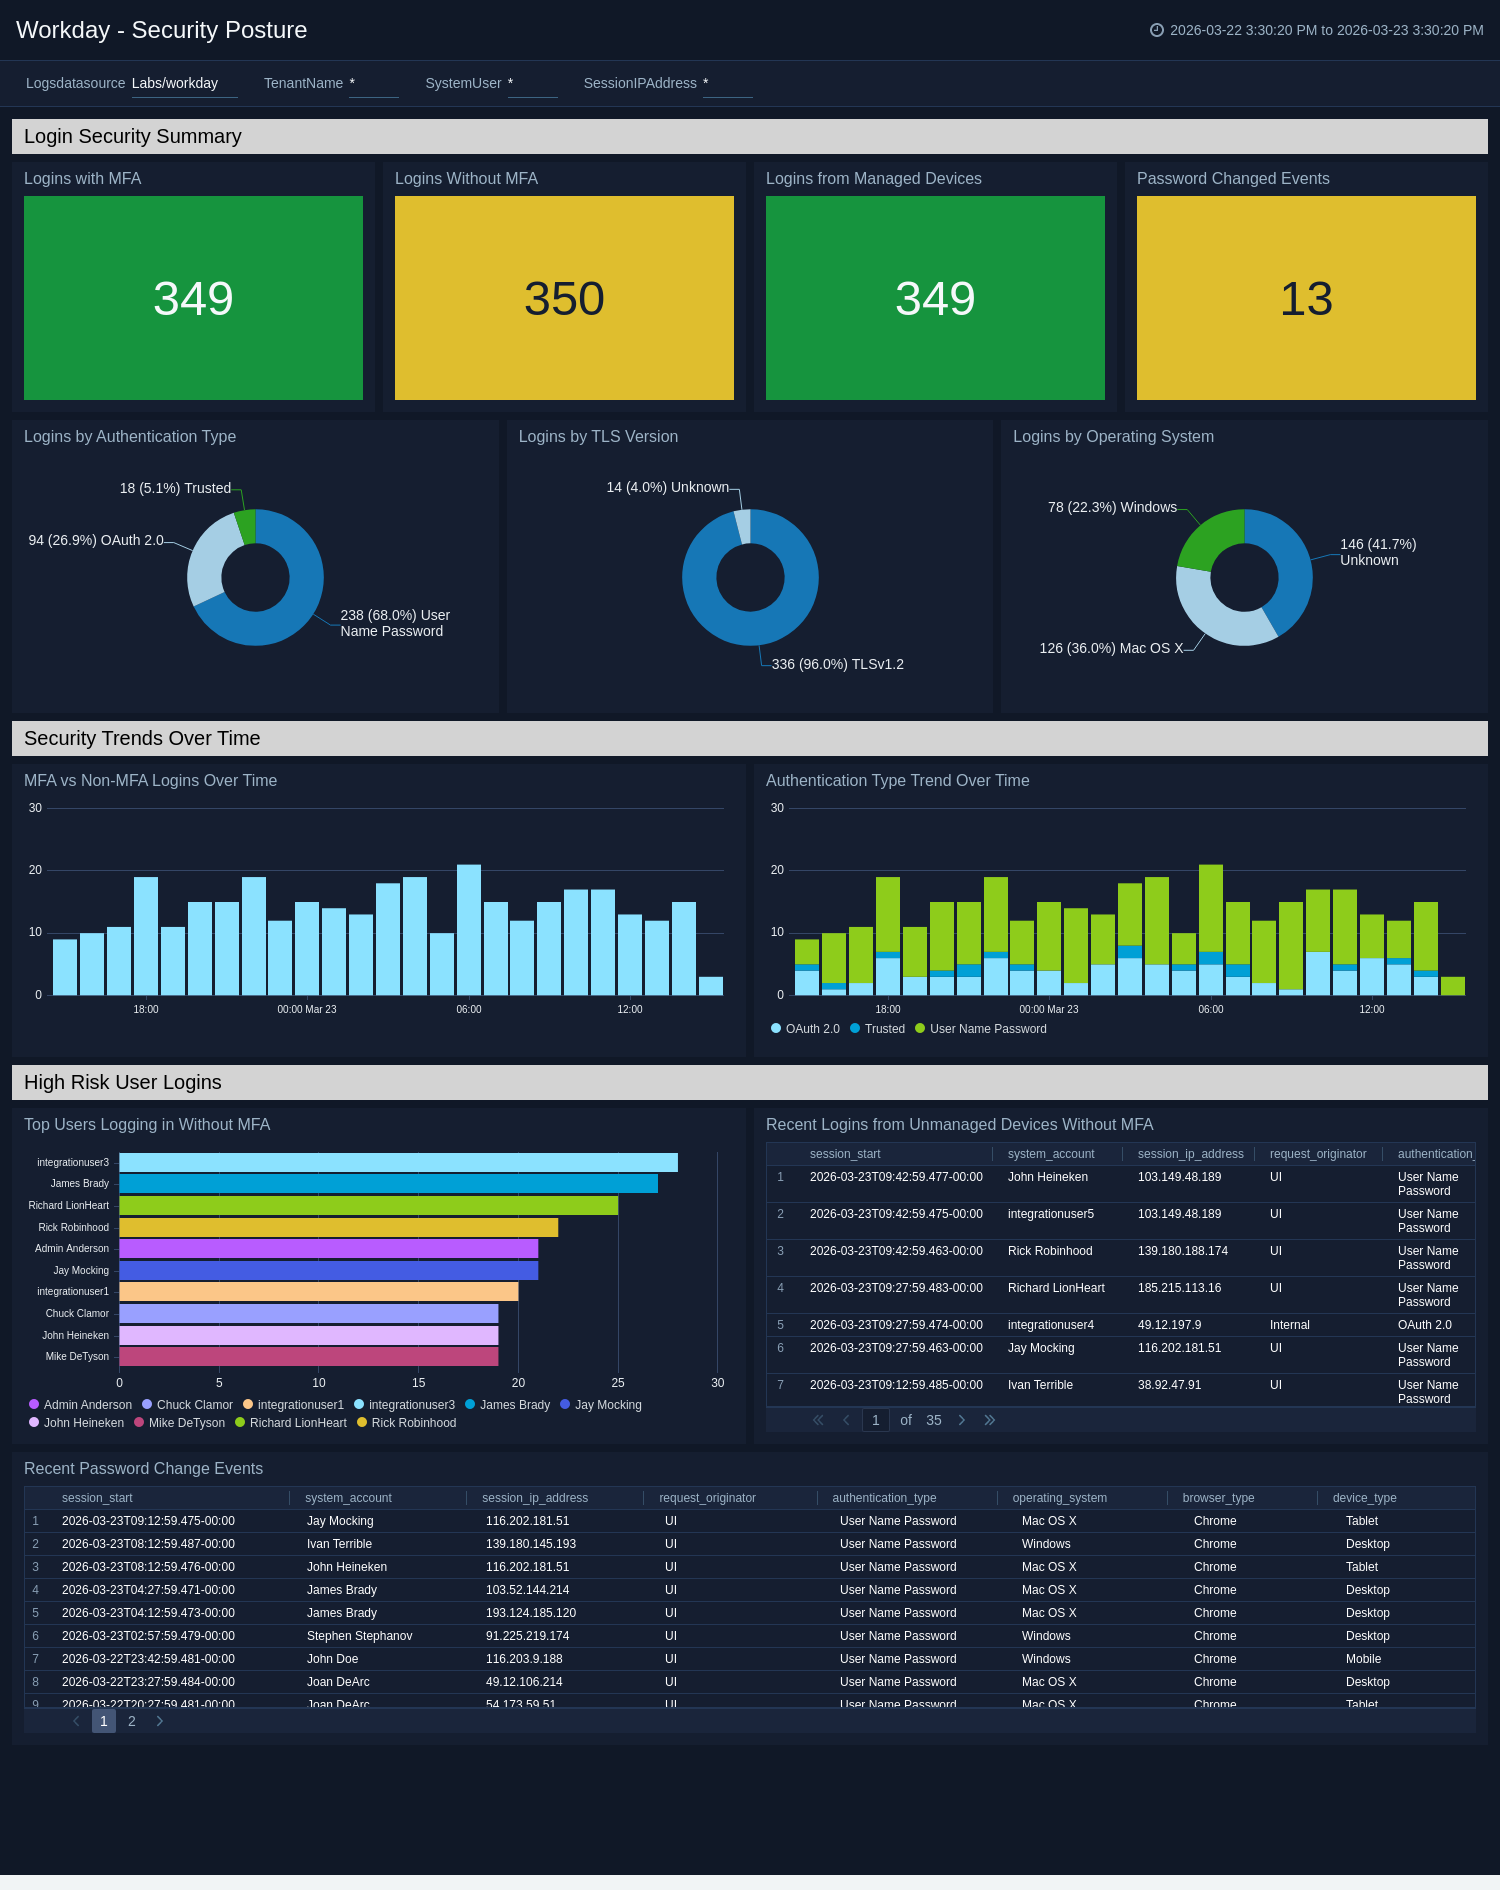
Security Posture
The Workday - Security Posture dashboard tracks MFA adoption, password change events, device management compliance, TLS version usage, and OAuth vs password authentication trends across your Workday tenant.
Use this dashboard to:
- Monitor MFA enforcement rates and quickly identify users bypassing multi-factor authentication.
- Detect logins from unmanaged or untrusted devices that do not meet your organization's security policy.
- Track TLS version distribution to identify sessions using outdated or weak encryption protocols.
- Investigate password change events and authentication type trends to spot potential account compromise.
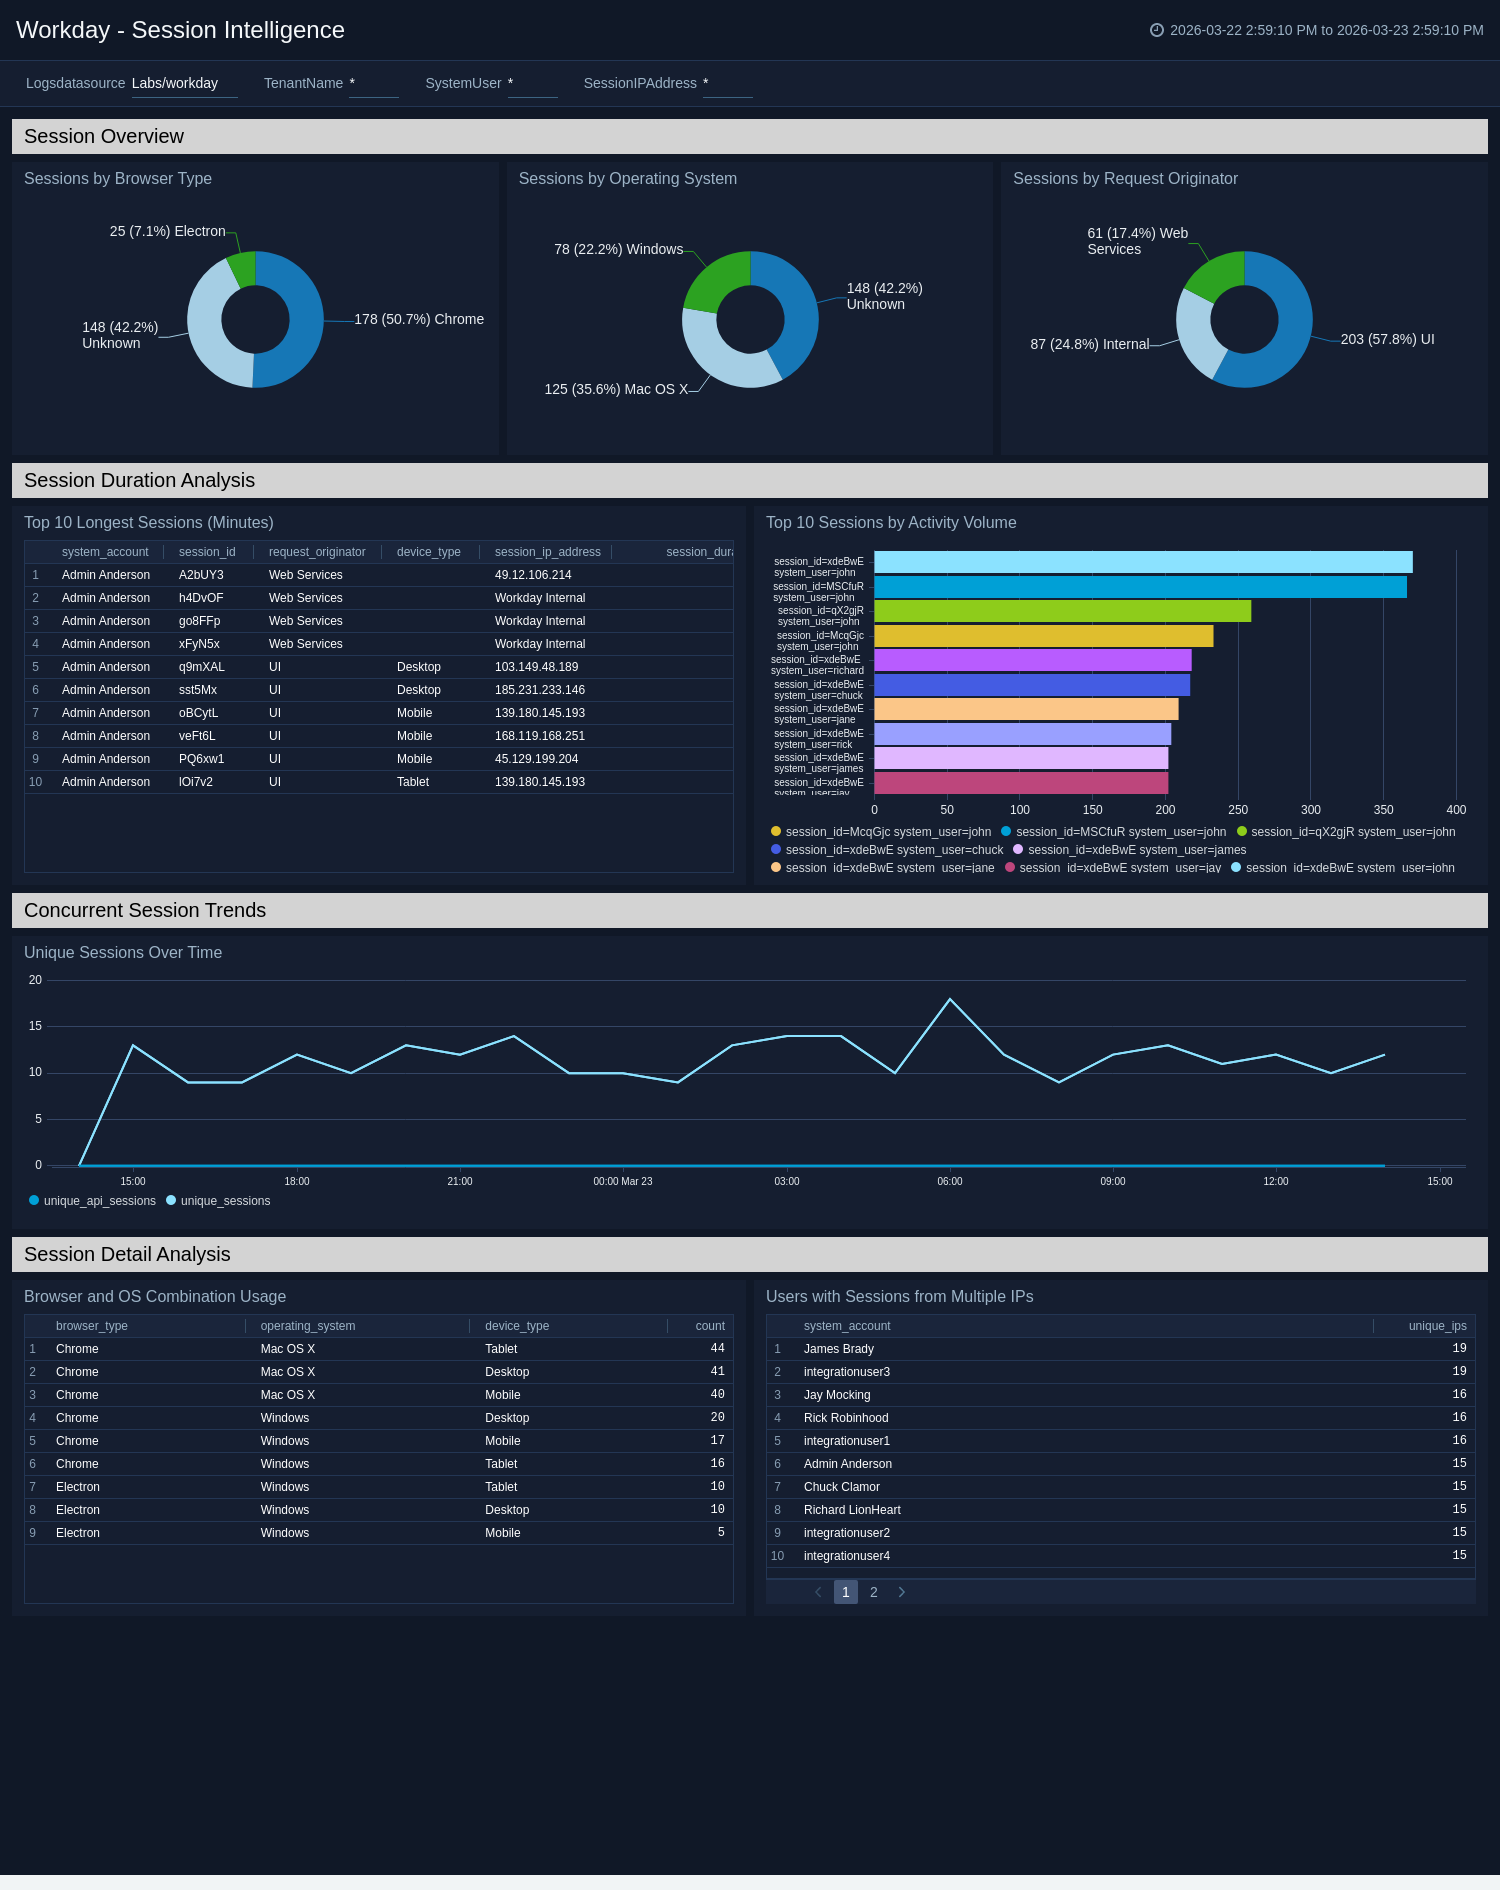
Session Intelligence
The Workday - Session Intelligence dashboard provides insights into user session durations, browser and OS usage patterns, concurrent sessions, and session-level activity volume to identify unusual session behaviors.
Use this dashboard to:
- Identify abnormally long or high-volume sessions that may indicate an abandoned, hijacked, or automated session.
- Understand browser, OS, and device combinations used across your user base to detect unsupported or unusual clients.
- Detect users accessing Workday from multiple IP addresses within a short timeframe, indicating potential credential sharing or account takeover.
- Analyze session volume trends over time to identify unexpected spikes in concurrent activity.
Create monitors for Workday C2C app
From your App Catalog:
- From the Sumo Logic navigation, select App Catalog.
- In the Search Apps field, search for and then select your app.
- Make sure the app is installed.
- Navigate to What's Included tab and scroll down to the Monitors section.
- Click Create next to the pre-configured monitors. In the create monitors window, adjust the trigger conditions and notifications settings based on your requirements.
- Scroll down to Monitor Details.
- Under Location click on New Folder.
note
By default, monitor will be saved in the root folder. So to make the maintenance easier, create a new folder in the location of your choice.
- Enter Folder Name. Folder Description is optional.
tip
Using app version in the folder name will be helpful to determine the versioning for future updates.
- Click Create. Once the folder is created, click on Save.
Workday C2C Alerts
| Name | Description | Alert Condition |
|---|---|---|
Workday - Brute Force Login Detection | This alert is triggered when repeated failed login attempts from the same user and IP, flagging an active password-guessing attack before it succeeds. | Count >= 5 |
Workday - Password Changed and Immediate New Session | This alert is triggered when a password reset is immediately followed by a new session, suggesting a possible account takeover pattern. | Count > 0 |
Workday - Successful Login After Multiple Failures | This alert is triggered when a user successfully authenticates after multiple (more than 3 times) failed attempts in the same time window, indicating a likely brute force success. | Count > 3 |
Workday - System Account Login from External IP | This alert is triggered when an automation account logs in from an external IP, indicating possible credential misuse outside Workday’s infrastructure. | Count > 0 |
Upgrade/Downgrade the Workday app (Optional)
To update the app, do the following:
Next-Gen App: To install or update the app, you must be an account administrator or a user with Manage Apps, Manage Monitors, Manage Fields, Manage Metric Rules, and Manage Collectors capabilities depending upon the different content types part of the app.
- Select App Catalog.
- In the Search Apps field, search for and then select your app.
Optionally, you can identify apps that can be upgraded in the Upgrade available section. - To upgrade the app, select Upgrade from the Manage dropdown.
- If the upgrade does not have any configuration or property changes, you will be redirected to the Preview & Done section.
- If the upgrade has any configuration or property changes, you will be redirected to the Setup Data page.
- In the Configure section of your respective app, complete the following fields.
- Field Name. If you already have collectors and sources set up, select the configured metadata field name (eg _sourcecategory) or specify other custom metadata (eg: _collector) along with its metadata Field Value.
- Click Next. You will be redirected to the Preview & Done section.
Post-update
Your upgraded app will be installed in the Installed Apps folder and dashboard panels will start to fill automatically.
See our Release Notes changelog for new updates in the app.
To revert the app to a previous version, do the following:
- Select App Catalog.
- In the Search Apps field, search for and then select your app.
- To version down the app, select Revert to < previous version of your app > from the Manage dropdown.
Uninstalling the Workday app (Optional)
To uninstall the app, do the following:
- Select App Catalog.
- In the 🔎 Search Apps field, run a search for your desired app, then select it.
- Click Uninstall.