Zero Networks Segment
The Zero Networks Segment app provides unified visibility into network activity, policy actions, and user behavior across your environment. By combining telemetry from connections, enforcement events, and configuration changes, it enables a clear understanding of how assets, users, and applications interact within a zero trust framework.
The app surfaces key metrics such as top devices, active users, protocols, ports, and traffic types to reveal operational patterns and dependencies. Risk-oriented insights highlight high-threat destinations, unsafe processes, and connection outcomes, helping teams quickly identify and contain potential exposures. Governance information tracks who created rules, when MFA was applied, and how enforcement sources contributed to changes.
Together, these views deliver real-time awareness of network usage and security posture, enabling organizations to validate segmentation policies, reduce attack surfaces, and sustain a trusted, well-monitored network environment.
This app includes built-in monitors. For details on creating custom monitors, refer to Create monitors for Zero Networks Segment app.
Log types
This app uses Sumo Logic’s Zero Networks Segment Source to collect Audit logs and Network Activity logs from the Zero Networks Segment platform.
Sample log message
Audit Log
{
    "timestamp": 1764075603256,
    "isoTimestamp": "2025-11-25T18:30:03.256Z",
    "auditType": 9,
    "enforcementSource": 6,
    "userRole": 4,
    "destinationEntitiesList": [
        {
            "id": "b:110002",
            "name": "All protected assets"
        }
    ],
    "details": "{\"rule\":{\"localEntityNames\":{\"id\":\"b:110002\",\"name\":\"All protected assets\"},\"remoteEntityNames\":[{\"id\":\"b:110001\",\"name\":\"Any asset\"}],\"ports\":[{\"protocol_type\":6,\"ports\":\"62246\"}],\"expiration\":1764075603256,\"description\":\"\",\"localProcesses\":[\"*\"],\"created_by\":{\"id\":\"m:13c49a4eb4fa90bbb948b6c8de5175ad2d36cfbc\",\"name\":\"ModuleTesting\"},\"enforcementSource\":6,\"createdAt\":1764075603256,\"usedMfaMethod\":0,\"excludedLocalEntityNames\":[],\"state\":1,\"updatedAt\":1764075603256,\"updatedBy\":{},\"approvedAt\":0,\"approvedBy\":{},\"ruleClass\":2}}",
    "reportedObjectId": "a3864c59-e263-4d12-a73e-595cf2103f6c",
    "reportedObjectGeneration": 129335988,
    "performedBy": {
        "id": "m:13c49a4eb4fa90bbb948b6c8de5175ad2d36cfbc",
        "name": "ModuleTesting"
    }
}
Network Activity Log
{
    "timestamp": 1764075429582,
    "protocol": 17,
    "state": 3,
    "trafficType": 3,
    "dst": {
        "assetId": "b:X1003",
        "fqdn": "time.windows.com",
        "ip": "193.124.185.120",
        "port": 123,
        "processName": "",
        "processPath": "",
        "ipThreatScore": 0
    },
    "src": {
        "assetId": "a:d:SRV-TIME01",
        "assetSrc": 1,
        "networkProtectionState": 1,
        "assetType": 2,
        "eventRecordId": 600013,
        "fqdn": "NTP-Sync01",
        "ip": "193.124.185.120",
        "port": 54312,
        "processId": 412,
        "processName": "svchost.exe (412)",
        "processPath": "C:\\Windows\\System32\\svchost.exe (412)",
        "userId": "S-1-5-18",
        "userName": "NT AUTHORITY\\SYSTEM",
        "user": {
            "sid": "S-1-5-18",
            "name": "NT AUTHORITY\\SYSTEM"
        },
        "ipThreatScore": 0
    },
    "inboundRuleMatches": [],
    "outboundRuleMatches": [],
    "reason": 6,
    "ipSpace": 0
}
Sample queries
_sourceCategory="zero-networks-app" auditType
| json "auditType", "details", "timestamp", "reportedObjectId", "performedBy.name", "performedBy.id", "destinationEntitiesList[*]", "enforcementSource", "userRole", "isoTimestamp" as audit_type, details, timestamp, reported_object_id, actor, actor_id, destination_entities_list, enforcement_source, user_role, iso_timestamp nodrop

| where audit_type matches "*"
| where enforcement_source matches "*"
| where user_role matches "*"

| count by audit_type, details, timestamp, reported_object_id
| count
Collection configuration and app installation
Depending on the set up collection method, you can configure and install the app in three ways:
- Create a new collector and install the app. Create a new Sumo Logic Cloud-to-Cloud (C2C) source under a new Sumo Logic Collector and later install the app, or
- Use an existing collector and install the app. Create a new Sumo Logic Cloud-to-Cloud (C2C) source under an existing Sumo Logic Collector and later install the app, or
- Use existing source and install the app. Use your existing configured Sumo Logic Cloud-to-Cloud (C2C) source and install the app.
Use the Cloud-to-Cloud Integration for Zero Networks Segment Source to create the source and use the same source category while installing the app. By following these steps, you can ensure that your Zero Networks Segment app is properly integrated and configured to collect and analyze your Zero Networks Segment data.
Create a new collector and install the app
To set up collection and install the app, do the following:
Next-Gen App: To install or update the app, you must be an account administrator or a user with Manage Apps, Manage Monitors, Manage Fields, Manage Metric Rules, and Manage Collectors capabilities depending upon the different content types part of the app.
- Select App Catalog.
- In the 🔎 Search Apps field, run a search for your desired app, then select it.
- Click Install App.
note
Sometimes this button says Add Integration.
- In the Set Up Collection section of your respective app, select Create a new Collector.
- Collector Name. Enter a Name to display the Source in the Sumo Logic web application. The description is optional.
- Timezone. Set the default time zone when it is not extracted from the log timestamp. Time zone settings on Sources override a Collector time zone setting.
- (Optional) Metadata. Click the +Add Metadata link to add a custom log Metadata Fields. Define the fields you want to associate, each metadata field needs a name (key) and value.
 A green circle with a checkmark is shown when the field exists and is enabled in the Fields table schema.
 An orange triangle with an exclamation point is shown when the field doesn't exist, or is disabled in the Fields table schema. In this case, you'll see an option to automatically add or enable the nonexistent fields to the Fields table schema. If a field is sent to Sumo Logic but isn’t present or enabled in the schema, it’s ignored and marked as Dropped.
- Click Next.
- Configure the source as specified in the
Infobox above, ensuring all required fields are included. - In the Configure section of your respective app, complete the following fields.
- Field Name. If you already have collectors and sources set up, select the configured metadata field name (eg _sourcecategory) or specify other custom metadata (eg: _collector) along with its metadata Field Value.
- Click Next. You will be redirected to the Preview & Done section.
Post-installation
Once your app is installed, it will appear in your Installed Apps folder, and dashboard panels will start to fill automatically.
Each panel slowly fills with data matching the time range query received since the panel was created. Results will not immediately be available but will be updated with full graphs and charts over time.
Use an existing collector and install the app
To set up the source in the existing collector and install the app, do the following:
Next-Gen App: To install or update the app, you must be an account administrator or a user with Manage Apps, Manage Monitors, Manage Fields, Manage Metric Rules, and Manage Collectors capabilities depending upon the different content types part of the app.
- Select App Catalog.
- In the 🔎 Search Apps field, run a search for your desired app, then select it.
- Click Install App.
note
Sometimes this button says Add Integration.
- In the Set Up Collection section of your respective app, select Use an existing Collector.
- From the Select Collector dropdown, select the collector that you want to set up your source with and click Next.
- Configure the source as specified in the
Infobox above, ensuring all required fields are included. - In the Configure section of your respective app, complete the following fields.
- Field Name. If you already have collectors and sources set up, select the configured metadata field name (eg _sourcecategory) or specify other custom metadata (eg: _collector) along with its metadata Field Value.
- Click Next. You will be redirected to the Preview & Done section.
Post-installation
Once your app is installed, it will appear in your Installed Apps folder, and dashboard panels will start to fill automatically.
Each panel slowly fills with data matching the time range query received since the panel was created. Results will not immediately be available but will be updated with full graphs and charts over time.
Use an existing source and install the app
To skip collection and only install the app, do the following:
Next-Gen App: To install or update the app, you must be an account administrator or a user with Manage Apps, Manage Monitors, Manage Fields, Manage Metric Rules, and Manage Collectors capabilities depending upon the different content types part of the app.
- Select App Catalog.
- In the 🔎 Search Apps field, run a search for your desired app, then select it.
- Click Install App.
note
Sometimes this button says Add Integration.
- In the Set Up Collection section of your respective app, select Skip this step and use existing source and click Next.
- In the Configure section of your respective app, complete the following fields.
- Field Name. If you already have collectors and sources set up, select the configured metadata field name (eg _sourcecategory) or specify other custom metadata (eg: _collector) along with its metadata Field Value.
- Click Next. You will be redirected to the Preview & Done section.
Post-installation
Once your app is installed, it will appear in your Installed Apps folder, and dashboard panels will start to fill automatically.
Each panel slowly fills with data matching the time range query received since the panel was created. Results will not immediately be available but will be updated with full graphs and charts over time.
Viewing the Zero Networks Segment dashboards
All dashboards have a set of filters that you can apply to the entire dashboard. Use these filters to drill down and examine the data to a granular level.
- You can change the time range for a dashboard or panel by selecting a predefined interval from a drop-down list, choosing a recently used time range, or specifying custom dates and times. Learn more.
- You can use template variables to drill down and examine the data on a granular level. For more information, see Filtering Dashboards with Template Variables.
- Most Next-Gen apps allow you to provide the scope at the installation time and are comprised of a key (
_sourceCategoryby default) and a default value for this key. Based on your input, the app dashboards will be parameterized with a dashboard variable, allowing you to change the dataset queried by all panels. This eliminates the need to create multiple copies of the same dashboard with different queries.
Network Activities
The Zero Networks Segment - Network Activities view offers a comprehensive snapshot of how users, devices, and applications communicate across the network. It tracks total source and destination devices, unique active users, connection volumes, and top domains, ports, and processes to reveal usage trends and dependencies. By correlating state, protocol, and traffic‑type distributions with geographic source and destination mapping, it highlights how data flows through internal, external, and Internet segments and helps uncover anomalies or unexpected communication paths. Consolidating these insights provides real‑time awareness of network behavior, enabling teams to validate segmentation effectiveness, identify misconfigurations, and maintain a secure, efficient, and well‑monitored network environment. 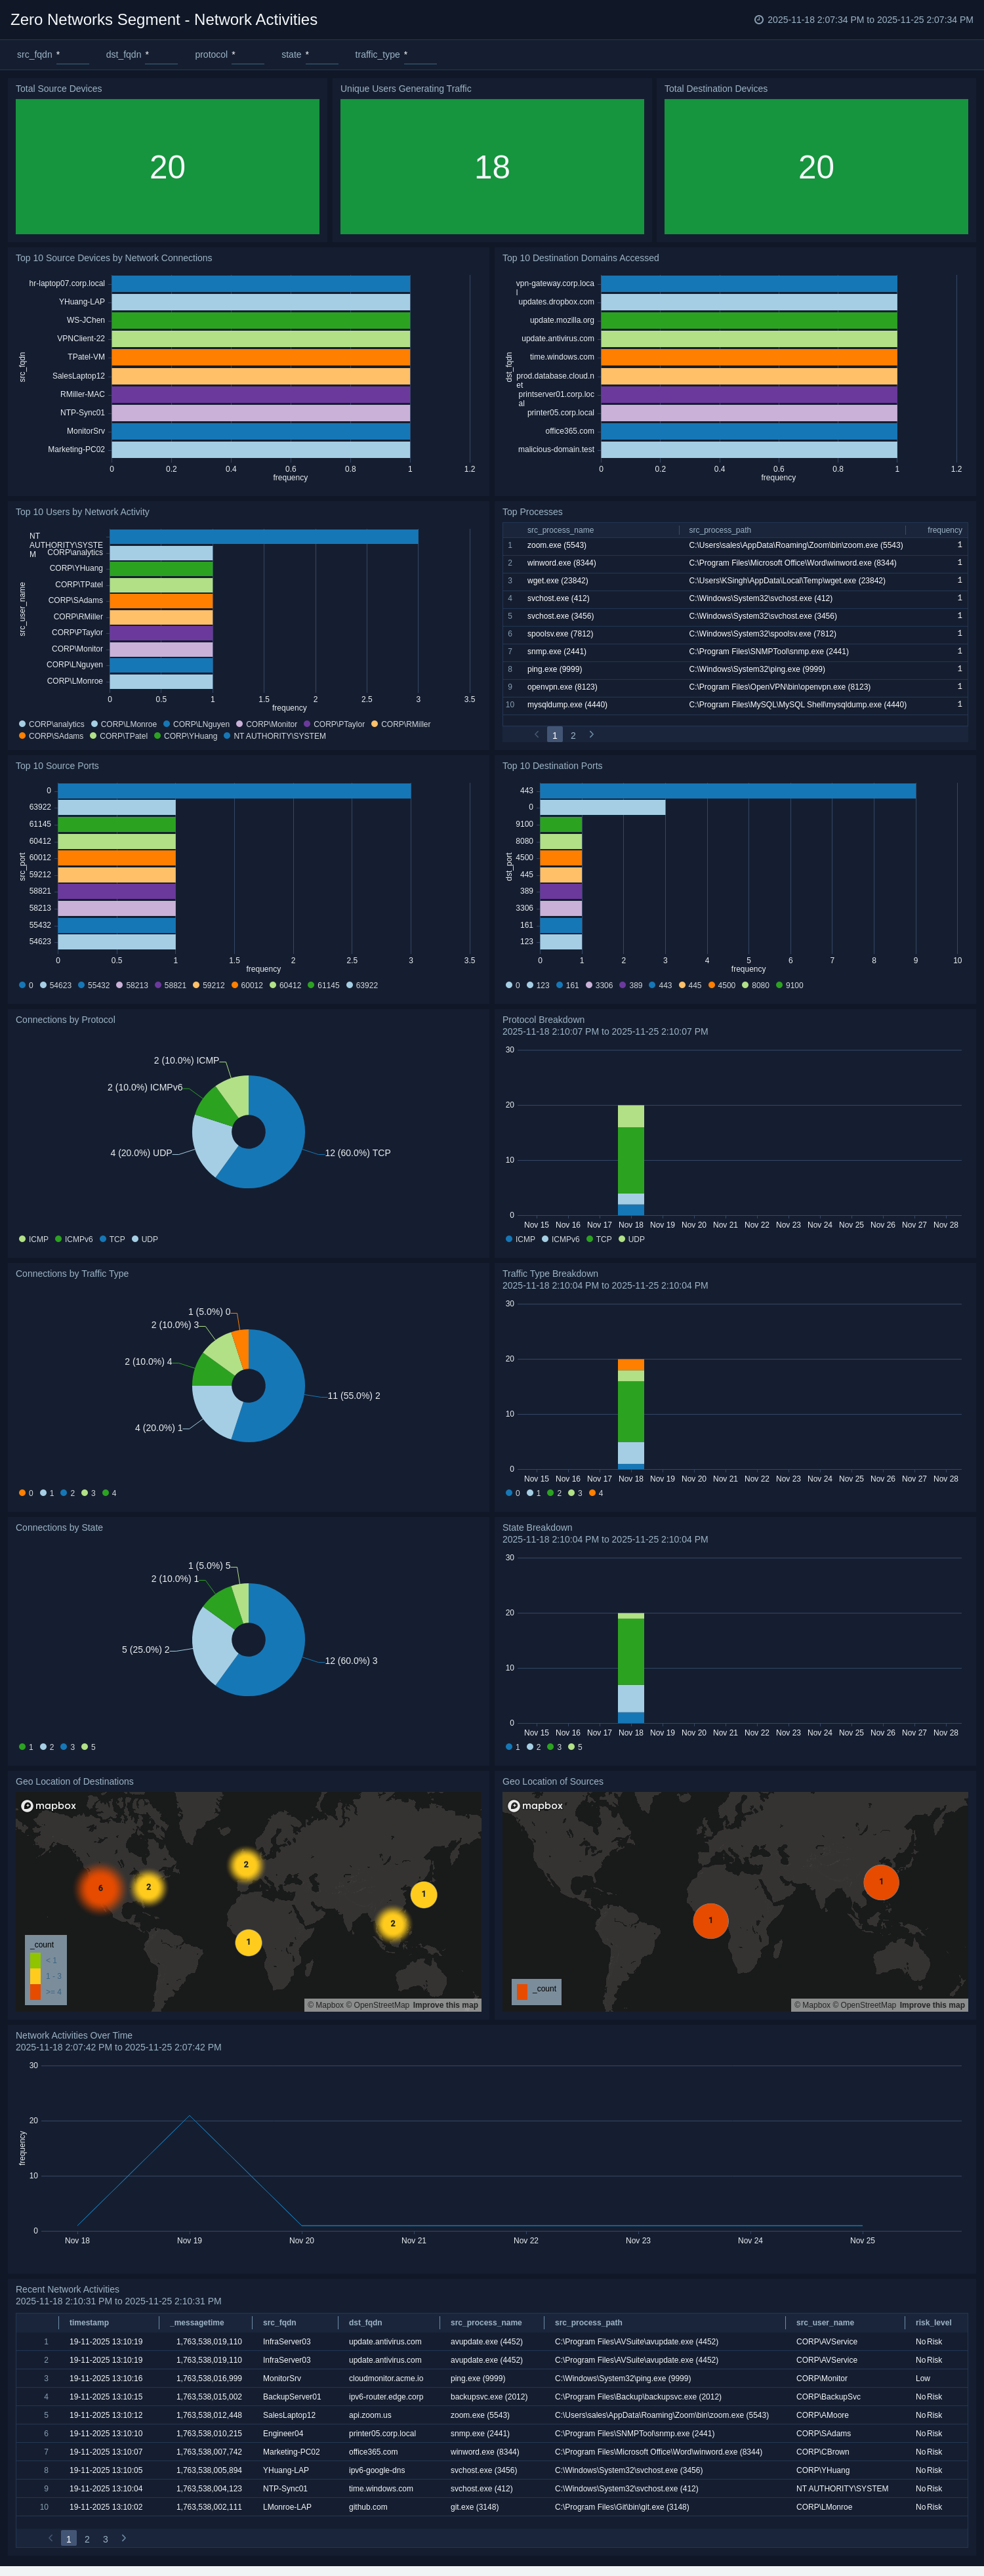
Security
The Zero Networks Segment - Security view provides a comprehensive picture of the organization’s threat posture and enforcement activity, unifying every indicator of risk into a single operational perspective. It tracks high‑risk connections, threat‑score distributions, and connection reasons to reveal which endpoints, users, or processes are engaging in potentially unsafe communications. Visual metrics categorize network events by threat severity, connection outcome, and justification reason, exposing patterns that signal policy violations, misconfigurations, or emerging threats. Detailed tables connect threat levels to specific destinations, processes, and users, allowing analysts to pinpoint the sources of elevated risk. Global mapping identifies traffic to and from embargoed or untrusted regions, while information on multi‑factor authentication usage and unmonitored rule creation highlights compliance gaps or policy bypasses. Together, these insights give security and operations teams real‑time awareness of exposure, enabling proactive mitigation, enforcement validation, and continuous assurance of Zero Trust segmentation controls.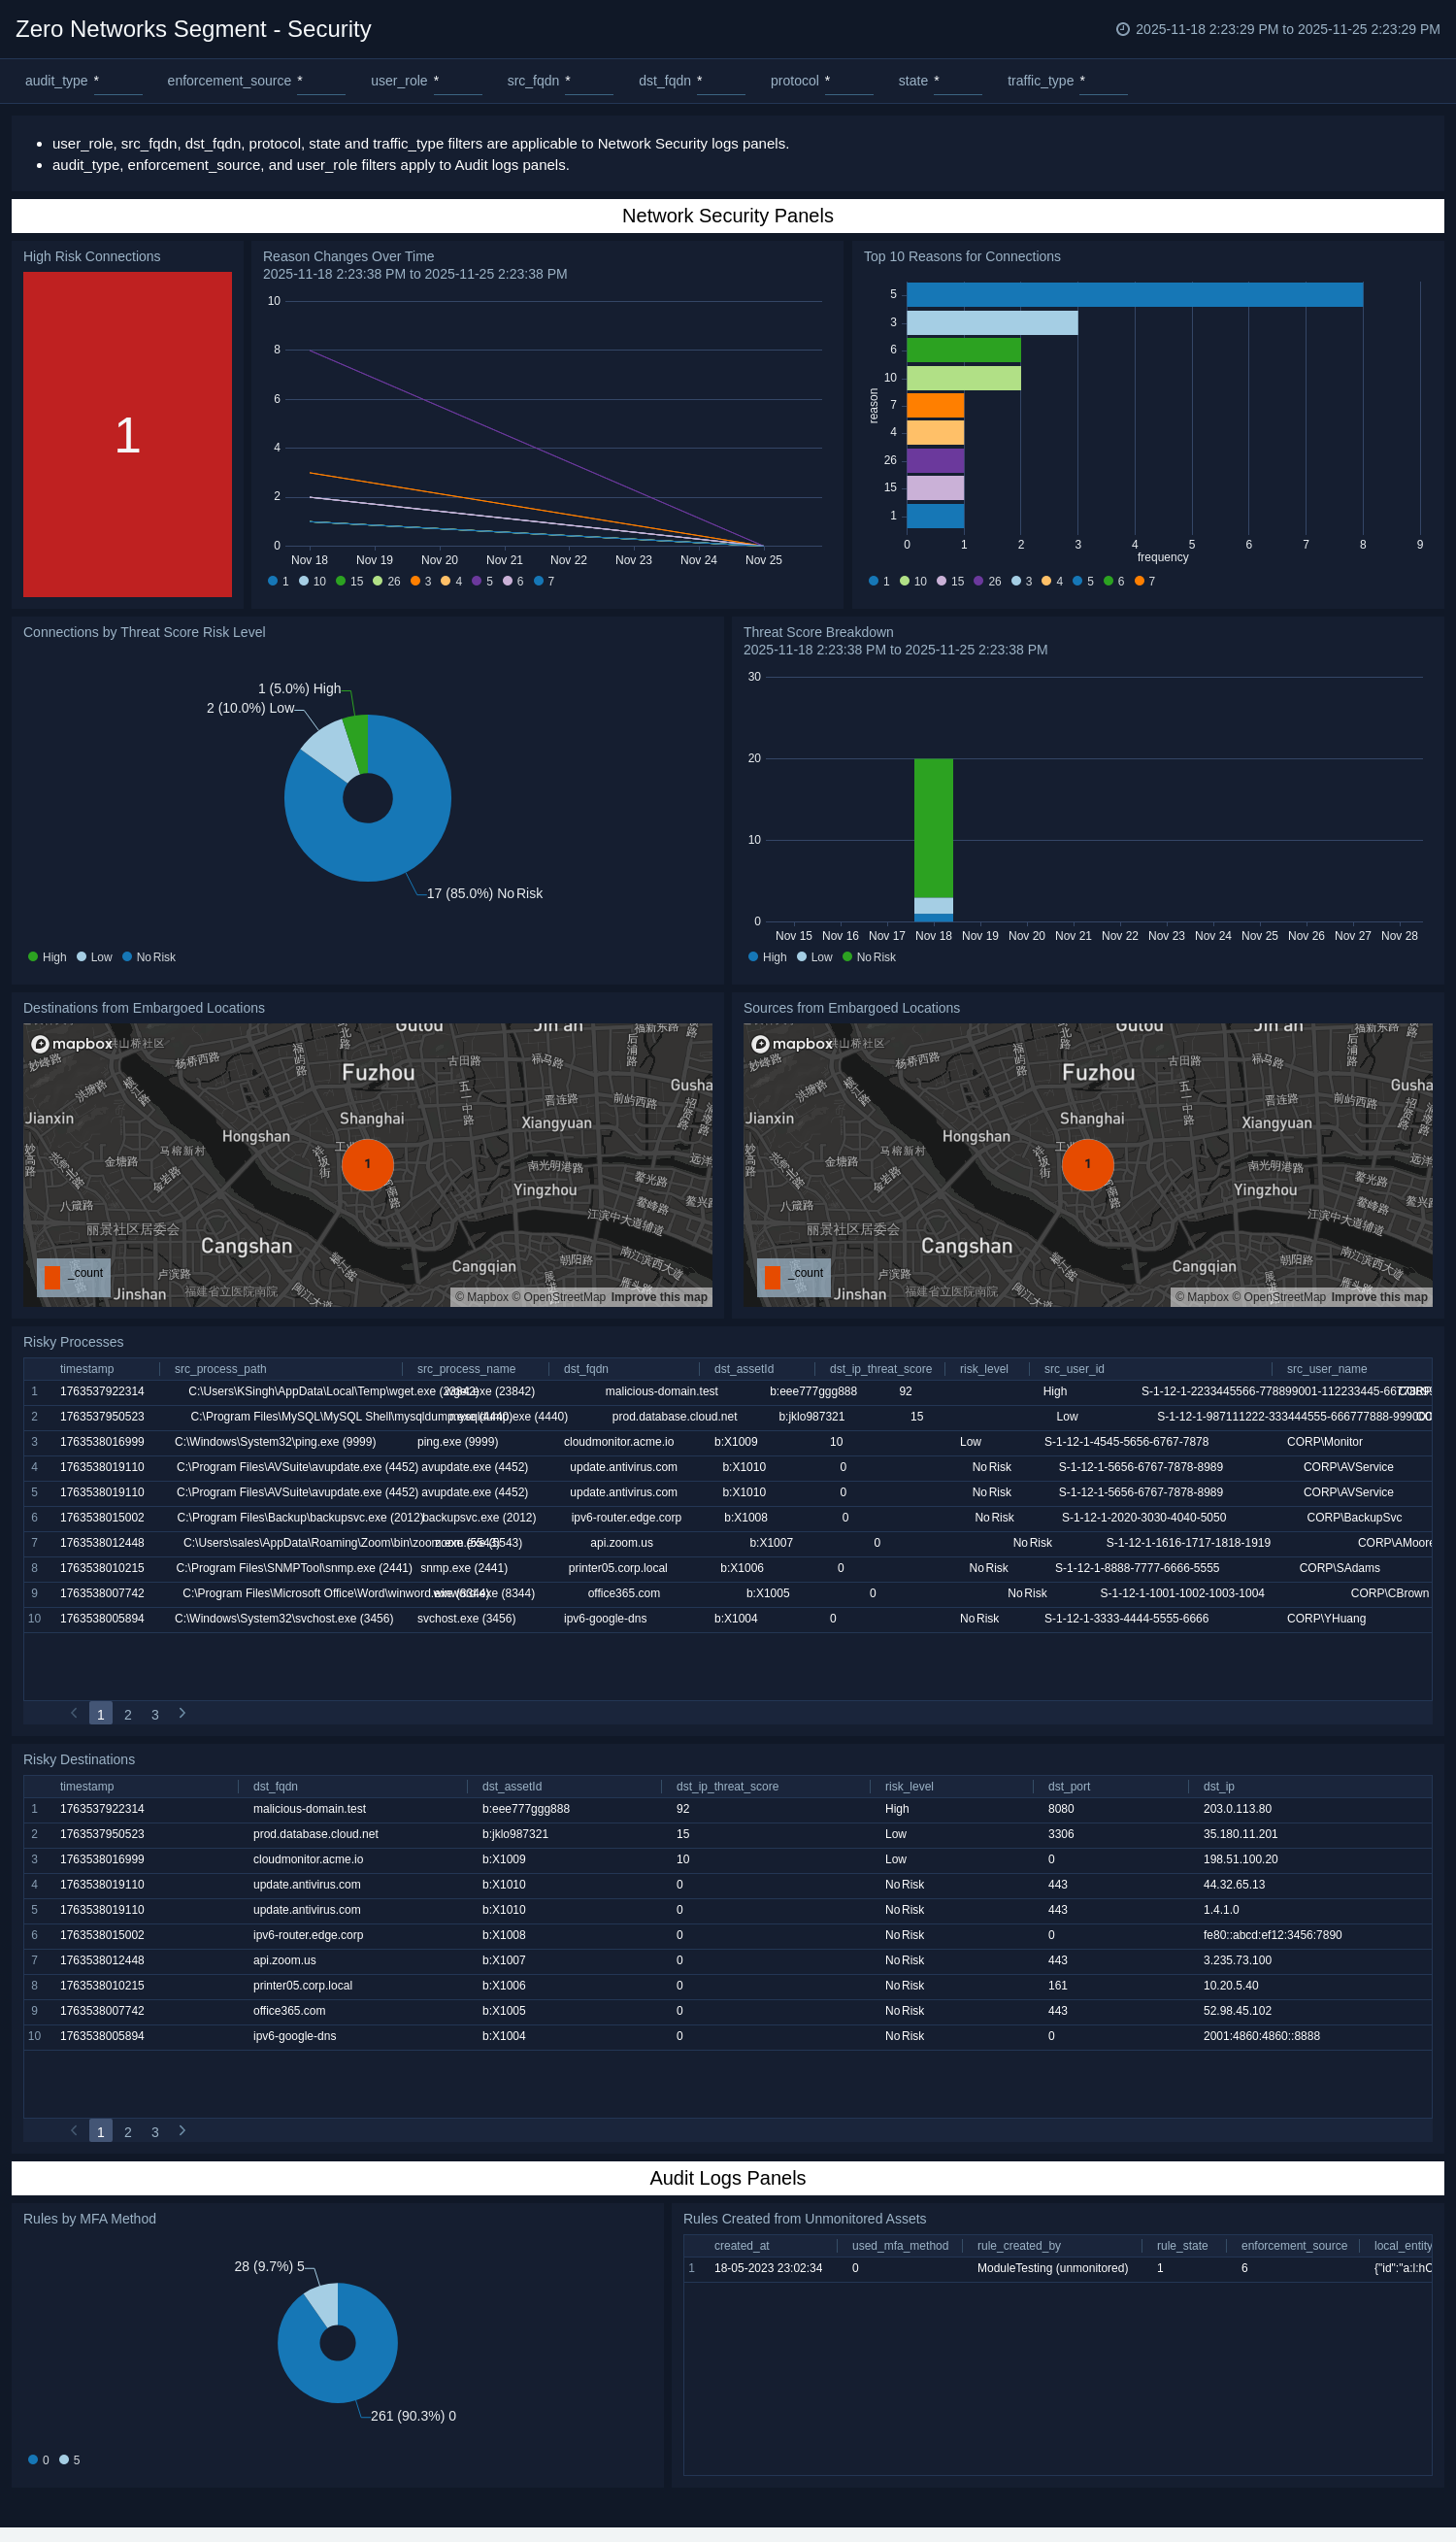
Audits Events
The Zero Networks Segment - Audits Events view provides unified visibility into all policy, configuration, and access-control changes occurring across the Zero Networks environment. It captures every audit event from rule creation, update, and approval to enforcement source actions, linking each to the responsible actor, affected assets, and time of change. Metrics track total audits, top users, and most modified assets, while visual distributions by audit type, user role, enforcement source, and rule state reveal who is making changes and through which system components. Temporal views highlight spikes in activity, exposing patterns that may signal configuration drift or unauthorized updates. Detailed tables correlate users, assets, and actions to support fast investigation and compliance verification. By bringing policy-level governance together in one place, this view enables teams to maintain accountability, trace decision history, and ensure that every modification to Zero Trust segmentation rules aligns with organizational security and compliance standards. 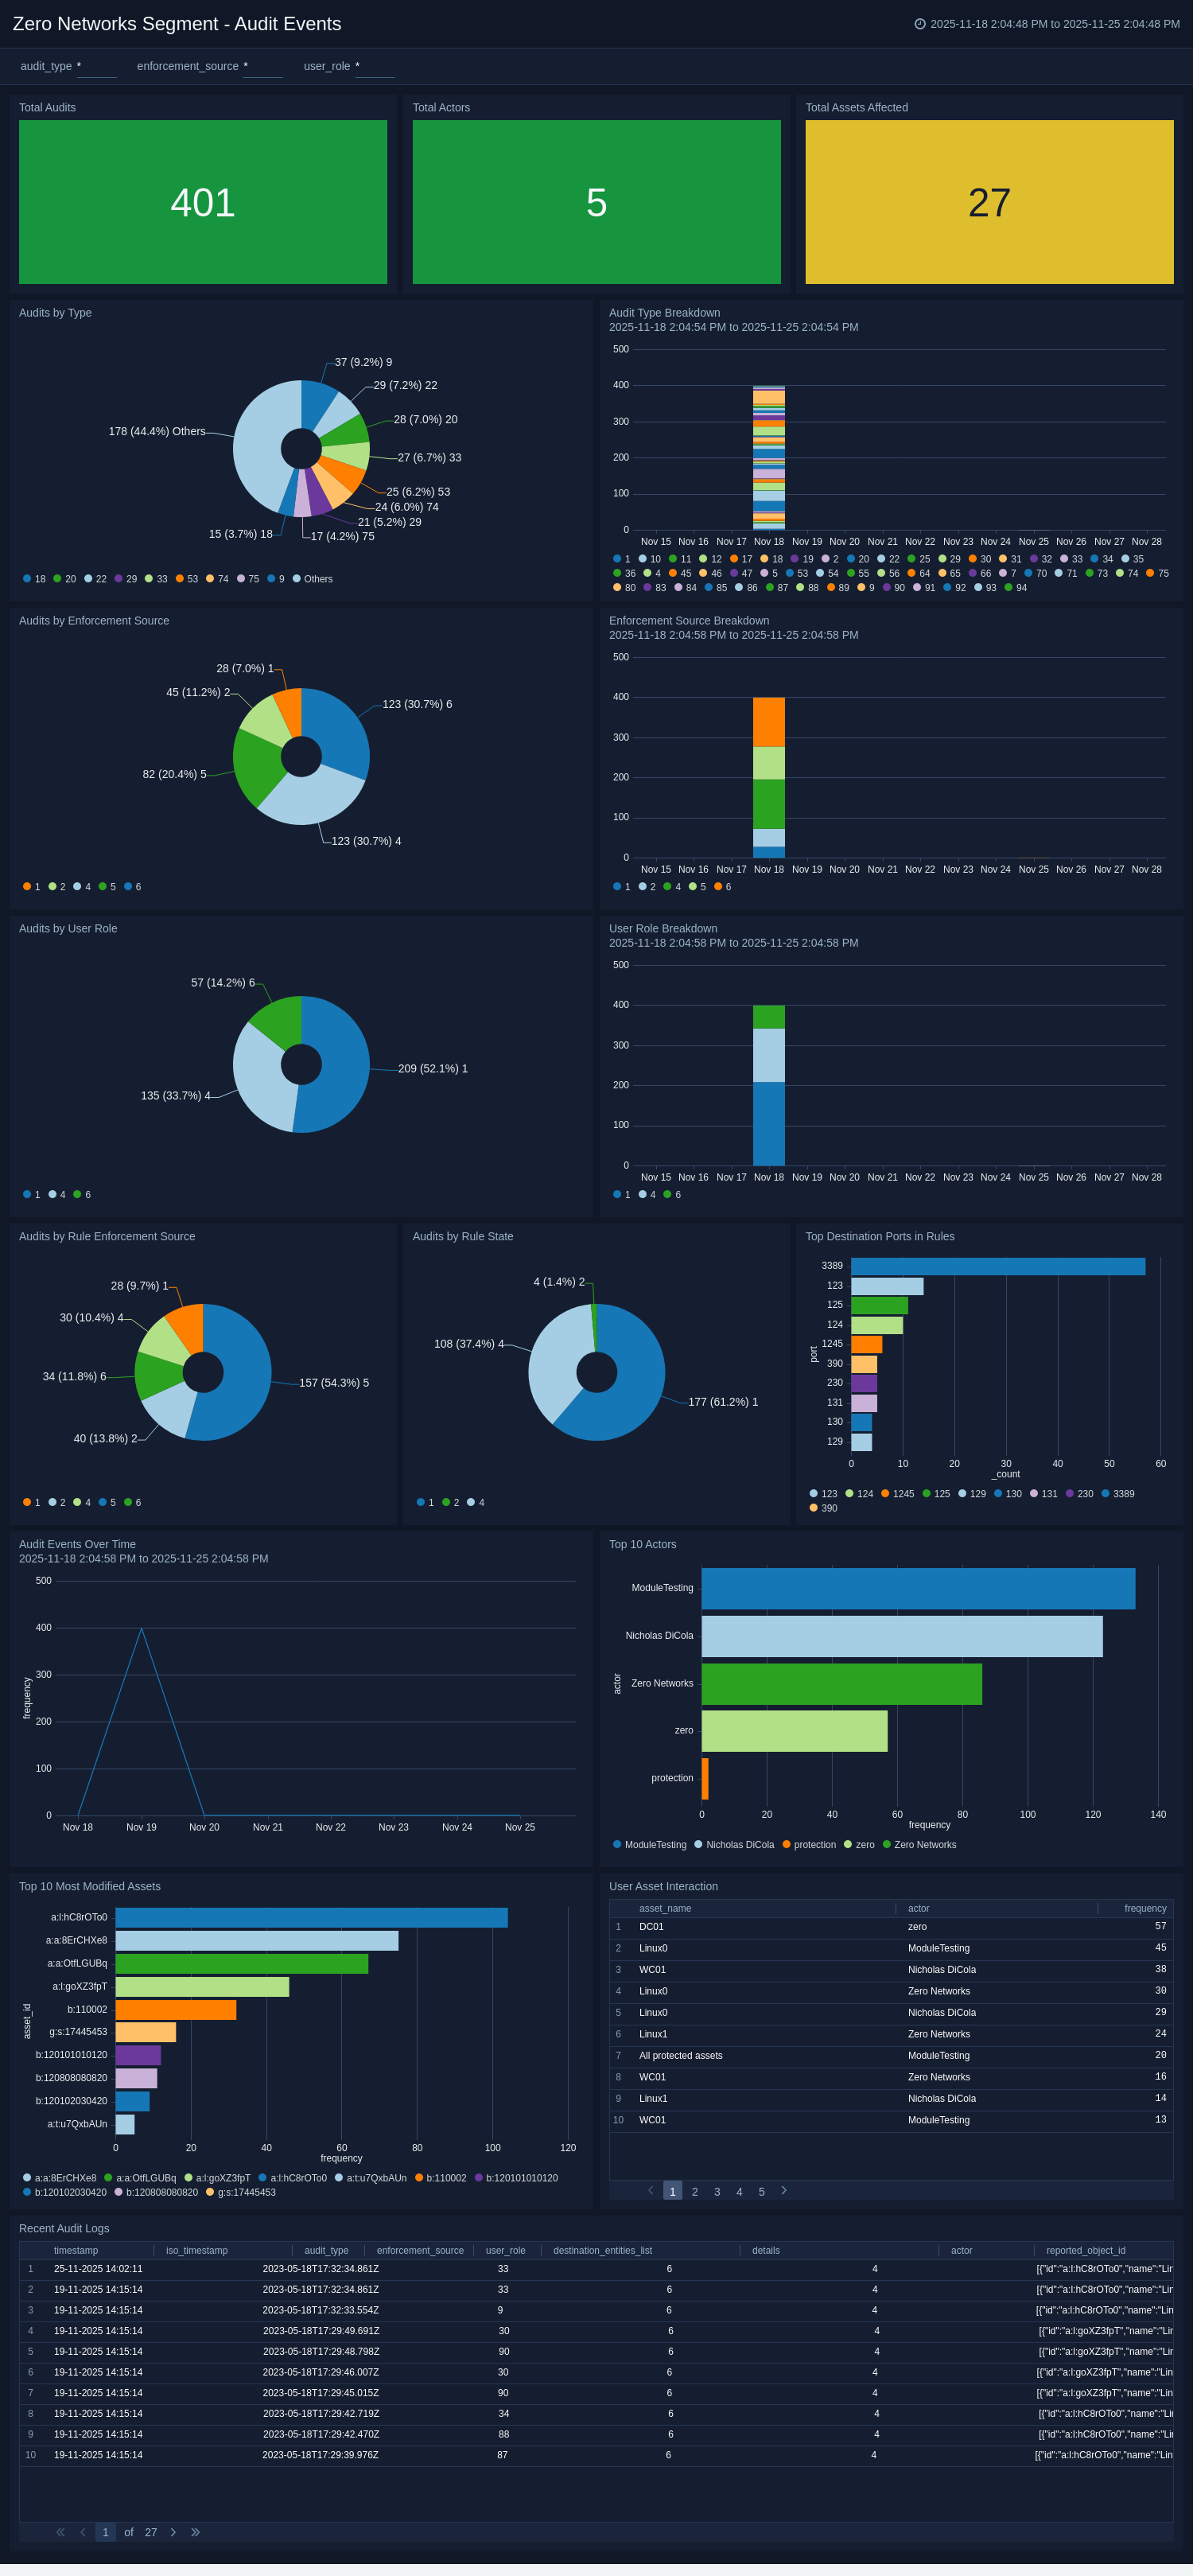
Create monitors for the Zero Networks Segment app
From your App Catalog:
- From the Sumo Logic navigation, select App Catalog.
- In the Search Apps field, search for and then select your app.
- Make sure the app is installed.
- Navigate to What's Included tab and scroll down to the Monitors section.
- Click Create next to the pre-configured monitors. In the create monitors window, adjust the trigger conditions and notifications settings based on your requirements.
- Scroll down to Monitor Details.
- Under Location click on New Folder.
note
By default, monitor will be saved in the root folder. So to make the maintenance easier, create a new folder in the location of your choice.
- Enter Folder Name. Folder Description is optional.
tip
Using app version in the folder name will be helpful to determine the versioning for future updates.
- Click Create. Once the folder is created, click on Save.
Zero Networks Segment alerts
| Name | Description | Trigger Type (Critical / Warning / MissingData) | Alert Condition |
|---|---|---|---|
Zero Networks Segment - Sources from Embargoed Locations | Generates an alert when one or more source IP addresses originate from embargoed or restricted geographies. This helps identify unauthorized or non‑compliant traffic entering the network from high-risk regions | Critical | Count > 0 |
Zero Networks Segment - Destinations from Embargoed Locations | Triggers when outbound connections are detected to destinations associated with embargoed countries or sanctioned regions. Such connections may represent policy violations or potential data exfiltration attempts. | Critical | Count > 0 |
Zero Networks Segment - High Risk Connections | Alerts when network sessions involve destinations with a threat score greater than 50 indicating known malicious infrastructure or suspicious domains that require immediate investigation. | Critical | Count > 0 |
Upgrading/Downgrading the Zero Networks Segment app (Optional)
To update the app, do the following:
Next-Gen App: To install or update the app, you must be an account administrator or a user with Manage Apps, Manage Monitors, Manage Fields, Manage Metric Rules, and Manage Collectors capabilities depending upon the different content types part of the app.
- Select App Catalog.
- In the Search Apps field, search for and then select your app.
Optionally, you can identify apps that can be upgraded in the Upgrade available section. - To upgrade the app, select Upgrade from the Manage dropdown.
- If the upgrade does not have any configuration or property changes, you will be redirected to the Preview & Done section.
- If the upgrade has any configuration or property changes, you will be redirected to the Setup Data page.
- In the Configure section of your respective app, complete the following fields.
- Field Name. If you already have collectors and sources set up, select the configured metadata field name (eg _sourcecategory) or specify other custom metadata (eg: _collector) along with its metadata Field Value.
- Click Next. You will be redirected to the Preview & Done section.
Post-update
Your upgraded app will be installed in the Installed Apps folder and dashboard panels will start to fill automatically.
See our Release Notes changelog for new updates in the app.
To revert the app to a previous version, do the following:
- Select App Catalog.
- In the Search Apps field, search for and then select your app.
- To version down the app, select Revert to < previous version of your app > from the Manage dropdown.
Uninstalling the Zero Networks Segment app (Optional)
To uninstall the app, do the following:
- Select App Catalog.
- In the 🔎 Search Apps field, run a search for your desired app, then select it.
- Click Uninstall.