Okta

Okta provides secure identity management and access control between users and applications on any device. The Sumo Logic app for Okta offers comprehensive visibility into identity, access, and authentication activity by analyzing Okta system logs. The app includes dashboards that consolidate policy management, user activity, lifecycle events, and threat detection to support compliance, investigation, and continuous improvement in security posture.
Log types
The Sumo Logic collector uses the Okta API to collect two types of logs:
- System logs. Collected via the Okta System Log API. The log types include authentication, events, and actions. For more information, see the Okta System Log API.
- User logs. Collected via the Okta Users API and User Groups API. Includes user profile data, group membership, account status, and credential information.
Sample log messages
System Log
{
   "actor":{
      "id":"00u17b6c3rwVP7kqo1d8",
      "type":"User",
      "alternateId":"kyle.diedrich@company.com",
      "displayName":"Kyle Diedrich",
      "detailEntry":null
   },
   "client":{
      "userAgent":{
         "rawUserAgent":"PostmanRuntime/3.0.11-hotfix.2",
         "os":"Unknown",
         "browser":"UNKNOWN"
      },
      "zone":"null",
      "device":"Unknown",
      "id":null,
      "ipAddress":"12.97.85.90",
      "geographicalContext":{
         "city":"San Francisco",
         "state":null,
         "country":"United States",
         "postalCode":"94107",
         "geolocation":{
            "lat":37.7697,
            "lon":-122.3933
         }
      }
   },
   "authenticationContext":{
      "authenticationProvider":null,
      "credentialProvider":null,
      "credentialType":null,
      "issuer":null,
      "interface":null,
      "authenticationStep":0,
      "externalSessionId":"trsp5PU7OIoTgCOdFBgJOQWIA"
   },
   "displayMessage":"Delete application",
   "eventType":"application.lifecycle.delete",
   "outcome":{
      "result":"SUCCESS",
      "reason":null
   },
   "published":"2017-10-02T17:38:45+0000",
   "securityContext":{
      "asNumber":null,
      "asOrg":null,
      "isp":null,
      "domain":null,
      "isProxy":null
   },
   "severity":"INFO",
   "debugContext":{
      "debugData":{
         "requestUri":"/api/v1/apps/0oa1alyz0mr8M2MoG1d8"
      }
   },
   "legacyEventType":"app.generic.config.app_deleted",
   "transaction":{
      "type":"WEB",
      "id":"WRzO-wWGVlYAavrUTHqwcgAABsA",
      "detail":{ }
   },
   "uuid":"49916412-d679-4285-b3e0-d740c73e4999",
   "version":"0",
   "request":{
      "ipChain":[
         {
            "ip":"12.97.85.90",
            "geographicalContext":{
               "city":"San Francisco",
               "state":null,
               "country":"United States",
               "postalCode":"94107",
               "geolocation":{
                  "lat":37.7697,
                  "lon":-122.3933
               }
            },
            "version":"V4",
            "source":null
         },
         {
            "ip":"54.235.68.72",
            "geographicalContext":{
               "city":"Ashburn",
               "state":null,
               "country":"United States",
               "postalCode":"20149",
               "geolocation":{
                  "lat":39.0481,
                  "lon":-77.4728
               }
            },
            "version":"V4",
            "source":null
         }
      ]
   },
   "target":[
      {
         "id":"0oa1alyz0mr8M2MoG1d8",
         "type":"AppInstance",
         "alternateId":"Cisco AnyConnect VPN (2)",
         "displayName":"Cisco AnyConnect VPN",
         "detailEntry":null
      }
   ]
}
User Logs
{
  "_groups": [
    {
      "id": "00g1abc123Everyone0x7",
      "profile": {
        "name": "Everyone",
        "description": "All users in your organization"
      }
    },
    {
      "id": "00g1yza567HR0x7",
      "profile": {
        "name": "Human Resources",
        "description": "HR and people operations team"
      }
    },
    {
      "id": "00g1mno345Engineering0x7",
      "profile": {
        "name": "Engineering",
        "description": "Software engineering team"
      }
    },
    {
      "id": "00g1vwx234Finance0x7",
      "profile": {
        "name": "Finance",
        "description": "Finance and accounting team"
      }
    }
  ],
  "_links": {
    "self": {
      "href": "https://globexcorp.okta.com/api/v1/users/00u17m9zau6BuEWNA1d8"
    }
  },
  "activated": "2022-10-19T13:59:47.000Z",
  "created": "2022-10-18T05:59:47.000Z",
  "credentials": {
    "password": {},
    "provider": { "name": "OKTA", "type": "OKTA" },
    "recovery_question": { "question": "What is your mother's maiden name?" }
  },
  "id": "00u17m9zau6BuEWNA1d8",
  "lastLogin": "2023-04-24T13:59:47.000Z",
  "lastUpdated": "2023-02-02T13:59:47.000Z",
  "passwordChanged": "2022-12-29T13:59:47.000Z",
  "profile": {
    "email": "chris.robins@globexcorp.com",
    "firstName": "Christian",
    "lastName": "Robins",
    "login": "chris.robins@globexcorp.com",
    "mobilePhone": "+18735427481",
    "secondEmail": "christian.robins@yahoo.com"
  },
  "status": "ACTIVE",
  "statusChanged": "2022-11-04T13:59:47.000Z",
  "type": { "id": "oty1abc123defaultType0x7" }
}
Sample queries
={{Logsdatasource}} actor eventType
| json "uuid","eventType","actor.displayName","actor.type","severity",
"client.userAgent.rawUserAgent","client.userAgent.os","client.userAgent.browser",
"client.device","client.geographicalContext.city","client.geographicalContext.state",
"client.geographicalContext.country","outcome.result","securityContext.isp"
as uuid,event_type,actor_name,actor_type,severity,user_agent,os,browser, device,city,state,country,result,isp nodrop
// Global filters
| where if("{{event_type}}" = "*", true,event_type matches "{{event_type}}")
| where if("{{okta_user}}" = "*", true, actor_name matches "{{okta_user}}")
| where if("{{actor_type}}" = "*", true, actor_type matches "{{actor_type}}")
| where if("{{severity}}" = "*", true, severity matches "{{severity}}")
| where if("{{user_agent}}" = "*", true, user_agent matches "{{user_agent}}")
| where if("{{device}}" = "*", true, device matches "{{device}}")
| where if("{{os}}" = "*", true, os matches "{{os}}")
| where if("{{browser}}" = "*", true, browser matches "{{browser}}")
| where if("{{city}}" = "*", true, city matches "{{city}}")
| where if("{{country}}" = "*", true, country matches "{{country}}")
| where if("{{state}}" = "*", true, state matches "{{state}}")
| where if("{{result}}" = "*", true, result matches "{{result}}")
| where if("{{internet_service_provider}}" = "*", true, isp matches "{{internet_service_provider}}")
// Panel specific
| count by uuid
| count
={{Logsdatasource}} actor eventType securityContext risk level HIGH
| json "uuid","eventType","actor.displayName","actor.type","severity", "client.userAgent.rawUserAgent","client.userAgent.os","client.userAgent.browser","client.device","client.geographicalContext.city","client.geographicalContext.state",
"client.geographicalContext.country","outcome.result","securityContext.isp","published","target.[*].type","securityContext.risk.detectionName","securityContext.risk.issuer","securityContext.risk.level","securityContext.risk.previousLevel","securityContext.risk.reasons"
as uuid,event_type,actor_name,actor_type,severity,user_agent,os,browser,device,city,state,country,result,isp,published,target_type,risk_detection_name,risk_issuer,risk_level,risk_previous_level,risk_reason nodrop
| where !isBlank(risk_level) AND risk_level = "HIGH"
// Global filters
| where if("{{event_type}}" = "*", true,event_type matches "{{event_type}}")
| where if("{{okta_user}}" = "*", true, actor_name matches "{{okta_user}}")
| where if("{{actor_type}}" = "*", true, actor_type matches "{{actor_type}}")
| where if("{{severity}}" = "*", true, severity matches "{{severity}}")
| where if("{{user_agent}}" = "*", true, user_agent matches "{{user_agent}}")
| where if("{{device}}" = "*", true, device matches "{{device}}")
| where if("{{os}}" = "*", true, os matches "{{os}}")
| where if("{{browser}}" = "*", true, browser matches "{{browser}}")
| where if("{{city}}" = "*", true, city matches "{{city}}")
| where if("{{country}}" = "*", true, country matches "{{country}}")
| where if("{{state}}" = "*", true, state matches "{{state}}")
| where if("{{result}}" = "*", true, result matches "{{result}}")
| where if("{{internet_service_provider}}" = "*", true, isp matches "{{internet_service_provider}}")
// Panel specific
| count by published, uuid, event_type,actor_name,actor_type,severity,user_agent,os,browser,device,city,state,country,result,isp,target_type,risk_detection_name, risk_issuer, risk_level, risk_previous_level, risk_reason
| count by published, event_type, actor_name, actor_type, severity, user_agent, os, browser, device, city, state, country, result, isp, target_type, risk_detection_name, risk_issuer, risk_level, risk_previous_level, risk_reason
| sort by published
| fields -_count
| limit 1000
Collection configuration and app installation
Depending on the set up collection method, you can configure and install the app in three ways:
- Create a new collector and install the app. Create a new Sumo Logic Cloud-to-Cloud (C2C) source under a new Sumo Logic Collector and later install the app, or
- Use an existing collector and install the app. Create a new Sumo Logic Cloud-to-Cloud (C2C) source under an existing Sumo Logic Collector and later install the app, or
- Use existing source and install the app. Use your existing configured Sumo Logic Cloud-to-Cloud (C2C) source and install the app.
Use the Cloud-to-Cloud Integration for Okta to create the source and use the same source category while installing the app. By following these steps, you can ensure that your Okta app is properly integrated and configured to collect and analyze your Okta data.
Create a new collector and install the app
To set up collection and install the app, do the following:
Next-Gen App: To install or update the app, you must be an account administrator or a user with Manage Apps, Manage Monitors, Manage Fields, Manage Metric Rules, and Manage Collectors capabilities depending upon the different content types part of the app.
- Select App Catalog.
- In the 🔎 Search Apps field, run a search for your desired app, then select it.
- Click Install App.
note
Sometimes this button says Add Integration.
- In the Set Up Collection section of your respective app, select Create a new Collector.
- Collector Name. Enter a Name to display the Source in the Sumo Logic web application. The description is optional.
- Timezone. Set the default time zone when it is not extracted from the log timestamp. Time zone settings on Sources override a Collector time zone setting.
- (Optional) Metadata. Click the +Add Metadata link to add a custom log Metadata Fields. Define the fields you want to associate, each metadata field needs a name (key) and value.
 A green circle with a checkmark is shown when the field exists and is enabled in the Fields table schema.
 An orange triangle with an exclamation point is shown when the field doesn't exist, or is disabled in the Fields table schema. In this case, you'll see an option to automatically add or enable the nonexistent fields to the Fields table schema. If a field is sent to Sumo Logic but isn’t present or enabled in the schema, it’s ignored and marked as Dropped.
- Click Next.
- Configure the source as specified in the
Infobox above, ensuring all required fields are included. - In the Configure section of your respective app, complete the following fields.
- Field Name. If you already have collectors and sources set up, select the configured metadata field name (eg _sourcecategory) or specify other custom metadata (eg: _collector) along with its metadata Field Value.
- Click Next. You will be redirected to the Preview & Done section.
Post-installation
Once your app is installed, it will appear in your Installed Apps folder, and dashboard panels will start to fill automatically.
Each panel slowly fills with data matching the time range query received since the panel was created. Results will not immediately be available but will be updated with full graphs and charts over time.
Use an existing collector and install the app
To set up the source in the existing collector and install the app, do the following:
Next-Gen App: To install or update the app, you must be an account administrator or a user with Manage Apps, Manage Monitors, Manage Fields, Manage Metric Rules, and Manage Collectors capabilities depending upon the different content types part of the app.
- Select App Catalog.
- In the 🔎 Search Apps field, run a search for your desired app, then select it.
- Click Install App.
note
Sometimes this button says Add Integration.
- In the Set Up Collection section of your respective app, select Use an existing Collector.
- From the Select Collector dropdown, select the collector that you want to set up your source with and click Next.
- Configure the source as specified in the
Infobox above, ensuring all required fields are included. - In the Configure section of your respective app, complete the following fields.
- Field Name. If you already have collectors and sources set up, select the configured metadata field name (eg _sourcecategory) or specify other custom metadata (eg: _collector) along with its metadata Field Value.
- Click Next. You will be redirected to the Preview & Done section.
Post-installation
Once your app is installed, it will appear in your Installed Apps folder, and dashboard panels will start to fill automatically.
Each panel slowly fills with data matching the time range query received since the panel was created. Results will not immediately be available but will be updated with full graphs and charts over time.
Use an existing source and install the app
To skip collection and only install the app, do the following:
Next-Gen App: To install or update the app, you must be an account administrator or a user with Manage Apps, Manage Monitors, Manage Fields, Manage Metric Rules, and Manage Collectors capabilities depending upon the different content types part of the app.
- Select App Catalog.
- In the 🔎 Search Apps field, run a search for your desired app, then select it.
- Click Install App.
note
Sometimes this button says Add Integration.
- In the Set Up Collection section of your respective app, select Skip this step and use existing source and click Next.
- In the Configure section of your respective app, complete the following fields.
- Field Name. If you already have collectors and sources set up, select the configured metadata field name (eg _sourcecategory) or specify other custom metadata (eg: _collector) along with its metadata Field Value.
- Click Next. You will be redirected to the Preview & Done section.
Post-installation
Once your app is installed, it will appear in your Installed Apps folder, and dashboard panels will start to fill automatically.
Each panel slowly fills with data matching the time range query received since the panel was created. Results will not immediately be available but will be updated with full graphs and charts over time.
Viewing the Okta dashboards
All dashboards have a set of filters that you can apply to the entire dashboard. Use these filters to drill down and examine the data to a granular level.
- You can change the time range for a dashboard or panel by selecting a predefined interval from a drop-down list, choosing a recently used time range, or specifying custom dates and times. Learn more.
- You can use template variables to drill down and examine the data on a granular level. For more information, see Filtering Dashboards with Template Variables.
- Most Next-Gen apps allow you to provide the scope at the installation time and are comprised of a key (
_sourceCategoryby default) and a default value for this key. Based on your input, the app dashboards will be parameterized with a dashboard variable, allowing you to change the dataset queried by all panels. This eliminates the need to create multiple copies of the same dashboard with different queries.
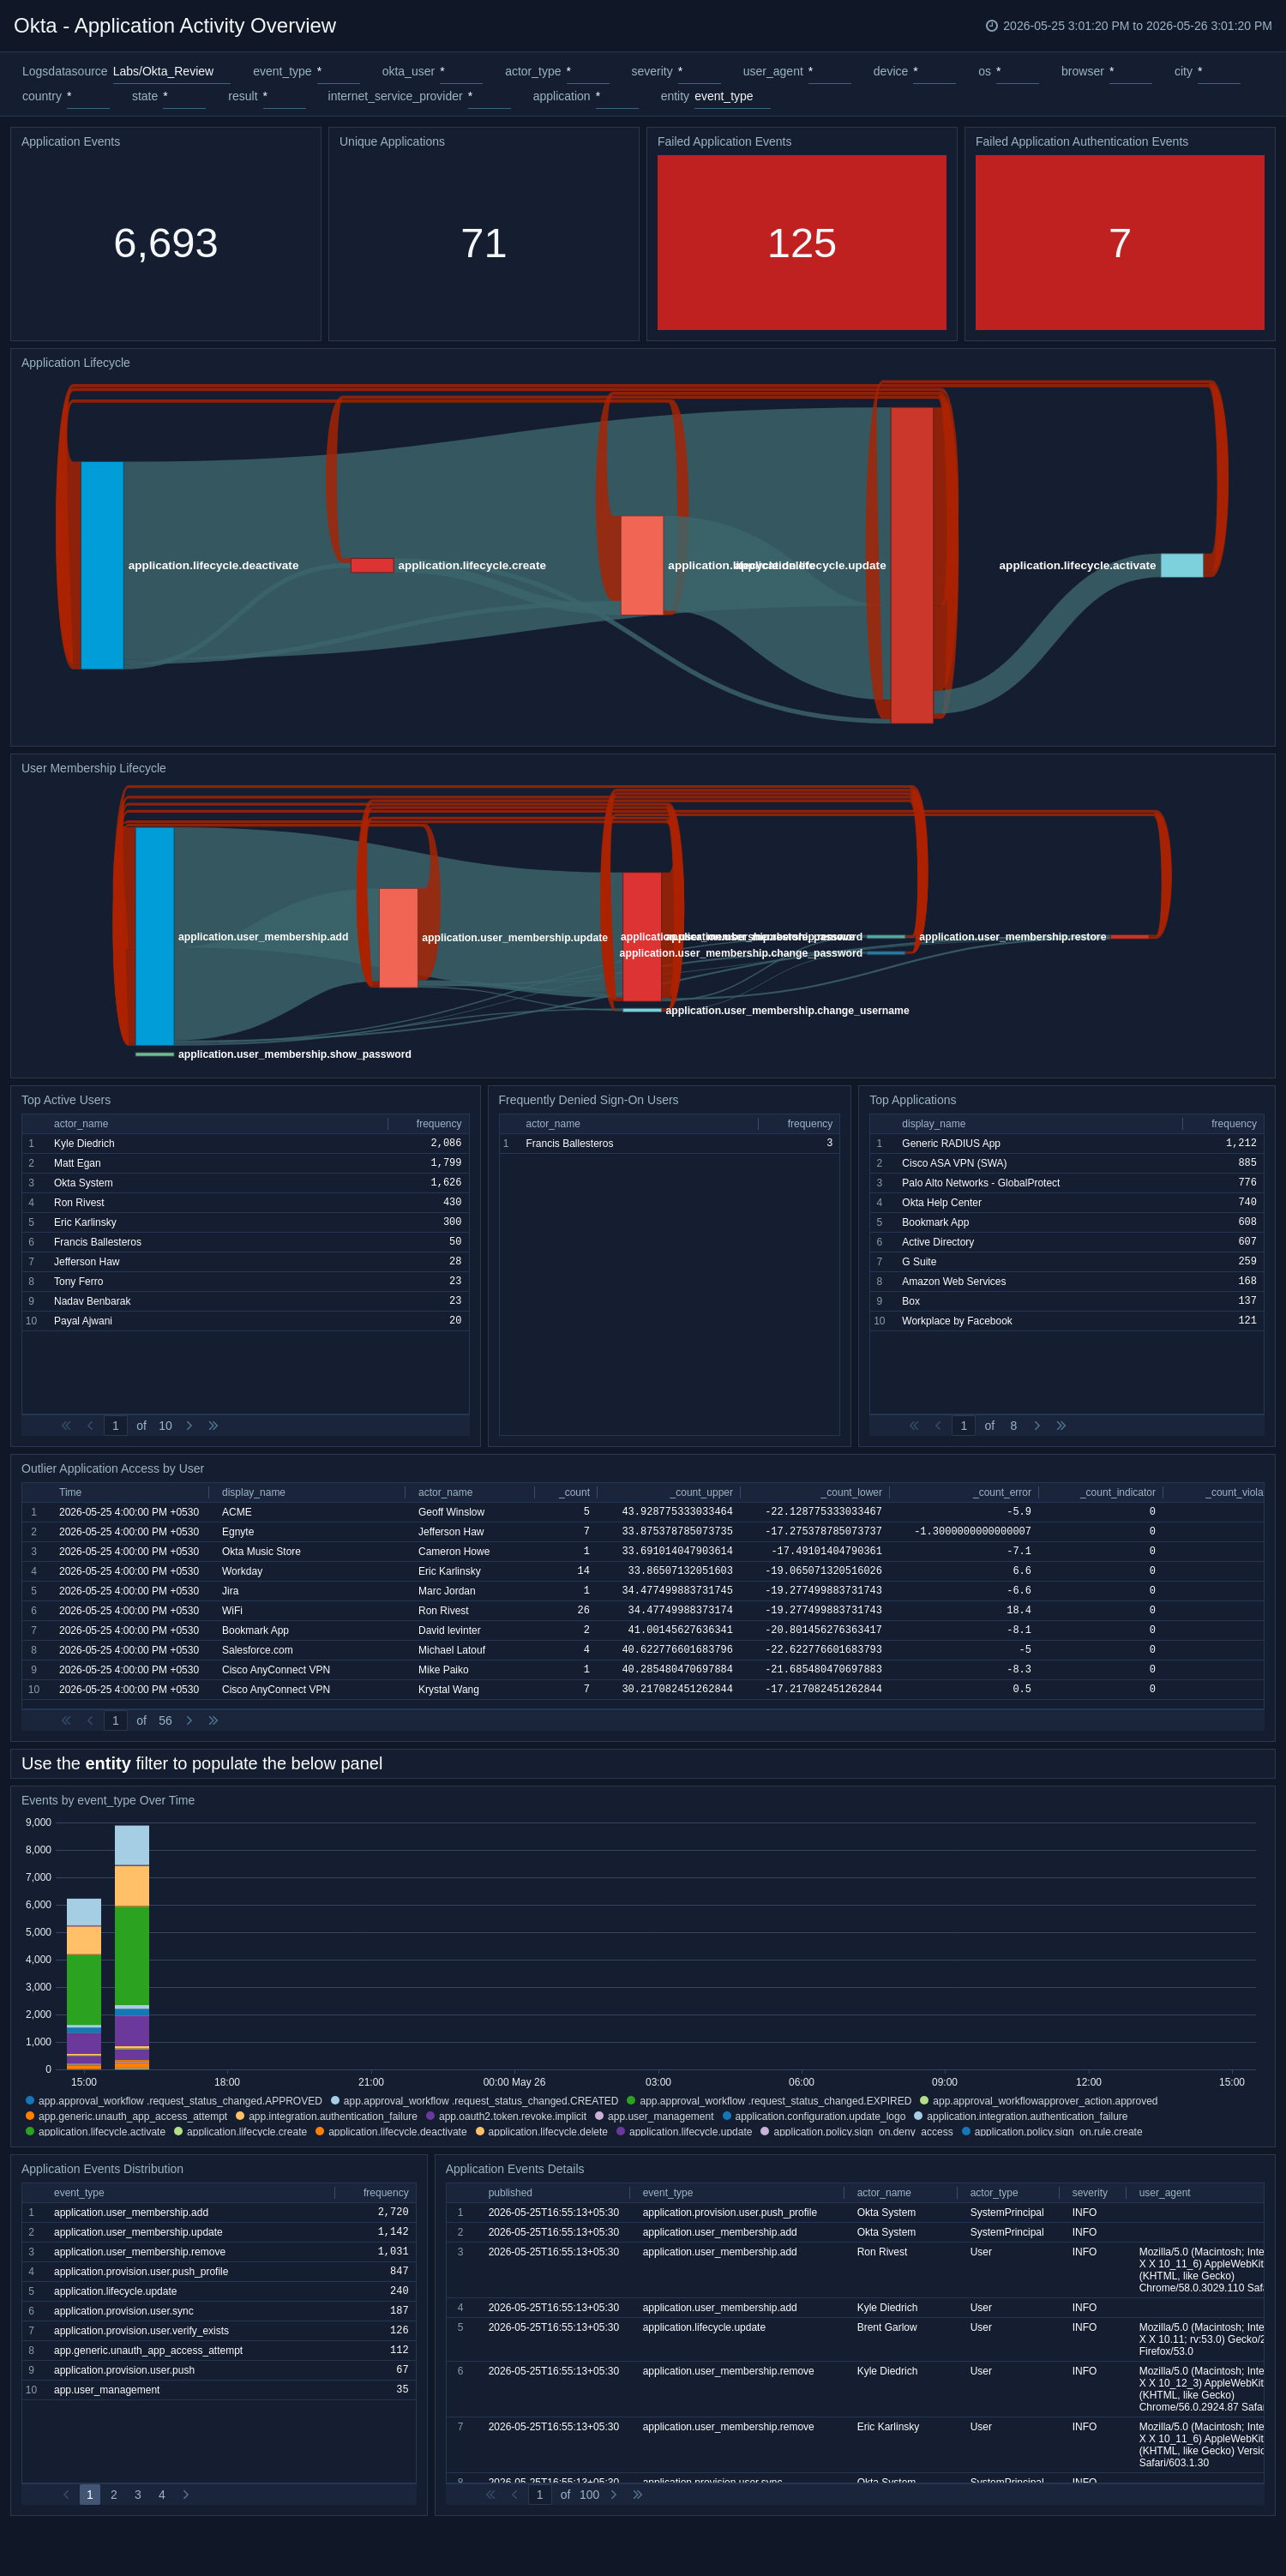
Application Activity Overview
The Okta - Application Activity Overview dashboard provides visibility into all application access events within your Okta environment. It tracks authentication outcomes, application usage trends, and lifecycle changes, highlighting top and frequently denied applications, as well as outlier access behaviors. This view enables administrators to monitor how users interact with enterprise applications and quickly identify anomalous or risky sign‑on patterns.
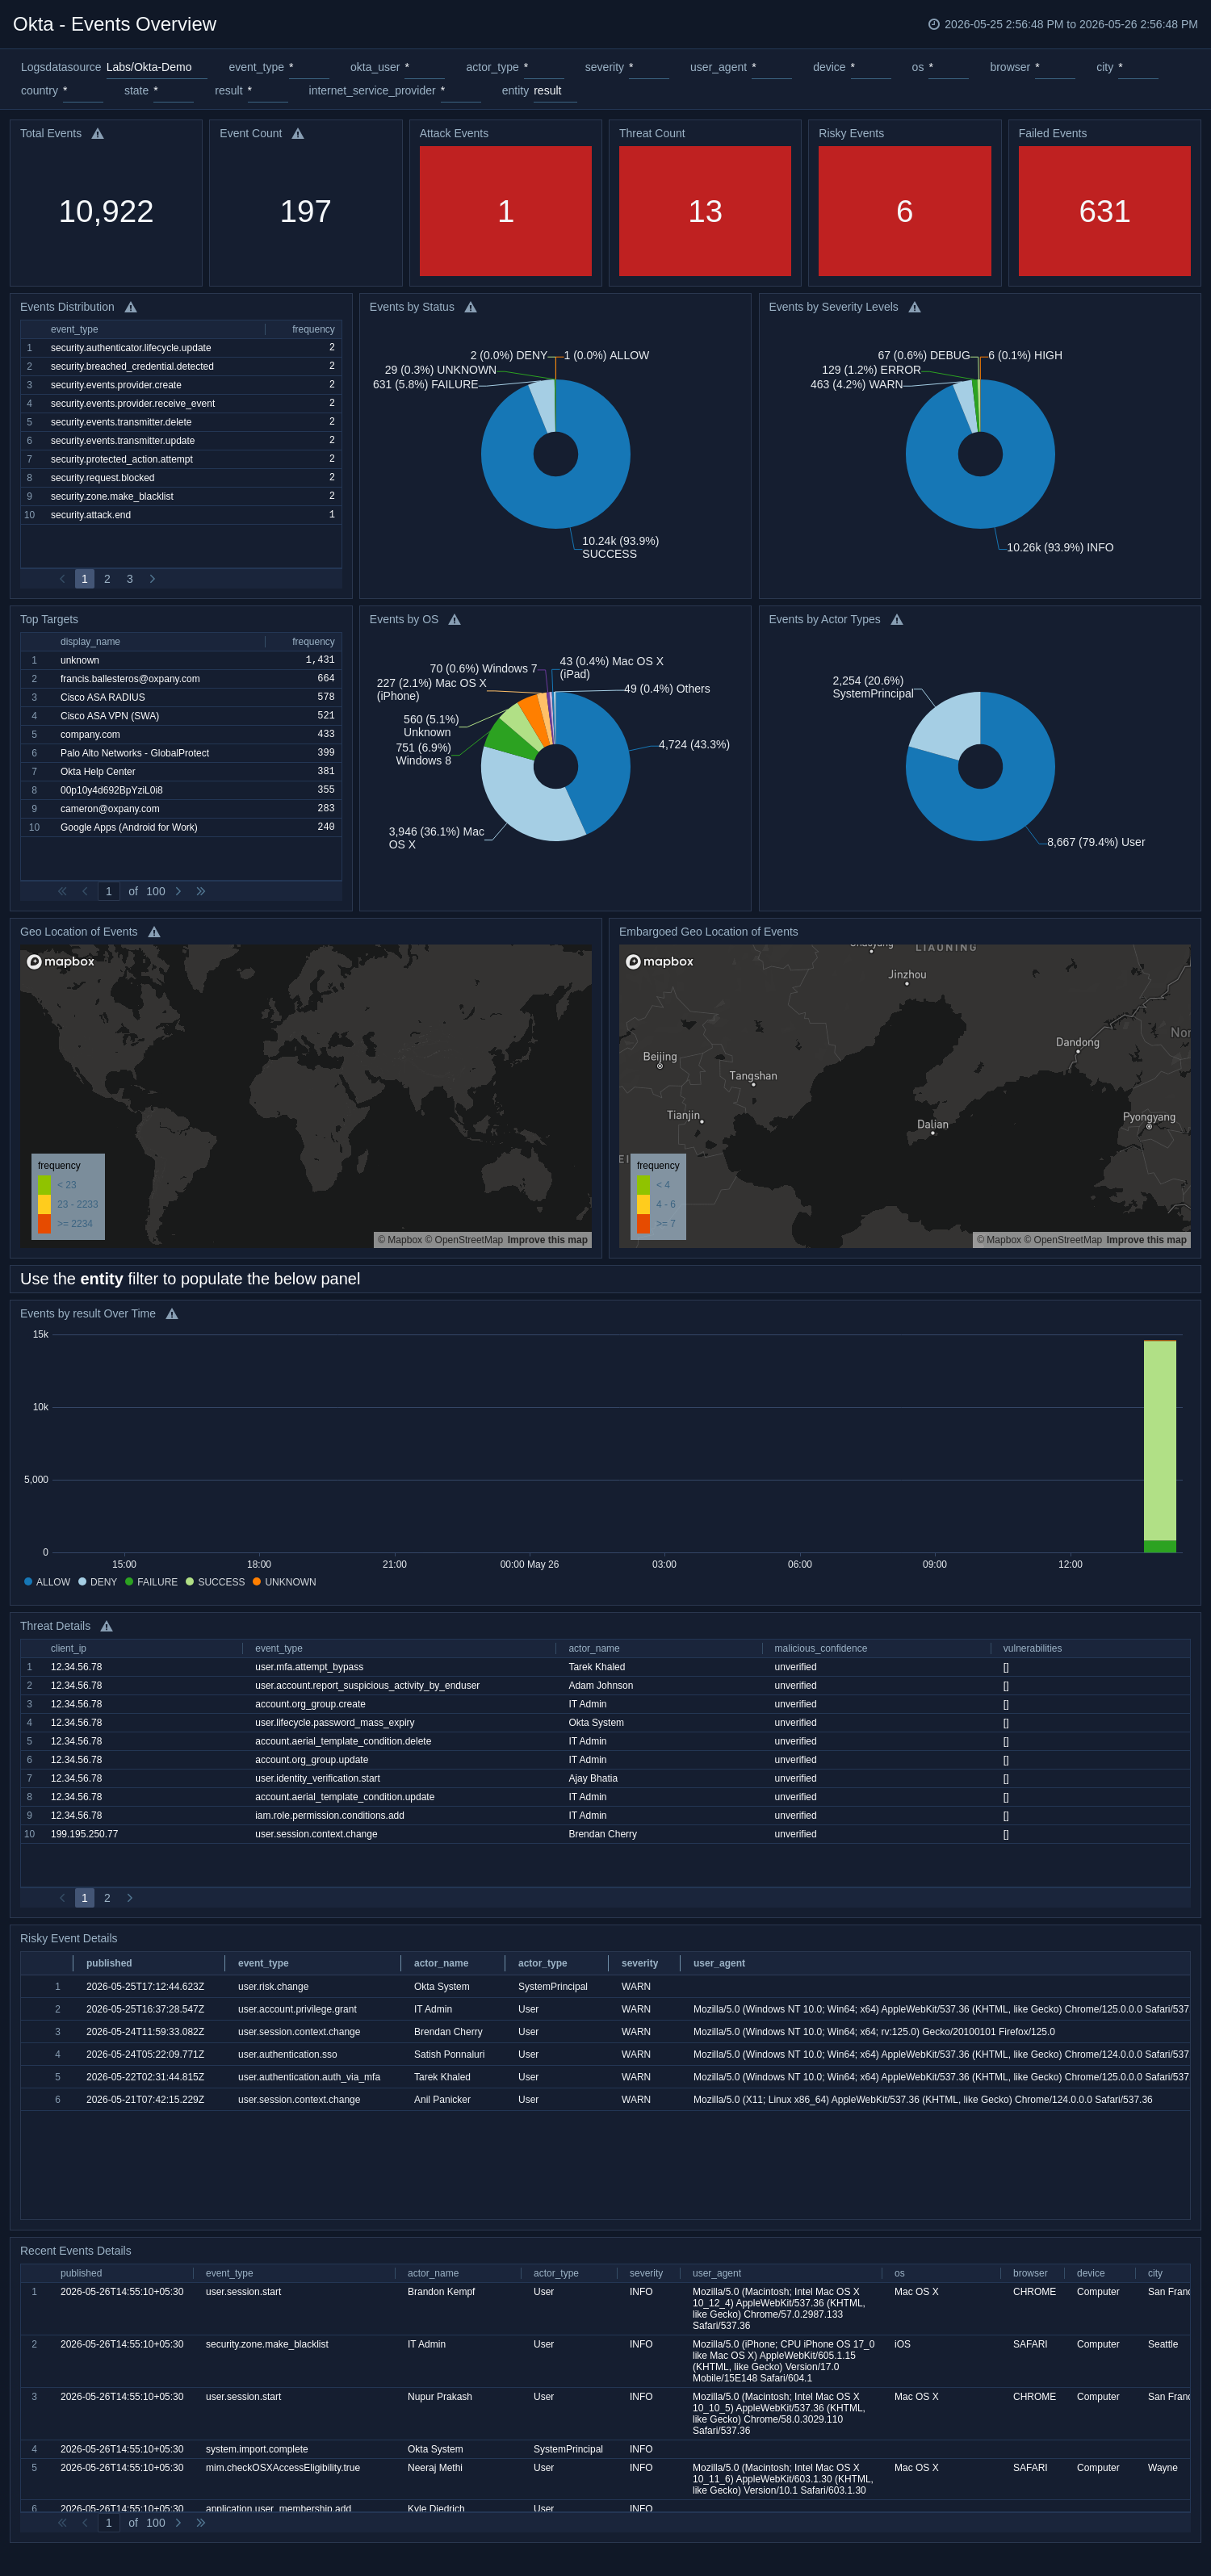
Events Overview
The Okta - Events Overview dashboard delivers a unified view of all Okta system events across users, applications, and policies. It visualizes event counts, severities, geographic distribution, and temporal patterns to surface spikes or anomalies. This dashboard serves as the central health and activity indicator, helping security teams monitor the overall state of Okta operations and environmental risk.
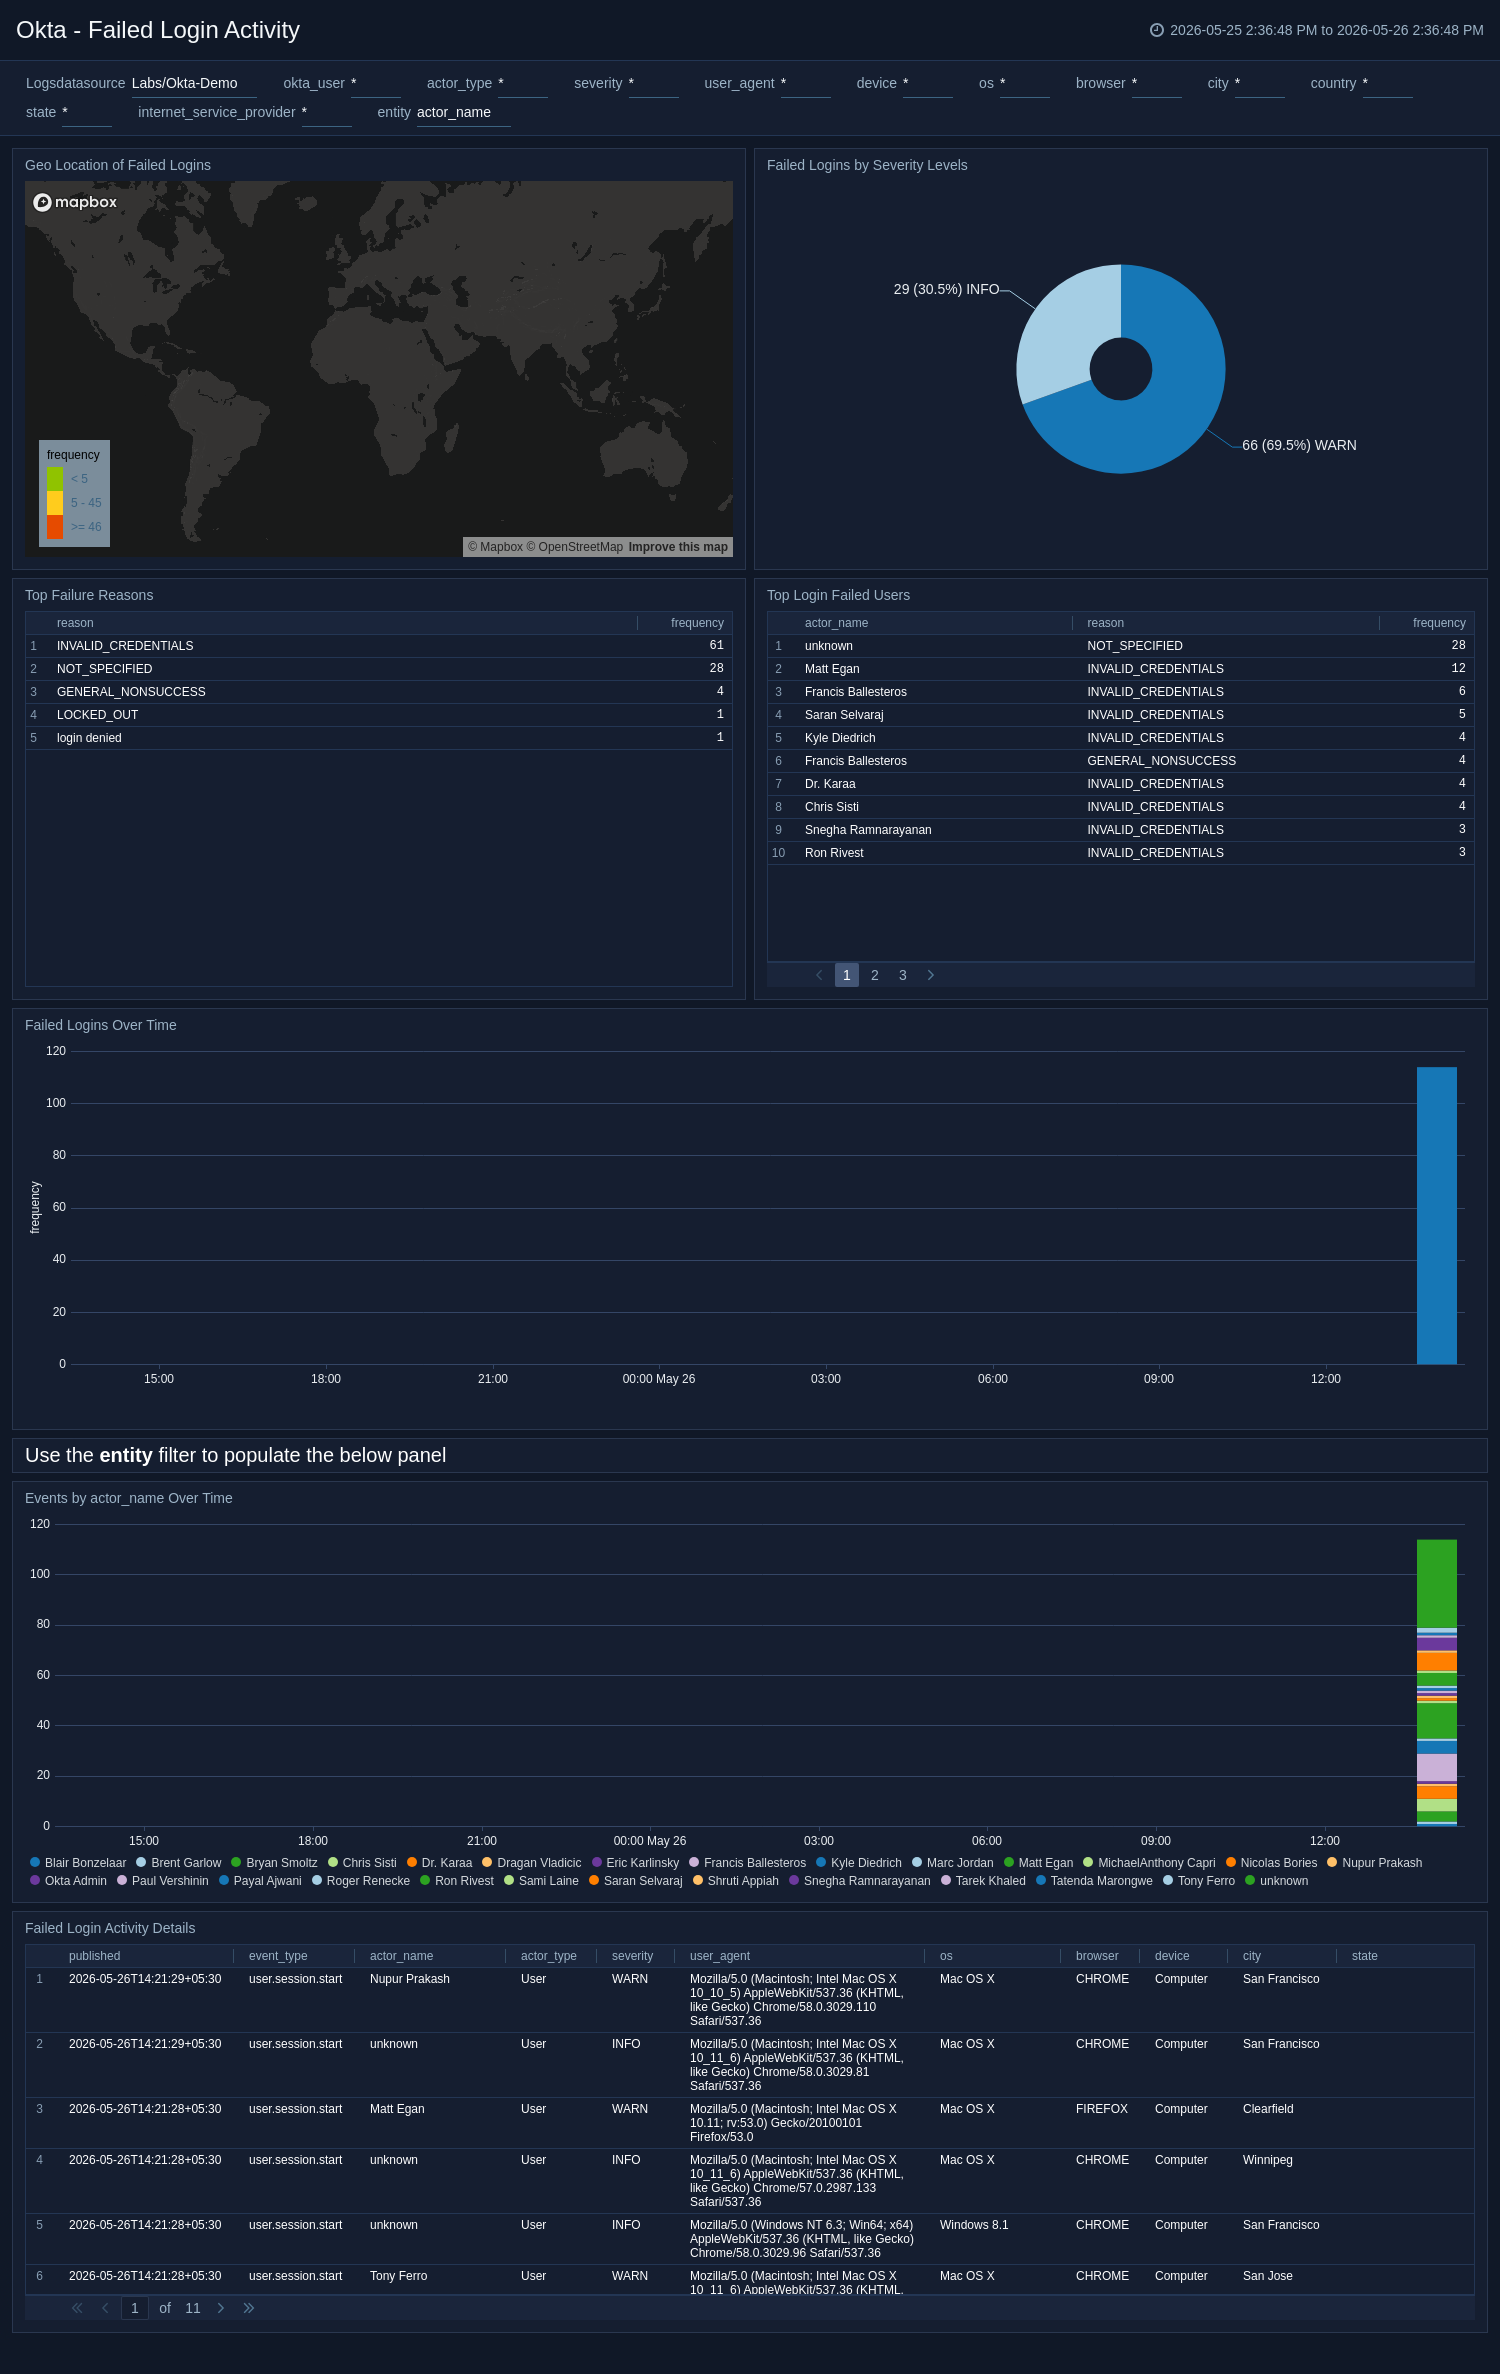
Failed Login Activity
The Okta - Failed Login Activity dashboard focuses on failed authentication events to help identify patterns of login issues or possible attack attempts. It showcases top failed users, failure reasons, and trends by severity and location. This dashboard aids in diagnosing access issues, monitoring brute‑force attempts, and improving authentication reliability.
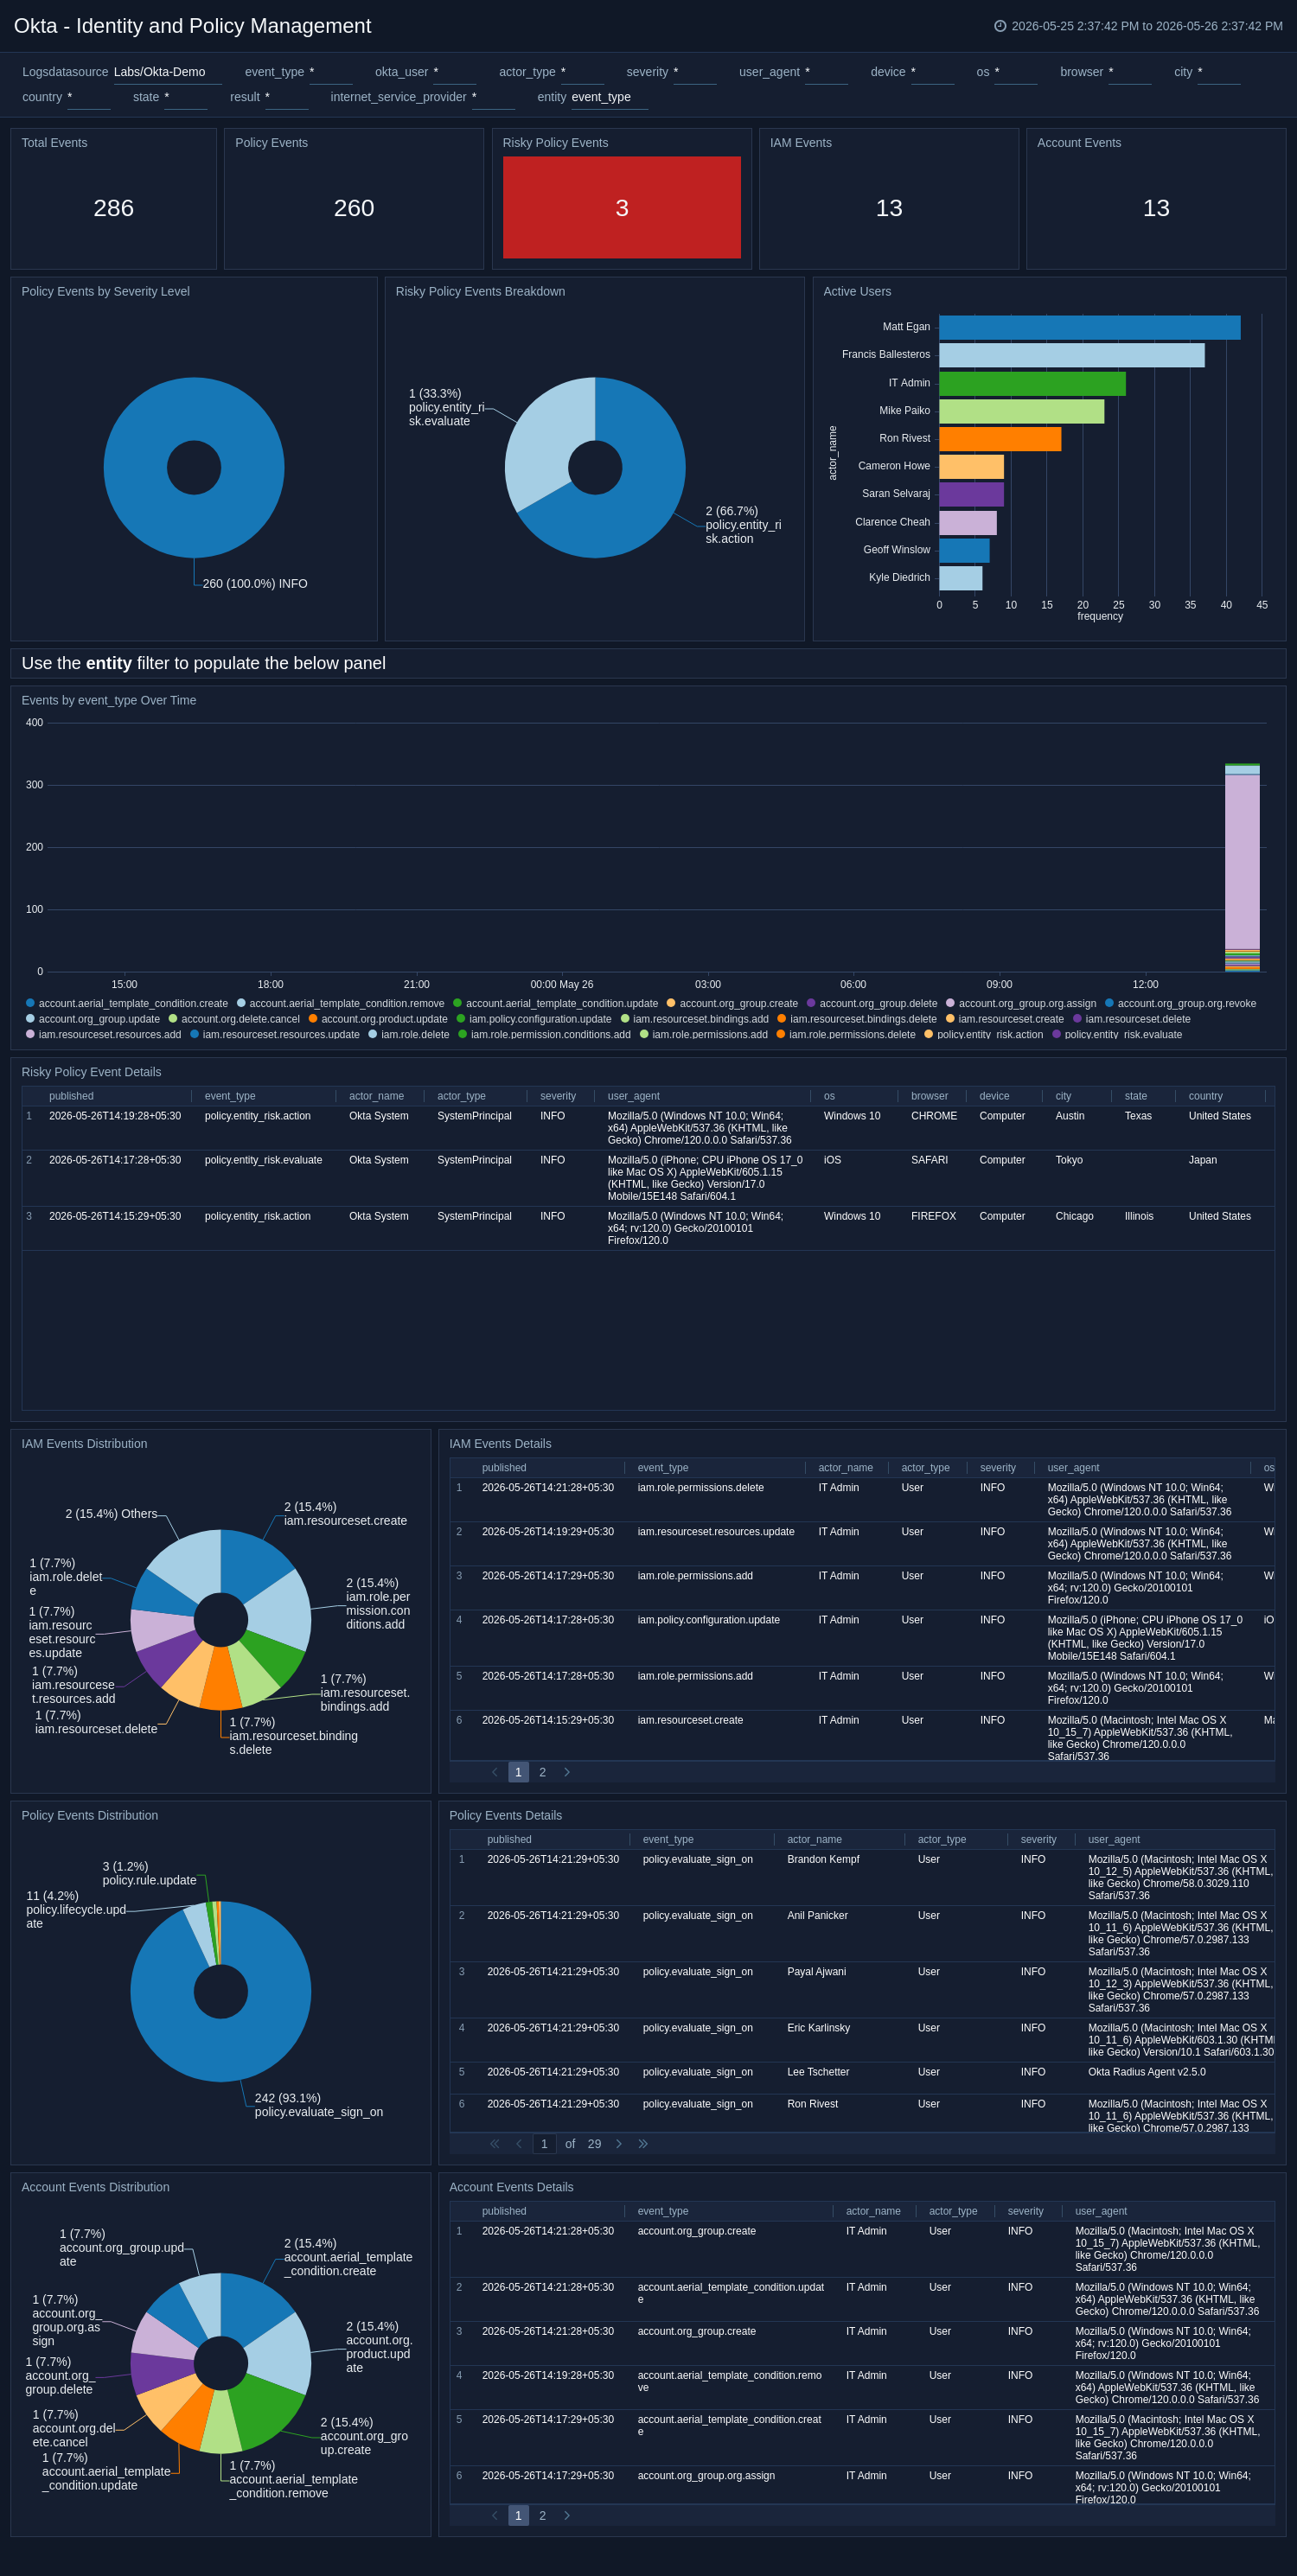
Identity and Policy Management
The Okta - Identity and Policy Management dashboard monitors identity governance and policy enforcement within the organization. It analyzes policy activity, access control changes, and account lifecycle events to identify misconfigurations or risky policy actions. Ideal for compliance and IAM administrators, it supports audits, reporting, and continuous assessment of access policy alignment.
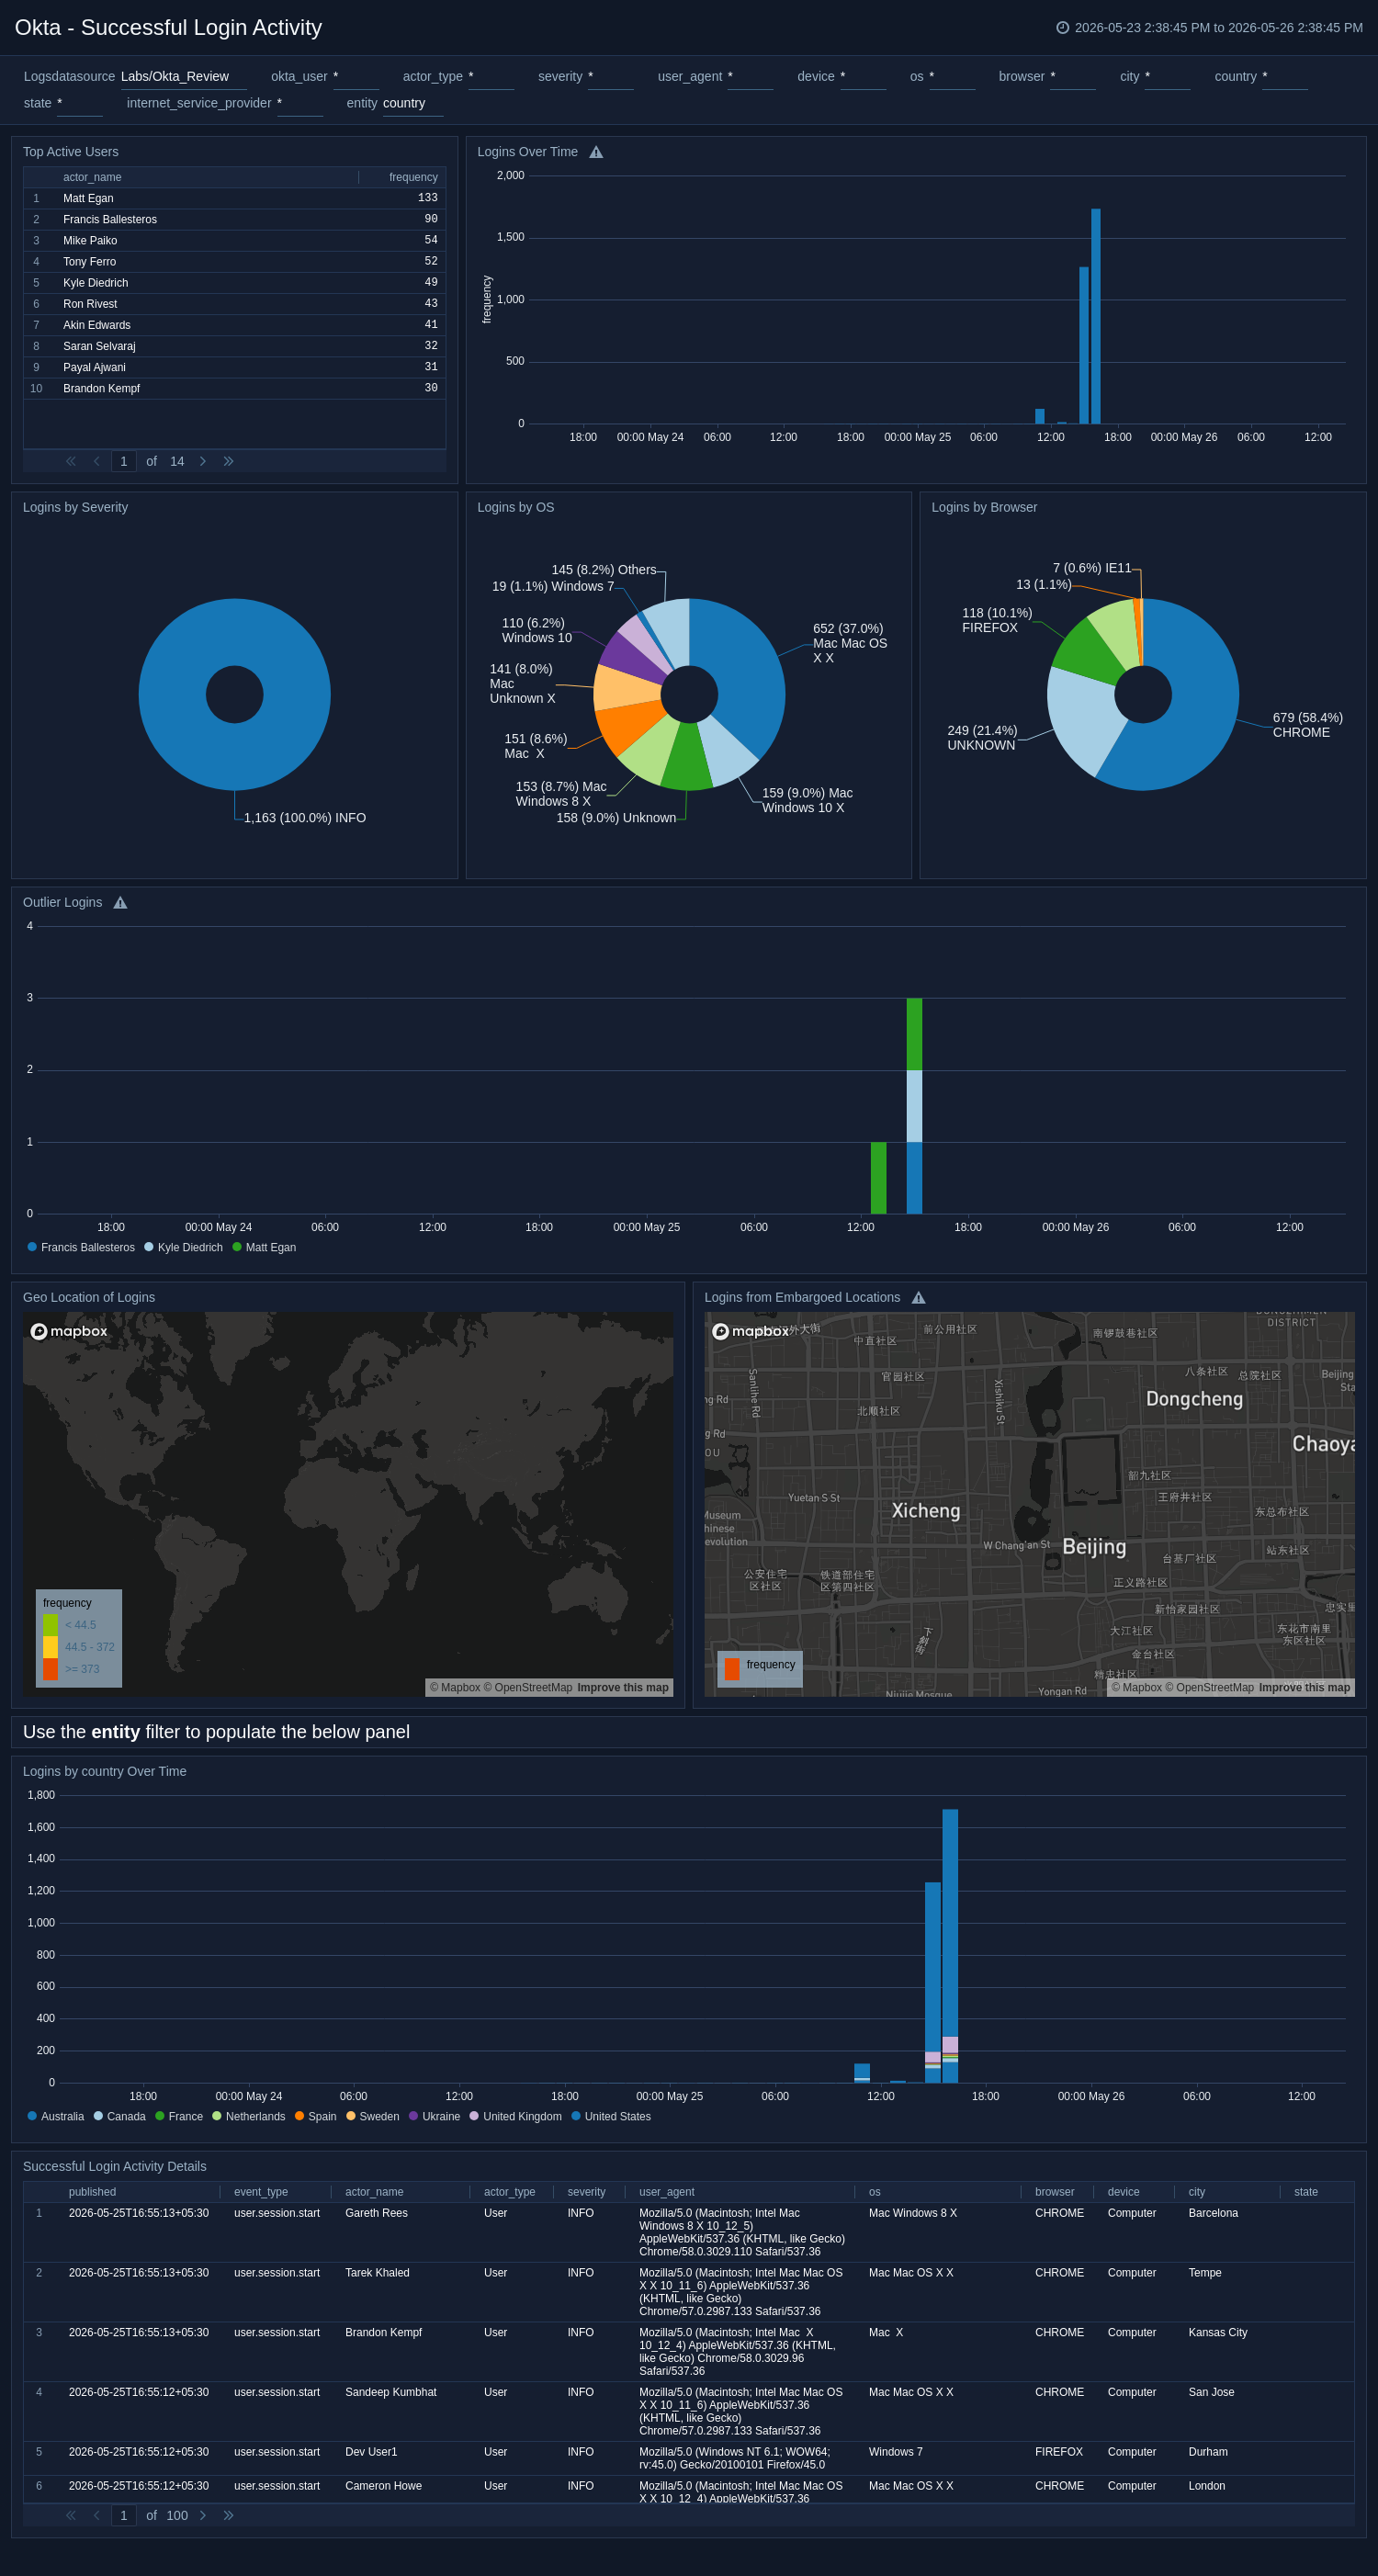
Successful Login Activity
The Okta - Successful Login Activity dashboard provides insights into legitimate user authentication behavior. It displays successful login trends across users, geographies, browsers, and devices while identifying outlier or embargoed geographic access. This helps teams understand normal authentication baselines and ensure authorized usage patterns.
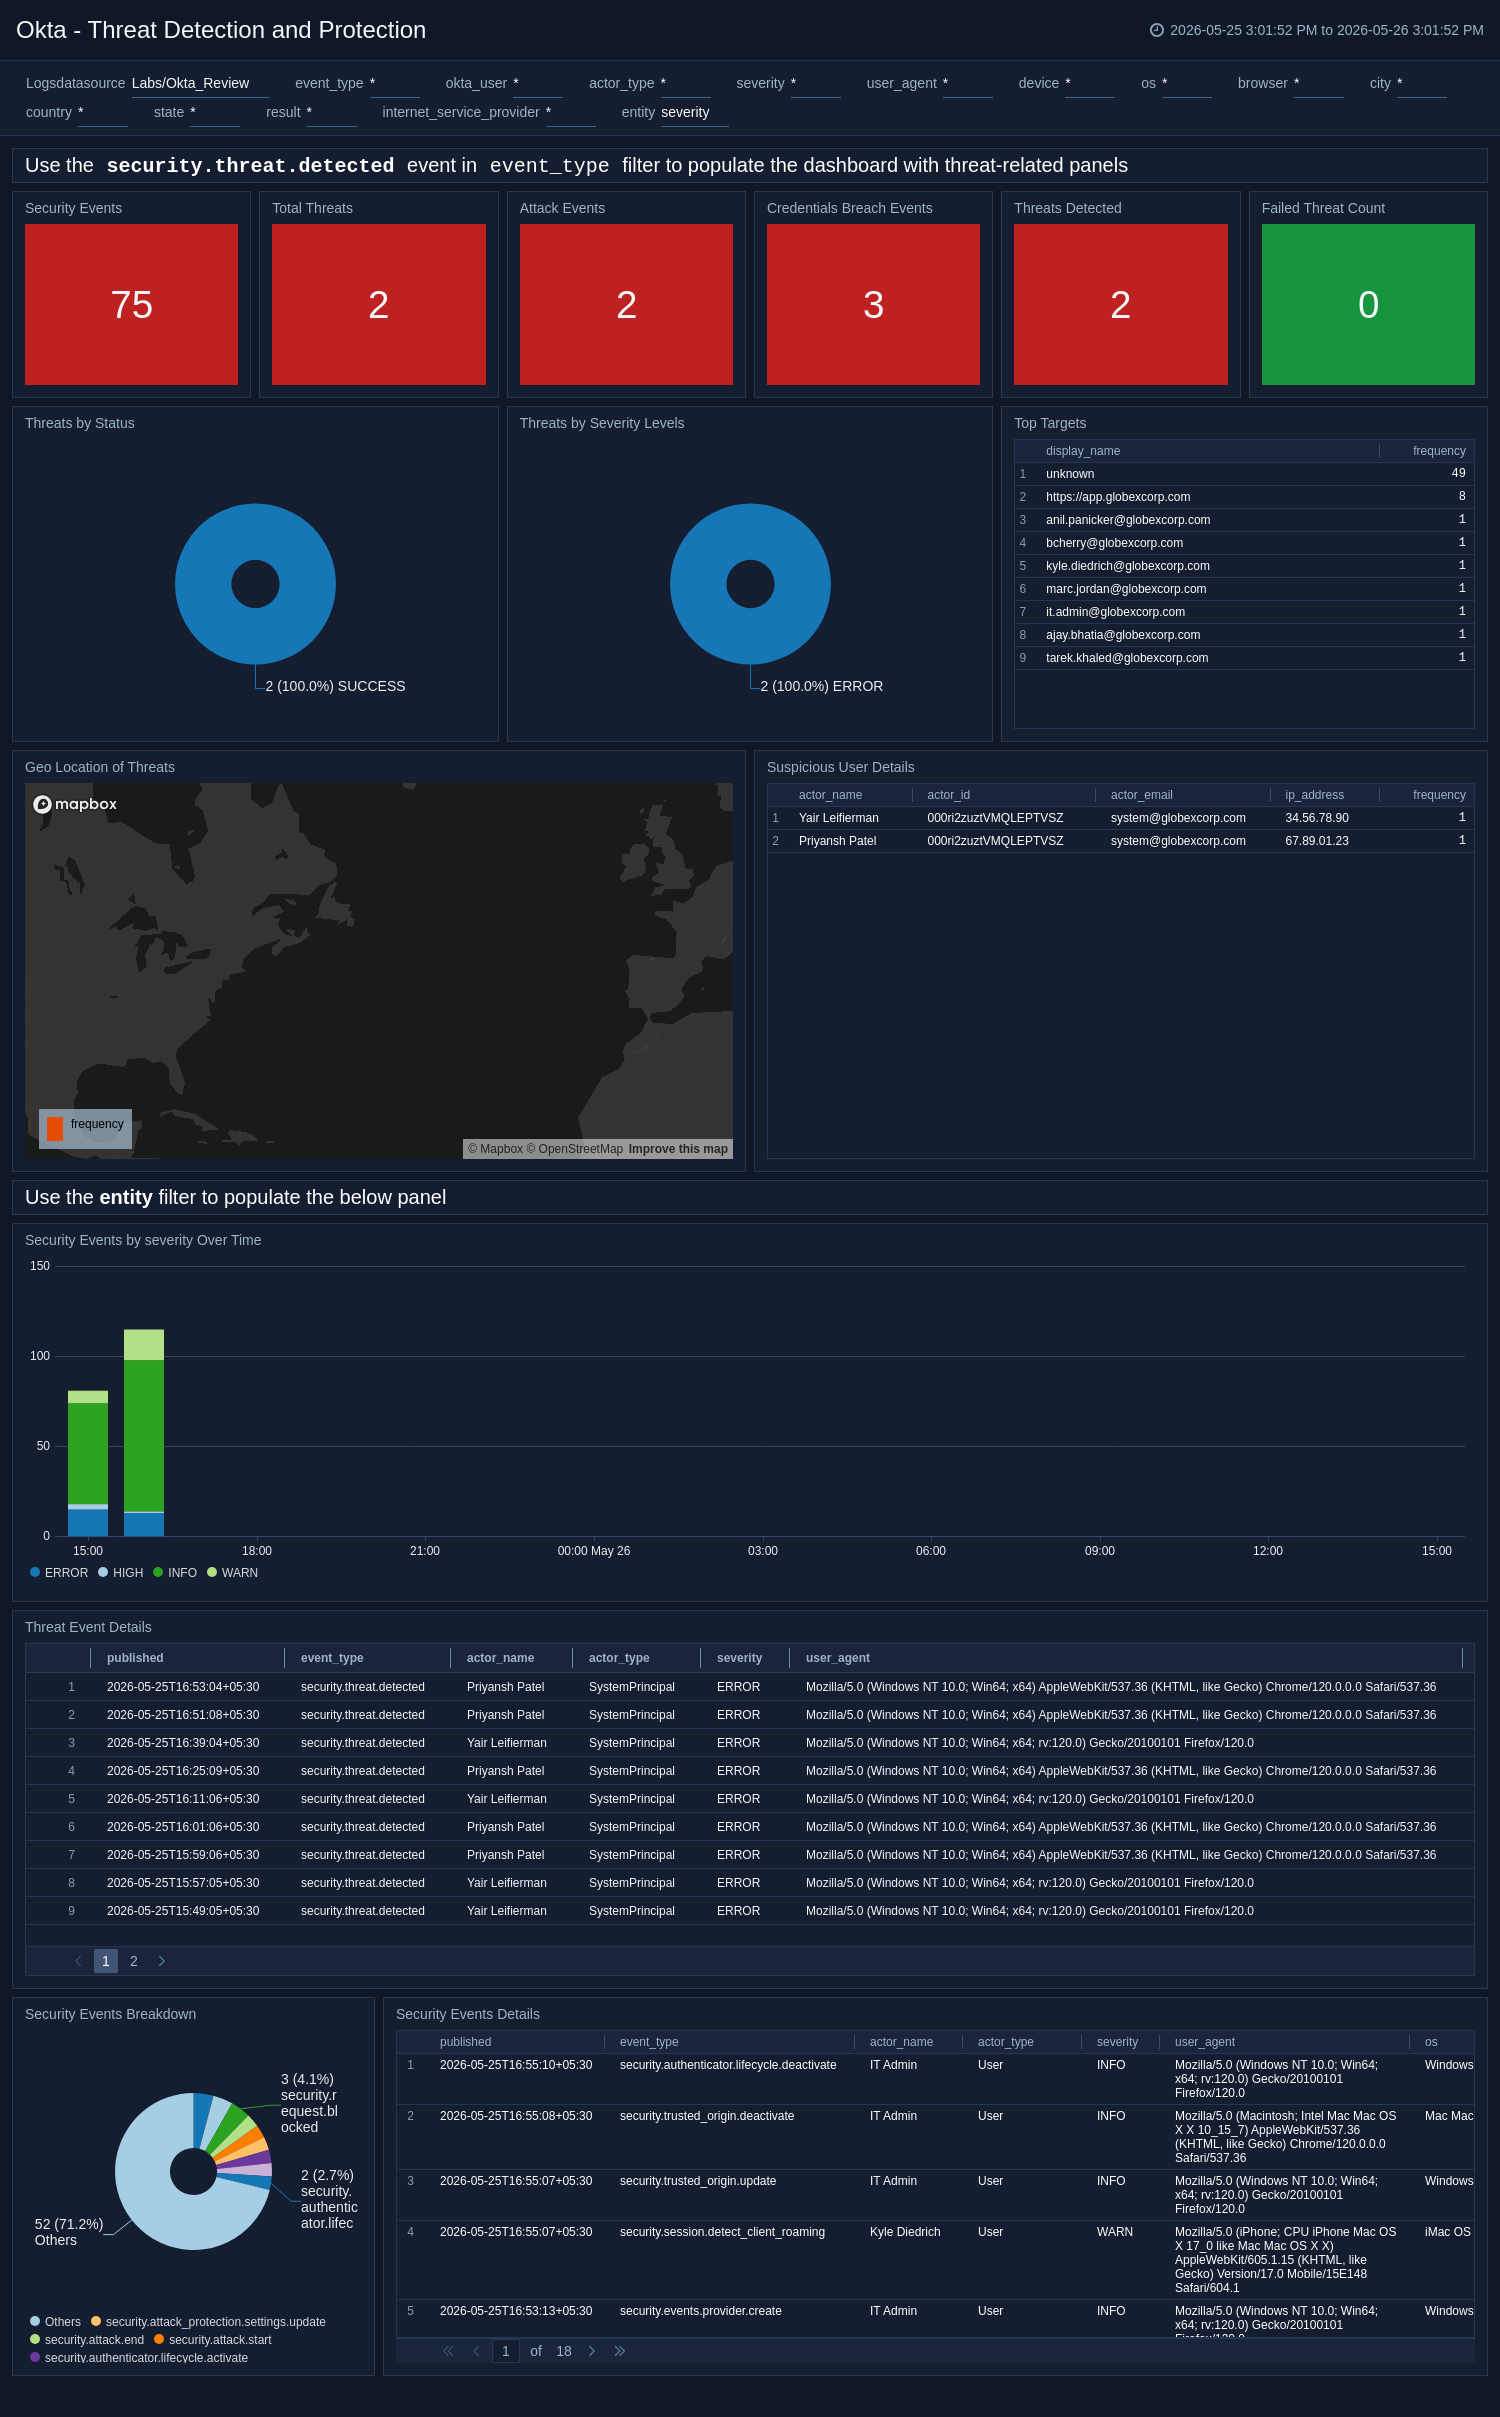
Threat Detection and Protection
The Okta - Threat Detection and Protection dashboard consolidates all threat‑related event data, providing visibility into detected security incidents, suspicious activities, and credential breaches. It classifies threats by type, severity, and target entity to support rapid identification and response. This view strengthens proactive threat detection and enables continuous protection monitoring across the Okta environment.
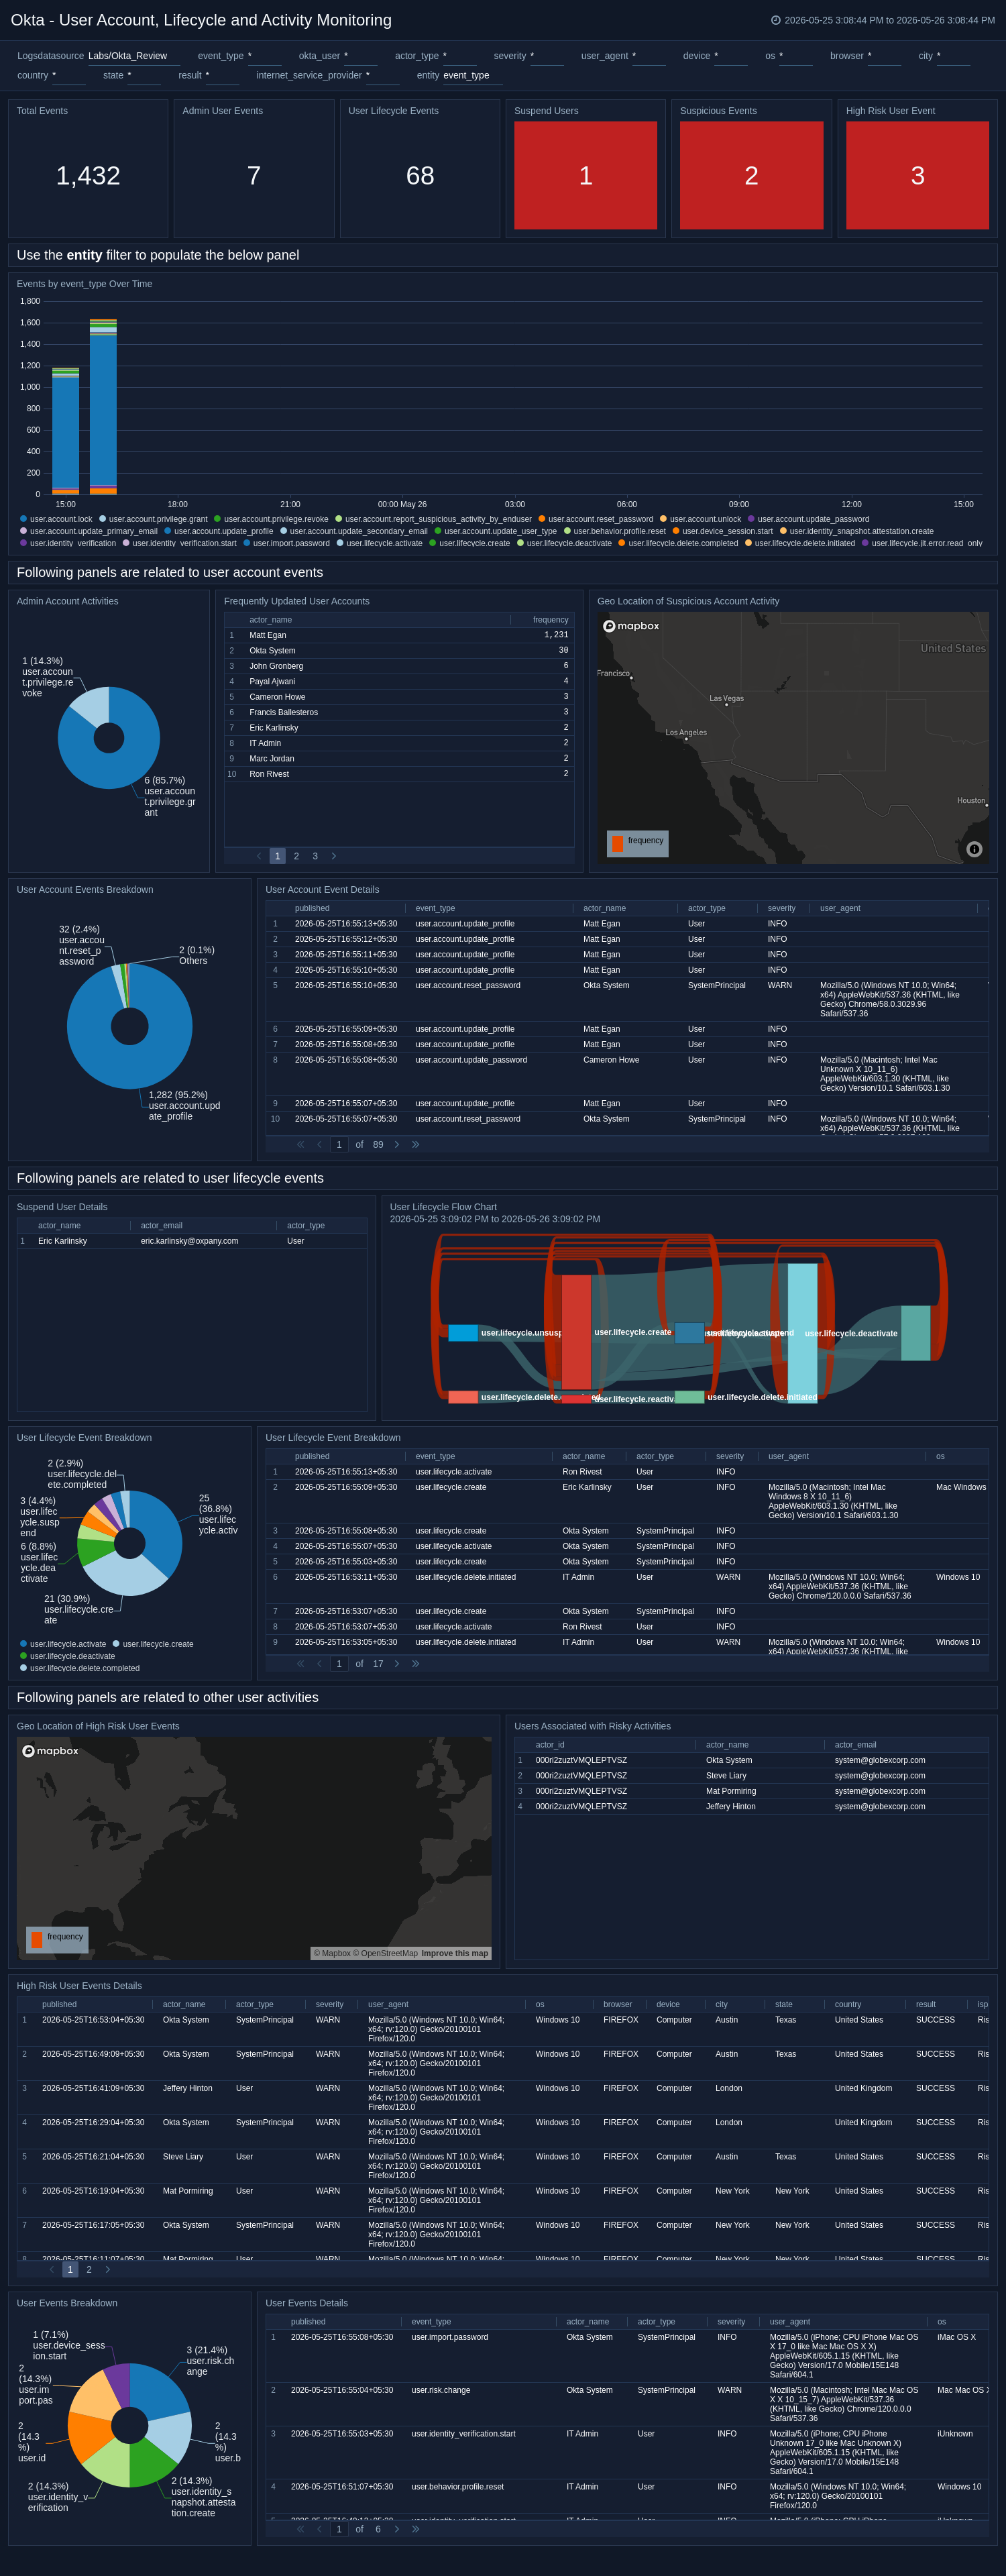
User Account, Lifecycle and Activity
The Okta - User Account, Lifecycle and Activity Monitoring dashboard tracks user lifecycle events, administrative actions, and risky account behaviors. It highlights suspended or reactivated accounts, frequent updates, and high‑risk users to aid in compliance and anomaly detection. This dashboard is instrumental in maintaining account hygiene, monitoring privileged accounts, and auditing user access changes.
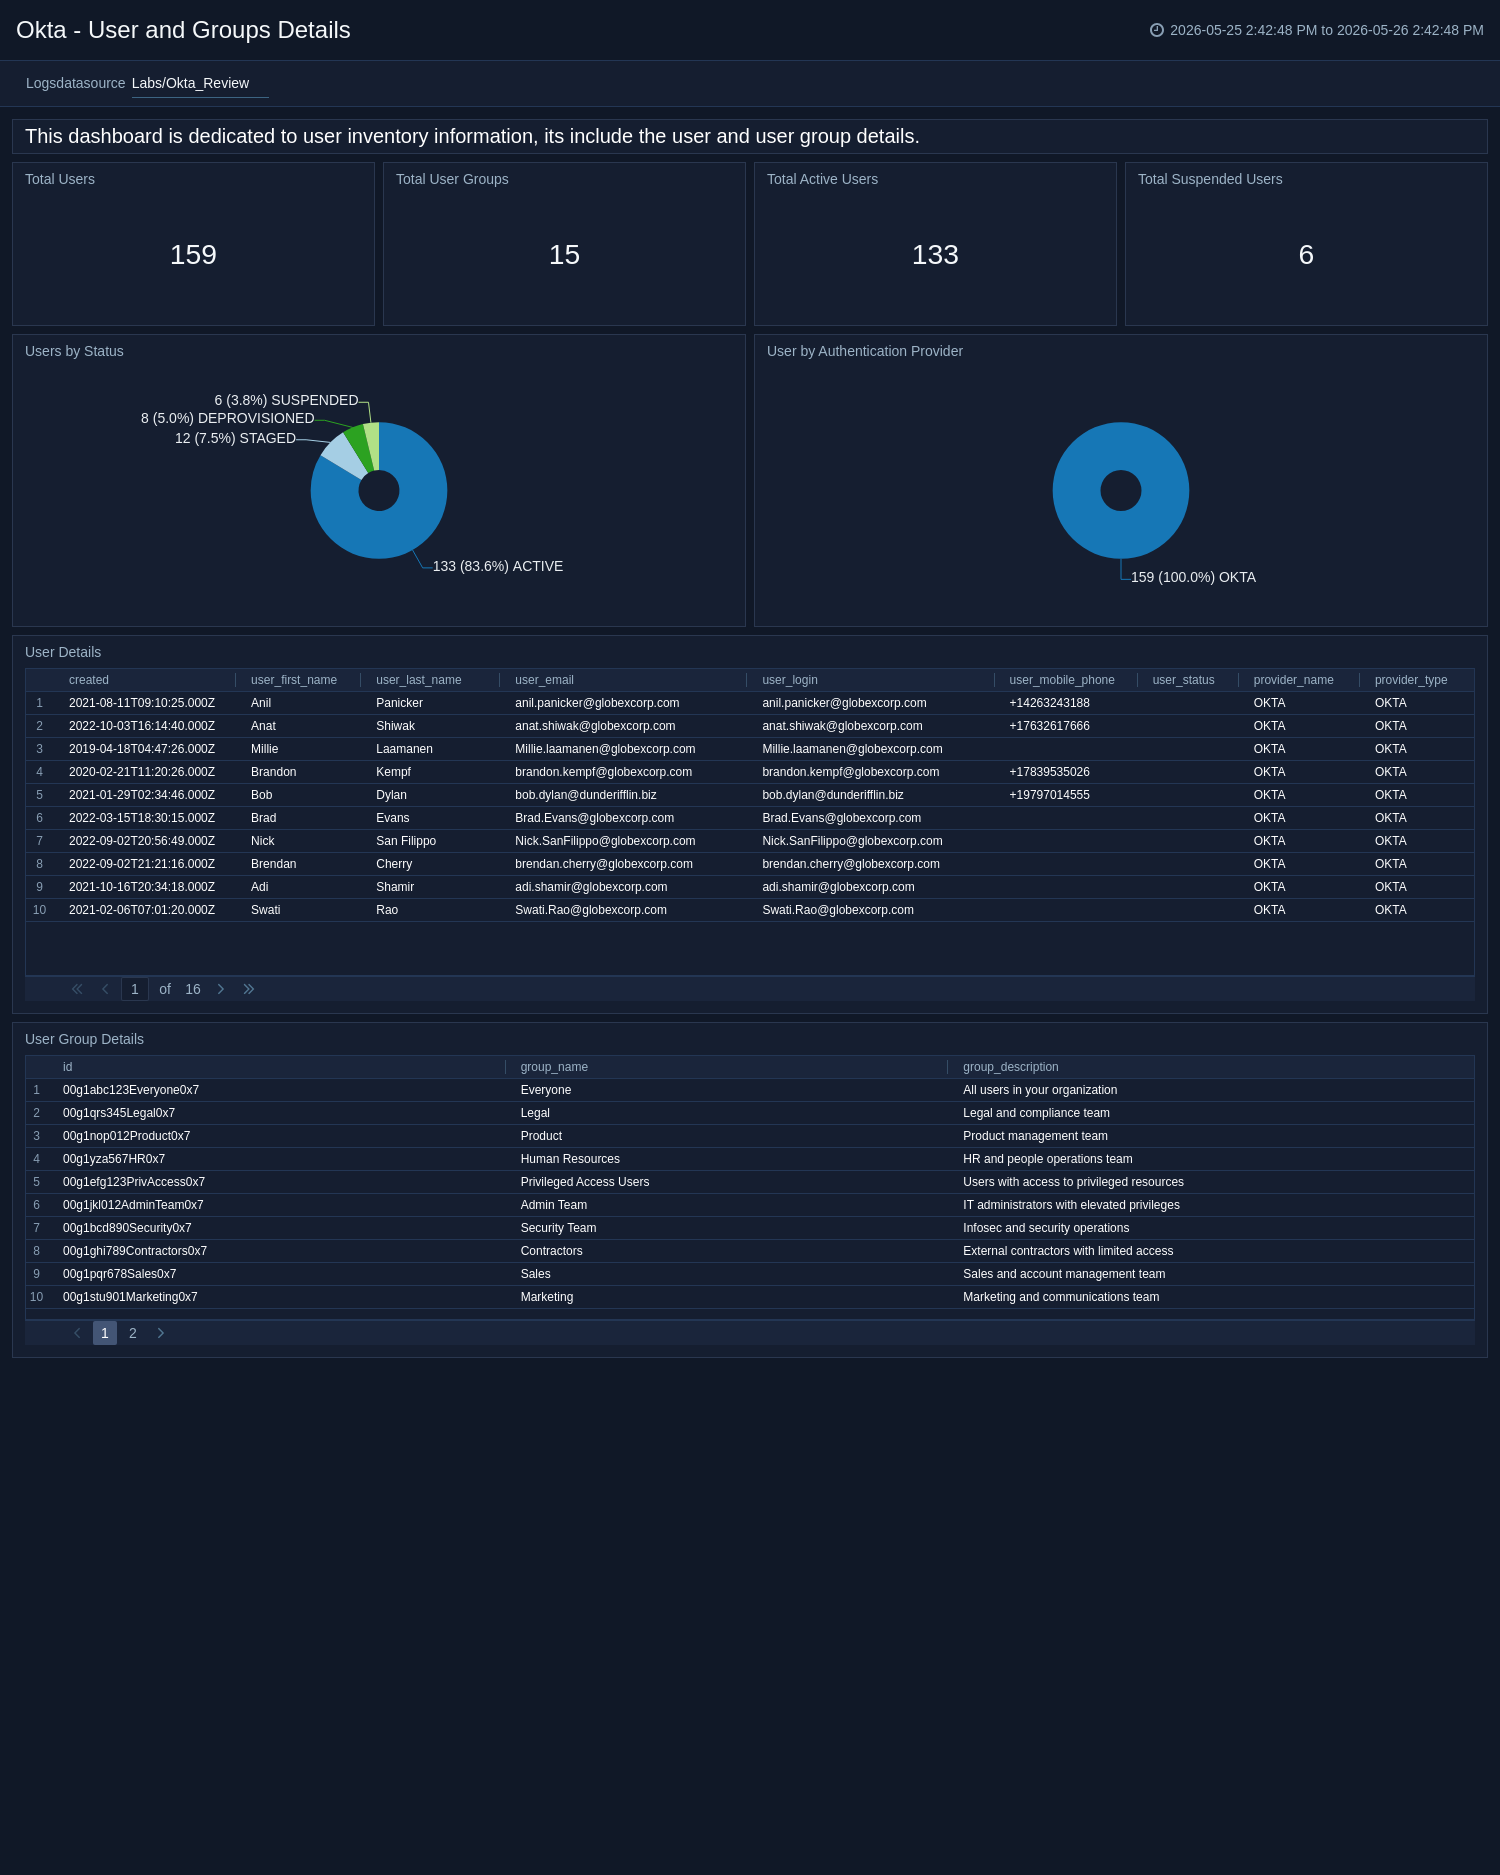
User and Groups Details
The Okta - User and Groups Details dashboard offers a comprehensive inventory view of users, groups, and authentication providers. It reports user counts by status, provider, and group membership, helping administrators maintain accurate identity records. This dashboard is useful for IAM operations, provisioning validation, and organizational reporting.
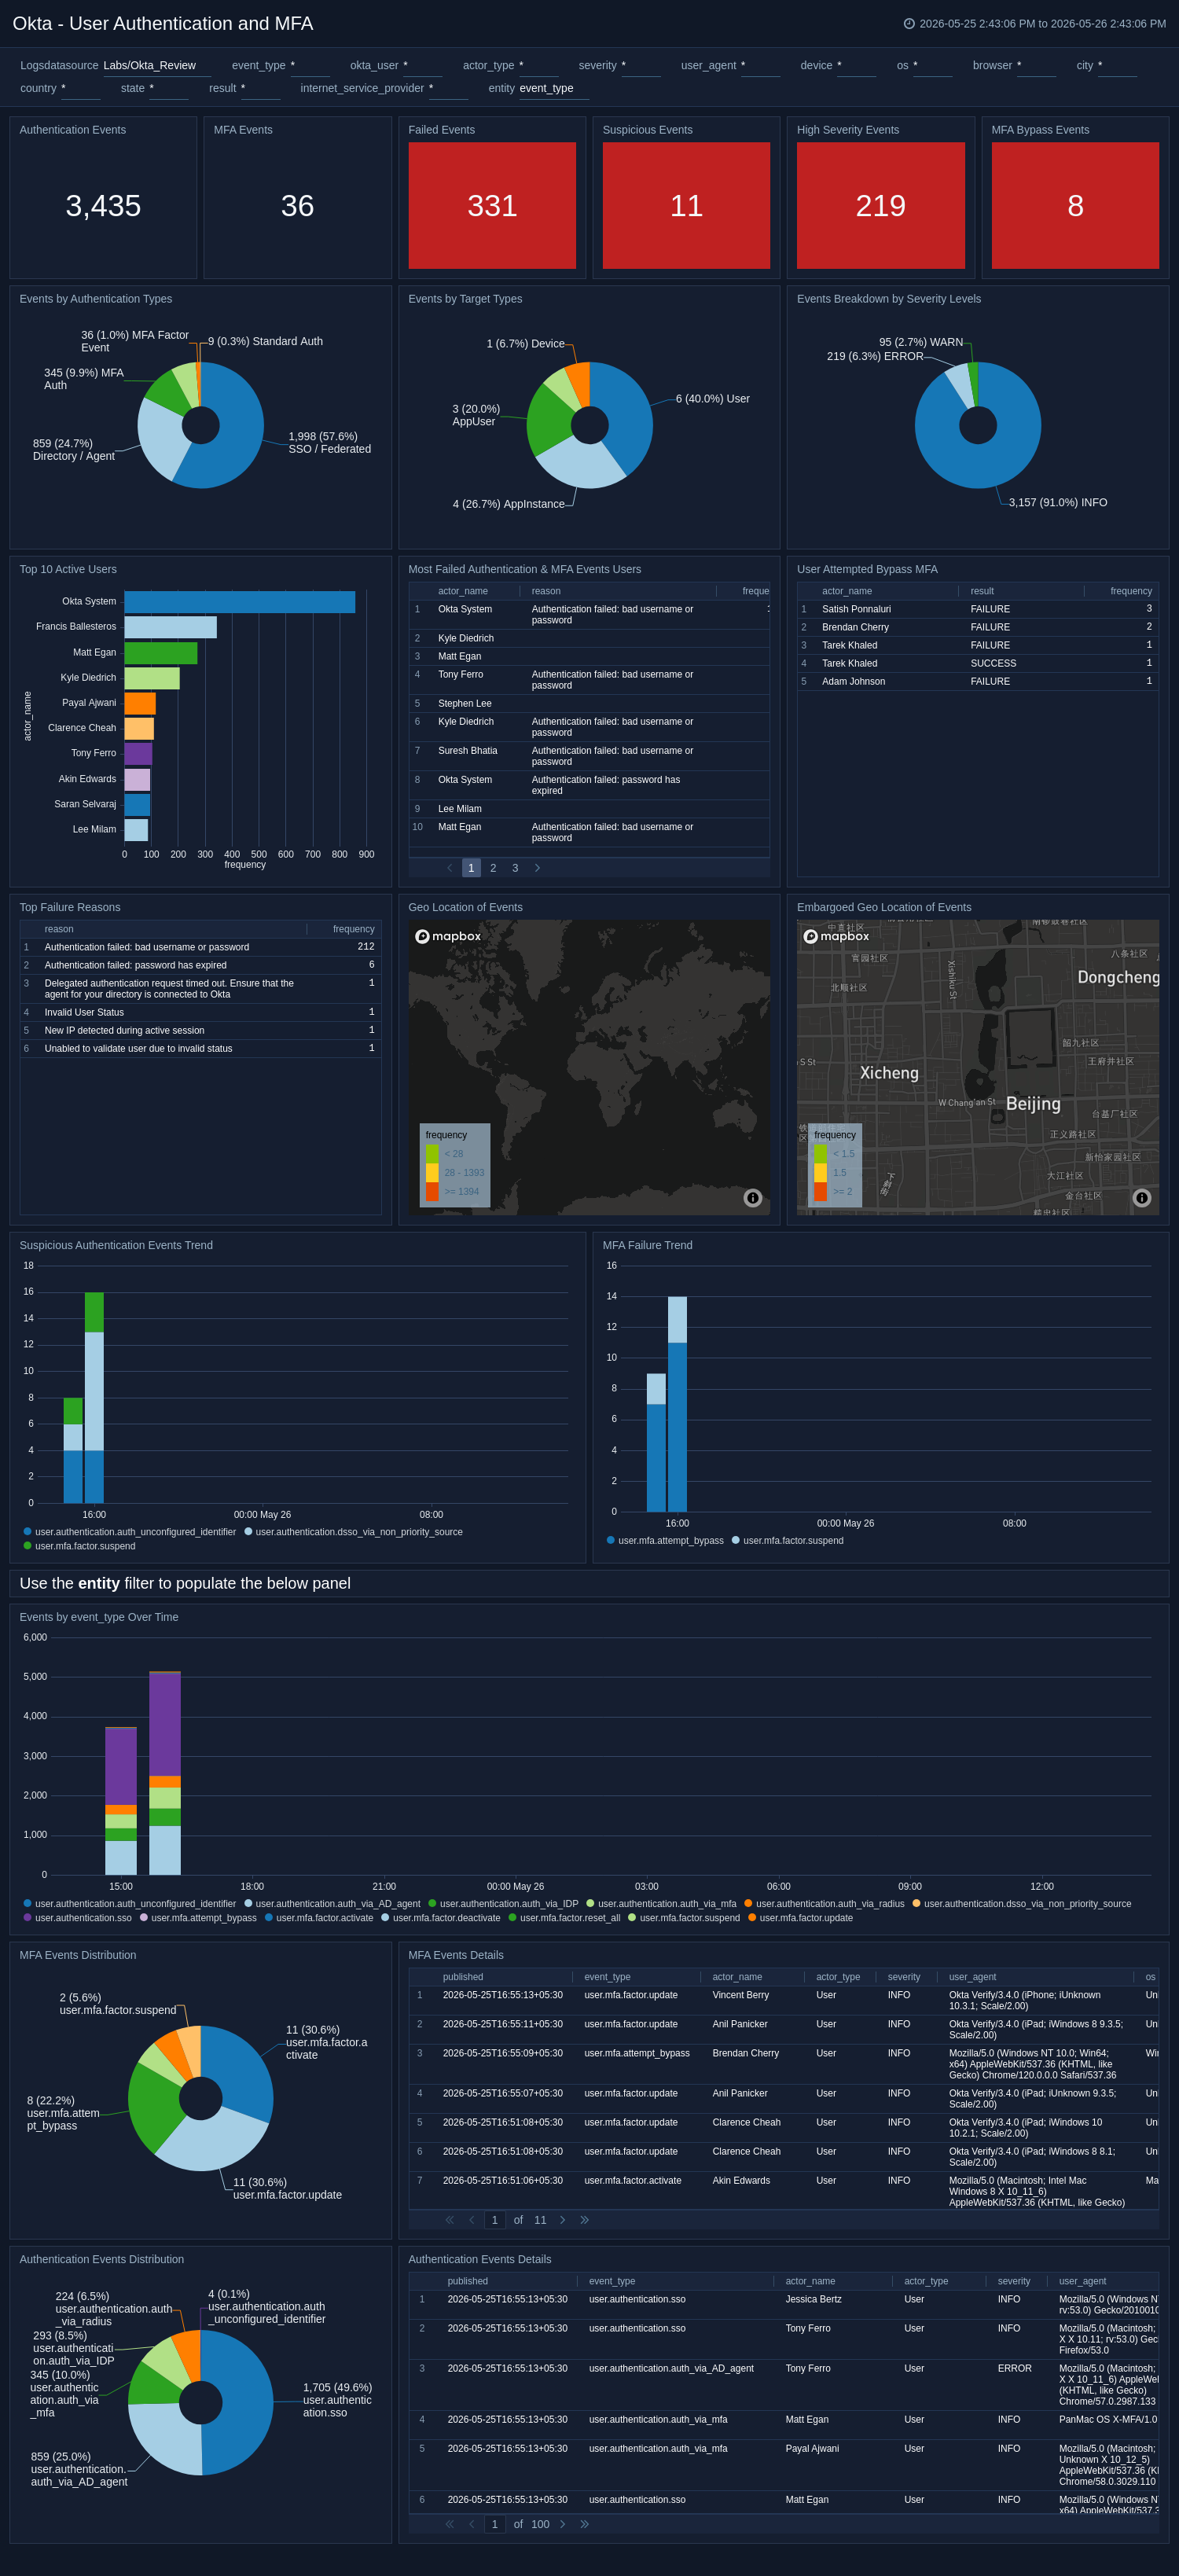
User Authentication and MFA
The Okta - User Authentication and MFA dashboard provides a detailed analysis of authentication and multi‑factor authentication events across your environment. It tracks success and failure patterns, MFA bypass attempts, and authentication trends by OS, geography, and target type. Security teams can use this to verify MFA enforcement effectiveness, identify suspicious access attempts, and optimize authentication policy configurations.
Create monitors for the Okta app
From your App Catalog:
- From the Sumo Logic navigation, select App Catalog.
- In the Search Apps field, search for and then select your app.
- Make sure the app is installed.
- Navigate to What's Included tab and scroll down to the Monitors section.
- Click Create next to the pre-configured monitors. In the create monitors window, adjust the trigger conditions and notifications settings based on your requirements.
- Scroll down to Monitor Details.
- Under Location click on New Folder.
note
By default, monitor will be saved in the root folder. So to make the maintenance easier, create a new folder in the location of your choice.
- Enter Folder Name. Folder Description is optional.
tip
Using app version in the folder name will be helpful to determine the versioning for future updates.
- Click Create. Once the folder is created, click on Save.
Okta alerts
| Name | Description | Trigger Type | Alert Condition |
|---|---|---|---|
Okta - Credential Breach Event Detected | Monitor triggers an alert whenever Okta reports that a user’s credentials have appeared in a known public data breach, indicating a potential account compromise. This monitor enables security teams to respond quickly by enforcing password resets, notifying affected users, and investigating any suspicious activity to prevent unauthorized access and protect organizational data. | Critical | Count > 0 |
Okta - Events from Embargoed Geo Locations | This monitor detects Okta events originating from countries or regions subject to government-imposed embargoes or organizational geo-access restrictions. The activity may span across user logins, application access, and administrative actions. Such events may indicate a compliance policy violation, compromised credentials, or the use of a VPN or proxy to bypass geographic access controls. | Critical | Count > 0 |
Okta - Malicious IP Request Detected by ThreatInsight | This monitor detects Okta ThreatInsight events signaling inbound requests from malicious IPs involved in brute‑force or password‑spray activity, helping identify and block credential‑based attacks. | Critical | Count > 0 |
Okta - Multiple Failed Logins From User | This monitor detects multiple failed login attempts from a single user within a short period, helping identify potential brute‑force attacks, account lockouts, or use of compromised credentials. | Critical | Count > 5 |
Okta - Repeated Authentication Failures Detected | This monitor detects a surge in authentication failures occurring across multiple user accounts within a defined time window. The activity may indicate a coordinated credential stuffing campaign, automated attack tooling, or a widespread access disruption affecting the organization. Such patterns warrant immediate investigation to assess the scope and origin of the failures. | Critical | Count > 5 |
Okta - Risky Event Detected | Monitor triggers when potentially suspicious or high‑risk activity is identified within the Okta environment based on contextual risk signals and security indicators. It enables security teams to promptly investigate unusual behaviors such as anomalous login attempts, elevated risk levels, or other threat-related events to reduce the likelihood of account compromise and unauthorized access. | Critical | Count > 0 |
Okta - Suspicious Activity Self-Reported by End User | This monitor detects user.account.report_suspicious_activity_by_enduser events triggered when an end user explicitly reports suspicious activity on their own Okta account. Such reports may indicate an account takeover attempt, unauthorized session access, or credential phishing targeting the user. Security teams should treat each report as a high-priority signal and initiate immediate account investigation and containment steps. | Critical | Count > 0 |
Okta - ThreatInsight Attack Detected | This monitor triggers when Okta logs a security.attack.start event, indicating that ThreatInsight has detected that the organization is under attack. When this event occurs, ThreatInsight automatically increases its logging and blocking sensitivity for suspicious requests, helping security teams identify and mitigate active threats in real time. | Critical | Count > 0 |
Okta - User Risk Level Elevation Detected | This monitor detects user.risk.detect events triggered when Okta's risk engine identifies that a user is exhibiting behavior or operating within a context associated with elevated risk. The risk signal may be based on anomalous activity patterns, suspicious contextual signals, or known threat indicators. Security teams should investigate flagged accounts and consider enforcing step-up authentication, session termination, or temporary account suspension as appropriate. | Critical | Count > 0 |
Upgrade/Downgrade the Okta app (Optional)
To update the app, do the following:
Next-Gen App: To install or update the app, you must be an account administrator or a user with Manage Apps, Manage Monitors, Manage Fields, Manage Metric Rules, and Manage Collectors capabilities depending upon the different content types part of the app.
- Select App Catalog.
- In the Search Apps field, search for and then select your app.
Optionally, you can identify apps that can be upgraded in the Upgrade available section. - To upgrade the app, select Upgrade from the Manage dropdown.
- If the upgrade does not have any configuration or property changes, you will be redirected to the Preview & Done section.
- If the upgrade has any configuration or property changes, you will be redirected to the Setup Data page.
- In the Configure section of your respective app, complete the following fields.
- Field Name. If you already have collectors and sources set up, select the configured metadata field name (eg _sourcecategory) or specify other custom metadata (eg: _collector) along with its metadata Field Value.
- Click Next. You will be redirected to the Preview & Done section.
Post-update
Your upgraded app will be installed in the Installed Apps folder and dashboard panels will start to fill automatically.
See our Release Notes changelog for new updates in the app.
To revert the app to a previous version, do the following:
- Select App Catalog.
- In the Search Apps field, search for and then select your app.
- To version down the app, select Revert to < previous version of your app > from the Manage dropdown.
Uninstalling the Okta app (Optional)
To uninstall the app, do the following:
- Select App Catalog.
- In the 🔎 Search Apps field, run a search for your desired app, then select it.
- Click Uninstall.