 Meet the new
 Druva - Platform Events
Druva is a cloud data protection and management platform that helps organizations safeguard their data across endpoints, cloud applications, and data center workloads. You can use a webhook in Druva to forward platform events to the Sumo Logic HTTP endpoint. Using these logs, you can monitor cybersecurity threats, backup and restore operations, authentication and admin activities, ransomware recovery, data access, enterprise workloads, and API credential usage in Sumo Logic.
For more details, see the Druva Webhook documentation.
Event types
The Sumo Logic app for Druva Platform Events ingests security and operational events into Sumo Logic through a webhook integration in the Druva Integration Center.
The following event types are used in the Druva Platform Events app:
- Admin and platform access events
- API credential lifecycle events
- Backup and restore events
- Enterprise workload events
- Cybersecurity events (unusual data activity, malicious file scans, curated snapshots)
- Ransomware recovery events
- Data access events
- Alert and notification events
Sample log messages
{
  "feature": "Admin Event",
  "type": "Admin Login",
  "details": {
    "adminEmail": "admin@example.com",
    "adminName": "Jane Doe",
    "adminIPAddress": "198.51.100.10",
    "location": "San Francisco, US",
    "loginResult": "Success",
    "ssoProvider": "Okta",
    "authMethod": "SSO"
  },
  "syslogSeverity": "6",
  "timestamp": "2026-05-28T14:32:10Z"
}
{
  "feature": "Backup And Restore",
  "type": "Backup",
  "details": {
    "backupStatus": "Failed",
    "userEmail": "user@example.com",
    "deviceName": "LAPTOP-1024",
    "errorMessage": "Agent connectivity timeout"
  },
  "syslogSeverity": "4",
  "timestamp": "2026-05-28T15:10:45Z"
}
Sample queries
="Labs/Druva" feature type
| json "feature", "type", "syslogSeverity" as feature, event_type, severity nodrop
| count by feature
| sort by _count
Setup
This section includes instructions for collecting logs for the Sumo Logic Druva Platform Events webhook collection.
Source configuration
Follow the steps below to configure the Hosted Collector to receive Druva events.
- In the Sumo Logic portal, create a new Hosted Collector or use an existing one.
- Add an HTTP Logs and Metrics Source.
- Configure Source Category in the HTTP Source, for example,
webhook/druva. - Copy and save the endpoint URL of the source.
Vendor configuration
Configure the webhook integration in Druva to send events to the Sumo Logic HTTP source.
Follow the steps below to configure the Druva webhook.
- Sign in to the Druva Console.
- From the Global Navigation menu on the top left, select Integration Center.
- On the Integration Center page, select Webhooks from the left panel.
- Click Add New Webhook. The Add Webhook form appears.
- Provide the following details:
- Provider. Select Others.
- Name. Enter a name for the webhook (for example,
Sumo Logic). - Endpoint. Enter the Sumo Logic HTTP endpoint URL (source address) created above.
- Authorization Type. Select API Key and enter a dummy value with more than 5 characters (for example,
sumologic), as Sumo Logic does not require authentication on the HTTP source endpoint. - Events. Select the events that the platform should send to the webhook. Choose the event types you want to monitor, such as cybersecurity events, backup jobs, admin events, and alerts.
- Click Test and Save to validate the connection and save your configuration.
- Verify Druva events are getting ingested in Sumo Logic by executing the following query in Log Search:
_sourceCategory=Labs/Druva
For detailed webhook setup information, refer to the Druva Webhook documentation.
Installing the Druva - Platform Events app
To install the app, do the following:
Next-Gen App: To install or update the app, you must be an account administrator or a user with Manage Apps, Manage Monitors, Manage Fields, Manage Metric Rules, and Manage Collectors capabilities depending upon the different content types part of the app.
- Select App Catalog.
- In the 🔎 Search Apps field, run a search for your desired app, then select it.
- Click Install App.
note
Sometimes this button says Add Integration.
- Click Next in the Setup Data section.
- In the Configure section of your respective app, complete the following fields.
- Field Name. If you already have collectors and sources set up, select the configured metadata field name (eg _sourcecategory) or specify other custom metadata (eg: _collector) along with its metadata Field Value.
- Click Next. You will be redirected to the Preview & Done section.
Post-installation
Once your app is installed, it will appear in your Installed Apps folder, and dashboard panels will start to fill automatically.
Each panel slowly fills with data matching the time range query received since the panel was created. Results will not immediately be available but will be updated with full graphs and charts over time.
Viewing Druva - Platform Events dashboards
All dashboards have a set of filters that you can apply to the entire dashboard. Use these filters to drill down and examine the data to a granular level.
- You can change the time range for a dashboard or panel by selecting a predefined interval from a drop-down list, choosing a recently used time range, or specifying custom dates and times. Learn more.
- You can use template variables to drill down and examine the data on a granular level. For more information, see Filtering Dashboards with Template Variables.
- Most Next-Gen apps allow you to provide the scope at the installation time and are comprised of a key (
_sourceCategoryby default) and a default value for this key. Based on your input, the app dashboards will be parameterized with a dashboard variable, allowing you to change the dataset queried by all panels. This eliminates the need to create multiple copies of the same dashboard with different queries.
Overview
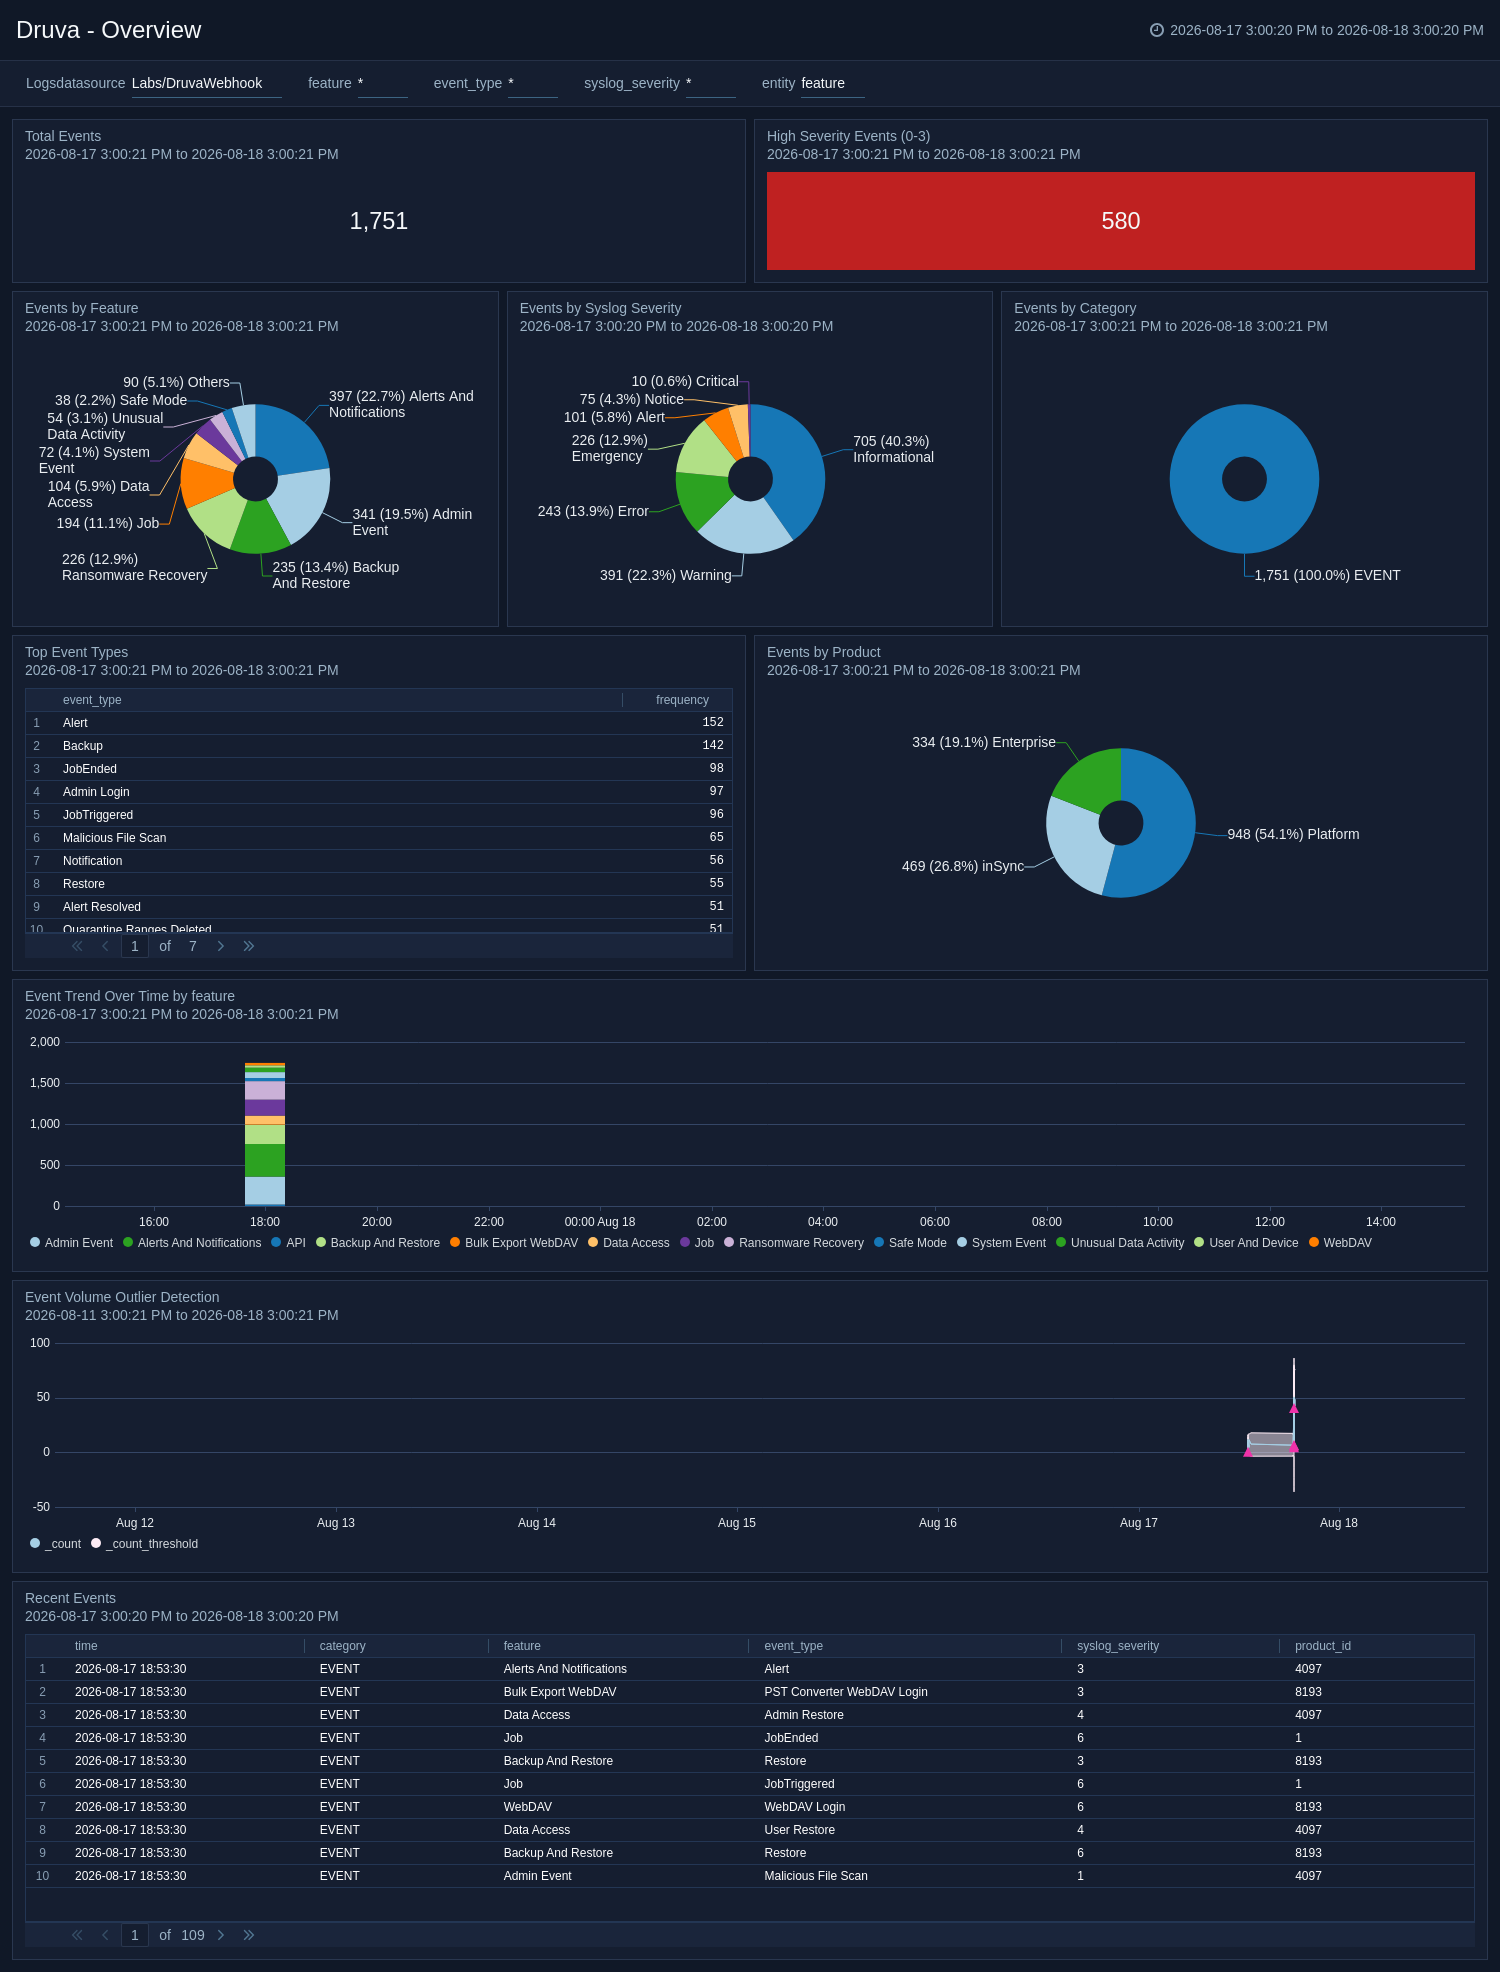
The Druva - Platform Events - Overview dashboard provides a high-level summary of all Druva platform events, including total event counts, event distribution by feature, severity, and category, outlier detection, and a full reverse-chronological All Events table.
Platform Access
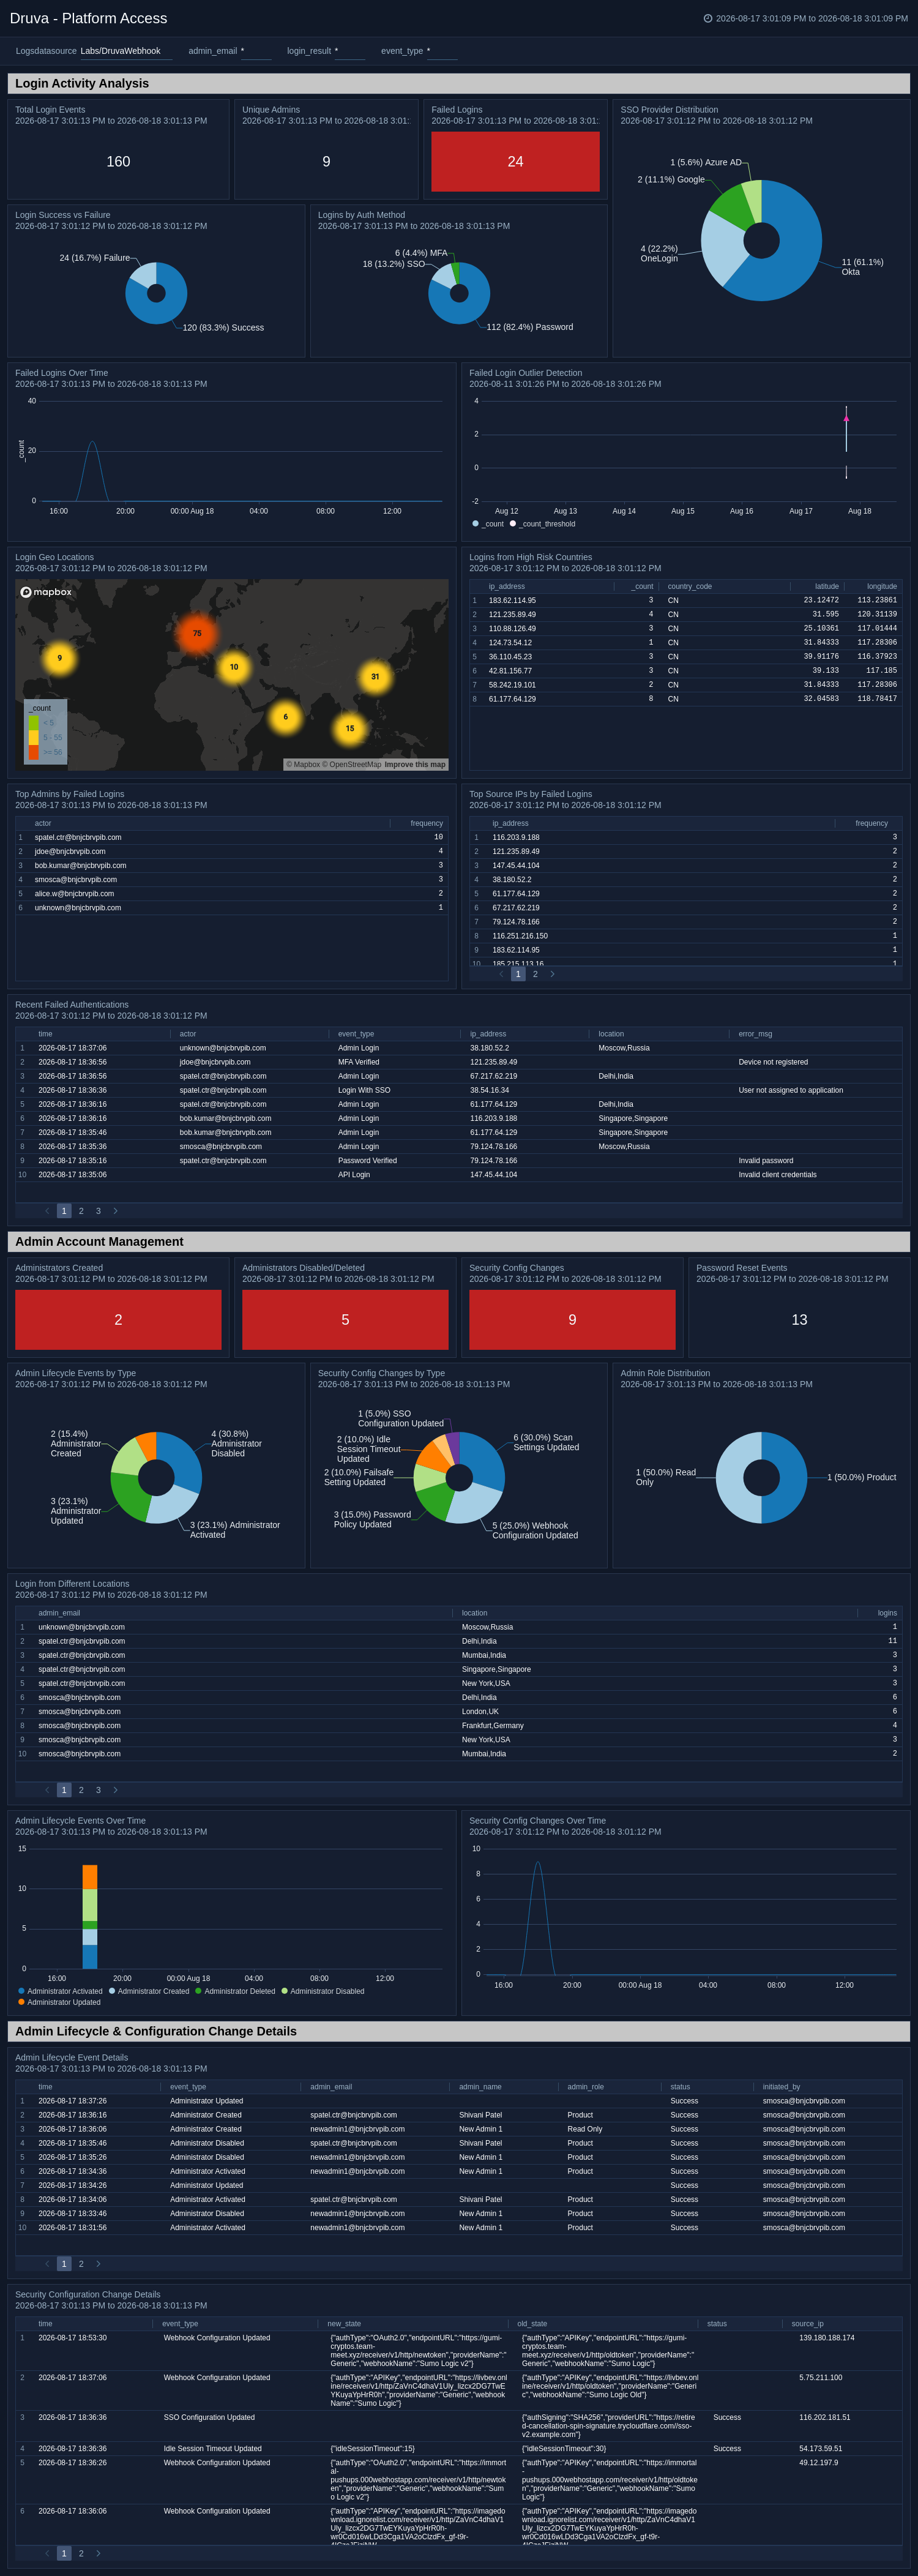
The Druva - Platform Events - Platform Access dashboard tracks admin login activities, authentication methods, SSO providers, geo-locations, login from different locations, failed login detection, admin lifecycle events, and security configuration changes.
API Credentials and Access
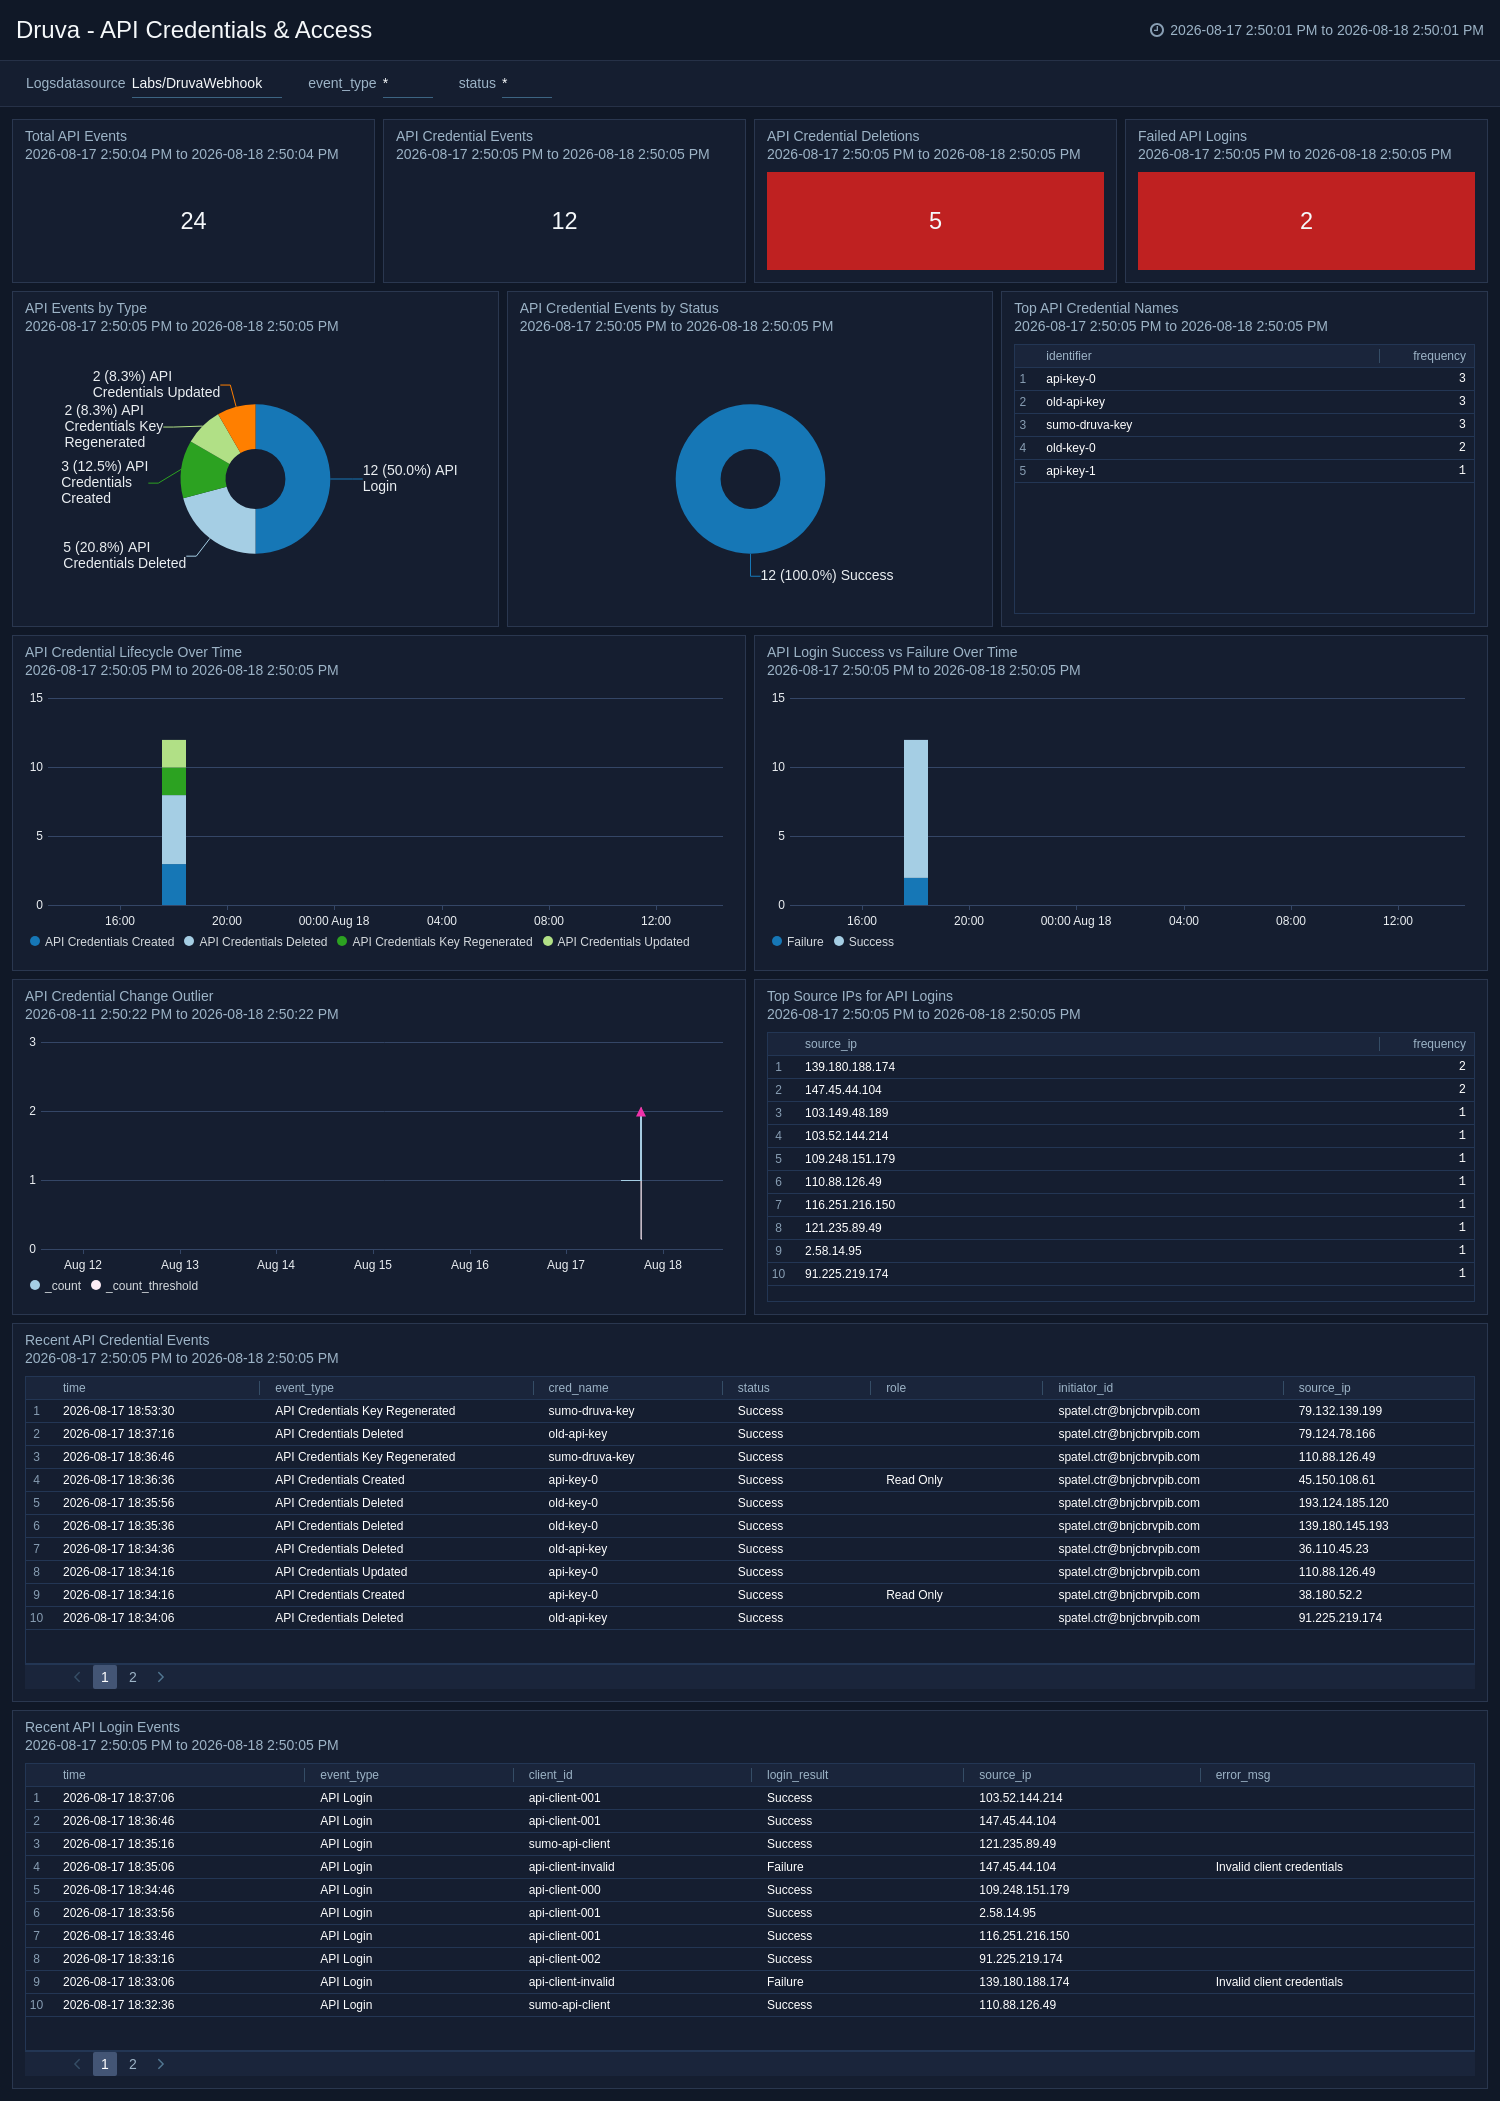
The Druva - Platform Events - API Credentials & Access dashboard monitors API credential lifecycle (create, update, delete, key regeneration), API login success and failures, top source IPs, and credential change outlier detection.
Data Protection
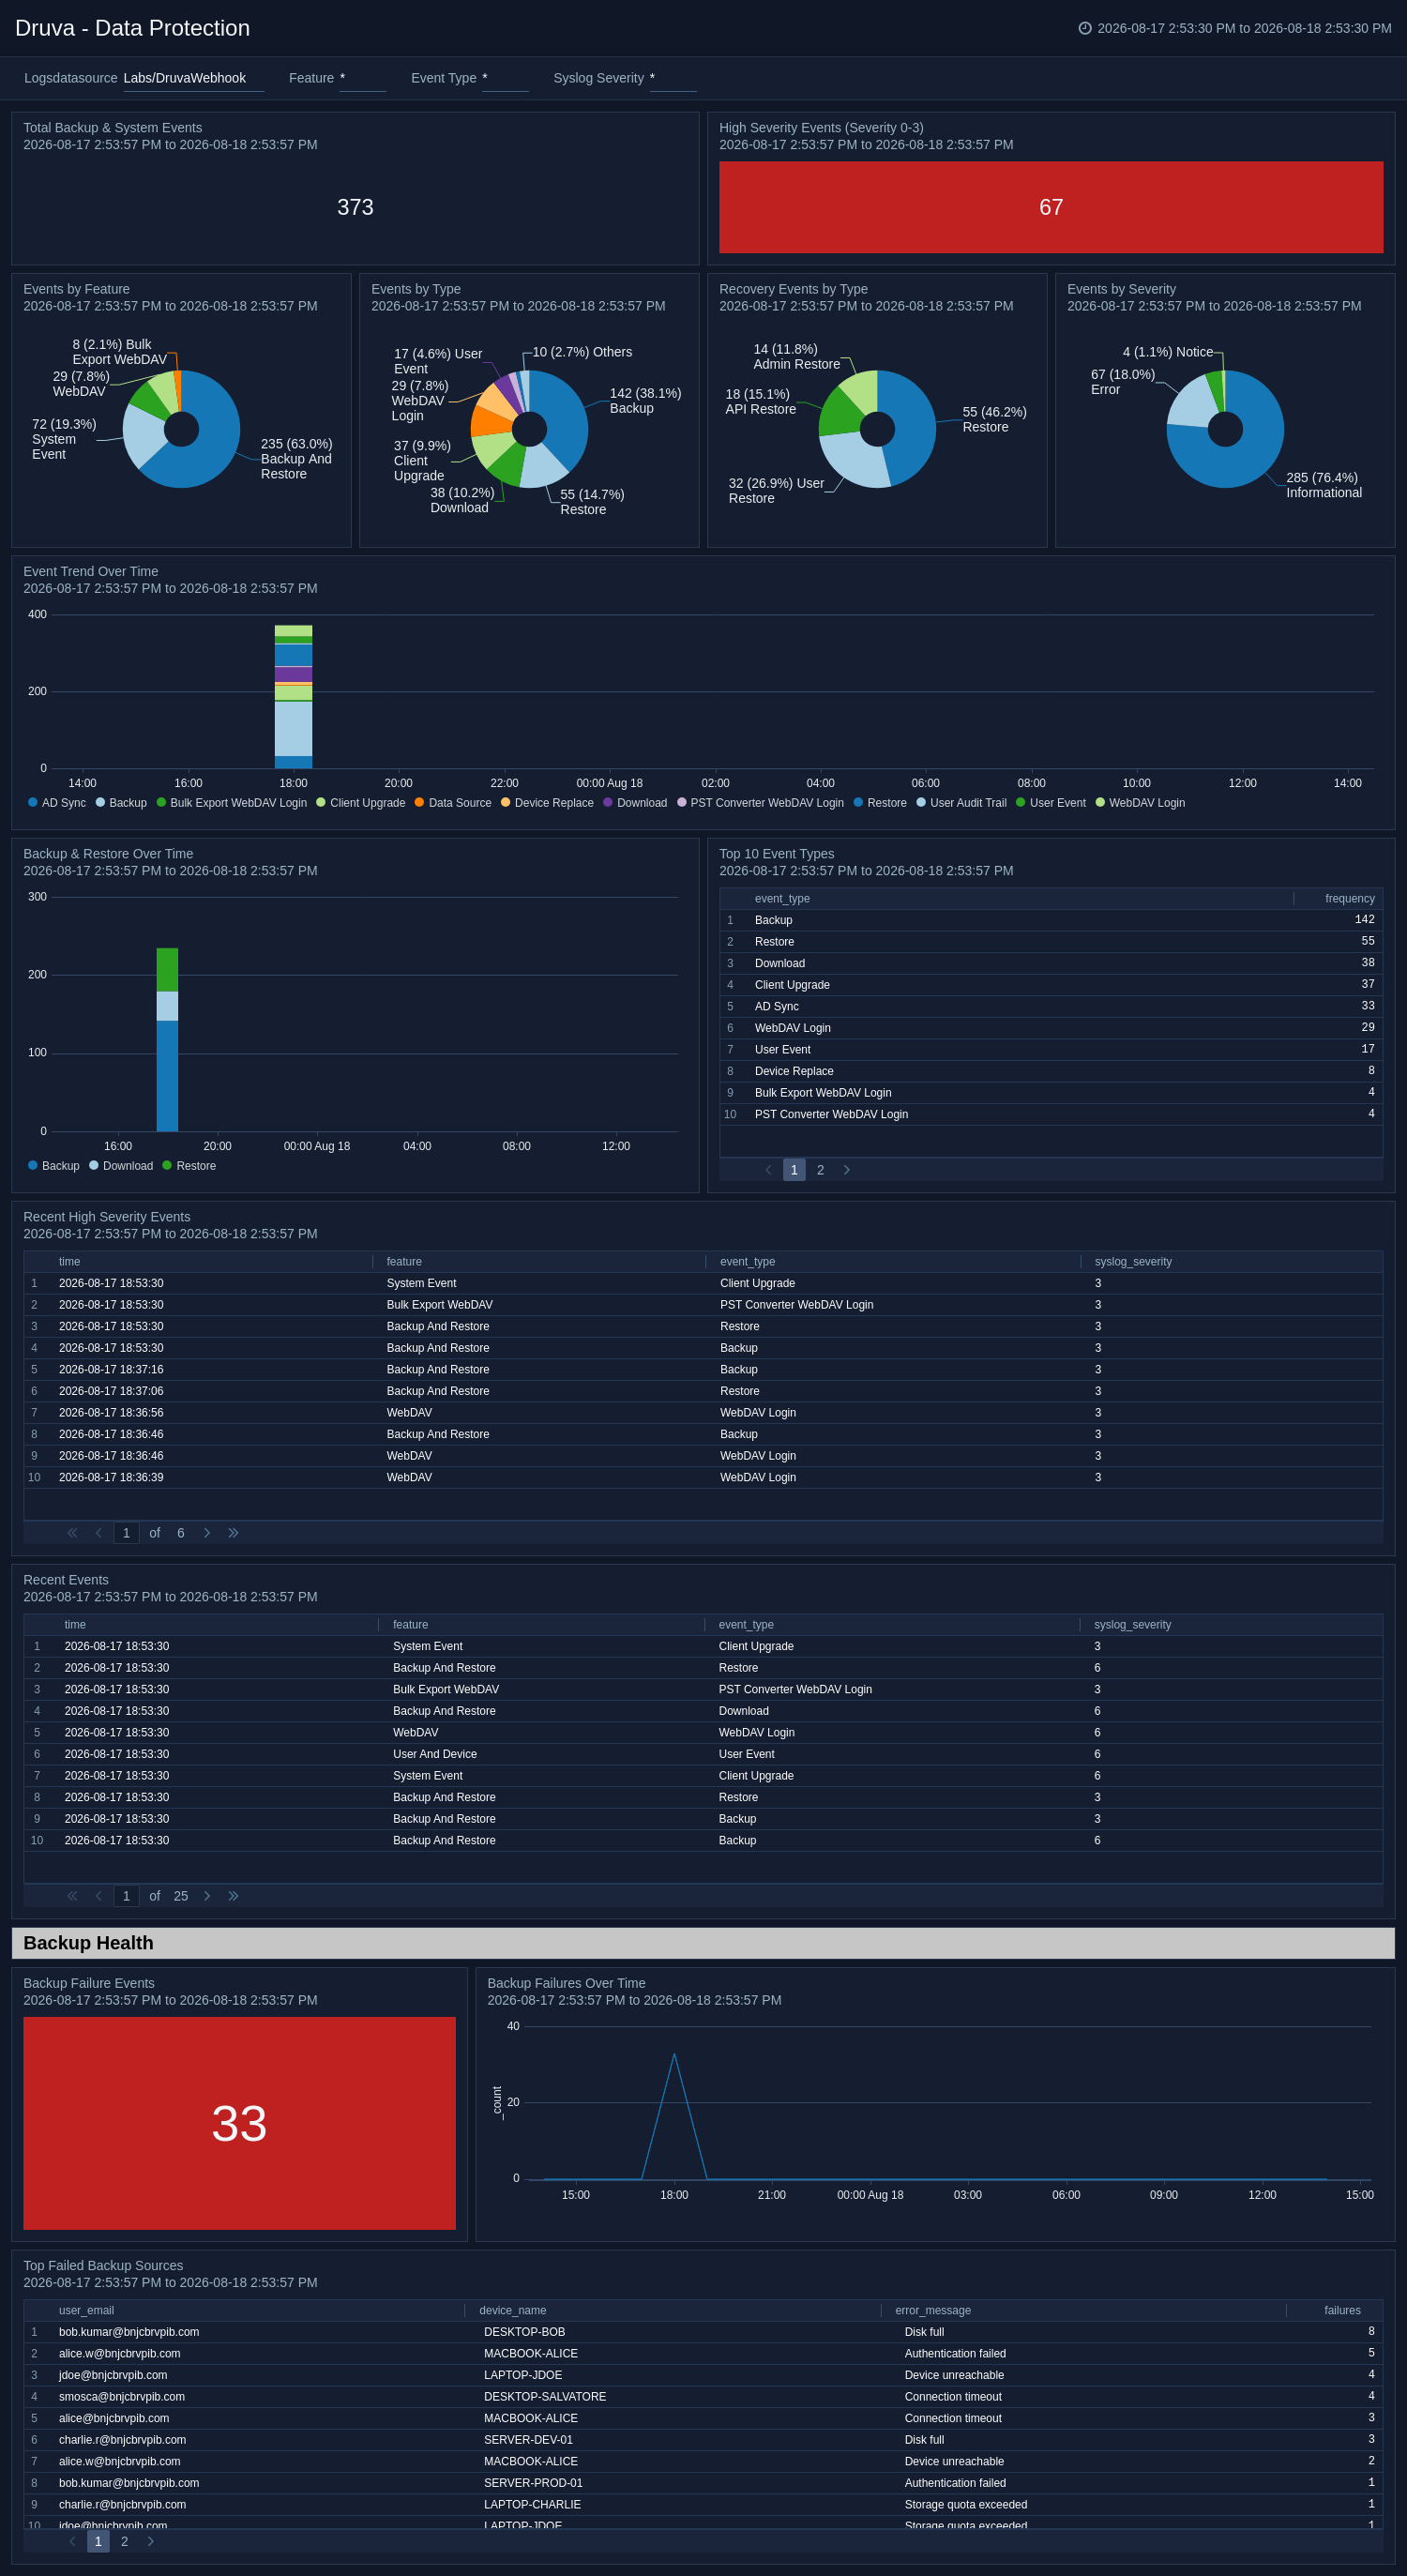
The Druva - Platform Events - Data Protection dashboard monitors backup and system events, backup success rate, failure trends, top failed backup sources, restore success rate, and recovery events by type.
Enterprise Workloads
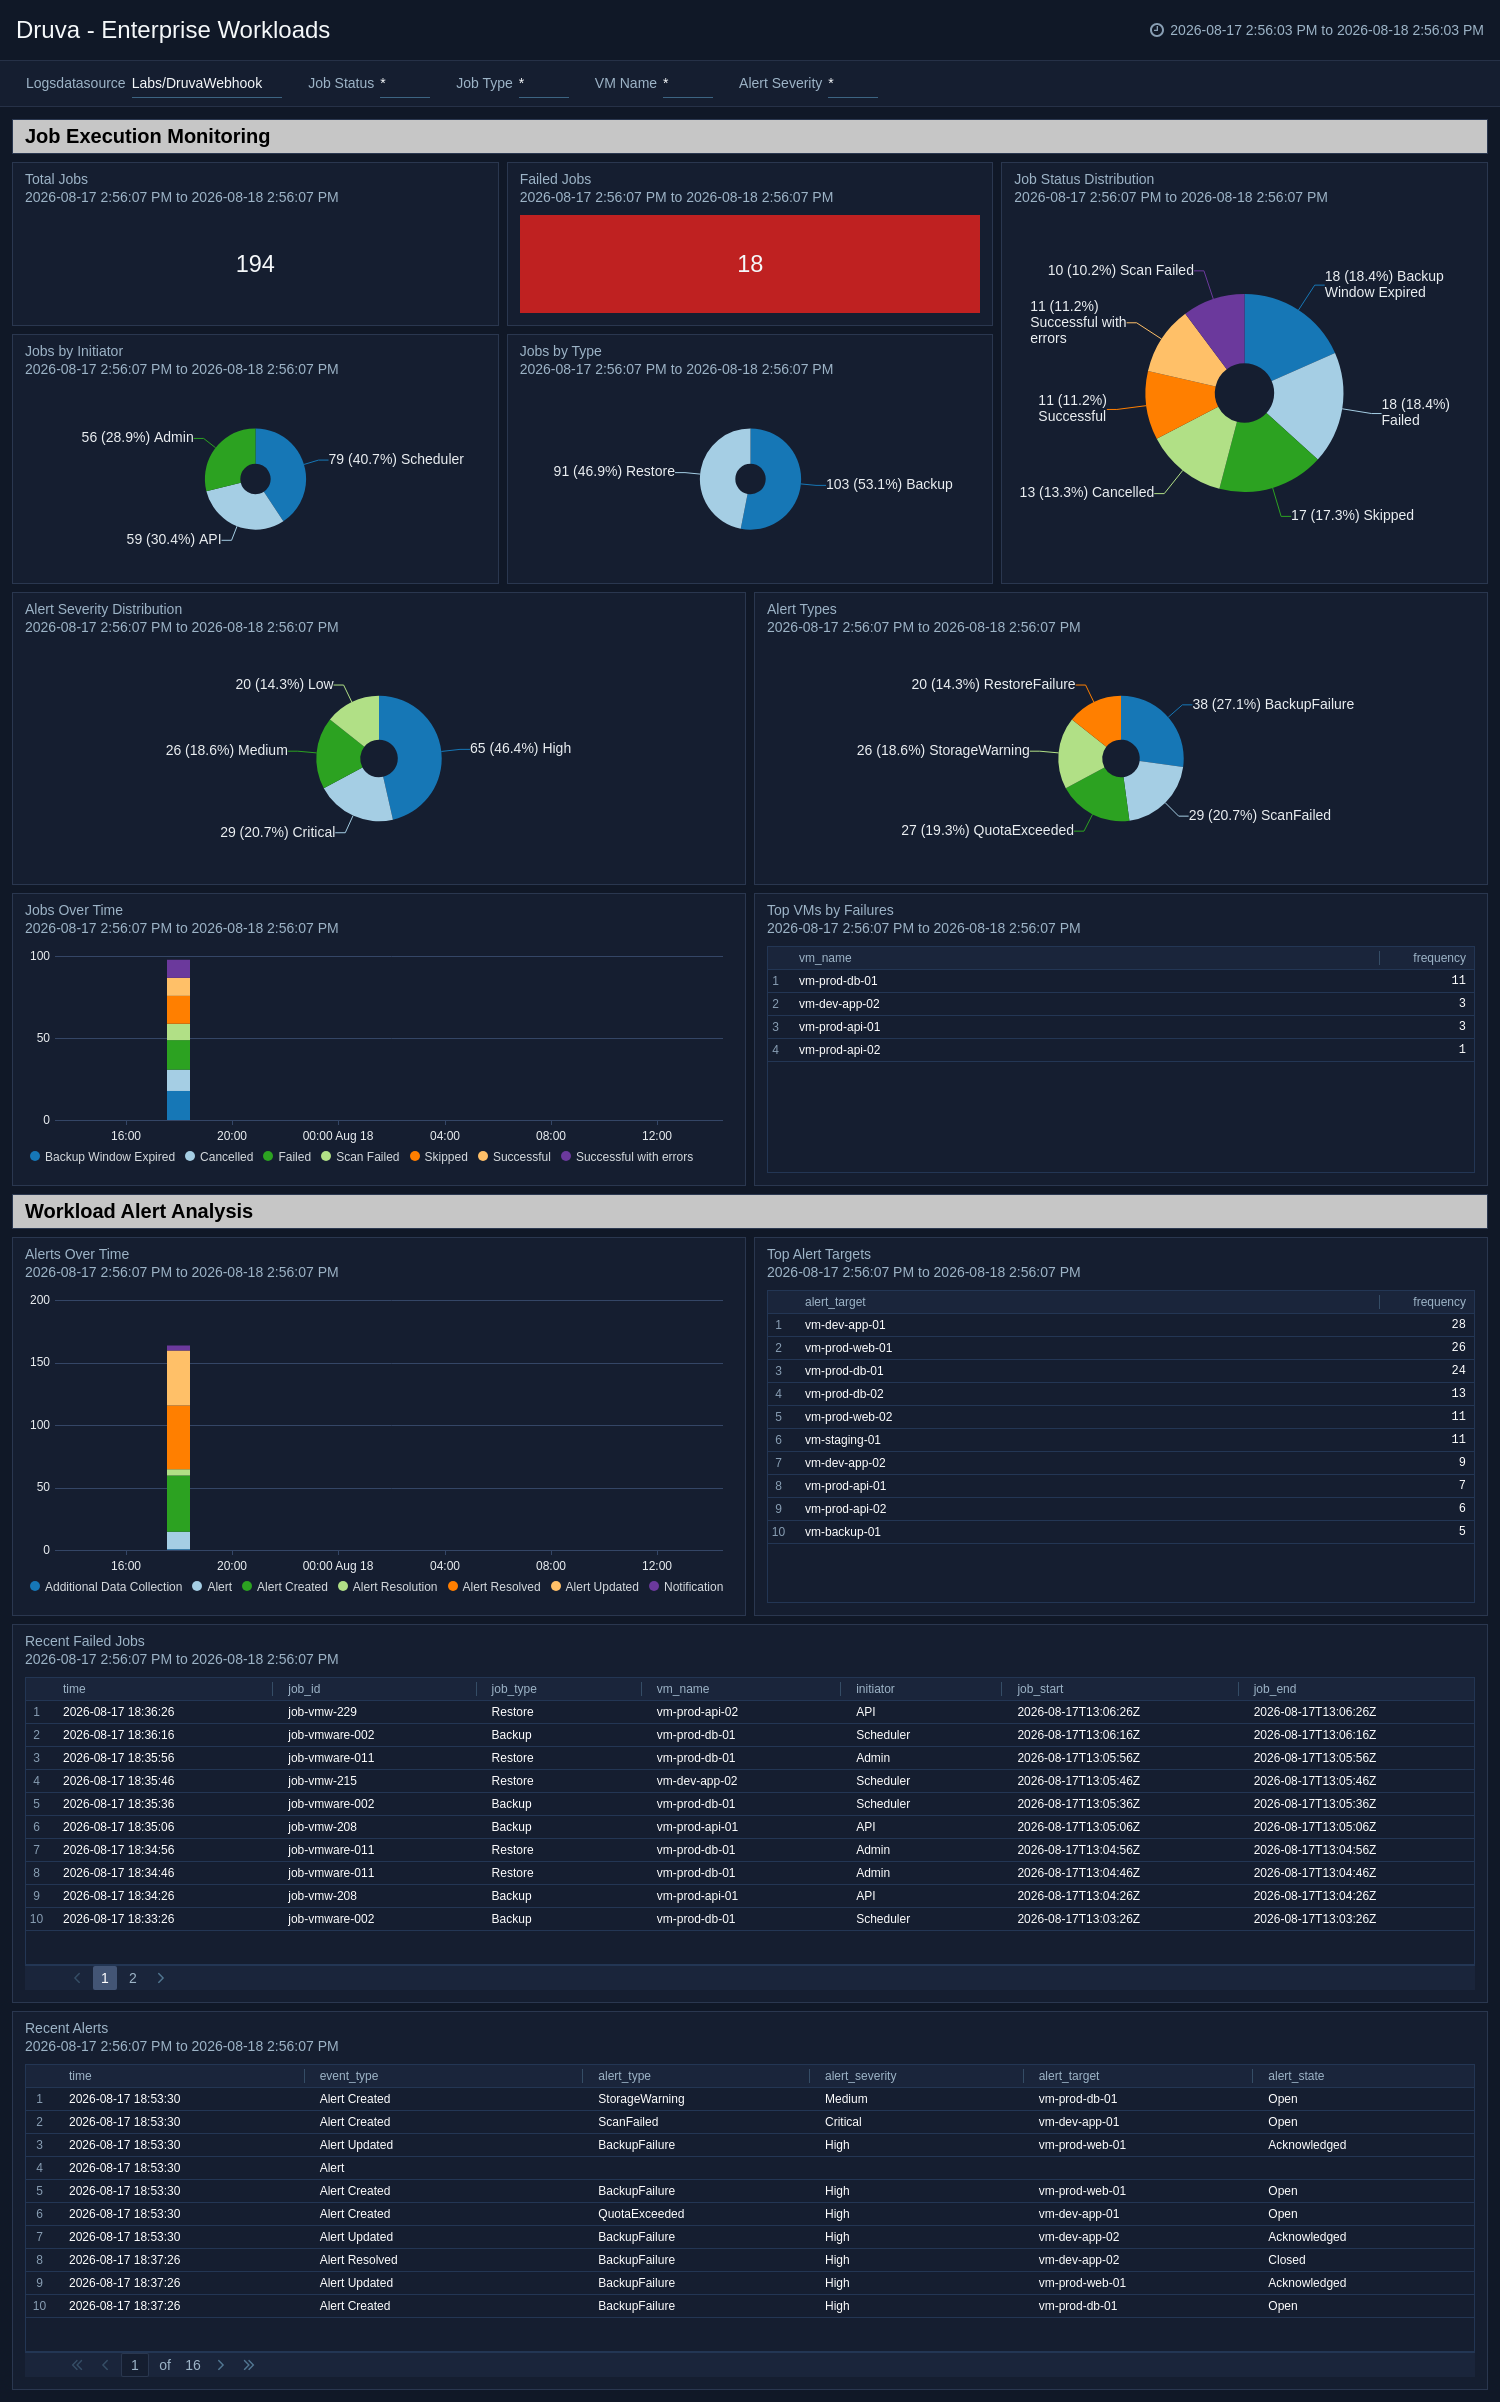
The Druva - Platform Events - Enterprise Workloads dashboard provides visibility into VM backup jobs (triggered and ended), job status distribution, failures by VM, and workload alerts.
Ransomware Recovery
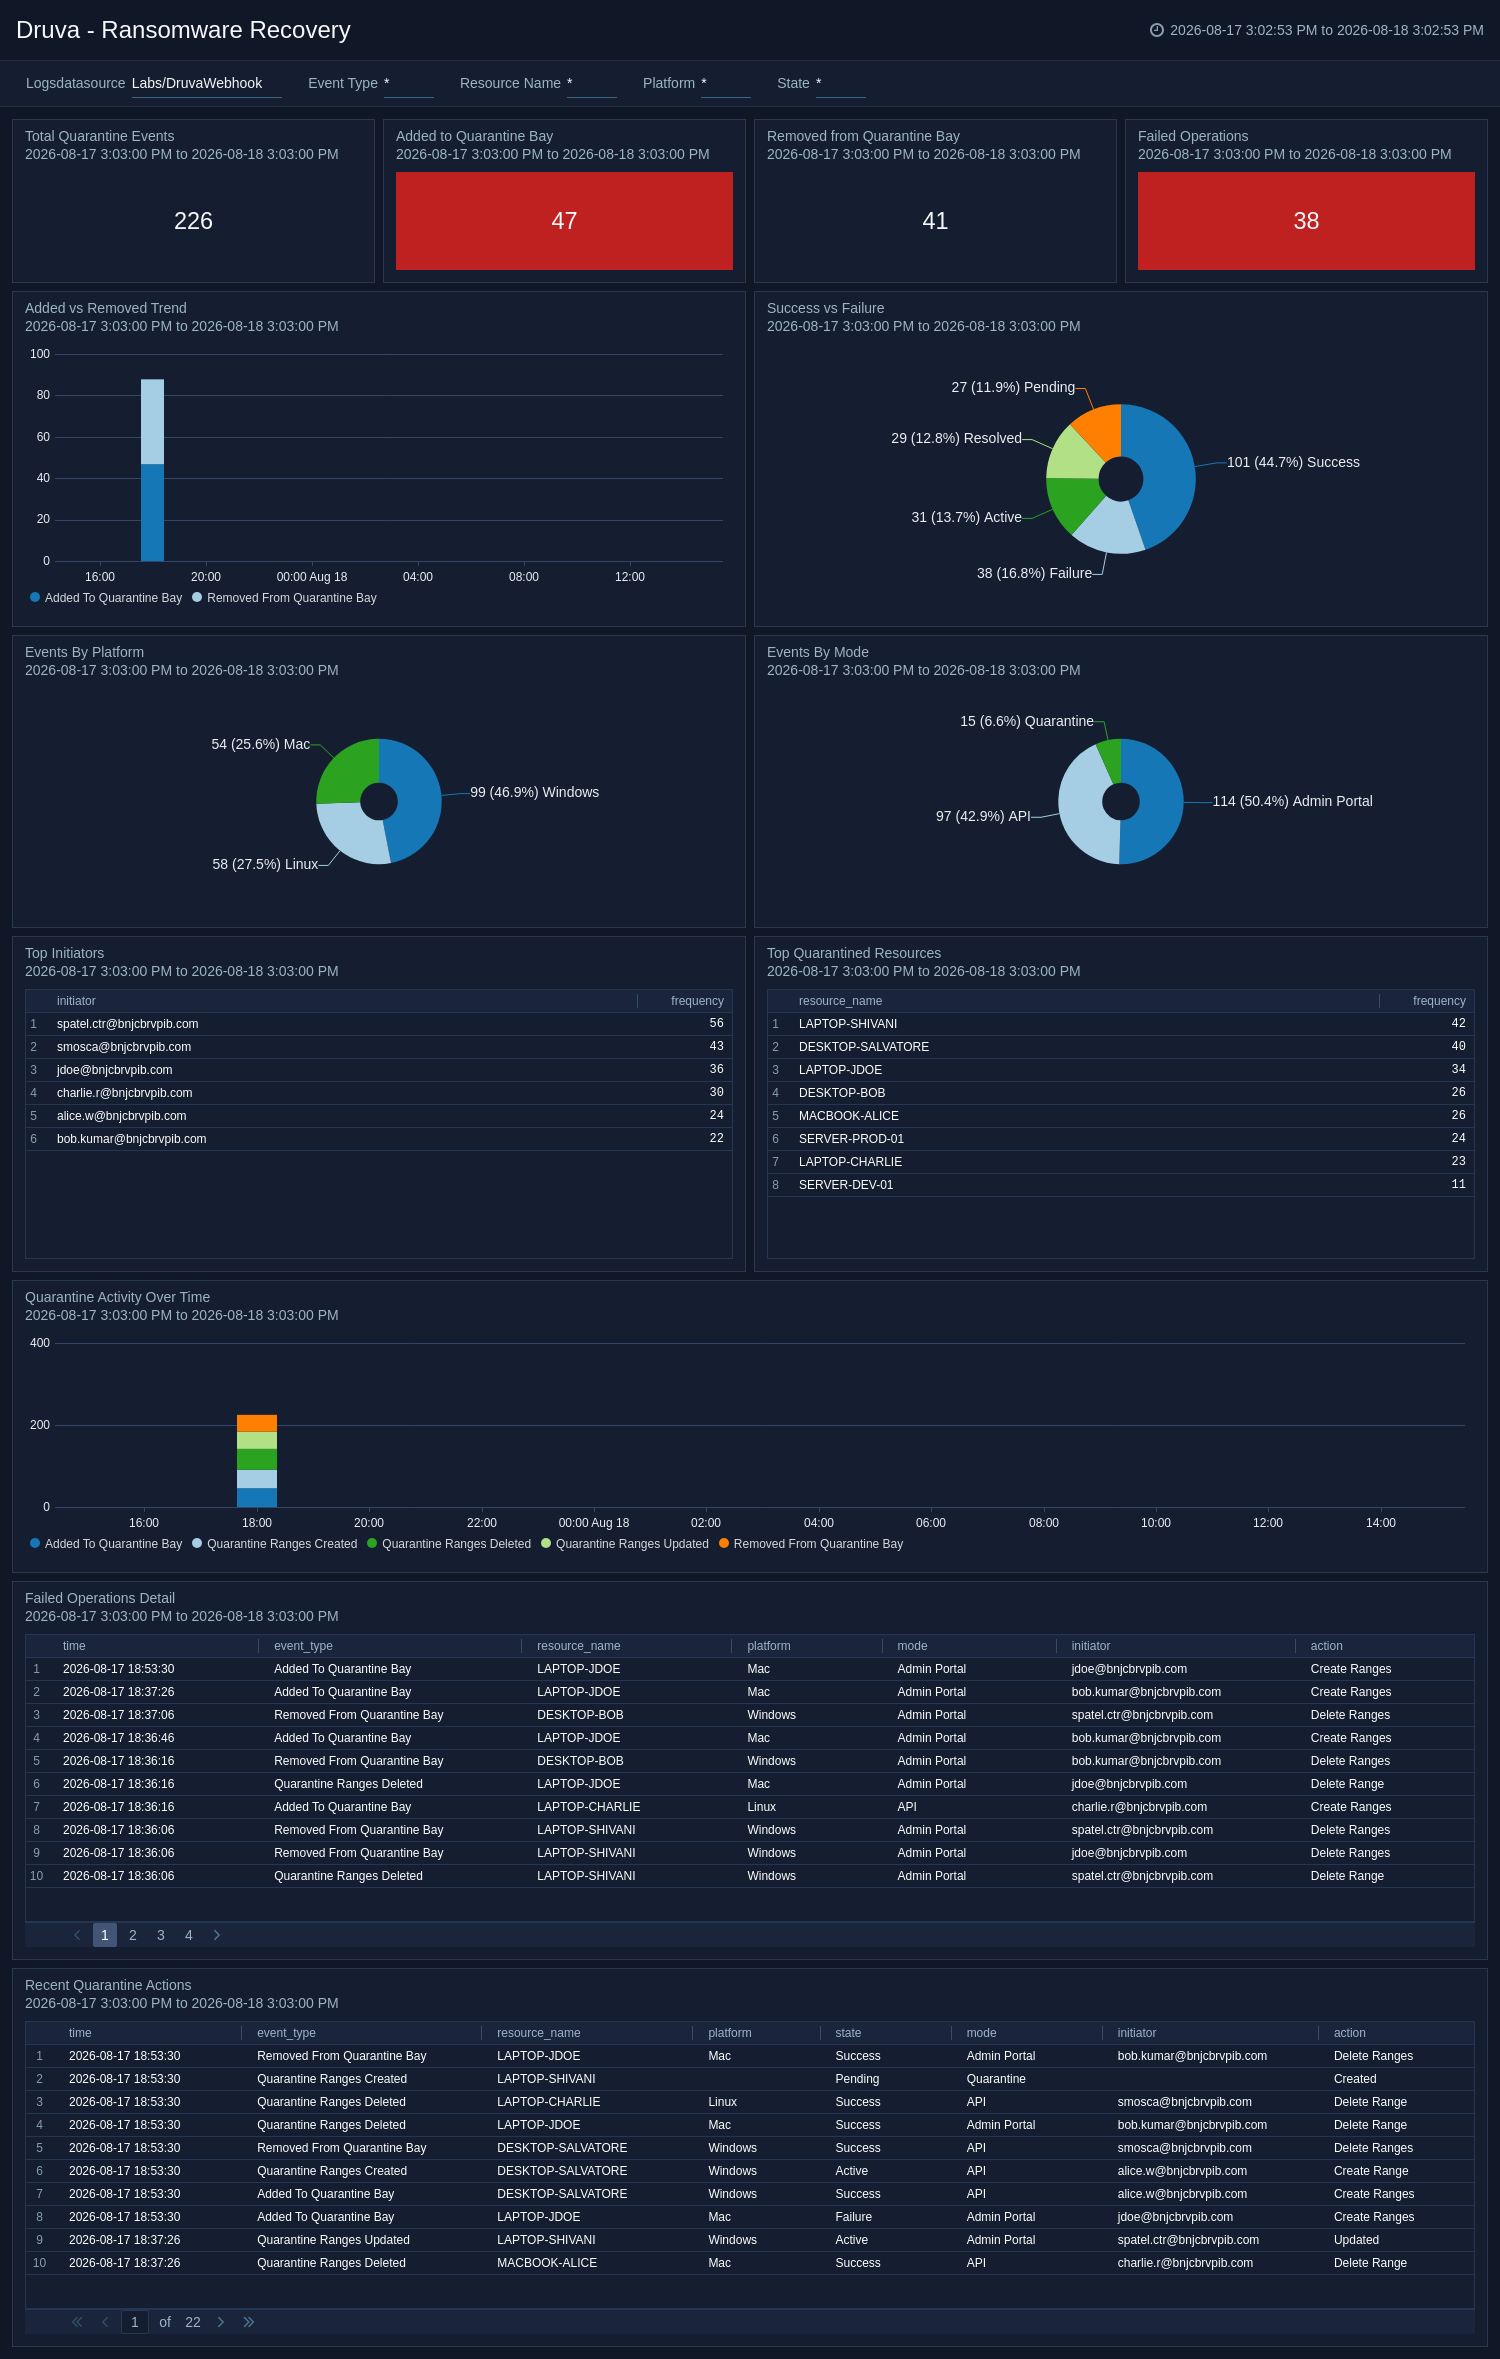
The Druva - Platform Events - Ransomware Recovery dashboard provides insights into quarantine bay actions (add and remove), success vs failure rates, activity by platform and mode, top quarantined resources, and initiators.
Sensitive Data and Compliance
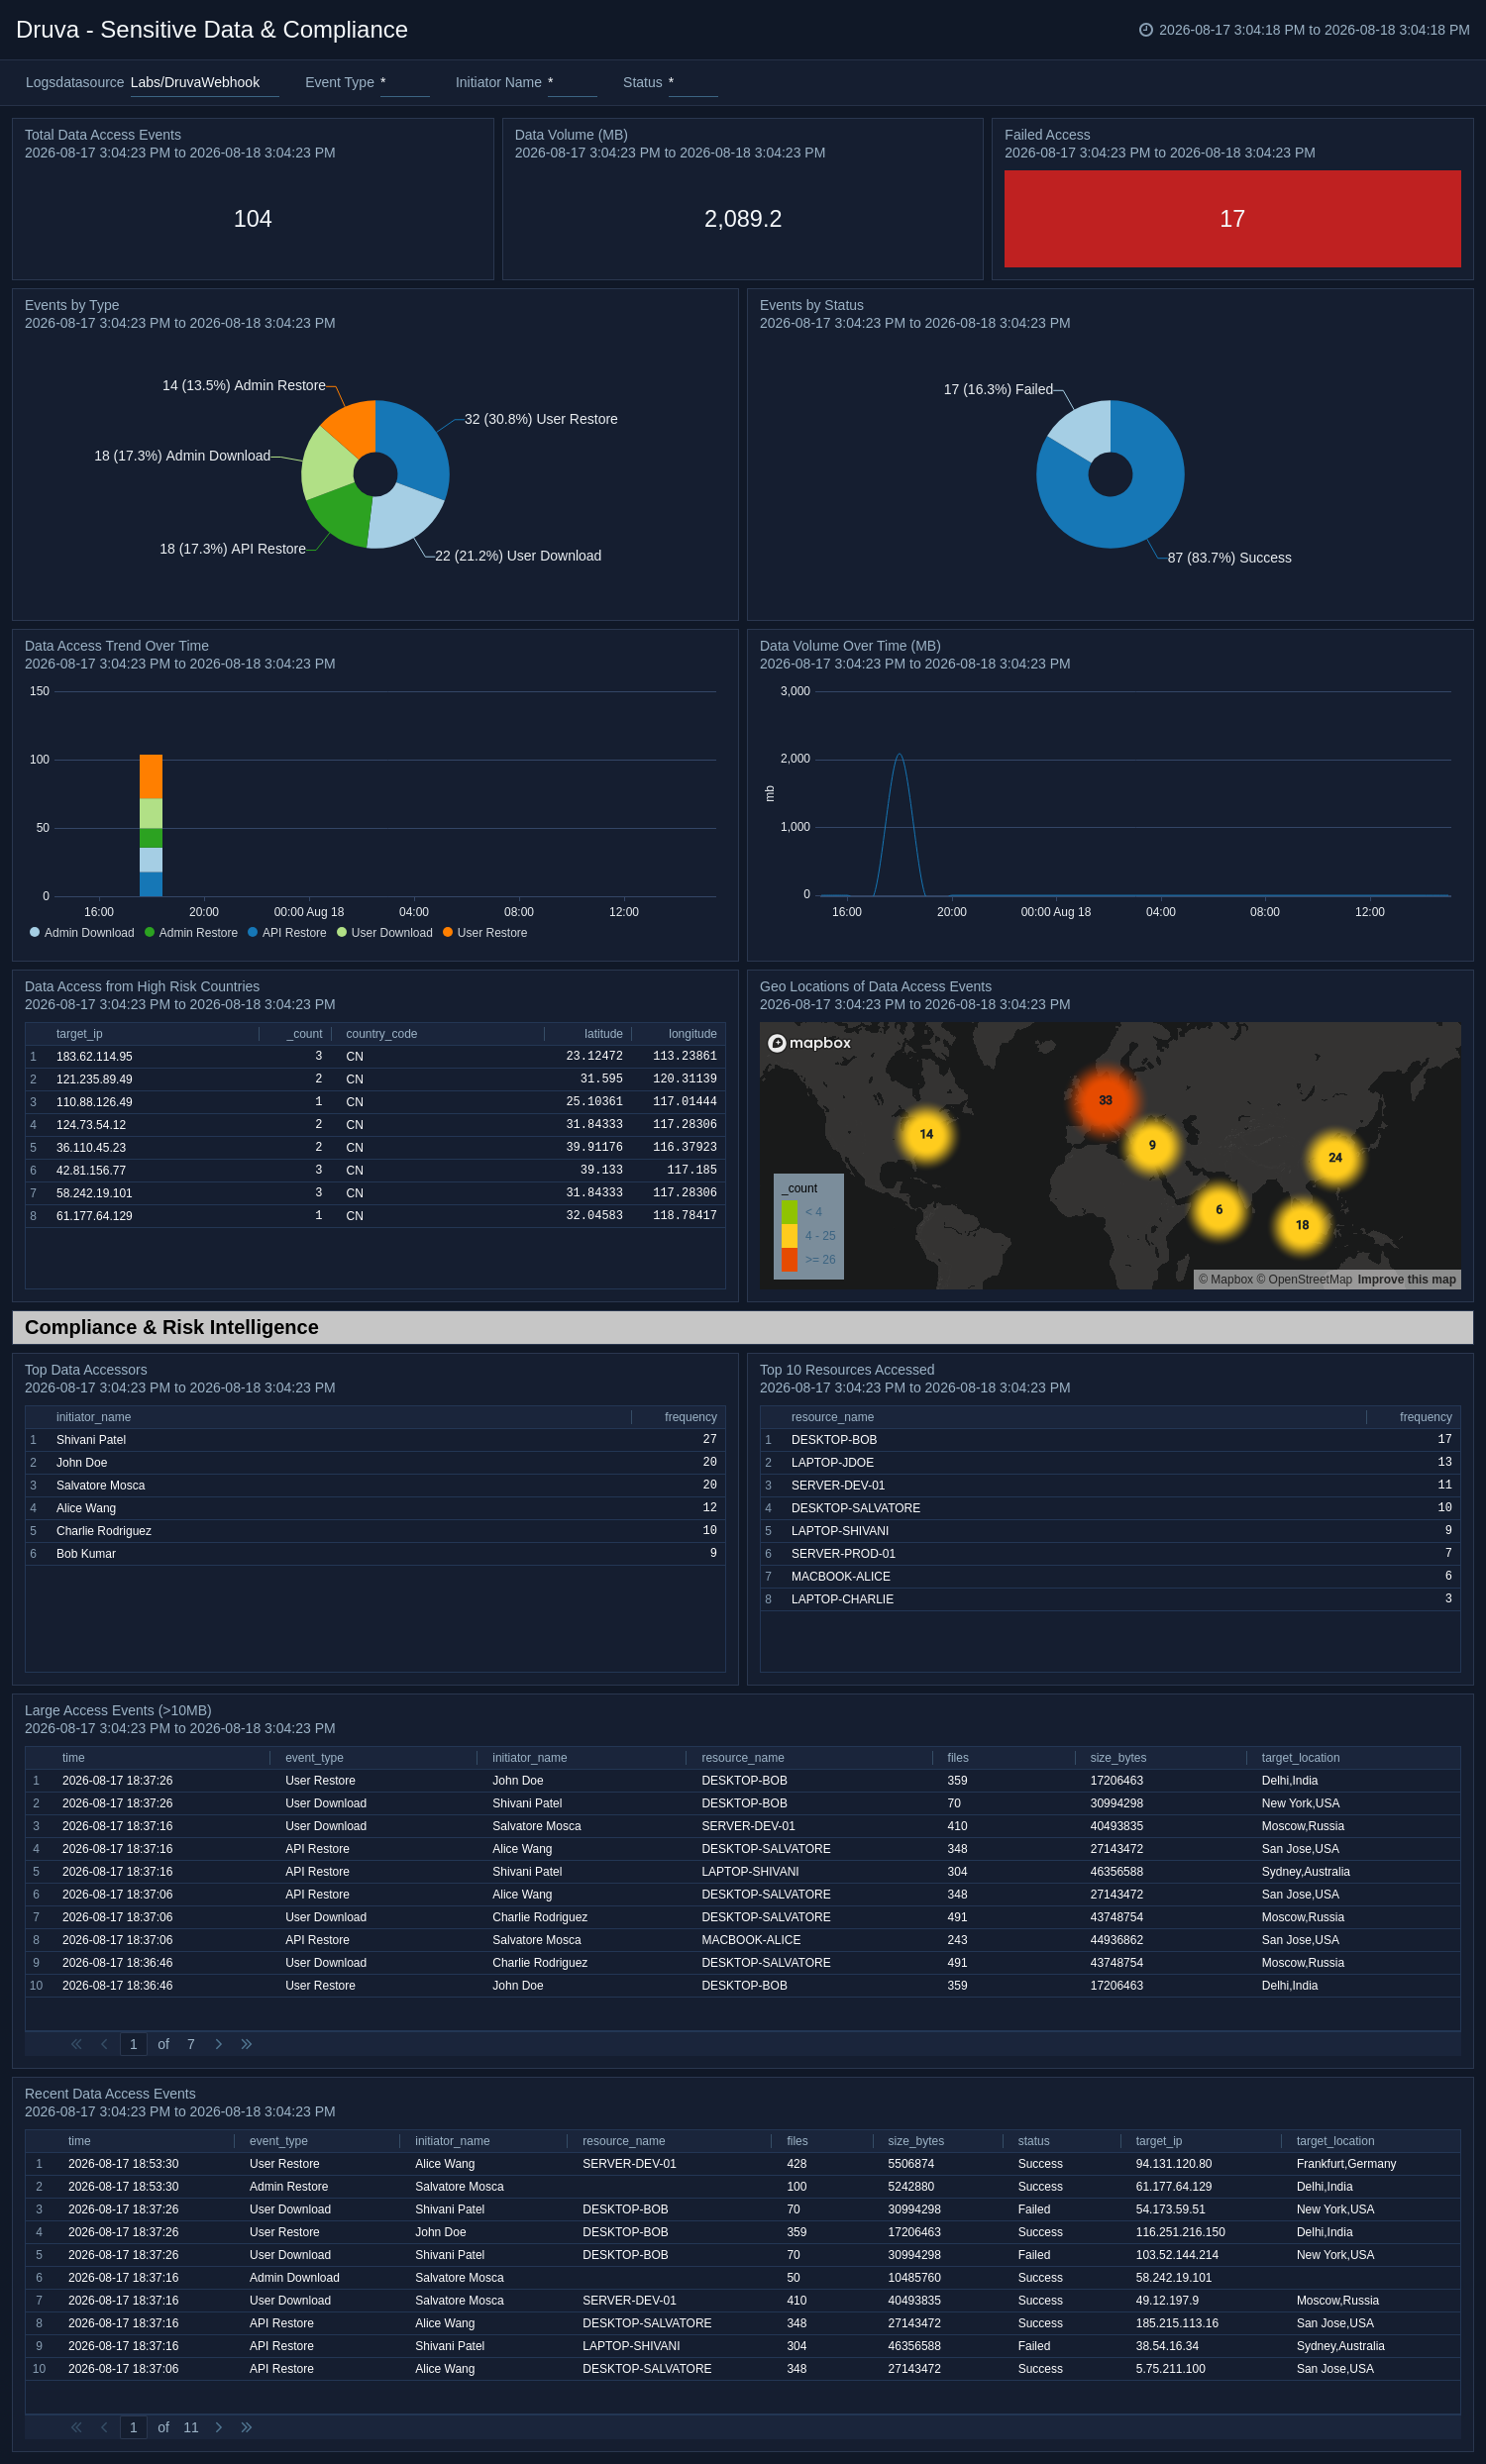
The Druva - Platform Events - Sensitive Data & Compliance dashboard monitors data access events, data volume tracking, geo-locations of access, high-risk country access, and large access events.
Cyber Security
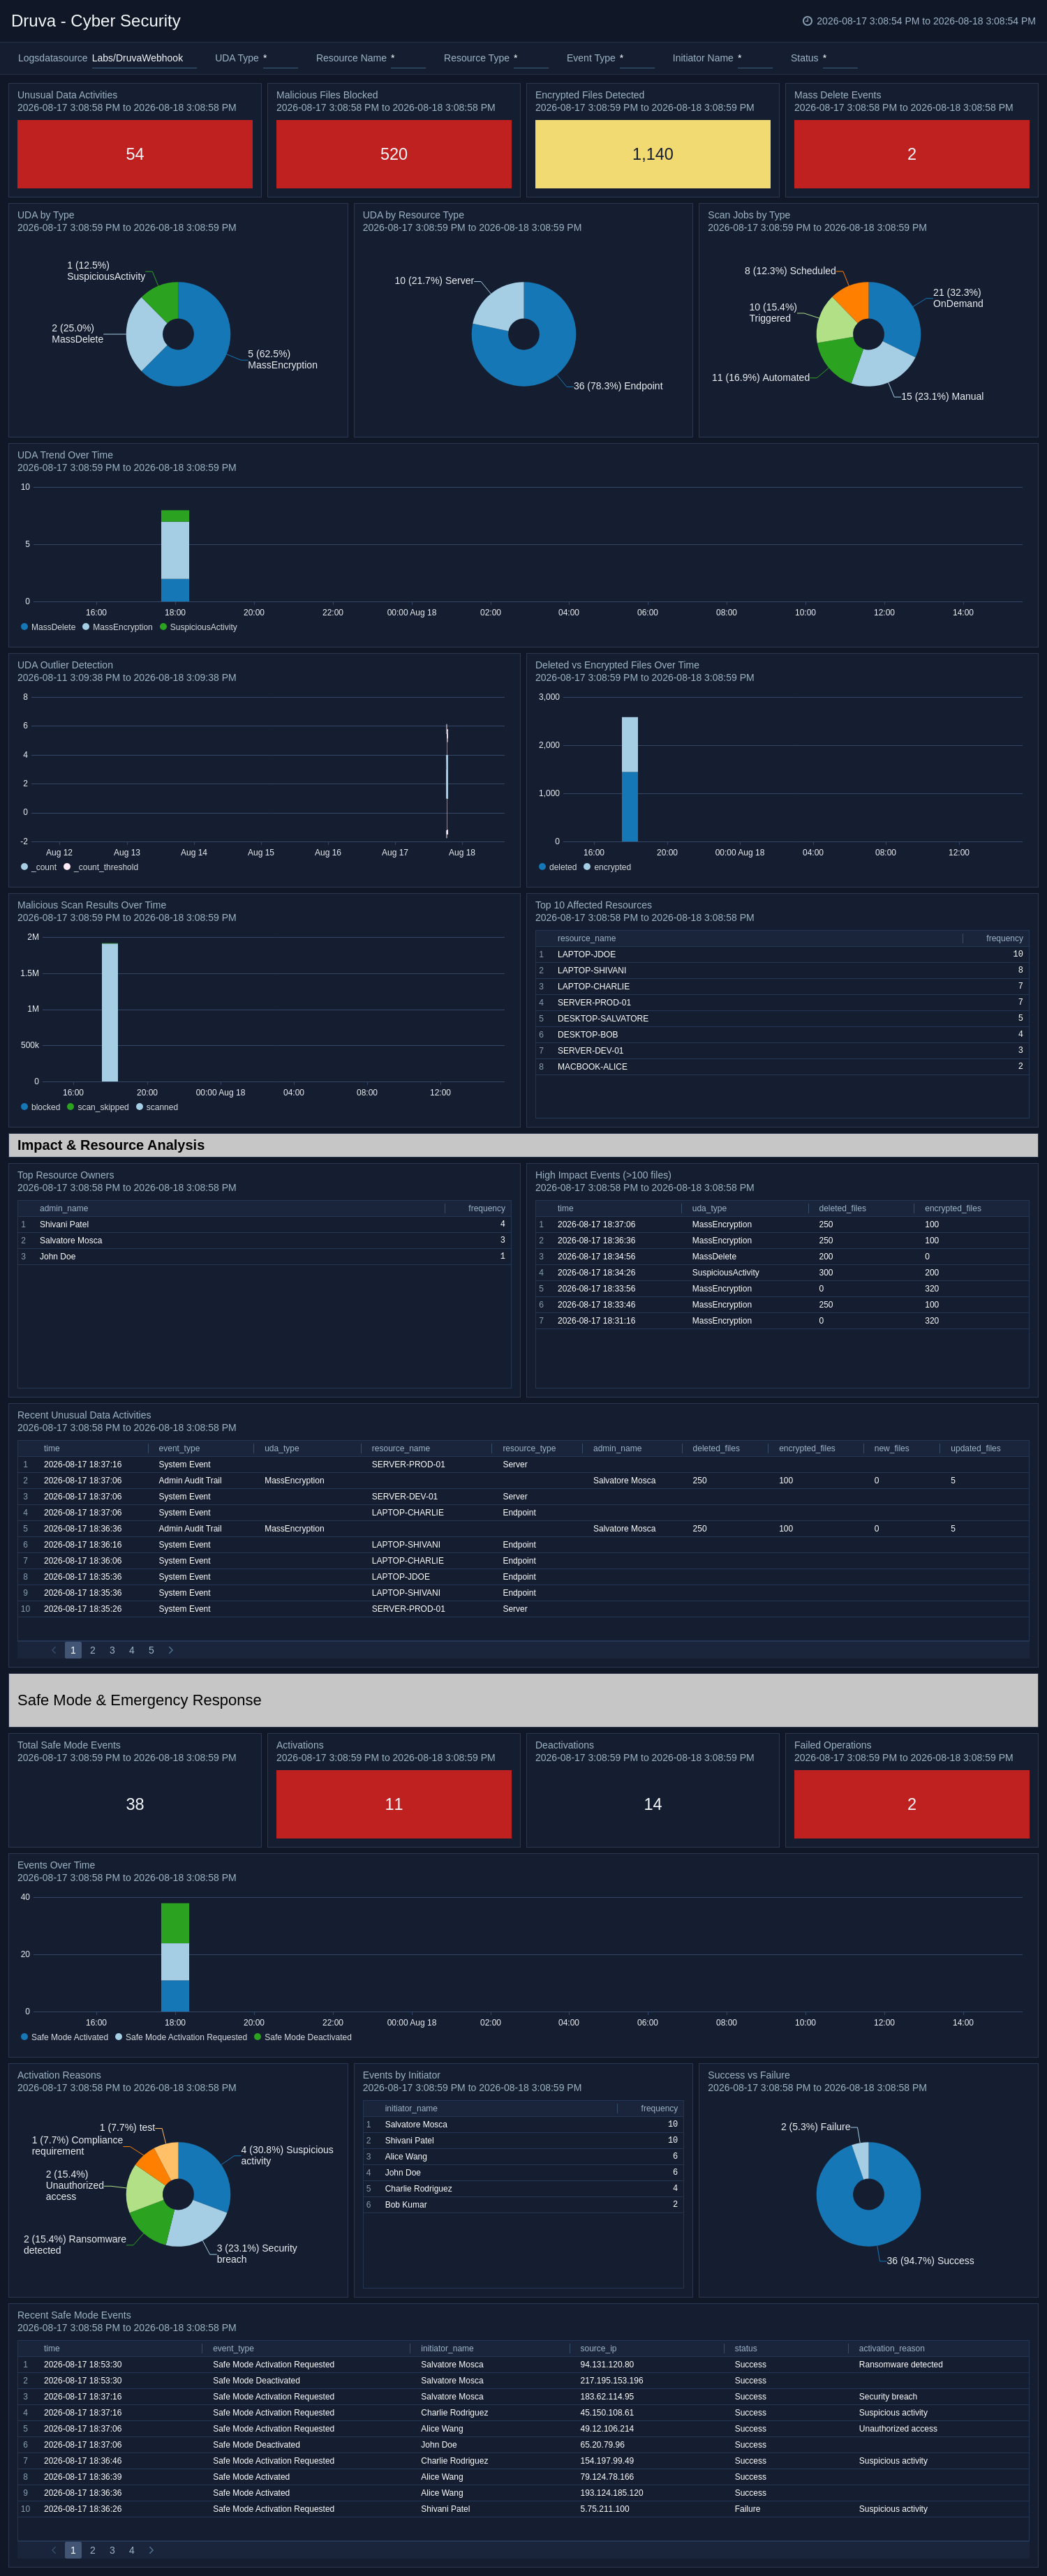
The Druva - Platform Events - Cyber Security dashboard covers unusual data activities, malicious file scans, threat hunt (curated snapshots), safe mode and emergency response, and cyber recovery events over time.
Alerts and Notifications
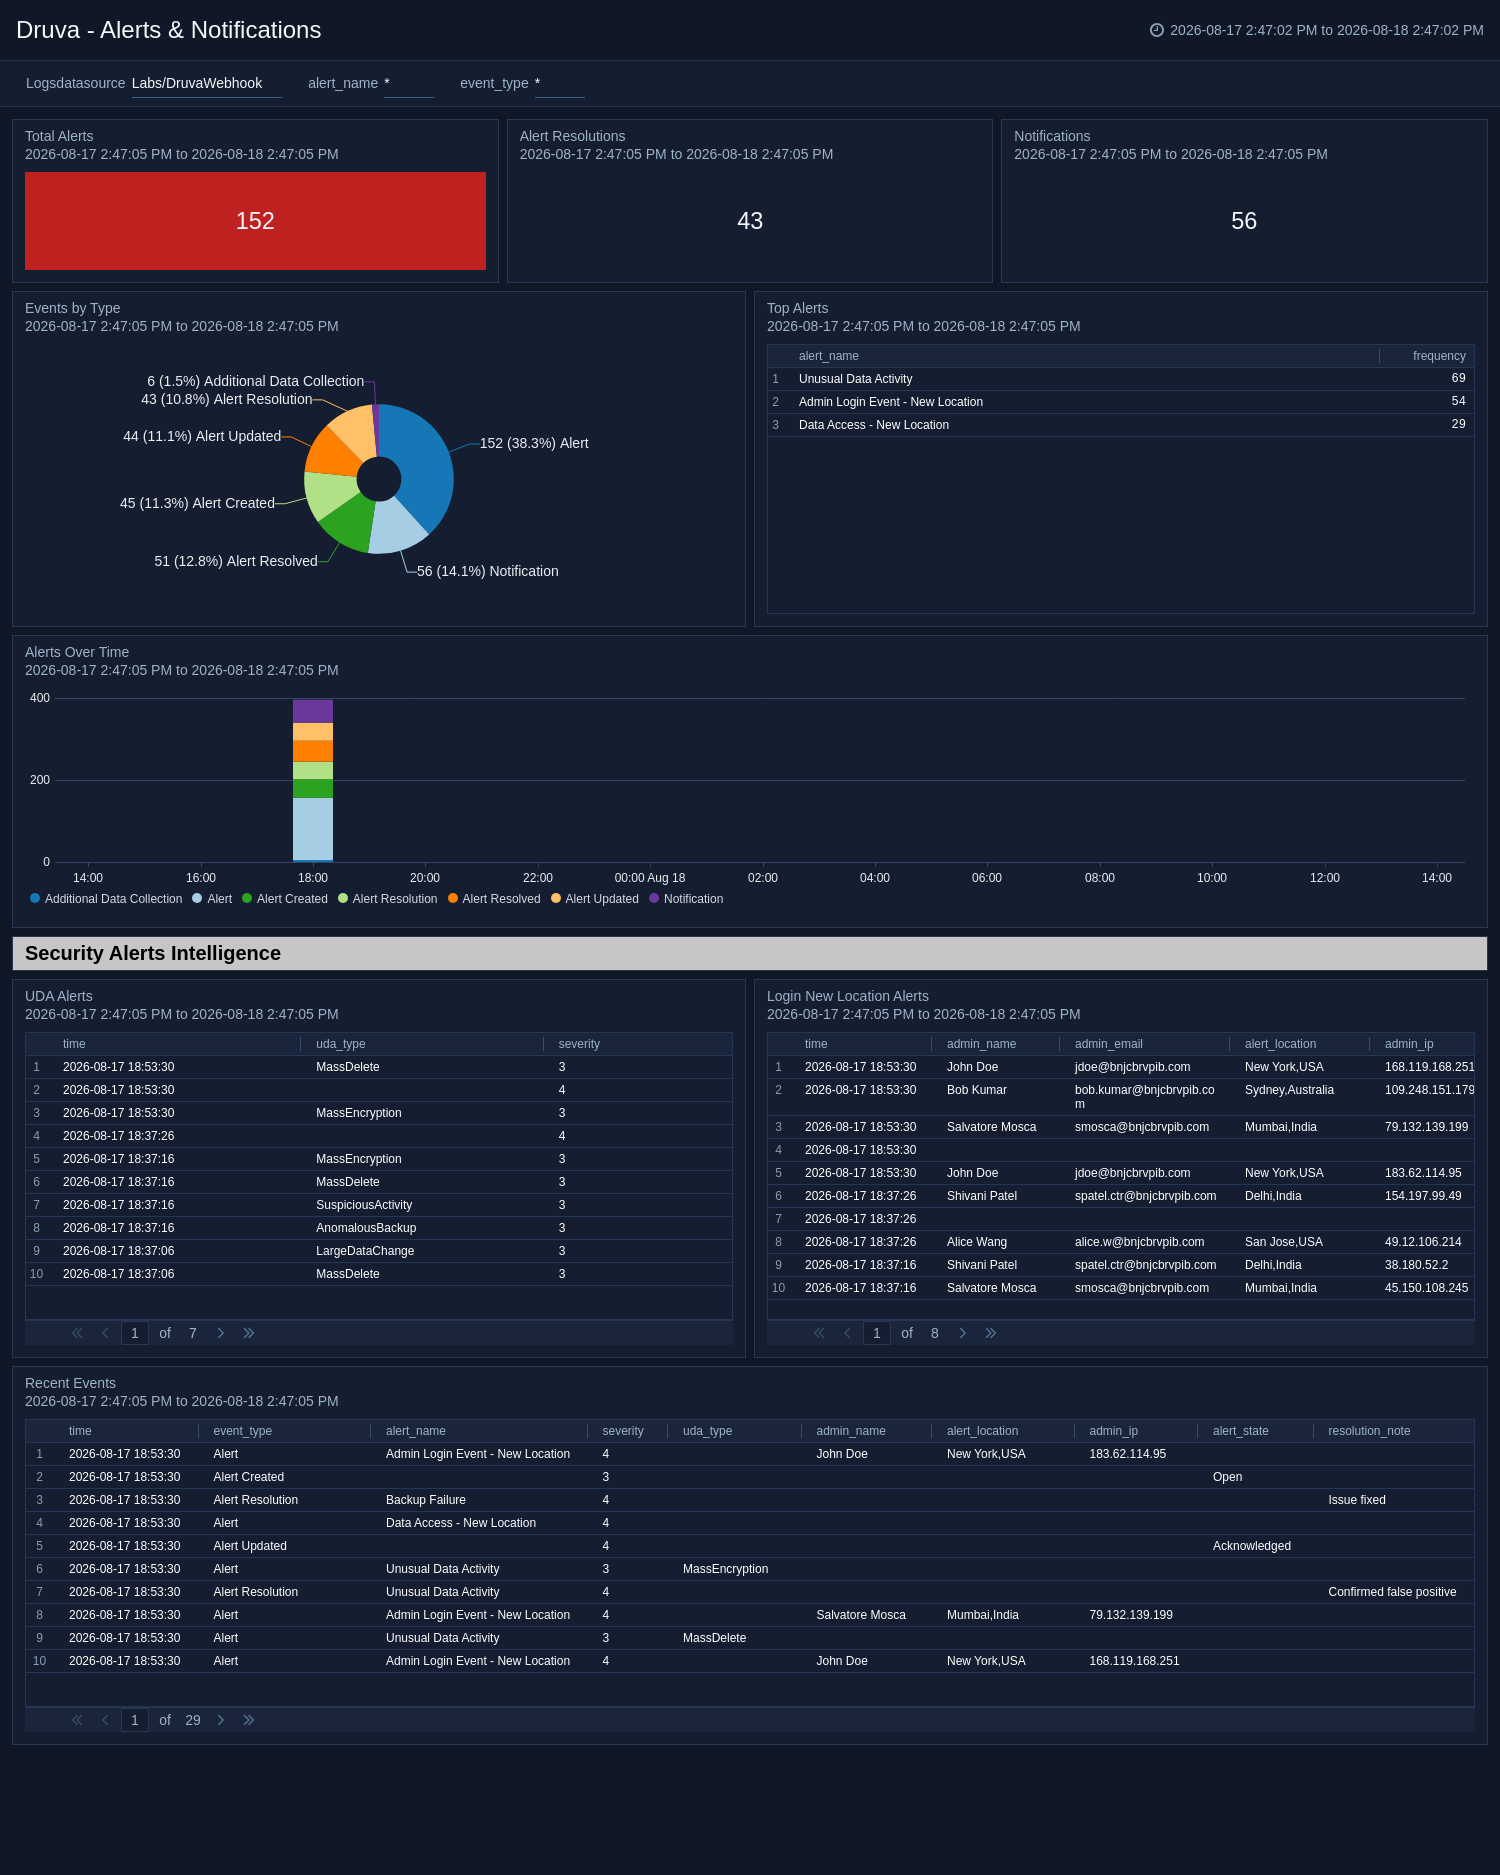
The Druva - Platform Events - Alerts & Notifications dashboard provides an overview of alert events, including alert severity distribution, trends over time, UDA alerts, login from new location alerts, and recent event details.
Create monitors for the Druva - Platform Events app
From your App Catalog:
- From the Sumo Logic navigation, select App Catalog.
- In the Search Apps field, search for and then select your app.
- Make sure the app is installed.
- Navigate to What's Included tab and scroll down to the Monitors section.
- Click Create next to the pre-configured monitors. In the create monitors window, adjust the trigger conditions and notifications settings based on your requirements.
- Scroll down to Monitor Details.
- Under Location click on New Folder.
note
By default, monitor will be saved in the root folder. So to make the maintenance easier, create a new folder in the location of your choice.
- Enter Folder Name. Folder Description is optional.
tip
Using app version in the folder name will be helpful to determine the versioning for future updates.
- Click Create. Once the folder is created, click on Save.
Druva - Platform Events alerts
| Name | Description | Alert Condition | Recover Condition |
|---|---|---|---|
Druva - Platform Events - Backup Failures Spike | This alert is triggered when more than 3 backup failures are detected within 15 minutes. A sudden spike in failures may indicate infrastructure issues, storage problems, or agent connectivity failures requiring immediate investigation. | Count > 3 | Count < = 3 |
Druva - Platform Events - Data Access from High Risk Country | This alert is triggered when data access activity is detected from an embargoed or high-risk country. This may indicate potential data exfiltration, unauthorized access from restricted geographies, or a compromised account being used from a sanctioned region. | Count > 0 | Count < = 0 |
Druva - Platform Events - Malicious File Detected | This alert is triggered when Druva detects malicious files during a scan or curated snapshot operation. This indicates that malware or ransomware artifacts have been identified in protected data and may require quarantine or remediation action. | Count > 0 | Count < = 0 |
Druva - Platform Events - Mass Delete Detected (Unusual Data Activity) | This alert is triggered when an unusual data activity event is detected with more than 100 files deleted. Mass file deletion is a strong indicator of ransomware activity, insider threats, or compromised accounts attempting to destroy data. | Count > 0 | Count < = 0 |
Druva - Platform Events - Multiple Failed Admin Logins | This alert is triggered when more than 3 failed admin login attempts are detected within 15 minutes. This may indicate brute-force activity, credential stuffing, or unauthorized access attempts against administrative accounts. | Count > 3 | Count < = 3 |
Upgrade/Downgrade the Druva - Platform Events app (Optional)
To update the app, do the following:
Next-Gen App: To install or update the app, you must be an account administrator or a user with Manage Apps, Manage Monitors, Manage Fields, Manage Metric Rules, and Manage Collectors capabilities depending upon the different content types part of the app.
- Select App Catalog.
- In the Search Apps field, search for and then select your app.
Optionally, you can identify apps that can be upgraded in the Upgrade available section. - To upgrade the app, select Upgrade from the Manage dropdown.
- If the upgrade does not have any configuration or property changes, you will be redirected to the Preview & Done section.
- If the upgrade has any configuration or property changes, you will be redirected to the Setup Data page.
- In the Configure section of your respective app, complete the following fields.
- Field Name. If you already have collectors and sources set up, select the configured metadata field name (eg _sourcecategory) or specify other custom metadata (eg: _collector) along with its metadata Field Value.
- Click Next. You will be redirected to the Preview & Done section.
Post-update
Your upgraded app will be installed in the Installed Apps folder and dashboard panels will start to fill automatically.
See our Release Notes changelog for new updates in the app.
To revert the app to a previous version, do the following:
- Select App Catalog.
- In the Search Apps field, search for and then select your app.
- To version down the app, select Revert to < previous version of your app > from the Manage dropdown.
Uninstalling the Druva - Platform Events app (Optional)
To uninstall the app, do the following:
- Select App Catalog.
- In the 🔎 Search Apps field, run a search for your desired app, then select it.
- Click Uninstall.