Health Events
System Health Events are generated automatically when the system detects an issue within a Collector or Source, or when a credit usage threshold is exceeded for Lookup Tables, Partitions, Fields, or Field Extraction Rules (FERs).
These events provide visibility into the operational health of Collectors, Sources, and Ingest Budgets, enabling administrators to monitor performance and identify potential issues proactively. Health events also help in investigating common errors and warnings known to affect data collection and processing.
Additionally, a health event is triggered when any limit associated with Lookup Tables, Partitions, Fields, or FERs reaches or exceeds 90% of the allocated capacity, allowing timely action to prevent service disruption. This health event will auto-resolve when the usage falls back below the 90% threshold limit.
Health events are sent from Installed Collectors of version 19.308-2 and later.
Availability
| Account Type | Account Level |
|---|---|
| CloudFlex | Professional, Enterprise |
| Credits | Trial, Essentials, Enterprise Operations, Enterprise Security, Enterprise Suite |
Event schema
This section defines the structure of System Health Events, including all key parameters and their descriptions. The example below illustrates a sample health event in JSON format, followed by a parameter table explaining each field for better understanding and analysis.
JSON example
{
    "status": "UnHealthy",
    "details": {
        "trackerId": "FileCollectionBroken",
        "name": "Failed to find the file path",
        "description": "File collection is not working as expected because of invalid path."
    },
    "eventType": "Health-Change",
    "severityLevel": "Error",
    "accountId": "0000000000000131",
    "eventId": "39205436-7e16-4e2f-9f95-ef750e055d79",
    "eventName": "TrackerUnHealthy",
    "eventTime": "2020-01-20T16:10:27.085Z",
    "eventFormatVersion": "1.0",
    "subsystem": "Collection",
    "resourceIdentity": {
        "collectorId": "000000000641A117",
        "collectorName": "Sumo Logic",
        "id": "000000000679181F",
        "name": "ops_zookeeper",
        "type": "SourceResource"
    }
}
Parameters table
Each health event log has common keys that categorize it to a product area and provide details of the event. The following table shows the common parameters in the order that they are found in health event logs.
| Parameter | Description | Data type |
|---|---|---|
| status | Either Healthy or Unhealthy based on the event. | String |
| details | The details of the event include the type as trackerId, the name of the event, and a description. | JSON object of Strings |
| eventType | Health events have a value of Health-Change. | String |
| severityLevel | Either Error or Warning based on the event. | String |
| accountId | The unique identifier of the organization. | String |
| eventId | The unique identifier of the event. | String |
| eventName | The name of the event. | String |
| eventTime | The event timestamp in ISO 8601 format. | String |
| eventFormatVersion | The event log format version. | String |
| operator | Information on who did the operation. If it's missing, the Sumo service was the operator. | JSON object of Strings |
| subsystem | The product area of the event. | String |
| resourceIdentity | This includes any unique identifiers, names, and the type of the object associated with the event. | JSON object of Strings |
Configure scheduled search
Configuring the scheduled search for the selected health event will help you with timely alerts to all the recipients when the health event is triggered every time. To configure, follow the below steps:
- Classic UI. Go to Manage Data > Monitoring > Health Events.
New UI. In the main Sumo Logic menu select Data Management, and then under Data Collection select Health Events.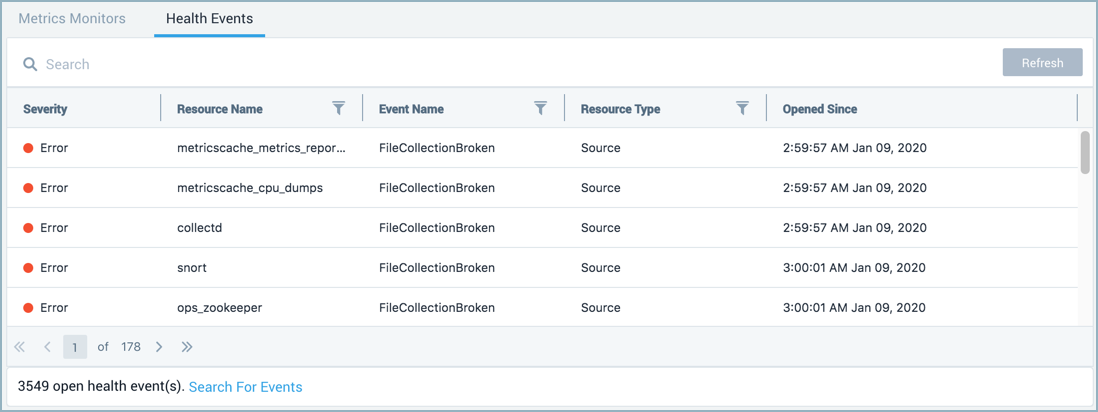
- Click on the required row to view the details of a health event.
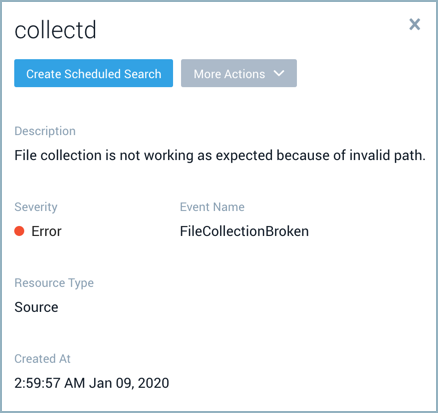
- Click the Create Scheduled Search button and configure it based on your requirement. For more details, refer to Create a Scheduled Search.
info
Query will be auto-generated for the selected health event.
Use the below scheduled search query to get an alert when 90% threshold is exceeded for Lookup Tables, Partitions, Fields, or Field Extraction Rules (FERs).
_index=sumologic_system_events "0000000007063B25"
| json "eventType", "resourceIdentity.id" as eventType , resourceId
| where eventType = "Health-Change" AND resourceId = "0000000007063B25"
For specific eventType, resourceId, eventName:
_index=sumologic_system_events "0000000007063B25"
| json "eventType", "resourceIdentity.id","eventName" as eventType, resourceId, eventName
| where eventType = "Health-Change" AND resourceId = "0000000007063B25" AND eventName="LookupsLimitApproaching"
View health events
The health events table allows you to easily view and investigate problems which occur while injecting the data to Sumo Logic. On the health events table, you can search, filter, and sort incidents by key aspects like severity, resource name, event name, resource type, and opened since date.
It may take up to 15 minutes for a 90% usage breach for Lookup Tables, Partitions, Fields, or Field Extraction Rules (FERs) to reflect on the Health Events page after detection.
- Classic UI. Go to Manage Data > Monitoring > Health Events.
New UI. In the main Sumo Logic menu select Data Management, and then under Data Collection select Health Events. - Click on the required row to view the details of a health event.
- Create Scheduled Search. Click this button to get alerts for specific health events. The unique identifier of the resource type is used in the query. See Create a Scheduled Search for details.
- Under the More Actions menu you can select:
- Event History to run a search against the sumologic_system_events partition to view all of the related event logs.
- View Object to view the resource in detail related to the event.
- Description. Provides the information about the health events error or warning.
- Severity. Events are categorized by two severity levels, warning, and error. The severity column has color-coded error and warning events so you can quickly determine the severity of a given issue.
 A warning indicates the Collector or Source has a configuration issue or is operating in a degraded state.
 An error indicates the Collector or Source is unable to collect data as expected.
- Event Name. The name or type of the health event that occurred. This identifies what kind of issue or status change was detected.
- Resource Type. The category or class of resource affected by the event. For example, Collectors, Sources, or Organizations.
- Resource ID. A unique identifier for the affected resource.
- Created At. The timestamp indicating when the event was generated by the monitoring system.
- Collector ID. The unique identifier of the collector that detected and reported the event. This field is only available for Source resource type.
- Collector Name. The name of the collector associated with the event. This field is only available for Source resource type.
- Error. A brief summary or title of the detected issue.
- Service. Displays the specific resource or service affected by the event.
- Error Code. A numeric code associated with the error, that provides a quick reference for troubleshooting or mapping to known issue types.
- Error Info. Detailed information about the event. This may include error context and suggested corrective actions.
- Minutes Since Last Heartbeat. The number of minutes that have elapsed since the system last received a heartbeat signal from the resource. A higher number may indicate the resource is offline or unresponsive. This field is only available for Collector resource type.
View health events in collection page
A Health column on the Collection page shows color-coded healthy, error, and warning states for Collectors and Sources to quickly determine the health of your Collectors and Sources.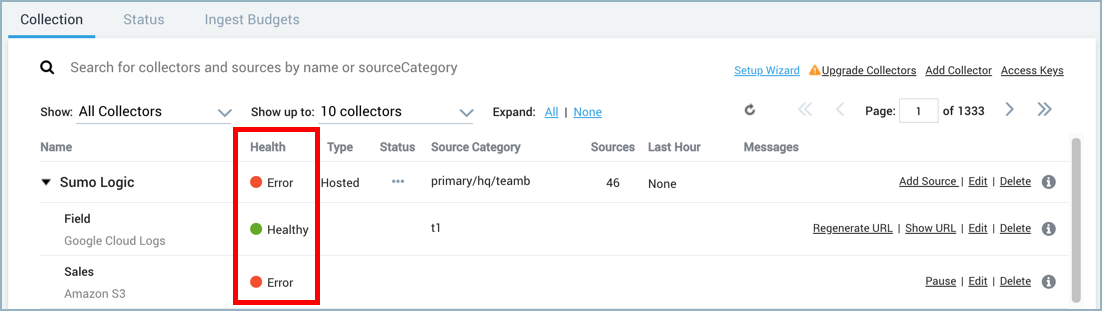
To view the number of health events associated with the Collector or Source, perform the following steps:
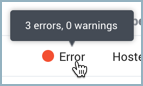
- Hover over a Health status to view a tooltip that provides the number of health events detected on the selected Collector or Source.
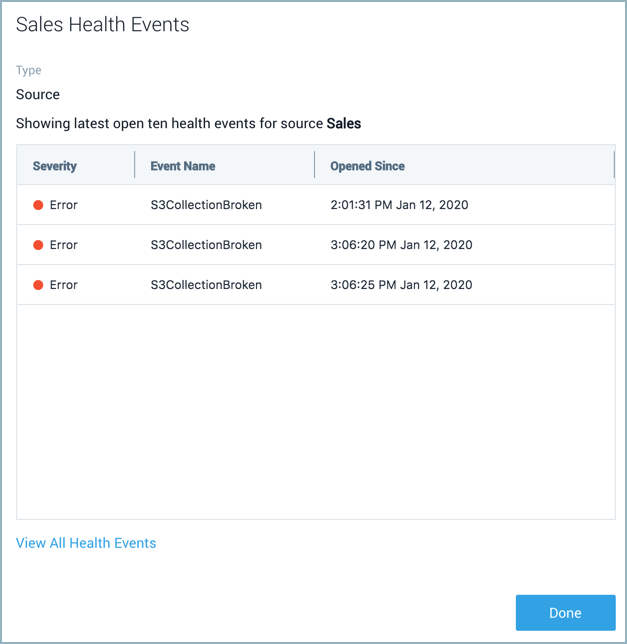
- Click on the Health status of a Collector or Source to view a pop-up displaying a list of related events.
Search health events
Events are indexed and searchable in a separate partition named sumologic_system_events in the System Event Index. To search all health events run a query against the internal partition named sumologic_system_events. For example,
_index=sumologic_system_events "Health-Change"
Create a scheduled search to get alerts for specific health events.
Metadata assignment
Creating a query that defines built-in metadata field values in the scope can help improve search performance and limit results to what you're investigating. Metadata fields are assigned to health event logs as follows:
| Metadata Field | Assignment Description |
|---|---|
| _sourceCategory | Value of the common parameter, subsystem. |
| _sourceName | Value of the common parameter, eventName. |
| _sourceHost | The remote IP address of the host that made the request. If not available the value will be no_sourceHost. |