Estimate Scan Data
When you enter a query against Data Tier or Flex pricing, Sumo Logic will estimate and display the amount of data scanned in these to return the search results. This detail is vital. With Infrequent tier and Flex pricing, you're charged for the amount of data that's scanned to complete the query.
You can view this detail by clicking the meter icon ![]() . A popup appears that displays the estimated scan data for Continuous, Frequent, Infrequent, and Flex.
. A popup appears that displays the estimated scan data for Continuous, Frequent, Infrequent, and Flex.
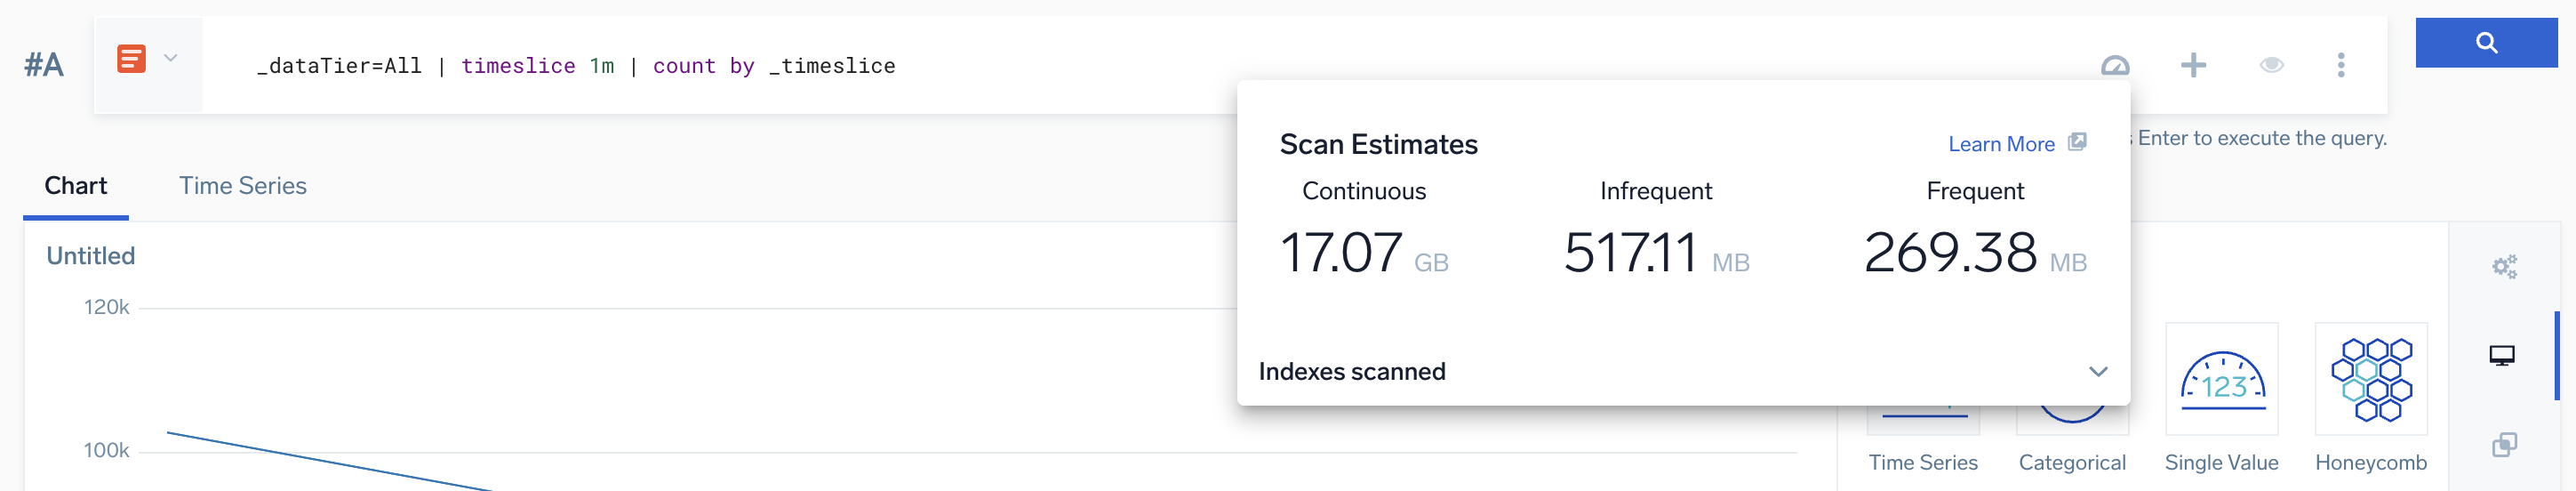
The example below shows the estimate of how much Continuous, Frequent, and Infrequent data will be scanned for a query that uses _dataTier=All in the scope.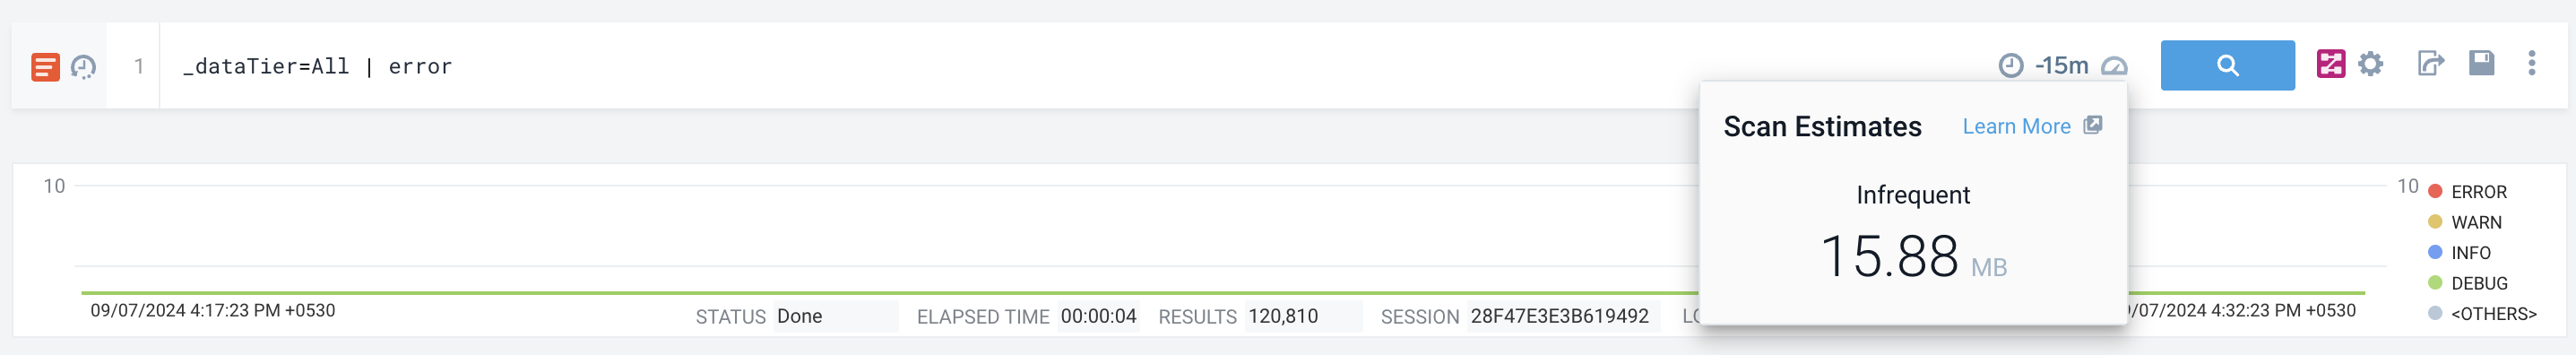
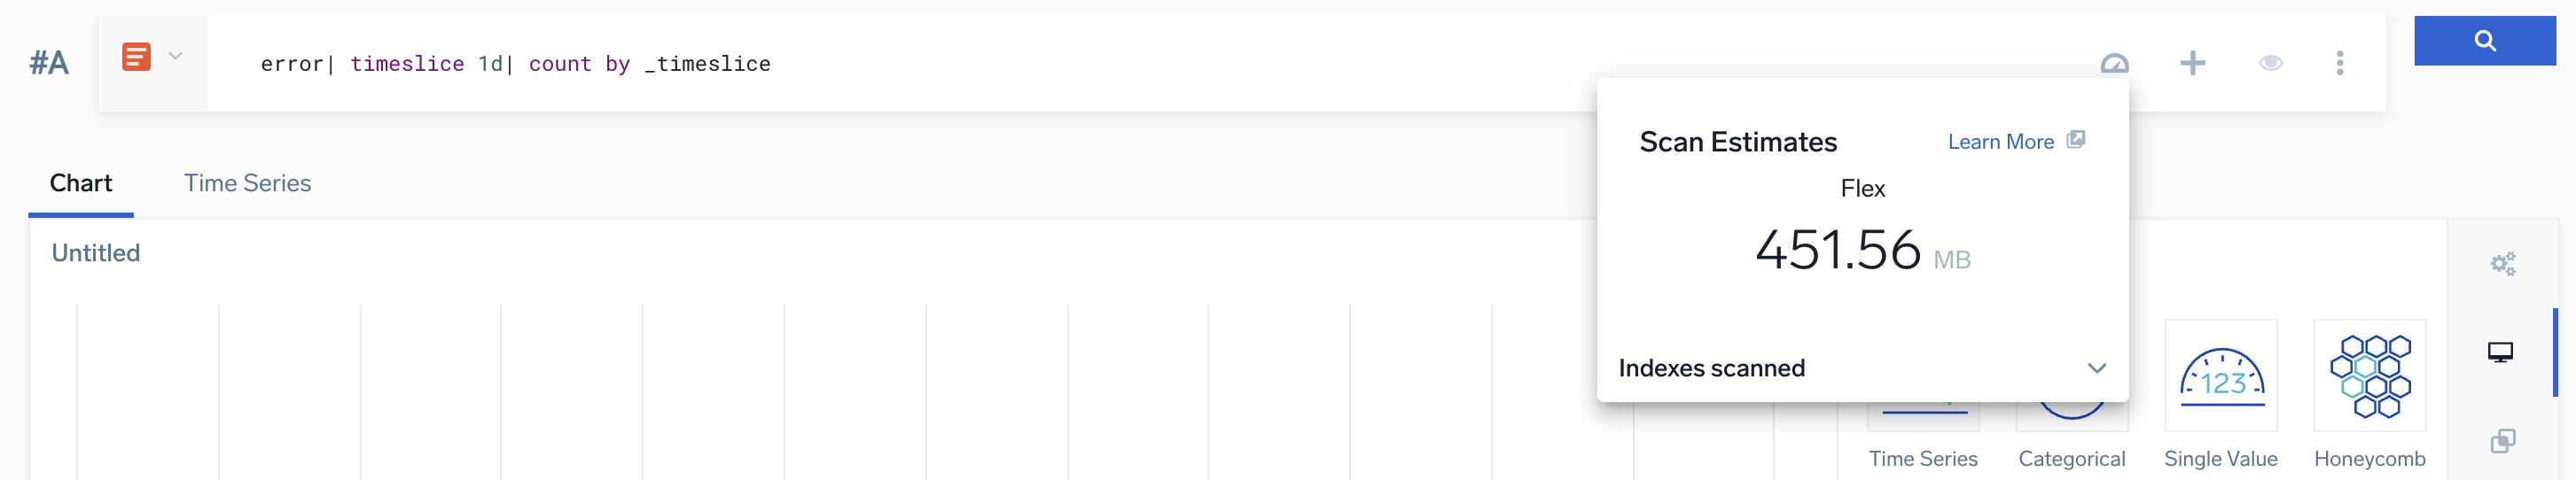
The example below shows the estimate of how much Flex data will be scanned for a query in the scope.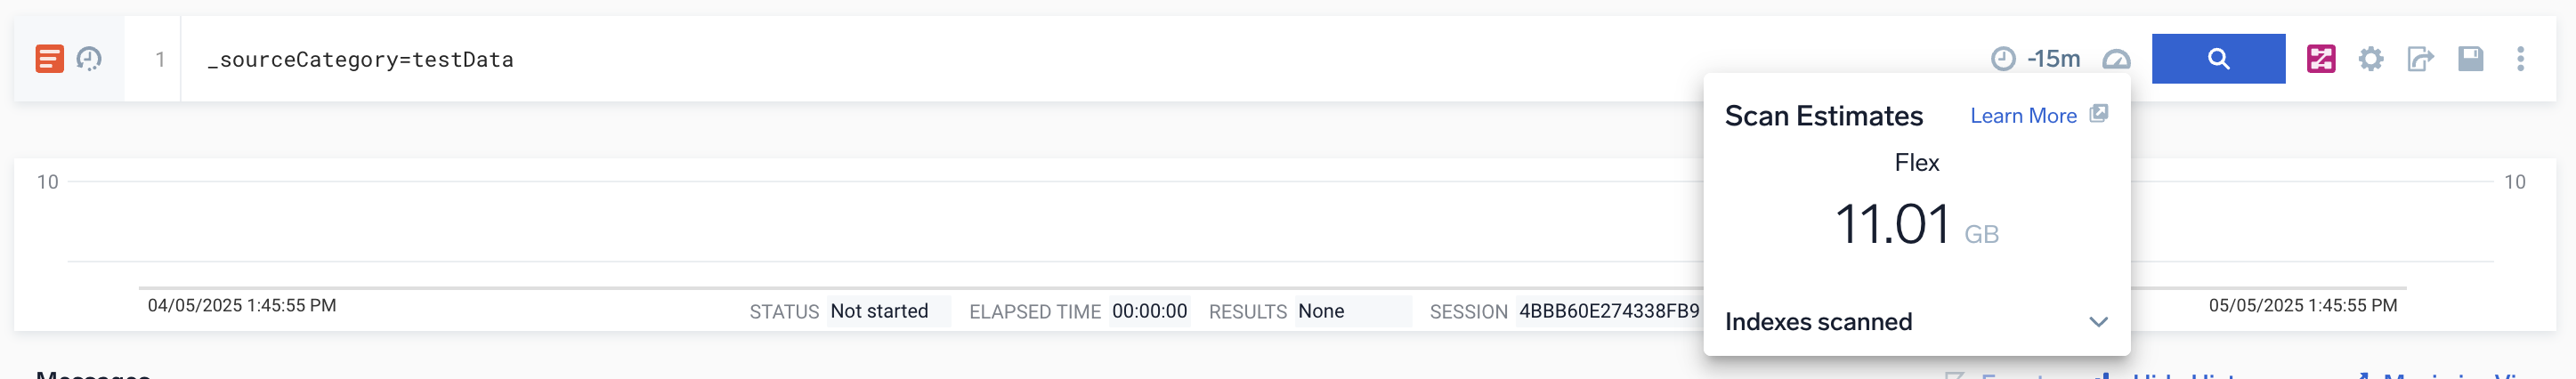
The Indexes Scanned dropdown in the Scan Estimates pop-up displays all indexes that were scanned for the entered log query, along with their corresponding estimate details.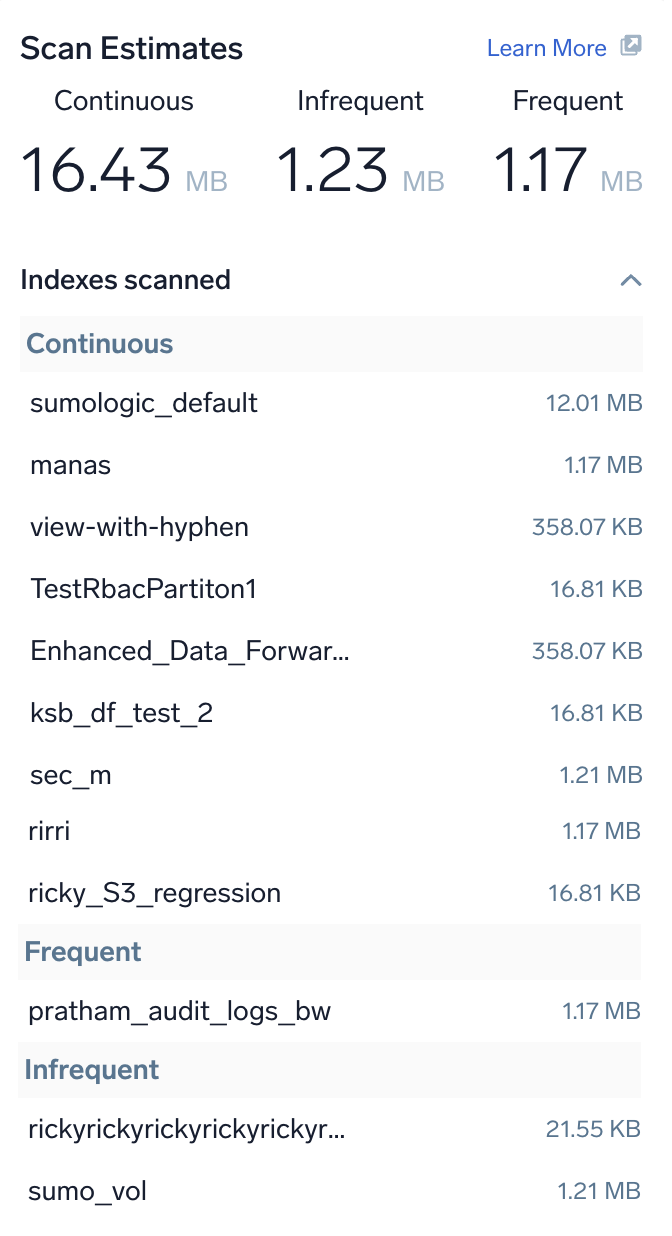
When you click on the session ID under the histogram, a popup with more detailed information appears. Here you can see the data scanned for a query in the scope.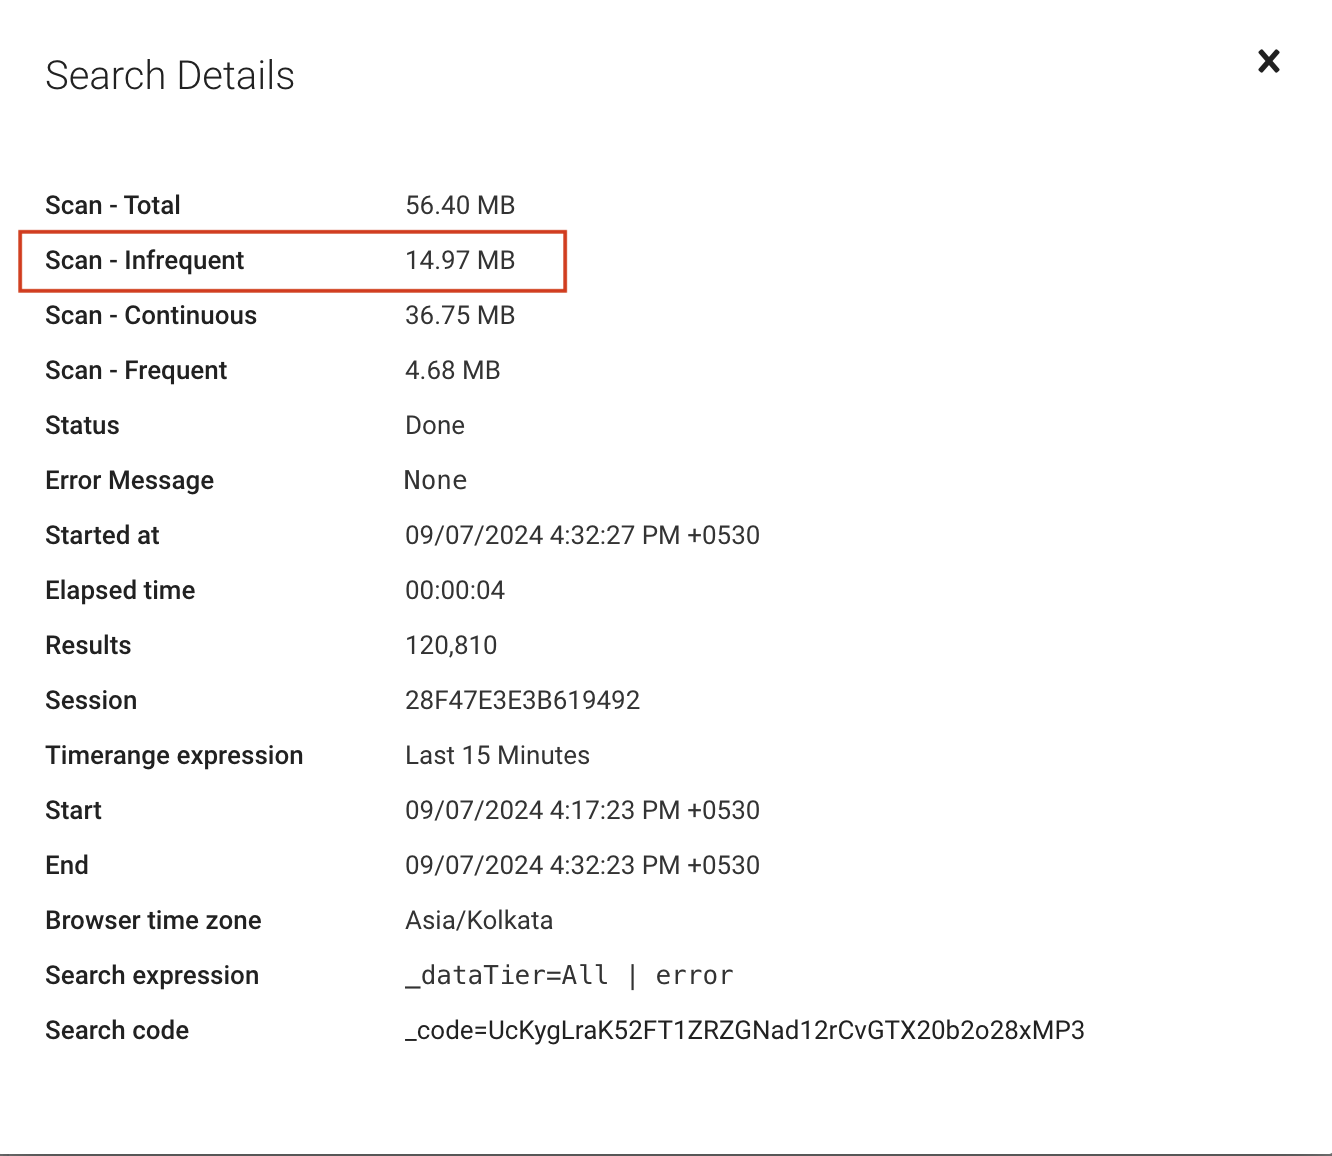
If there is no data in the selected tier or Flex, a warning message will be displayed in the Scan Estimates popup.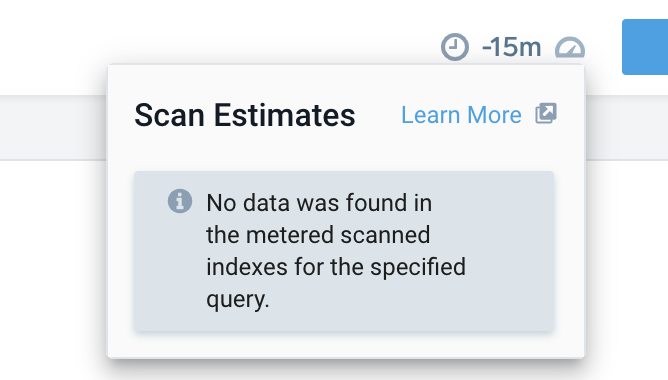
Dashboard scan estimates
When you enter a query to create a dashboard panel, Sumo Logic will estimate and display the amount of data scanned. You can view the scan detail by clicking the meter icon ![]() . A popup appears that displays the estimated scan data:
. A popup appears that displays the estimated scan data:
- For Data Tier mode:.
- For Flex model:
The Indexes Scanned dropdown in the Scan Estimates pop-up displays all indexes that were scanned for the entered dashboard query, along with their corresponding estimate details.
Monitors
When creating or modifying a monitor, you can view the Average scan, Daily scan, and Yearly scan data information based on the selected alert frequency by clicking the meter icon ![]() on top of the Monitor right side panel.
on top of the Monitor right side panel. 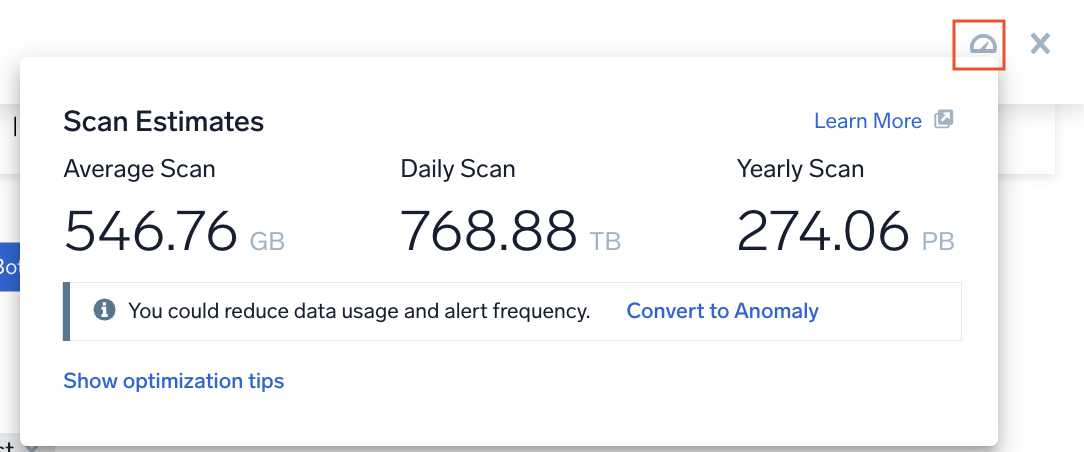
In addition, you can also see the Model training scan details for the anomaly detection method.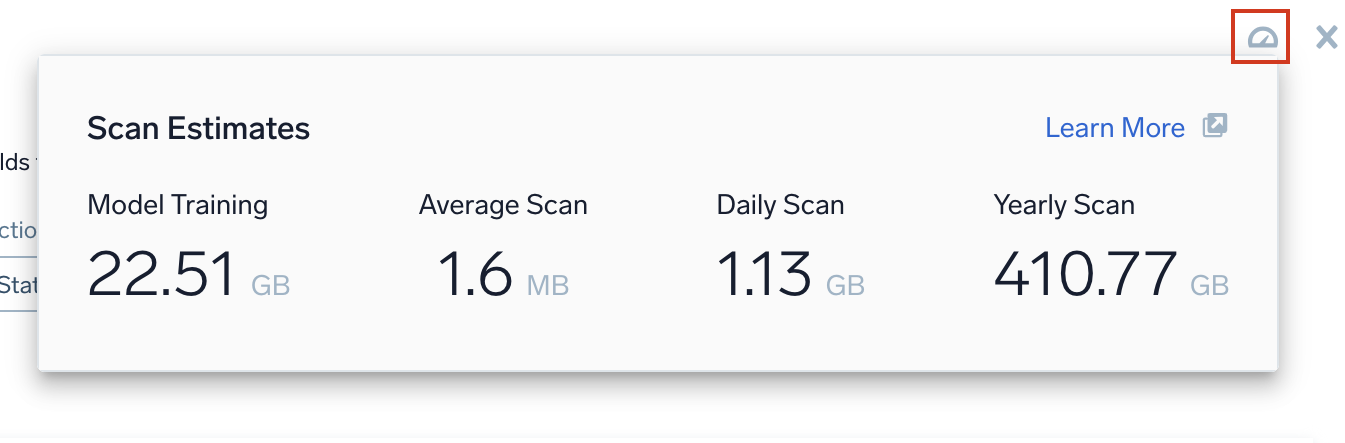
You can view the scan estimates data once you select the trigger type.
The Show Optimization Tips button displays contextual suggestions for your monitor settings. When clicked, it highlights both the query and trigger sections, displaying relevant optimization tips below each section. These tips are tailored based on whether you're configuring a static or outlier trigger.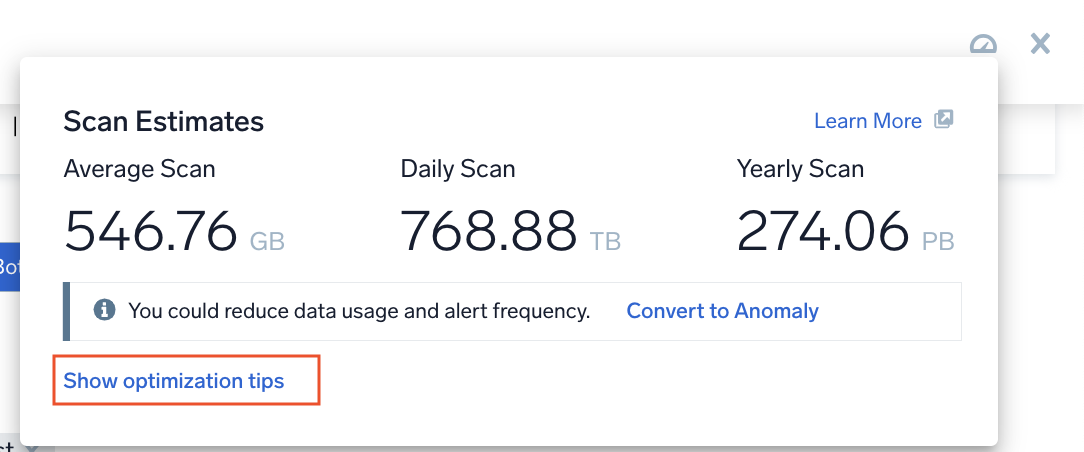
Scheduled searches
When creating or modifying a scheduled search, you can view the Average scan, Daily scan, and Yearly scanned data information based on the selected run frequency by clicking the meter icon ![]() on top of the Schedule this search popup.
on top of the Schedule this search popup. 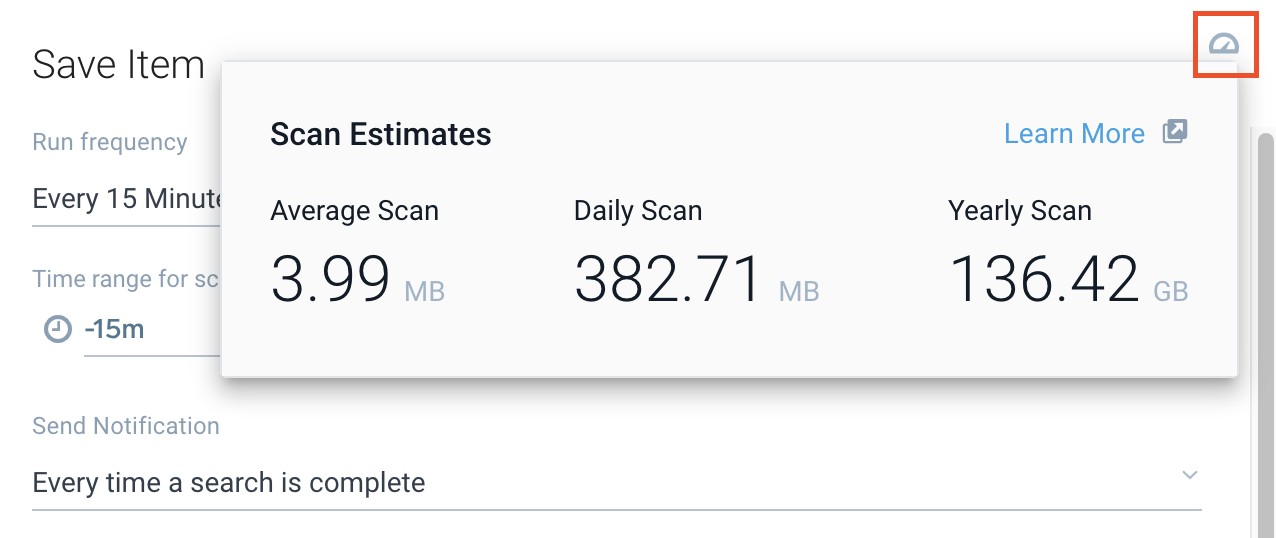
Daily scan data will not be available if scheduled search runs only on selected days and not daily.
Scan estimates in SLO
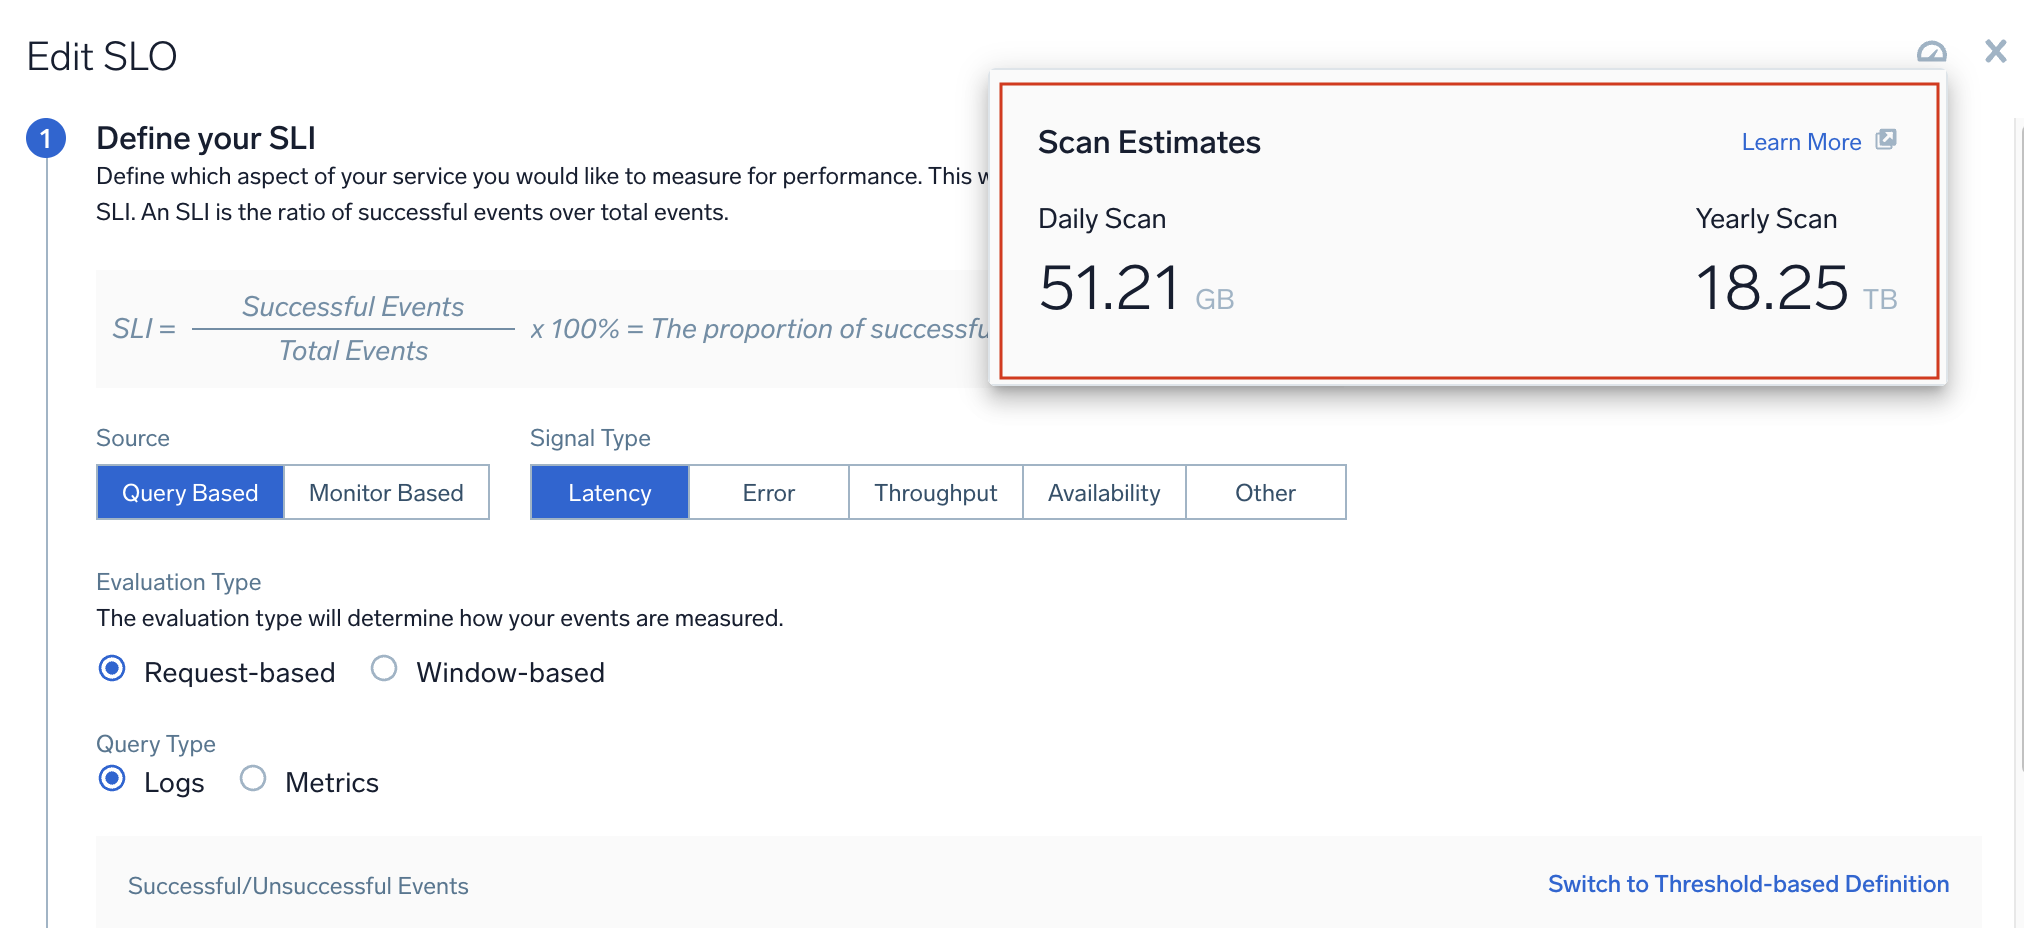
To view the Daily scan and Yearly scan data information based on a log-based SLO:
- Go to the Monitoring and click the SLO tab.
- Hover over your SLO, click the three-dot kebab menu, and then click Edit.
- Click the meter icon
 in the upper right corner.
- For Request-based SLOs, data is scanned once per minute and stored in SLO storage. Any late-arriving data is accounted for in a corrective fashion and appended to the SLO storage.
- For Window-based SLOs, data is scanned multiple times per minute. Due to technical reasons, late-arriving data cannot be accounted for, unlike request-based SLOs. Because of this, the SLO results are stored in SLO storage with some delay (typically 1 hour). To display up-to-date SLI values across our various SLO dashboards, we need to scan the last 1 hour of data multiple times.
Best practices
- Use the
_indexfield to reduce the scope of the query.