---
id: signals-ui
title: Signals UI
sidebar_label: Signals UI
description: Learn about the fields and tabs on the Cloud SIEM Signal details page.
slug: /help/docs/cse/records-signals-entities-insights/signals-ui/
canonical: https://www.sumologic.com/help/docs/cse/records-signals-entities-insights/signals-ui/
---
import useBaseUrl from '@docusaurus/useBaseUrl';
A **Signal** is generated when a rule’s conditions are met. The Signals page lists signals generated in the last 14 days by default, summarizing potential security threats. Each signal’s details page explains why it fired, the entity involved, its severity, and the records that triggered it. Not all signals indicate security incidents. For example, a user may legitimately log in from multiple devices or make several failed password attempts.
[**New UI**](/docs/get-started/sumo-logic-ui). In the main Sumo Logic menu, select **Cloud SIEM > Signals**. You can also click the Go To... menu at the top of the screen and select **Signals**.
[**Classic UI**](/docs/get-started/sumo-logic-ui-classic). Click **Signals** at the top of the screen.
 ## Signal details page
When you click into a signal, you'll have the option to see the complete details of the signal and the record that triggered it. This includes information like the IP address, geolocation, threat level, and other information that can aid you in your investigation.
 | Tab | Description |
|:--|:--|
| Details | The signal's metadata, the rule that generated it, and the records that triggered it. |
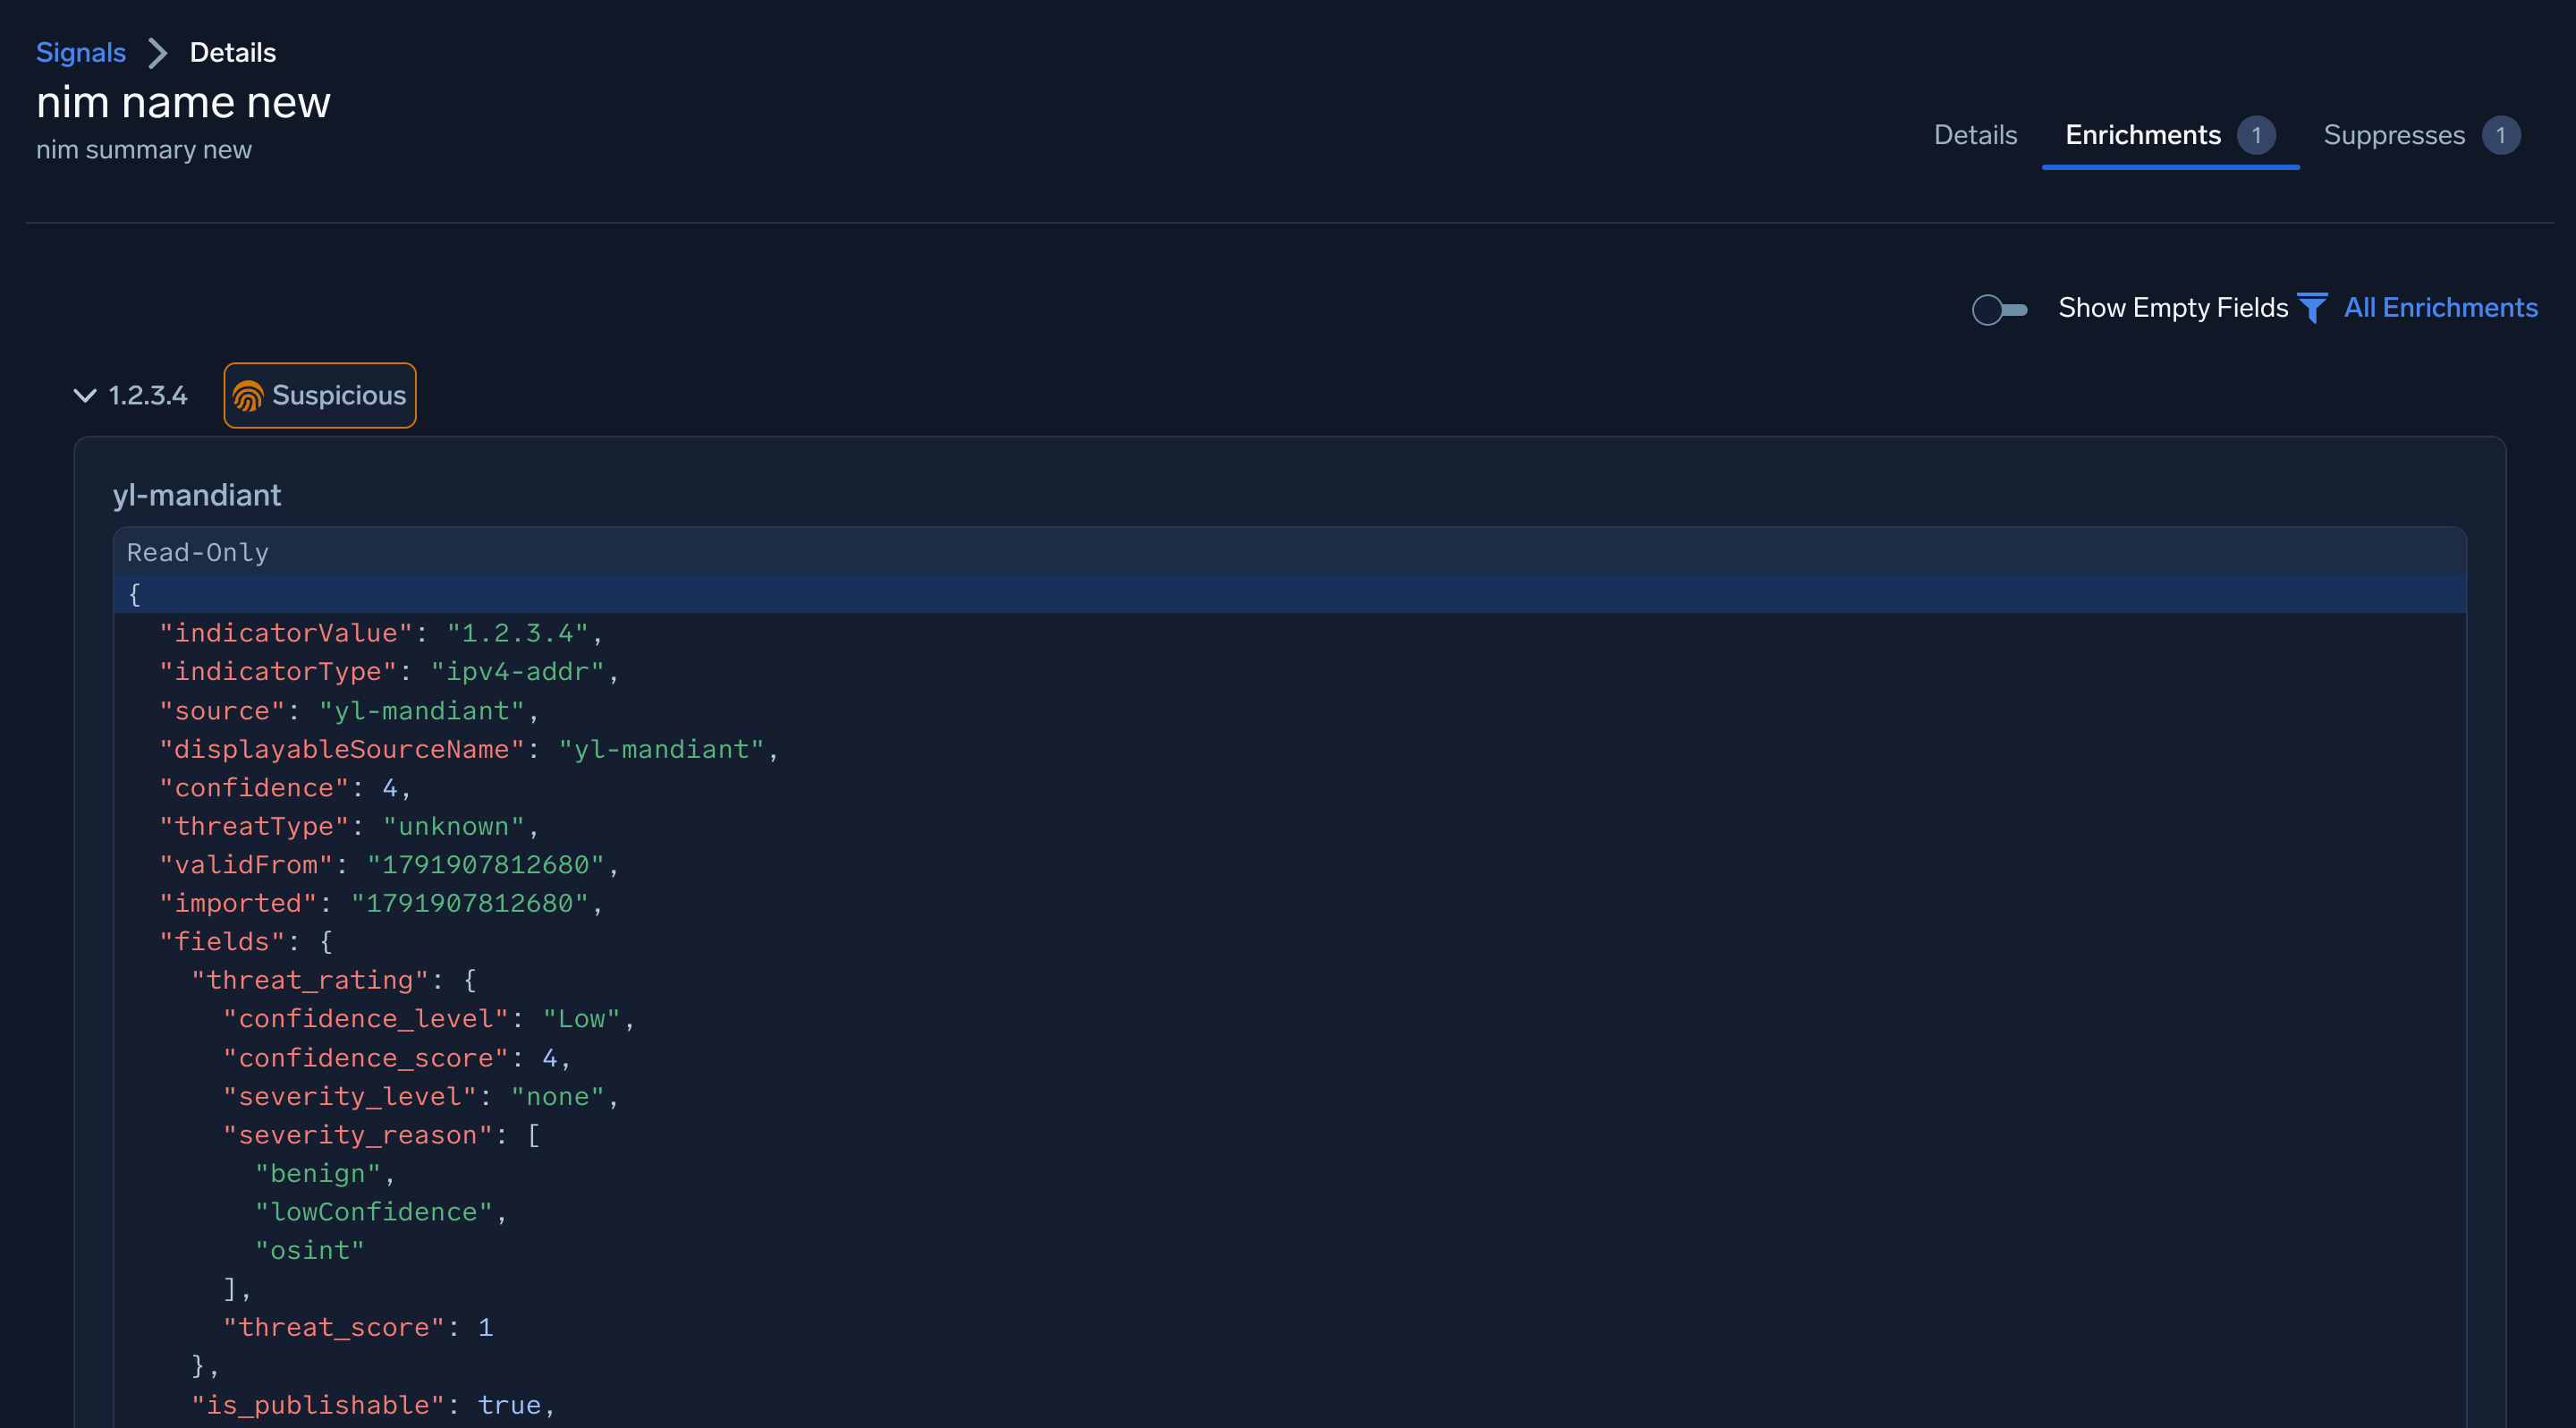
| Enrichments | Enrichment information for the signal's entity, such as threat intelligence indicator matches. The number next to the tab name is the number of enrichments. For more information, see [Enrichments and Indicators](/docs/cse/integrations/enrichments-and-indicators). |
| Suppresses | Signals suppressed by this signal. The number next to the tab name is the number of signals. For more information, see [Signal Suppression](/docs/cse/records-signals-entities-insights/about-signal-suppression). |
### Signal fields
The Details tab shows an overview about the signal.
| Field | Description | Example |
|:--|:--|:--|
| Name | The name of the signal, which comes from the rule's signal name setting. | Suspicious Login from Threat Intel IP. |
| Summary | A short summary of the signal, shown under the name. | Login from a known malicious IP address. |
| Description | The description of the rule that generated the signal. | Detects an inbound connection from an IP address that matches a threat intelligence indicator. |
| Metadata | The rule expression that was evaluated to generate the signal. The expression is read-only. Click the expand icon to view the whole expression. For information about writing expressions, see [Cloud SIEM Rules Syntax](/docs/cse/rules/cse-rules-syntax). | `hasThreatMatch([srcDevice_ip])` or `srcDevice_ip = '1.2.3.4'` |
| Event Time | The time that the event occurred, taken from the record that triggered the signal. Hover over the info icon for more information. | |
| Signal Created | The time that Cloud SIEM created the signal. This is usually later than the event time, because the record must be ingested and evaluated first. Hover over the info icon for more information. | |
| Severity | A score from 0 to 10 that indicates how serious the signal is, where 10 is the most severe. The severity is set by the rule, and can be adjusted by entity criticality. | |
| Rule | The name of the rule that generated the signal, and the type of rule (for example, **Match Rule**, **Threshold Rule**, **Chain Rule**, or **Aggregation Rule**). Click the rule name to view the rule. For more information, see [About Cloud SIEM Rules](/docs/cse/rules/about-cse-rules). | |
| Entity | The entity that the signal is about, with its entity type shown in parentheses. The entity can be an IP address, hostname, username, or other entity type. An icon next to the entity shows its reputation, for example Suspicious. Click the entity to open the [entity details panel](#entity-details-panel). For more information on entities, see [View and Manage Entities](/docs/cse/records-signals-entities-insights/view-manage-entities). |
| Related Insights | The insights that include this signal. If the signal isn't part of an insight, the page says so, and you can click **Create Insight** to create one. | |
| Suppressed By | Whether the signal was suppressed, and by which signal or rule. If the signal wasn't suppressed, the page says so. For more information, see [Signal Suppression](/docs/cse/records-signals-entities-insights/about-signal-suppression). | |
| Tags | Tags that are attached to the signal, such as MITRE ATT&CK tags. If the signal has no tags, the page shows None. | `_mitreAttackTactic:TA0011` |
### Records
The signal's records are listed below the signal fields. The heading shows the number of records, for example *1 Record*. The records continue to be associated with the signal for as long as the signal is available.
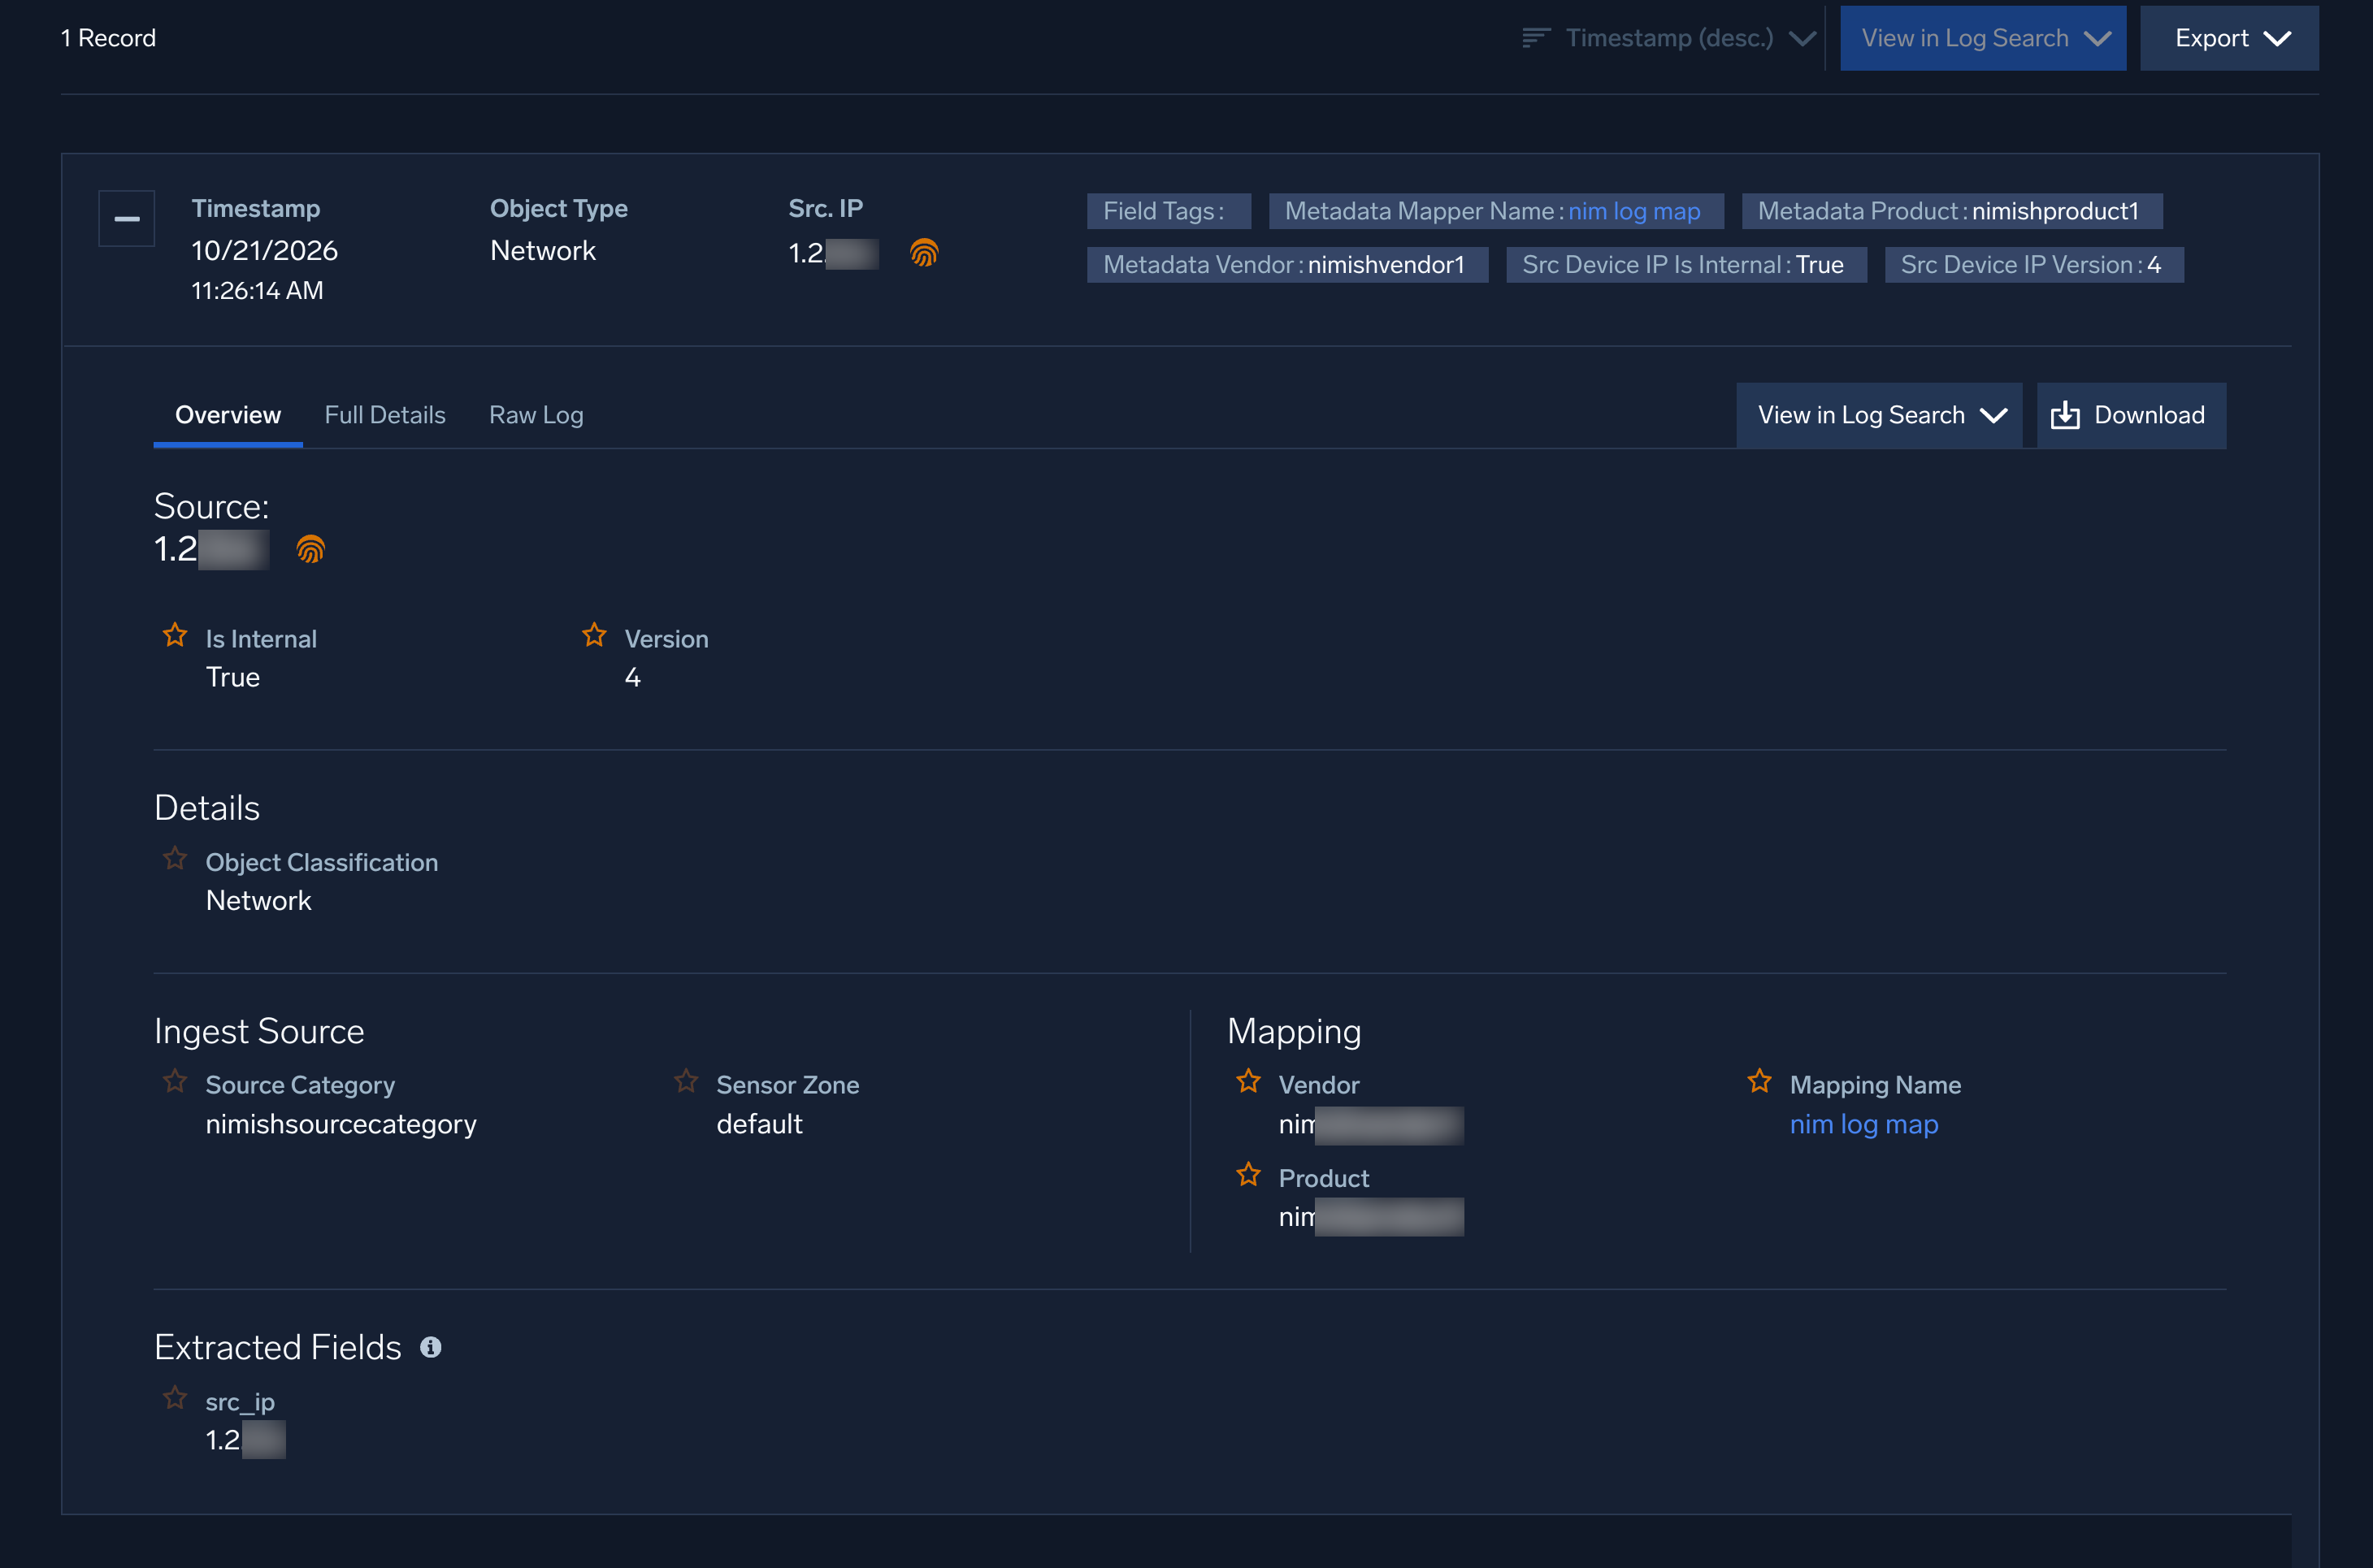 For more information on signal records, see [View Records for a Signal](/docs/cse/records-signals-entities-insights/view-records-signal/).
### Entity details panel
Click the entity in the Entity field to open the entity details panel on the right side of the page.
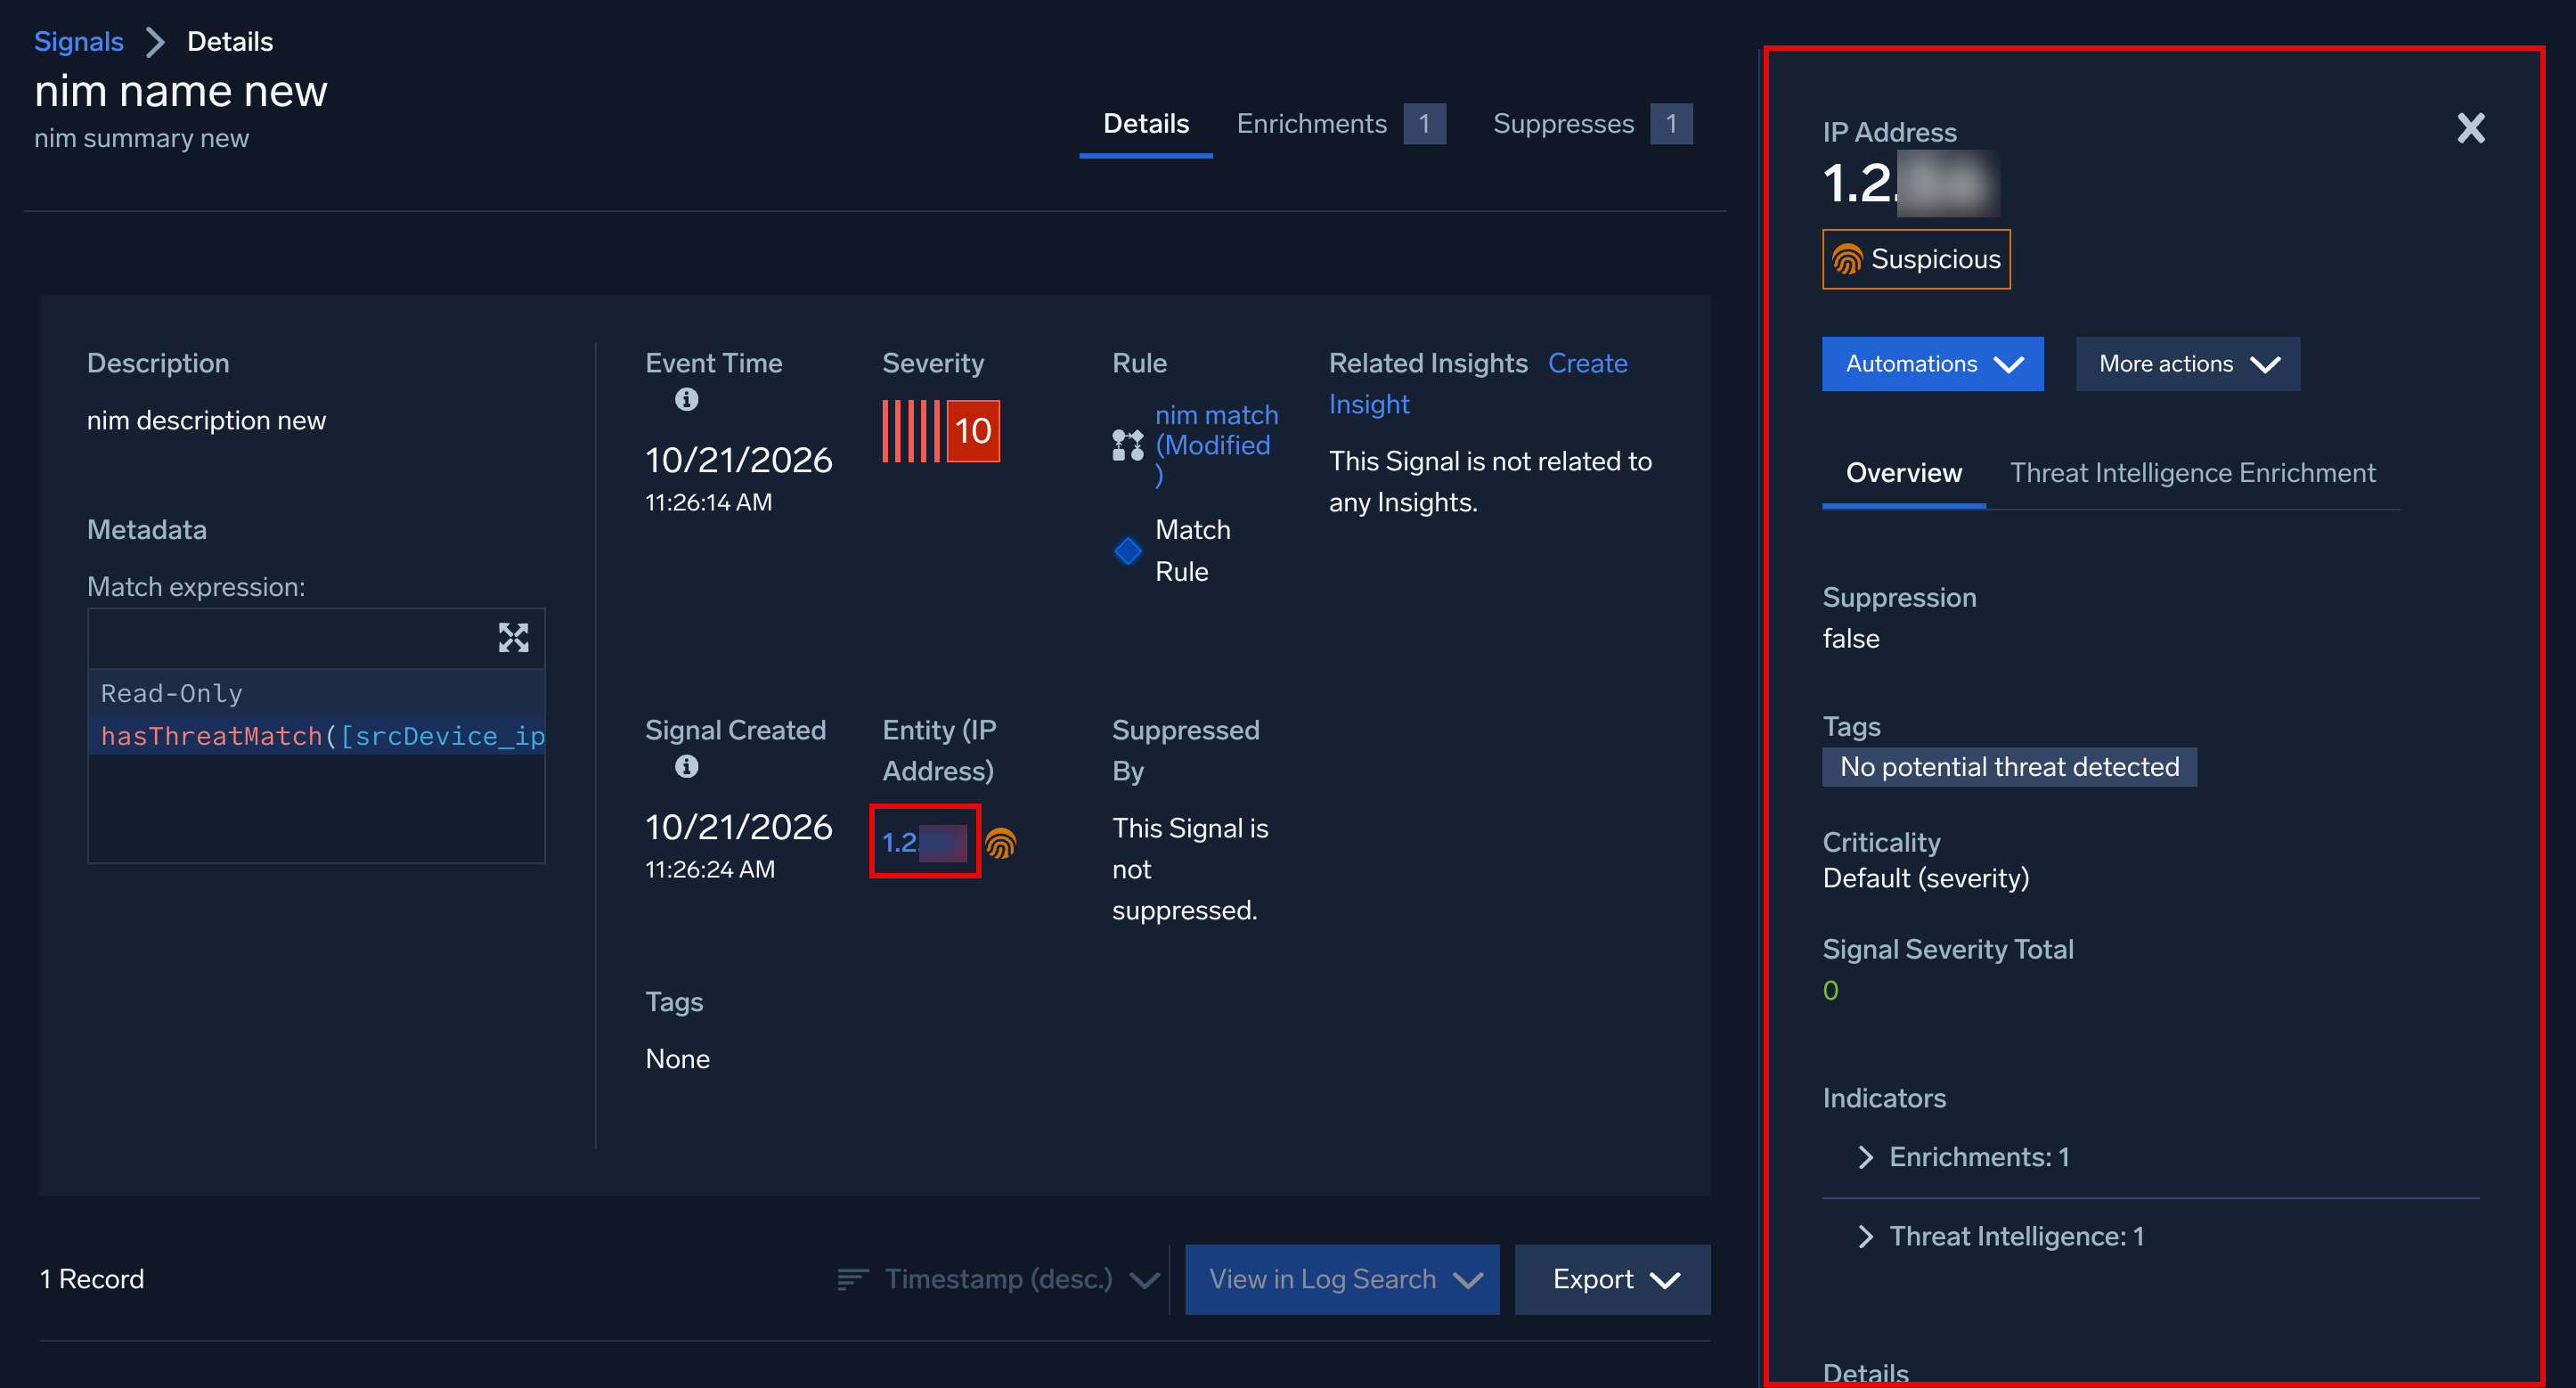 The panel shows the following details:
- Entity type and value.
- Reputation label. The entity's reputation, based on matches to [threat intelligence indicators](/docs/security/threat-intelligence/threat-indicators-in-cloud-siem#how-to-view-threat-indicator-labels-in-the-cloud-siem-ui). The label is **Malicious**, **Suspicious**, or **Not Flagged**. If there are multiple reputation values for an entity, the most severe is shown.
- **Automations**. A menu of [automations](/docs/cse/automation) that you can run on the entity.
- **More actions**
#### Overview
| Field| Description | Example |
|:--|:--|:--|
| Suppression | Whether signals for the entity are suppressed. | false |
| Tags | [Tags](/docs/cse/records-signals-entities-insights/tags-insights-signals-entities-rules) attached to the entity. | No potential threat detected |
| Criticality | The entity's criticality, which adjusts the severity of signals for the entity. Default (severity) means no custom criticality is set. | Default (severity) |
| Signal Severity Total | The total severity of the entity's signals. This value contributes to the entity's activity score for insight generation. | |
| Indicators | Expandable sections that list the indicators associated with the entity. | |
| Details | Expandable sections that list the metadata, network blocks, inventory, notes, and audit log details for the entity | |
| Recent Activity (14 days) | Expandable sections that list the number of signals and insights for the entity in the last 14 days. | |
#### Threat Intelligence Enrichment
Threat intelligence enrichment data is available in two locations:
- **Signals Details page**. View the threat intelligence enrichment data in the **Enrichments** tab, as shown below.
 - **Entity details panel**. View the threat intelligence enrichment details evaluated for the entity when the signal was created. This data is a snapshot and does not change if an indicator is later updated or expires.
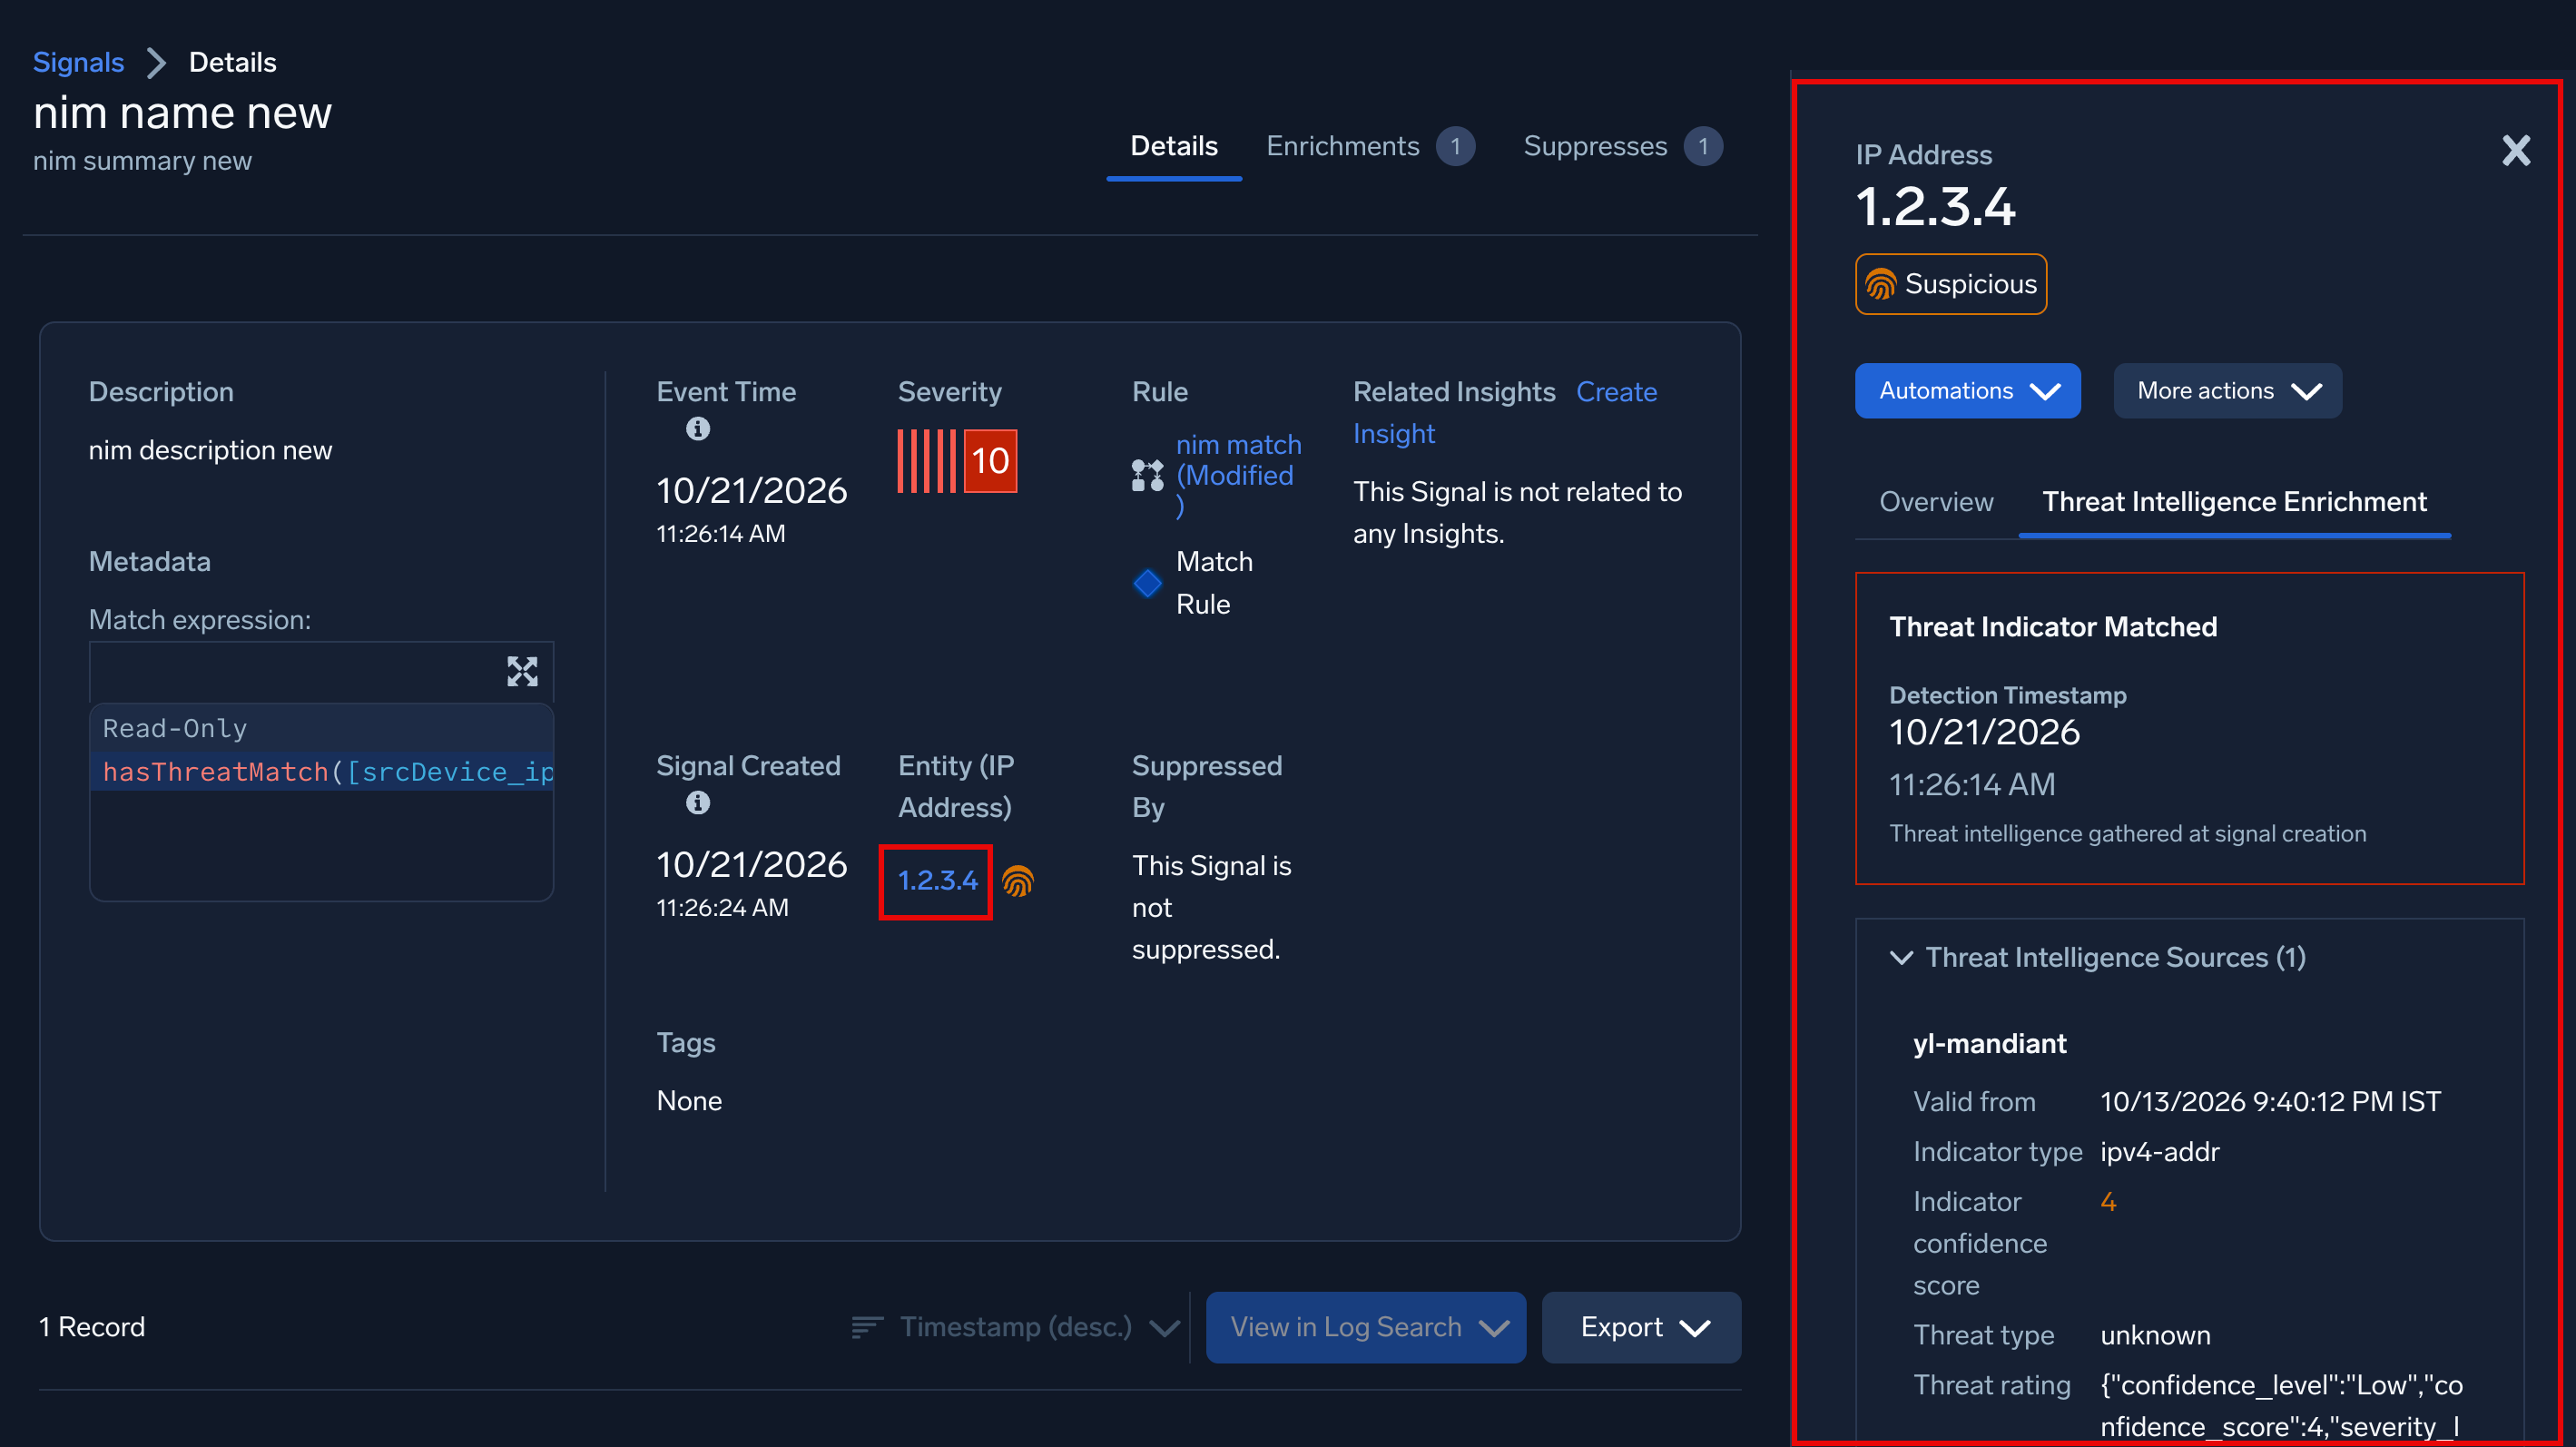 A banner at the top of the tab shows the result of the threat intelligence evaluation:
| Banner | When it appears |
|:--|:--|
| Threat Indicator Matched | Threat intelligence information for this entity was found and evaluated. The tab shows the detection timestamp and the matching threat intelligence sources. For more information, see [Threat Indicator Matched](#threat-indicator-matched) |
| No threat assessment conducted for this entity yet | Threat intelligence information for this entity has not been evaluated yet. |
| No indicator matched for this entity | A threat indicator matched a different entity in the signal, or threat intelligence information for this entity was not found. |
#### Threat Indicator Matched
When the banner shows `Threat Indicator Matched`, the tab populates the following fields:
- **Detection Timestamp**. The time that the match was detected.
- A caption under the timestamp that states when the threat intelligence was gathered. For example, threat intelligence gathered at signal creation.
- **Threat Intelligence Sources**. The threat intelligence sources that contain a matching indicator. The number in parentheses is the number of sources. Click a source to expand the indicator details, which include the following common fields:
- **Indicator value**. The value of the indicator, such as an IP address.
- **Indicator type**. The indicator type. For example, `ipv4-addr`.
- **Indicator confidence score**. The indicator's confidence score, from 0 to 100.
- **Source**. The source that provided the indicator. For example, `_sumo_global_feed_cs`.
- **Threat type**. The threat type assigned to the indicator. See [Threat type mapping to reputation](/docs/security/threat-intelligence/threat-indicators-in-cloud-siem#threat-type-mapping-to-reputation). For example, `malicious-activity`.
- **Actors**. The threat actors associated with the indicator. For example, `HELIXKITTEN`.
- **Valid from**. When the indicator became valid. For example, 10/13/2026 9:40:12 PM IST.
- **Valid until**. When the indicator expires.
Any other fields shown for a source are custom fields from the feed, displayed as key-value pairs as provided by the source. Common examples are **Threat rating**, **Mscore**, **Misp**, and **Sources**. You can filter on these fields in the `hasThreatMatch` function. See [Filter on custom fields](/docs/cse/rules/cse-rules-syntax/#filter-on-custom-fields).