---
id: elastic-container-service
title: Amazon ECS without Container Insights and Traces
sidebar_label: Amazon ECS without Container Insights and Traces
description: Provides preconfigured searches and Dashboards that allow you to monitor various metrics.
slug: /help/docs/integrations/amazon-aws/elastic-container-service/
canonical: https://www.sumologic.com/help/docs/integrations/amazon-aws/elastic-container-service/
---
import useBaseUrl from '@docusaurus/useBaseUrl';
}) Amazon Elastic Container Service (Amazon ECS) is a container management service that allows you to manage Docker containers on a cluster of Amazon EC2 instances. The Sumo Logic app for Amazon ECS provides preconfigured searches and Dashboards that allow you to monitor various metrics (CPU and Memory Utilization, CPU and Memory Reservation) across ECS clusters and services. The app also monitors API calls made by or on behalf of Amazon ECS in your AWS account.
We offer two different ECS versions, which have separate data collection steps:
* **[Collect Logs and Metrics for ECS](/docs/integrations/amazon-aws/elastic-container-service)**. This version collects [ECS CloudWatch Metrics](https://docs.aws.amazon.com/AmazonECS/latest/developerguide/available-metrics.html) and [ECS Events using AWS CloudTrail](https://docs.aws.amazon.com/AmazonECS/latest/developerguide/logging-using-cloudtrail.html#service-name-info-in-cloudtrail).
* **[Collect Logs, Metrics (Container Insights+CloudWatch) and Traces for ECS](https://docs.aws.amazon.com/AmazonECS/latest/developerguide/logging-using-cloudtrail.html)**. This version collects [ECS CloudWatch Metrics](https://docs.aws.amazon.com/AmazonECS/latest/developerguide/cloudwatch-metrics.html#available_cloudwatch_metrics), [Container Insights Metrics](https://docs.aws.amazon.com/AmazonCloudWatch/latest/monitoring/Container-Insights-metrics-ECS.html), [ECS Events using AWS CloudTrail](https://docs.aws.amazon.com/AmazonECS/latest/developerguide/logging-using-cloudtrail.html#service-name-info-in-cloudtrail), Application Logs and Traces. Metrics collected by Container Insights are charged as custom metrics. For more information about CloudWatch pricing, see[ Amazon CloudWatch Pricing](https://aws.amazon.com/cloudwatch/pricing/). This solution enables you to monitor both EC2 and Fargate based ECS deployments. For instructions on collecting this data, refer to the [Amazon Elastic Container Service (ECS) using Container Insights and CloudWatch](/docs/integrations/amazon-aws/elastic-container-service-container-insights-cloudwatch/).
This page has instructions for collecting logs and metrics for the Amazon ECS without Container Insights and Traces app. It uses the following data:
* CloudWatch Metrics
* AWS CloudTrail Events
### Sample log messages
Amazon Elastic Container Service (Amazon ECS) is a container management service that allows you to manage Docker containers on a cluster of Amazon EC2 instances. The Sumo Logic app for Amazon ECS provides preconfigured searches and Dashboards that allow you to monitor various metrics (CPU and Memory Utilization, CPU and Memory Reservation) across ECS clusters and services. The app also monitors API calls made by or on behalf of Amazon ECS in your AWS account.
We offer two different ECS versions, which have separate data collection steps:
* **[Collect Logs and Metrics for ECS](/docs/integrations/amazon-aws/elastic-container-service)**. This version collects [ECS CloudWatch Metrics](https://docs.aws.amazon.com/AmazonECS/latest/developerguide/available-metrics.html) and [ECS Events using AWS CloudTrail](https://docs.aws.amazon.com/AmazonECS/latest/developerguide/logging-using-cloudtrail.html#service-name-info-in-cloudtrail).
* **[Collect Logs, Metrics (Container Insights+CloudWatch) and Traces for ECS](https://docs.aws.amazon.com/AmazonECS/latest/developerguide/logging-using-cloudtrail.html)**. This version collects [ECS CloudWatch Metrics](https://docs.aws.amazon.com/AmazonECS/latest/developerguide/cloudwatch-metrics.html#available_cloudwatch_metrics), [Container Insights Metrics](https://docs.aws.amazon.com/AmazonCloudWatch/latest/monitoring/Container-Insights-metrics-ECS.html), [ECS Events using AWS CloudTrail](https://docs.aws.amazon.com/AmazonECS/latest/developerguide/logging-using-cloudtrail.html#service-name-info-in-cloudtrail), Application Logs and Traces. Metrics collected by Container Insights are charged as custom metrics. For more information about CloudWatch pricing, see[ Amazon CloudWatch Pricing](https://aws.amazon.com/cloudwatch/pricing/). This solution enables you to monitor both EC2 and Fargate based ECS deployments. For instructions on collecting this data, refer to the [Amazon Elastic Container Service (ECS) using Container Insights and CloudWatch](/docs/integrations/amazon-aws/elastic-container-service-container-insights-cloudwatch/).
This page has instructions for collecting logs and metrics for the Amazon ECS without Container Insights and Traces app. It uses the following data:
* CloudWatch Metrics
* AWS CloudTrail Events
### Sample log messages
Click to expand
```json
{
"eventVersion":"1.04",
"userIdentity":{
"type":"AssumedRole",
"principalId":"ADFDDDFF7FDF7GFFF2DF0:i-76vfa923",
"arn":"arn:aws:sts::435456556566:assumed-role/ecsInstanceRole/i-76vfa923",
"accountId":"435456556566",
"accessKeyId":"AOFGPJFIJFFOIJFIOJHF",
"sessionContext":{
"attributes":{
"mfaAuthenticated":"false",
"creationDate":"2017-10-02T20:08:54.107Z"
},
"sessionIssuer":{
"type":"Role",
"principalId":"ADFDDDFF7FDF7GFFF2DF0",
"arn":"arn:aws:iam::435456556566:role/ecsInstanceRole",
"accountId":"435456556566",
"userName":"kevin"
}
}
},
"eventTime":"2017-10-02T20:08:54.107Z",
"eventSource":"ecs.amazonaws.com",
"eventName":"RegisterTaskDefinition",
"awsRegion":"us-west-1",
"sourceIPAddress":"73.168.34.72",
"userAgent":"Amazon ECS Agent - v1.12.2 (ecda8a6) (+http://aws.amazon.com/ecs/)",
"requestParameters":{
"attributes":[
{
"name":"com.amazonaws.ecs.capability.privileged-container"
},
{
"name":"com.amazonaws.ecs.capability.docker-remote-api.1.17"
},
{
"name":"com.amazonaws.ecs.capability.docker-remote-api.1.18"
},
{
"name":"com.amazonaws.ecs.capability.docker-remote-api.1.19"
},
{
"name":"com.amazonaws.ecs.capability.docker-remote-api.1.20"
},
{
"name":"com.amazonaws.ecs.capability.docker-remote-api.1.21"
},
{
"name":"com.amazonaws.ecs.capability.docker-remote-api.1.22"
},
{
"name":"com.amazonaws.ecs.capability.logging-driver.json-file"
},
{
"name":"com.amazonaws.ecs.capability.logging-driver.syslog"
},
{
"name":"com.amazonaws.ecs.capability.logging-driver.awslogs"
},
{
"name":"com.amazonaws.ecs.capability.ecr-auth"
},
{
"name":"com.amazonaws.ecs.capability.task-iam-role"
},
{
"name":"com.amazonaws.ecs.capability.task-iam-role-network-host"
}
],
"totalResources":[
{
"type":"INTEGER",
"doubleValue":0.0,
"integerValue":1024,
"longValue":0,
"name":"CPU"
},
{
"type":"INTEGER",
"doubleValue":0.0,
"integerValue":995,
"longValue":0,
"name":"MEMORY"
},
{
"type":"STRINGSET",
"stringSetValue":[
"22",
"2375",
"2376",
"51678",
"51679"
],
"doubleValue":0.0,
"integerValue":0,
"longValue":0,
"name":"PORTS"
},
{
"type":"STRINGSET",
"stringSetValue":[ ],
"doubleValue":0.0,
"integerValue":0,
"longValue":0,
"name":"PORTS_UDP"
}
],
"instanceIdentityDocumentSignature":"pqWe1trtreertermhC6vz\nZ0e/ZyOVVKXOb0fiiouyuyturtyreuFaoghqQ0wWurXzcHb6CrtreyteV6hPM=",
"cluster":"graphite",
"instanceIdentityDocument":"{\n \"privateIp\" : \"10.0.1.83\",\n \"devpayProductCodes\" : null,\n \"availabilityZone\" : \"us-west-1c\",\n \"accountId\" : \"435456556566\",\n \"version\" : \"2010-08-31\",\n \"instanceId\" : \"i-76vfa923\",\n \"billingProducts\" : null,\n \"instanceType\" : \"t2.micro\",\n \"imageId\" : \"ami-444d0224\",\n \"pendingTime\" : \"2016-11-15T21:07:08Z\",\n \"architecture\" : \"x86_64\",\n \"kernelId\" : null,\n \"ramdiskId\" : null,\n \"region\" : \"us-west-1\"\n}"
},
"responseElements":{
"containerInstance":{
"versionInfo":{ },
"runningTasksCount":0,
"ec2InstanceId":"i-13dcar4566",
"remainingResources":[
{
"type":"INTEGER",
"doubleValue":0.0,
"integerValue":1024,
"longValue":0,
"name":"CPU"
},
{
"type":"INTEGER",
"doubleValue":0.0,
"integerValue":995,
"longValue":0,
"name":"MEMORY"
},
{
"type":"STRINGSET",
"stringSetValue":[
"22",
"2376",
"2375",
"51678",
"51679"
],
"doubleValue":0.0,
"integerValue":0,
"longValue":0,
"name":"PORTS"
},
{
"type":"STRINGSET",
"stringSetValue":[ ],
"doubleValue":0.0,
"integerValue":0,
"longValue":0,
"name":"PORTS_UDP"
}
],
"agentConnected":true,
"pendingTasksCount":0,
"registeredResources":[
{
"type":"INTEGER",
"doubleValue":0.0,
"integerValue":1024,
"longValue":0,
"name":"CPU"
},
{
"type":"INTEGER",
"doubleValue":0.0,
"integerValue":995,
"longValue":0,
"name":"MEMORY"
},
{
"type":"STRINGSET",
"stringSetValue":[
"22",
"2376",
"2375",
"51678",
"51679"
],
"doubleValue":0.0,
"integerValue":0,
"longValue":0,
"name":"PORTS"
},
{
"type":"STRINGSET",
"stringSetValue":[ ],
"doubleValue":0.0,
"integerValue":0,
"longValue":0,
"name":"PORTS_UDP"
}
],
"containerInstanceArn":"arn:aws:ecs:us-west-1:435456556566:container-instance/3f28c319-u9n2-1476-3d2n-b7c254fv411",
"attributes":[
{
"name":"com.amazonaws.ecs.capability.privileged-container"
},
{
"name":"com.amazonaws.ecs.capability.docker-remote-api.1.17"
},
{
"name":"com.amazonaws.ecs.capability.docker-remote-api.1.18"
},
{
"name":"com.amazonaws.ecs.capability.docker-remote-api.1.19"
},
{
"name":"com.amazonaws.ecs.capability.docker-remote-api.1.20"
},
{
"name":"com.amazonaws.ecs.capability.docker-remote-api.1.21"
},
{
"name":"com.amazonaws.ecs.capability.docker-remote-api.1.22"
},
{
"name":"com.amazonaws.ecs.capability.logging-driver.json-file"
},
{
"name":"com.amazonaws.ecs.capability.logging-driver.syslog"
},
{
"name":"com.amazonaws.ecs.capability.logging-driver.awslogs"
},
{
"name":"com.amazonaws.ecs.capability.ecr-auth"
},
{
"name":"com.amazonaws.ecs.capability.task-iam-role"
},
{
"name":"com.amazonaws.ecs.capability.task-iam-role-network-host"
}
],
"status":"ACTIVE",
"version":1
}
},
"requestID":"ae86b372-ab77-11e6-824c-c7c4220f0423",
"eventID":"ff9fc985-1fbe-4717-965b-607dda32f620",
"eventType":"AwsApiCall",
"recipientAccountId":"435456556566"
}
```
### Sample queries
```sumo title="Deleted Resources Over Time"
_sourceCategory=ecs* (DeleteCluster or DeleteService or DeregisterContainerInstance or DeregisterTaskDefinition or StopTask) and !(InternalFailure)
| json "eventName" as event_name
| parse "\"userName\":\"*\"" as user
| parse "\"awsRegion\":\"*\"" as region
| parse "\"cluster\":\"*\"" as cluster
| timeslice 1h
| parse regex field=event_name "^(?:Delete|Deregister|Stop)(?[A-Z][A-Za-z]+)"
| count by resource_type, _timeslice
| transpose row _timeslice column resource_type
```
## Creating Fields in Field Schema
1. [**New UI**](/docs/get-started/sumo-logic-ui). In the main Sumo Logic menu select **Data Management**, and then under **Logs** select **Fields**. You can also click the **Go To...** menu at the top of the screen and select **Fields**.
[**Classic UI**](/docs/get-started/sumo-logic-ui-classic). In the main Sumo Logic menu, select **Manage Data > Logs > Fields**.
1. Search for the following fields: `account`, `namespace`, `region` field.
1. If not present, create it. Learn how to create and manage fields [here](/docs/manage/fields).
## Creating Field Extraction Rule(s)
Create a Field Extraction Rule for CloudTrail Logs ([learn more](/docs/manage/field-extractions/create-field-extraction-rule)).
```sql
Rule Name: AwsObservabilityECSCloudTrailLogsFER
Applied at: Ingest Time
Scope (Specific Data):
account=* eventname eventsource "ecs.amazonaws.com"
Parse Expression:
| json "eventSource", "awsRegion", "requestParameters.tableName", "recipientAccountId" as eventSource, region, tablename, accountid nodrop
| where eventSource = "ecs.amazonaws.com"
| "aws/ecs" as namespace
| fields region, namespace, accountid
```
## Collect Logs and Metrics for Amazon ECS
This section has instructions for collecting logs and metrics for the Amazon ECS app.
### Collect Metrics for Amazon ECS
1. Sumo Logic supports collecting metrics using two source types:
* Configure an [AWS Kinesis Firehose for Metrics Source](/docs/send-data/hosted-collectors/amazon-aws/aws-kinesis-firehose-metrics-source) (recommended) or
* Configure an [Amazon CloudWatch Source for Metrics](/docs/send-data/hosted-collectors/amazon-aws/amazon-cloudwatch-source-metrics)
:::note
Amazon ECS metrics use the AWS/ECS namespace
:::
1. **Metadata**. Click the **+Add Field** link to add custom log metadata [fields](/docs/manage/fields). Define the fields you want to associate, each field needs a name (key) and value.
1. Add an **account** field and assign it a value which is a friendly name / alias to your AWS account from which you are collecting logs. Logs can be queried via the “account field”.
}) 1. Keep in mind:
*
1. Keep in mind:
* }) A green circle with a check mark is shown when the field exists and is enabled in the Fields table schema.
*
A green circle with a check mark is shown when the field exists and is enabled in the Fields table schema.
* }) An orange triangle with an exclamation point is shown when the field doesn't exist, or is disabled in the Fields table schema. In this case, you'll see an option to automatically add or enable the nonexistent fields to the Fields table schema. If a field is sent to Sumo Logic but isn’t present or enabled in the schema, it’s ignored and marked as **Dropped**.
### Collect ECS events using CloudTrail
1. Configure a [AWS CloudTrail Logs Source](/docs/send-data/hosted-collectors/amazon-aws/aws-cloudtrail-source/).
1. **Metadata**. Click the **+Add Field** link to add custom log metadata [Fields](/docs/manage/fields). Define the fields you want to associate, each field needs a name (key) and value.
1. Add an **account** field and assign it a value which is a friendly name / alias to your AWS account from which you are collecting logs. Logs can be queried via the “account field”.
1. Keep in mind:
* A green circle with a check mark is shown when the field exists and is enabled in the Fields table schema.
* An orange triangle with an exclamation point is shown when the field doesn't exist, or is disabled in the Fields table schema. In this case, you'll see an option to automatically add or enable the nonexistent fields to the Fields table schema. If a field is sent to Sumo Logic but isn’t present or enabled in the schema, it’s ignored and marked as **Dropped**.
## Installing the Amazon ECS app
Now that you have set up collection for Amazon ECS, install the Sumo Logic app for Amazon ECS to use the pre-configured searches and dashboards that provide visibility into your environment for real-time analysis of overall usage.
import AppInstall from '../../reuse/apps/app-install.md';
## Viewing the Amazon ECS app dashboards
import ViewDashboards from '../../reuse/apps/view-dashboards.md';
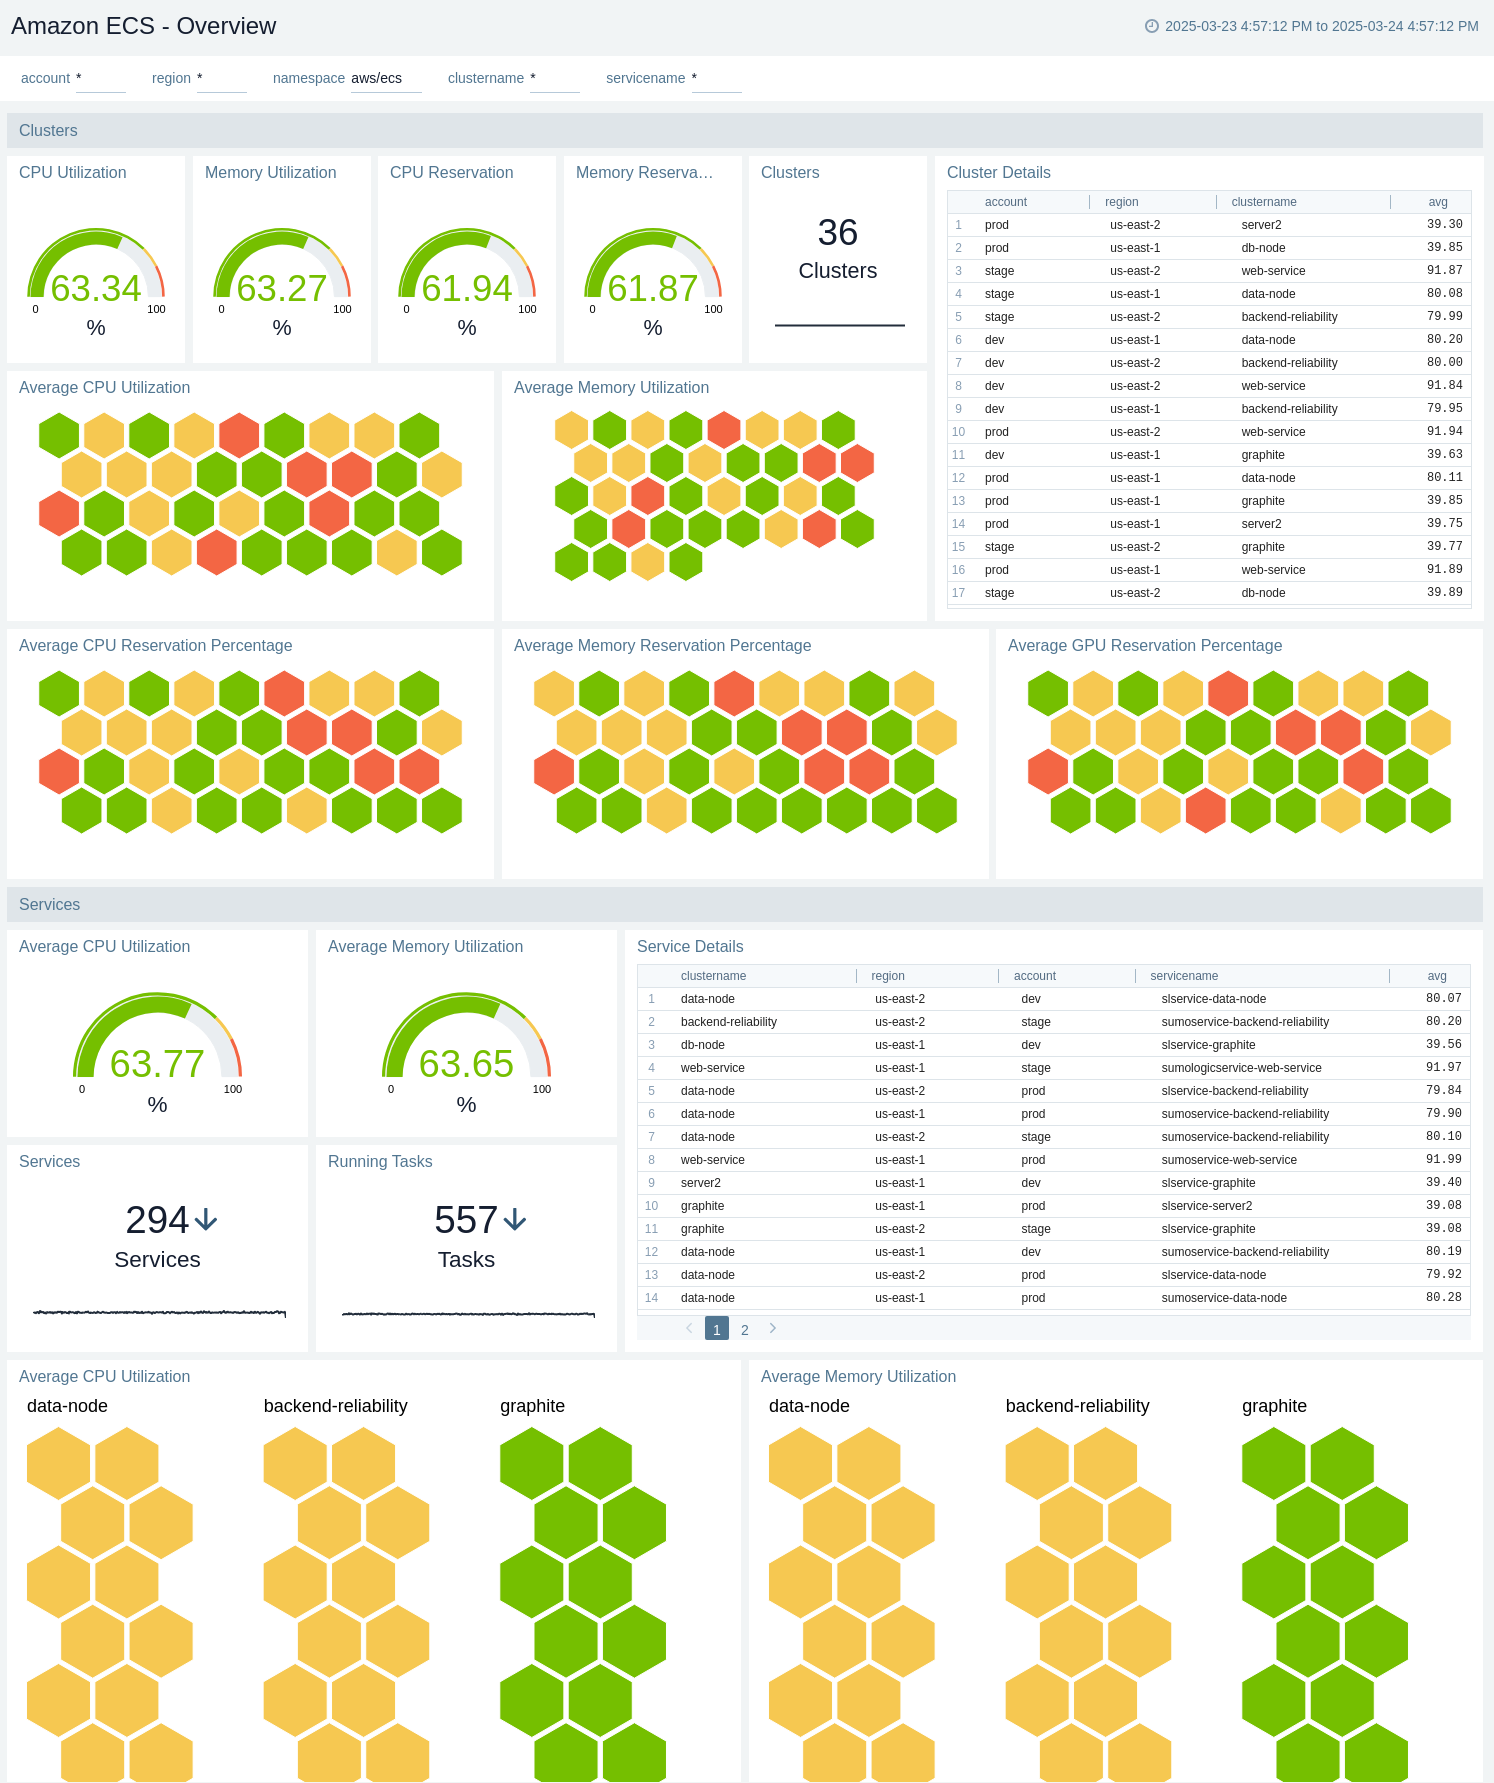
### Overview
The **Amazon ECS - Overview** dashboard provides an overview of CPU and memory utilization across all your ECS clusters and services. You can determine which services are high in utilization and accordingly make decisions for the ECS deployment.
Use this dashboard to:
* Quickly determine resource utilization across all your ECS clusters and services so as to provision more capacity or optimize on cost.
* Get a quick snapshot of overall ECS cluster health, including CPU and memory utilization and reservation levels.
* Identify clusters or services with unusually high or low resource usage or reservation percentages.
* View details of individual clusters and services, including their regions and associated accounts.
An orange triangle with an exclamation point is shown when the field doesn't exist, or is disabled in the Fields table schema. In this case, you'll see an option to automatically add or enable the nonexistent fields to the Fields table schema. If a field is sent to Sumo Logic but isn’t present or enabled in the schema, it’s ignored and marked as **Dropped**.
### Collect ECS events using CloudTrail
1. Configure a [AWS CloudTrail Logs Source](/docs/send-data/hosted-collectors/amazon-aws/aws-cloudtrail-source/).
1. **Metadata**. Click the **+Add Field** link to add custom log metadata [Fields](/docs/manage/fields). Define the fields you want to associate, each field needs a name (key) and value.
1. Add an **account** field and assign it a value which is a friendly name / alias to your AWS account from which you are collecting logs. Logs can be queried via the “account field”.
1. Keep in mind:
* A green circle with a check mark is shown when the field exists and is enabled in the Fields table schema.
* An orange triangle with an exclamation point is shown when the field doesn't exist, or is disabled in the Fields table schema. In this case, you'll see an option to automatically add or enable the nonexistent fields to the Fields table schema. If a field is sent to Sumo Logic but isn’t present or enabled in the schema, it’s ignored and marked as **Dropped**.
## Installing the Amazon ECS app
Now that you have set up collection for Amazon ECS, install the Sumo Logic app for Amazon ECS to use the pre-configured searches and dashboards that provide visibility into your environment for real-time analysis of overall usage.
import AppInstall from '../../reuse/apps/app-install.md';
## Viewing the Amazon ECS app dashboards
import ViewDashboards from '../../reuse/apps/view-dashboards.md';
### Overview
The **Amazon ECS - Overview** dashboard provides an overview of CPU and memory utilization across all your ECS clusters and services. You can determine which services are high in utilization and accordingly make decisions for the ECS deployment.
Use this dashboard to:
* Quickly determine resource utilization across all your ECS clusters and services so as to provision more capacity or optimize on cost.
* Get a quick snapshot of overall ECS cluster health, including CPU and memory utilization and reservation levels.
* Identify clusters or services with unusually high or low resource usage or reservation percentages.
* View details of individual clusters and services, including their regions and associated accounts.
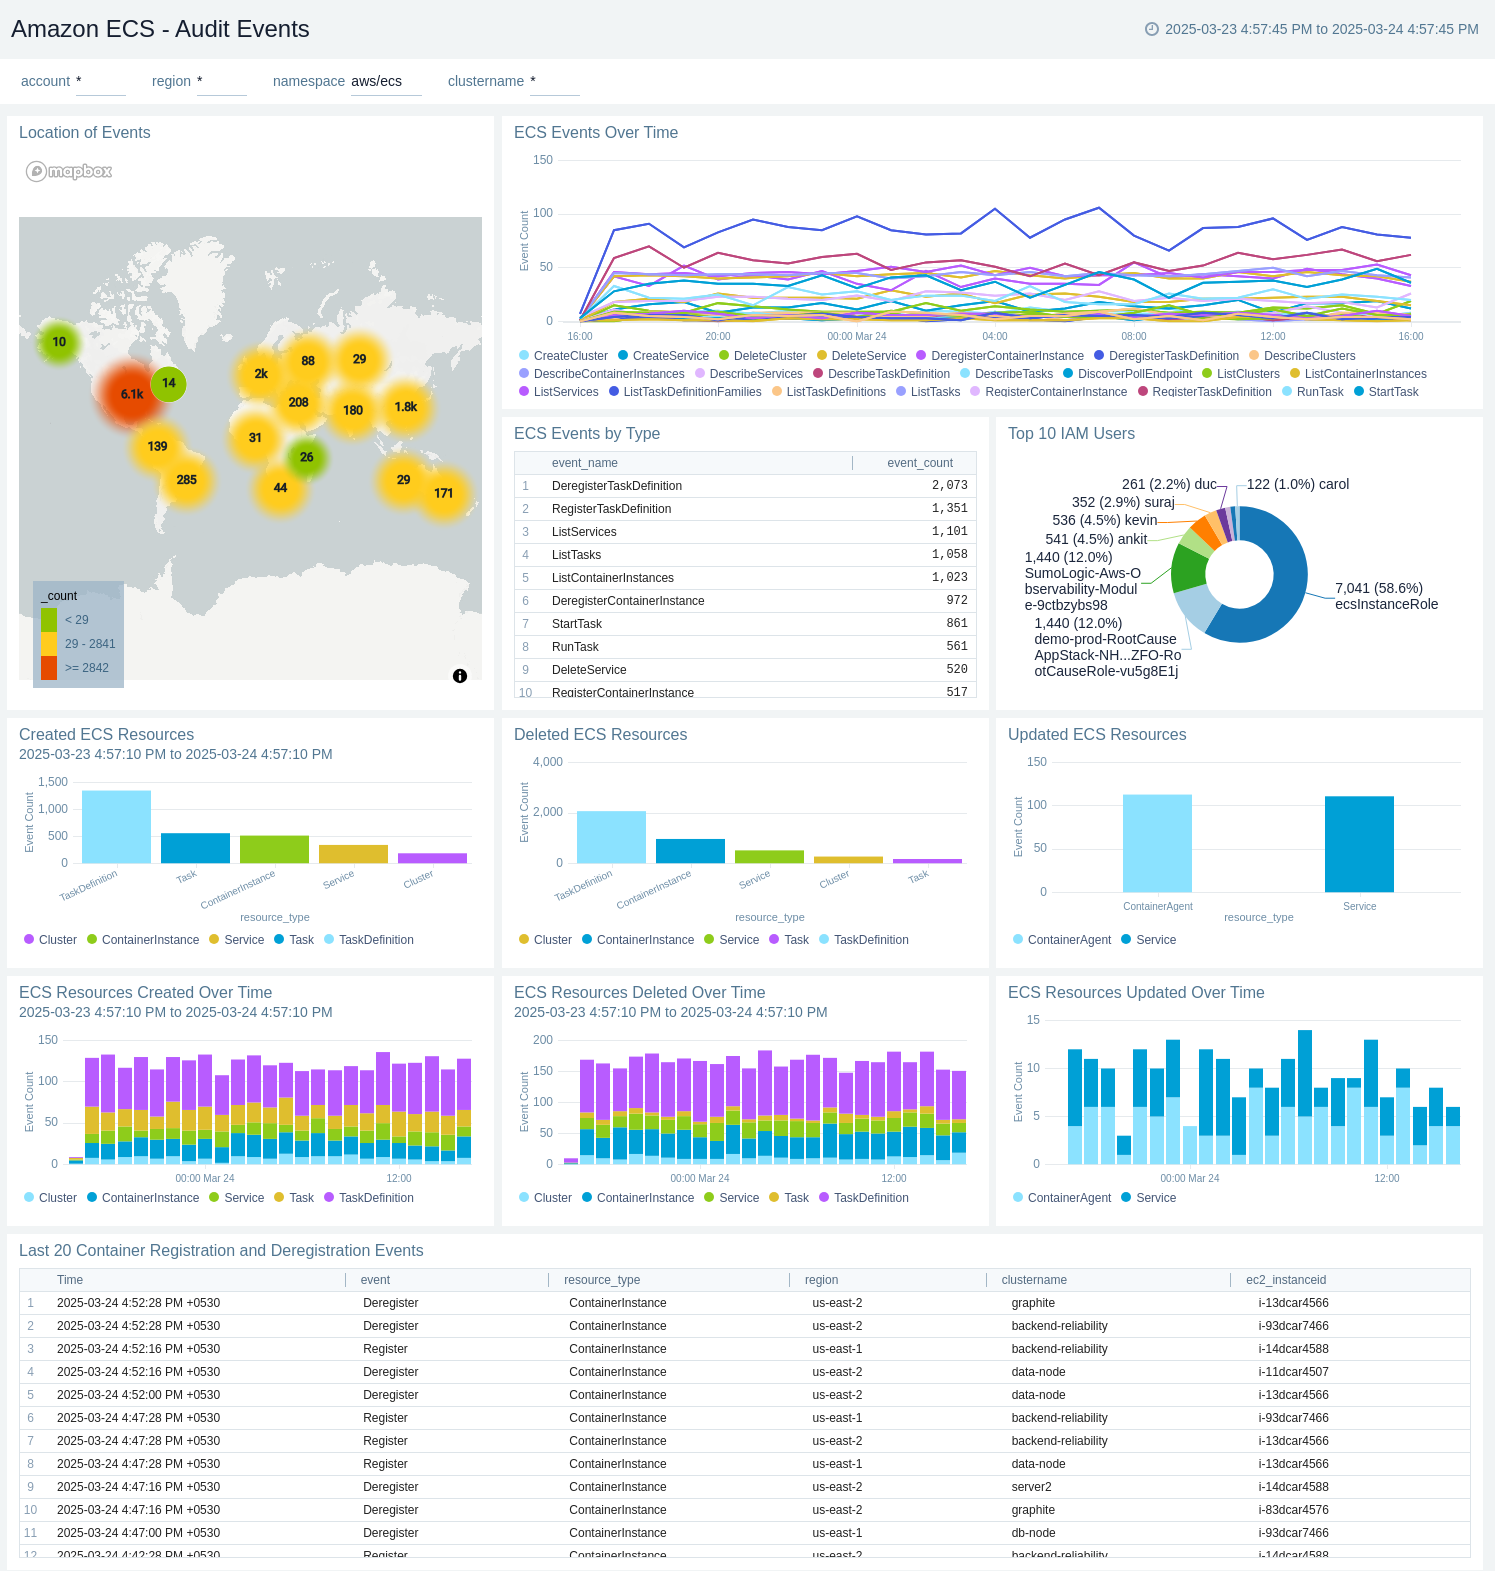
 ### Audit Events
The **Amazon ECS - Audit Events** dashboard provides insights into changes to your ECS environment including top IAM users, locations of events. The dashboard also shows the created, updated, and deleted events with respect to time, along with the details for the top 10 AWS Identity and Access Management users, and the last 20 Container Registration and Deregistration Events.
Use this dashboard to:
* Quickly identify all changes to your ECS environment.
* Monitor locations from which changes are being made locations.
* Examine details and trends for created, updated and deleted ECS resources.
* Investigate specific container registration and deregistration events in different regions and clusters.
### Audit Events
The **Amazon ECS - Audit Events** dashboard provides insights into changes to your ECS environment including top IAM users, locations of events. The dashboard also shows the created, updated, and deleted events with respect to time, along with the details for the top 10 AWS Identity and Access Management users, and the last 20 Container Registration and Deregistration Events.
Use this dashboard to:
* Quickly identify all changes to your ECS environment.
* Monitor locations from which changes are being made locations.
* Examine details and trends for created, updated and deleted ECS resources.
* Investigate specific container registration and deregistration events in different regions and clusters.
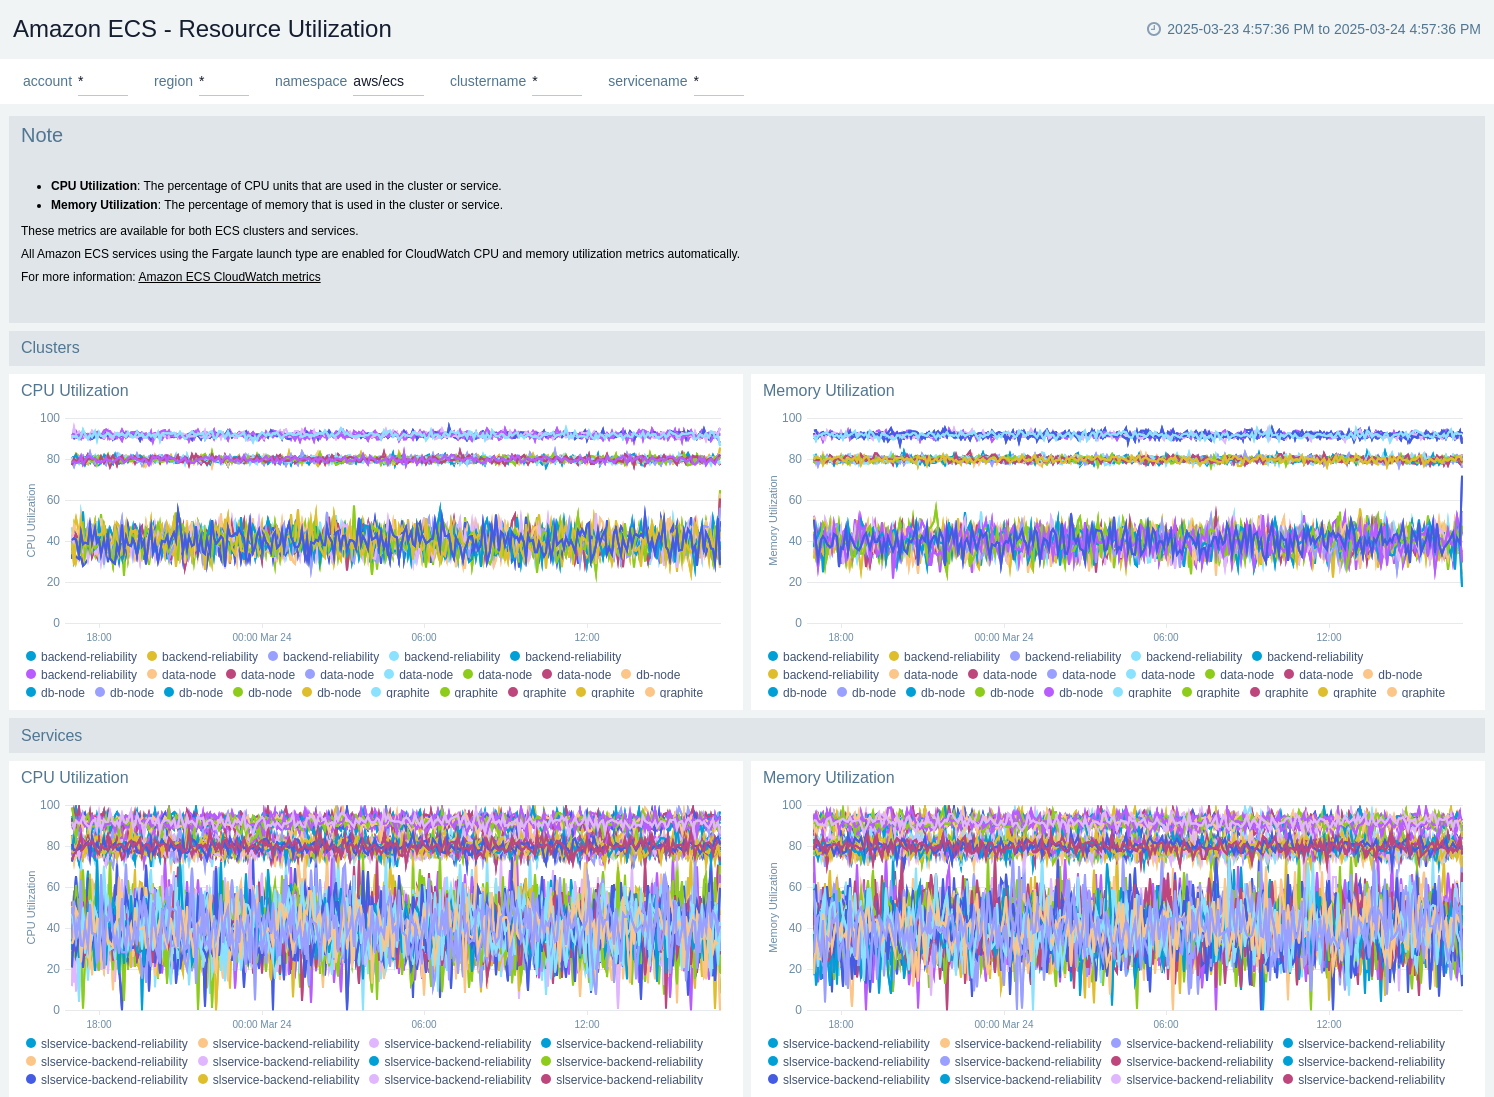
 ### Resource Utilization
The **Amazon ECS - Resource Utilization** dashboard provides trends around CPU and Memory utilization for clusters and services.
* Cluster CPU or Cluster memory utilization metrics are only used for tasks using the EC2 launch type.
* Service CPU or service memory utilization metrics are used for tasks using both the Fargate and the EC2 launch type.
Use this dashboard to:
* Monitor real-time CPU and memory usage across your ECS clusters and services.
* Identify performance bottlenecks or underutilized resources in your ECS environment.
* Compare utilization patterns between clusters and individual services to optimize resource allocation.
### Resource Utilization
The **Amazon ECS - Resource Utilization** dashboard provides trends around CPU and Memory utilization for clusters and services.
* Cluster CPU or Cluster memory utilization metrics are only used for tasks using the EC2 launch type.
* Service CPU or service memory utilization metrics are used for tasks using both the Fargate and the EC2 launch type.
Use this dashboard to:
* Monitor real-time CPU and memory usage across your ECS clusters and services.
* Identify performance bottlenecks or underutilized resources in your ECS environment.
* Compare utilization patterns between clusters and individual services to optimize resource allocation.
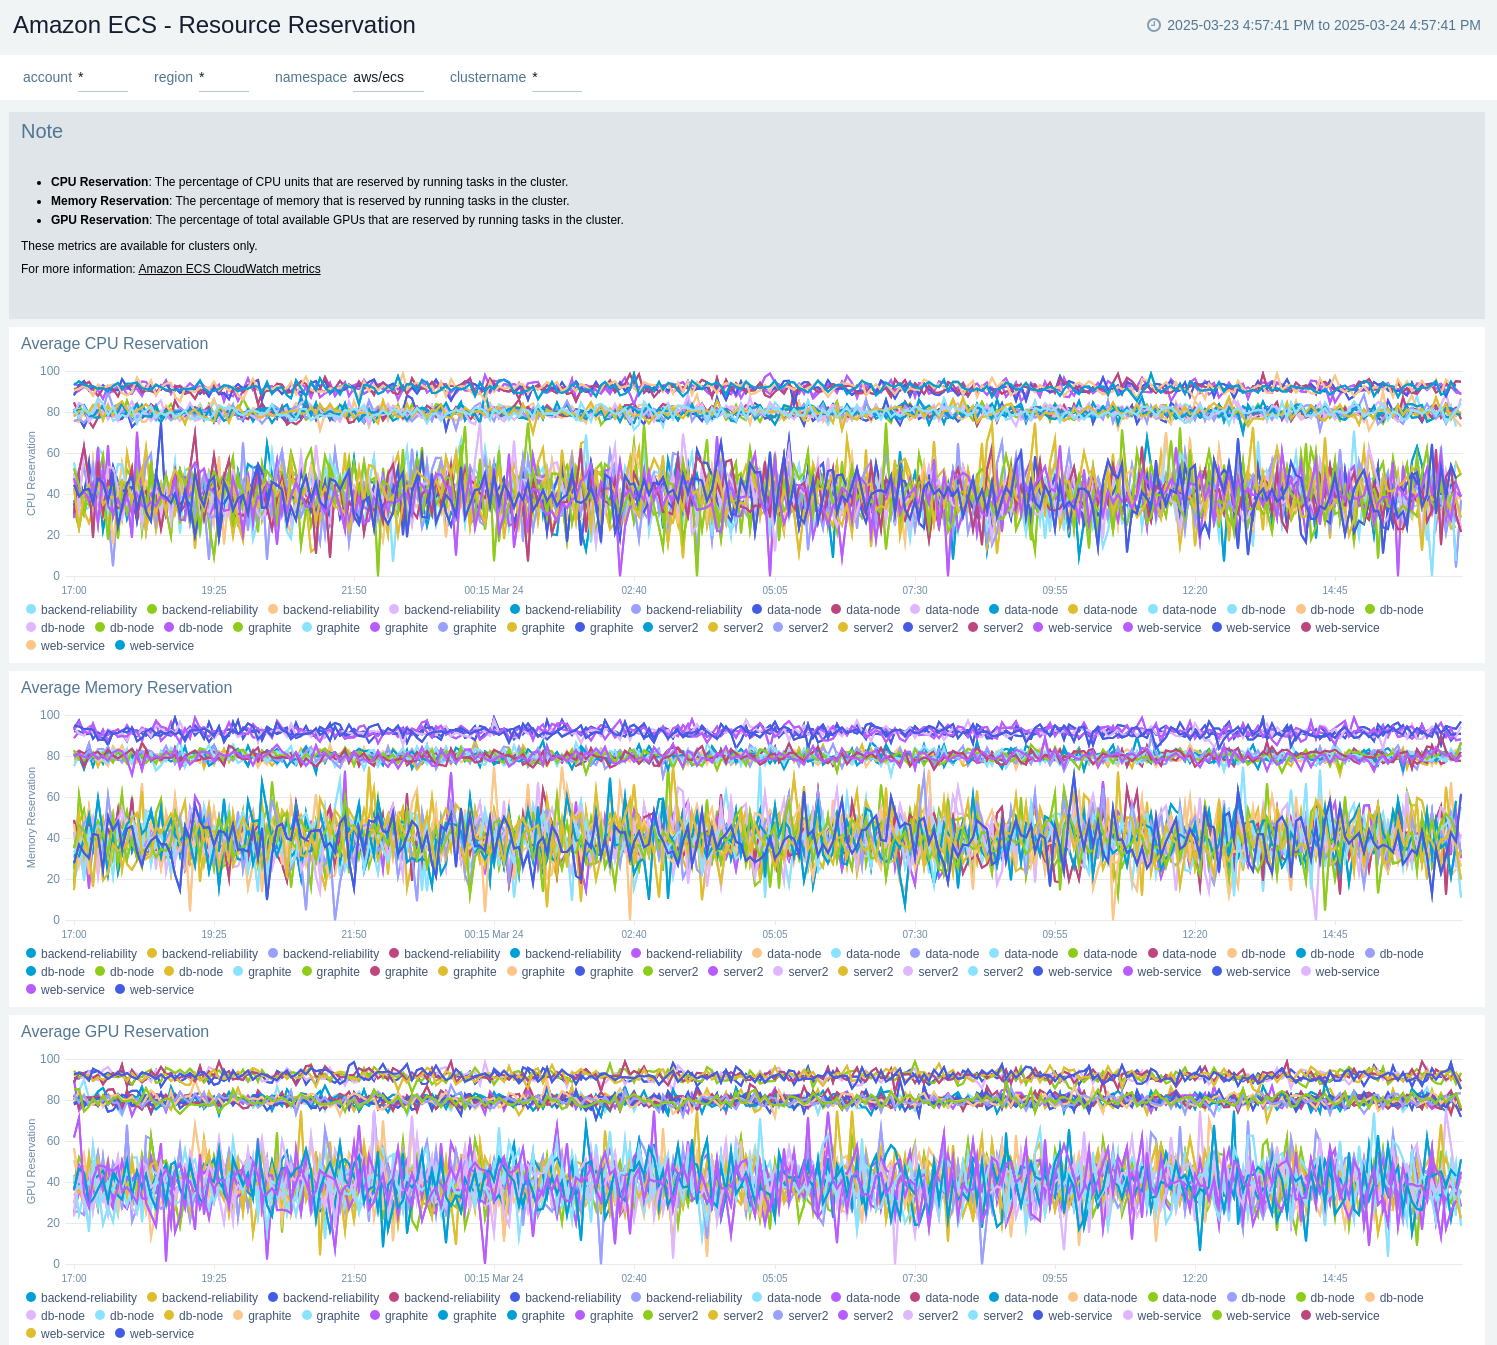
 ### Resource Reservation
The **Amazon ECS - Resource Reservation** dashboard provides detailed insights into the average reservation (units utilized) by CPU, Memory, and GPU for a given cluster.
* These metrics are available for clusters only.
* This metric is used only on clusters with tasks or services using the EC2 launch type. It's not supported on clusters with tasks using the Fargate launch type.
Use this dashboard to:
* Track average resource reservation levels across different ECS clusters and services.
* Identify potential resource constraints or overprovisioning in your ECS environment.
* Compare reservation patterns between different types of resources (CPU, memory, GPU) over time.
### Resource Reservation
The **Amazon ECS - Resource Reservation** dashboard provides detailed insights into the average reservation (units utilized) by CPU, Memory, and GPU for a given cluster.
* These metrics are available for clusters only.
* This metric is used only on clusters with tasks or services using the EC2 launch type. It's not supported on clusters with tasks using the Fargate launch type.
Use this dashboard to:
* Track average resource reservation levels across different ECS clusters and services.
* Identify potential resource constraints or overprovisioning in your ECS environment.
* Compare reservation patterns between different types of resources (CPU, memory, GPU) over time.