---
id: jira-opentelemetry
title: Jira - OpenTelemetry Collector
sidebar_label: Jira - OTel Collector
description: The Sumo Logic app for Jira provides insight into Jira user access, request activity, issues, security, sprint events, and user events.
slug: /help/docs/integrations/app-development/opentelemetry/jira-opentelemetry/
canonical: https://www.sumologic.com/help/docs/integrations/app-development/opentelemetry/jira-opentelemetry/
---
import useBaseUrl from '@docusaurus/useBaseUrl';
import Tabs from '@theme/Tabs';
import TabItem from '@theme/TabItem';
})
}) The Sumo Logic app for Jira provides insight into Jira usage, request activity, issues, security, sprint events, and user events.
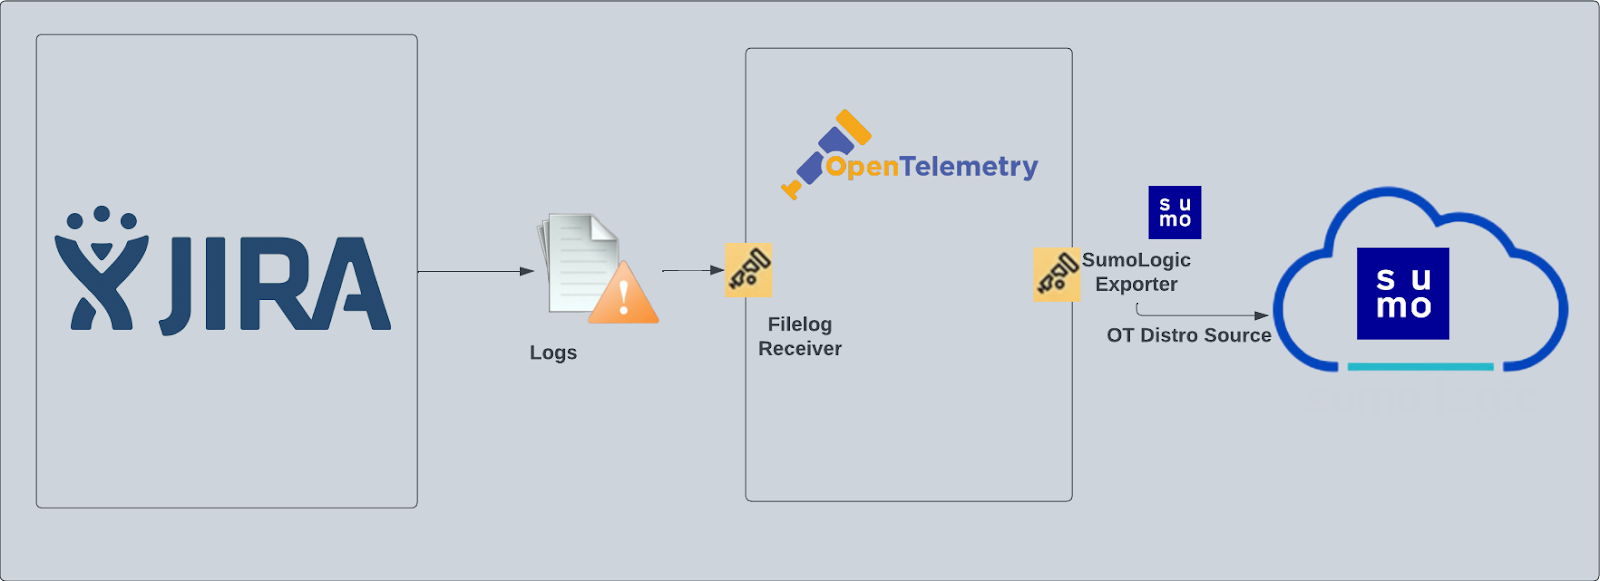
Jira logs are sent to Sumo Logic through OpenTelemetry [filelog receiver](https://github.com/open-telemetry/opentelemetry-collector-contrib/tree/main/receiver/filelogreceiver).
The Sumo Logic app for Jira provides insight into Jira usage, request activity, issues, security, sprint events, and user events.
Jira logs are sent to Sumo Logic through OpenTelemetry [filelog receiver](https://github.com/open-telemetry/opentelemetry-collector-contrib/tree/main/receiver/filelogreceiver).
 ## Fields creation in Sumo Logic for Jira
Following are the tags which will be created as part of the Jira App install if not already present.
- `sumo.datasource`. Has fixed value of **jira**.
## Prerequisites
This section provides instructions for configuring log collection for Jira running on a non-Kubernetes environment for the Sumo Logic App for Jira. Sumo Logic supports the collection of logs from Jira server in standalone environments.
Follow the instructions to set up log collection.
The Jira app uses the following log types:
- **Jira Access Logs**. HTTP server access log files, in `logs/access_logs`, in your Jira Installation Directory.
- **Jira Security Logs**. Security-related information, such as logins, logouts, session creation/destruction, and security denials from `atlassian-jira-security.log`.
- **Jira Catalina Logs**. The application catalina log file, `logs/catalina.out`, in your Jira Installation Directory.
- **Jira Webhooks**. Webhook events of types:
- Issue
- User
- Sprint
import LogsCollectionPrereqisites from '../../../reuse/apps/logs-collection-prereqisites.md';
For Windows systems, log files which are collected should be accessible by the SYSTEM group. Use the following set of PowerShell commands if the SYSTEM group does not have access.
```
$NewAcl = Get-Acl -Path ""
# Set properties
$identity = "NT AUTHORITY\SYSTEM"
$fileSystemRights = "ReadAndExecute"
$type = "Allow"
# Create new rule
$fileSystemAccessRuleArgumentList = $identity, $fileSystemRights, $type
$fileSystemAccessRule = New-Object -TypeName System.Security.AccessControl.FileSystemAccessRule -ArgumentList $fileSystemAccessRuleArgumentList
# Apply new rule
$NewAcl.SetAccessRule($fileSystemAccessRule)
Set-Acl -Path "" -AclObject $NewAcl
```
## Configure hosted collector to receive Webhooks
In this step, you create a host collector to receive webhooks from Jira and set up an HTTP source on it.
1. Configure a [hosted collector](/docs/send-data/hosted-collectors/configure-hosted-collector/), or select an existing hosted collector for the HTTP source.
2. Configure an [HTTP source](/docs/send-data/hosted-collectors/http-source/logs-metrics/) on the hosted collector.
- For Source Category, specify Atlassian/Jira/Events
- Add `sumo.datasource` as File to this source and assign the value **jira** for it.
## Fields creation in Sumo Logic for Jira
Following are the tags which will be created as part of the Jira App install if not already present.
- `sumo.datasource`. Has fixed value of **jira**.
## Prerequisites
This section provides instructions for configuring log collection for Jira running on a non-Kubernetes environment for the Sumo Logic App for Jira. Sumo Logic supports the collection of logs from Jira server in standalone environments.
Follow the instructions to set up log collection.
The Jira app uses the following log types:
- **Jira Access Logs**. HTTP server access log files, in `logs/access_logs`, in your Jira Installation Directory.
- **Jira Security Logs**. Security-related information, such as logins, logouts, session creation/destruction, and security denials from `atlassian-jira-security.log`.
- **Jira Catalina Logs**. The application catalina log file, `logs/catalina.out`, in your Jira Installation Directory.
- **Jira Webhooks**. Webhook events of types:
- Issue
- User
- Sprint
import LogsCollectionPrereqisites from '../../../reuse/apps/logs-collection-prereqisites.md';
For Windows systems, log files which are collected should be accessible by the SYSTEM group. Use the following set of PowerShell commands if the SYSTEM group does not have access.
```
$NewAcl = Get-Acl -Path ""
# Set properties
$identity = "NT AUTHORITY\SYSTEM"
$fileSystemRights = "ReadAndExecute"
$type = "Allow"
# Create new rule
$fileSystemAccessRuleArgumentList = $identity, $fileSystemRights, $type
$fileSystemAccessRule = New-Object -TypeName System.Security.AccessControl.FileSystemAccessRule -ArgumentList $fileSystemAccessRuleArgumentList
# Apply new rule
$NewAcl.SetAccessRule($fileSystemAccessRule)
Set-Acl -Path "" -AclObject $NewAcl
```
## Configure hosted collector to receive Webhooks
In this step, you create a host collector to receive webhooks from Jira and set up an HTTP source on it.
1. Configure a [hosted collector](/docs/send-data/hosted-collectors/configure-hosted-collector/), or select an existing hosted collector for the HTTP source.
2. Configure an [HTTP source](/docs/send-data/hosted-collectors/http-source/logs-metrics/) on the hosted collector.
- For Source Category, specify Atlassian/Jira/Events
- Add `sumo.datasource` as File to this source and assign the value **jira** for it.
 - Make a note of the HTTP address for the source. You will supply it when you configure a Jira webhook in the next step.
## Register webhook in Jira
Follow the instructions on [Webhooks](https://developer.atlassian.com/server/jira/platform/webhooks/) in Jira help to register a webhook for the following events:
- Issue related:
- created (jira:issue_created)
- updated (jira:issue_updated)
- deleted (jira:issue_deleted)
- worklog changed (jira:worklog_updated)
- User related:
- created (user_created)
- updated (user_updated)
- deleted (user_deleted)
- Sprint related:
- created (sprint_created)
- deleted (sprint_deleted)
- updated (sprint_updated)
- started (sprint_started)
- closed (sprint_closed)
When you configure the webhook, enter the URL for the [HTTP source you created](#configure-hosted-collector-to-receive-webhooks) as the endpoint for the webhook.
## Collection configuration and app installation
import ConfigAppInstall from '../../../reuse/apps/opentelemetry/config-app-install.md';
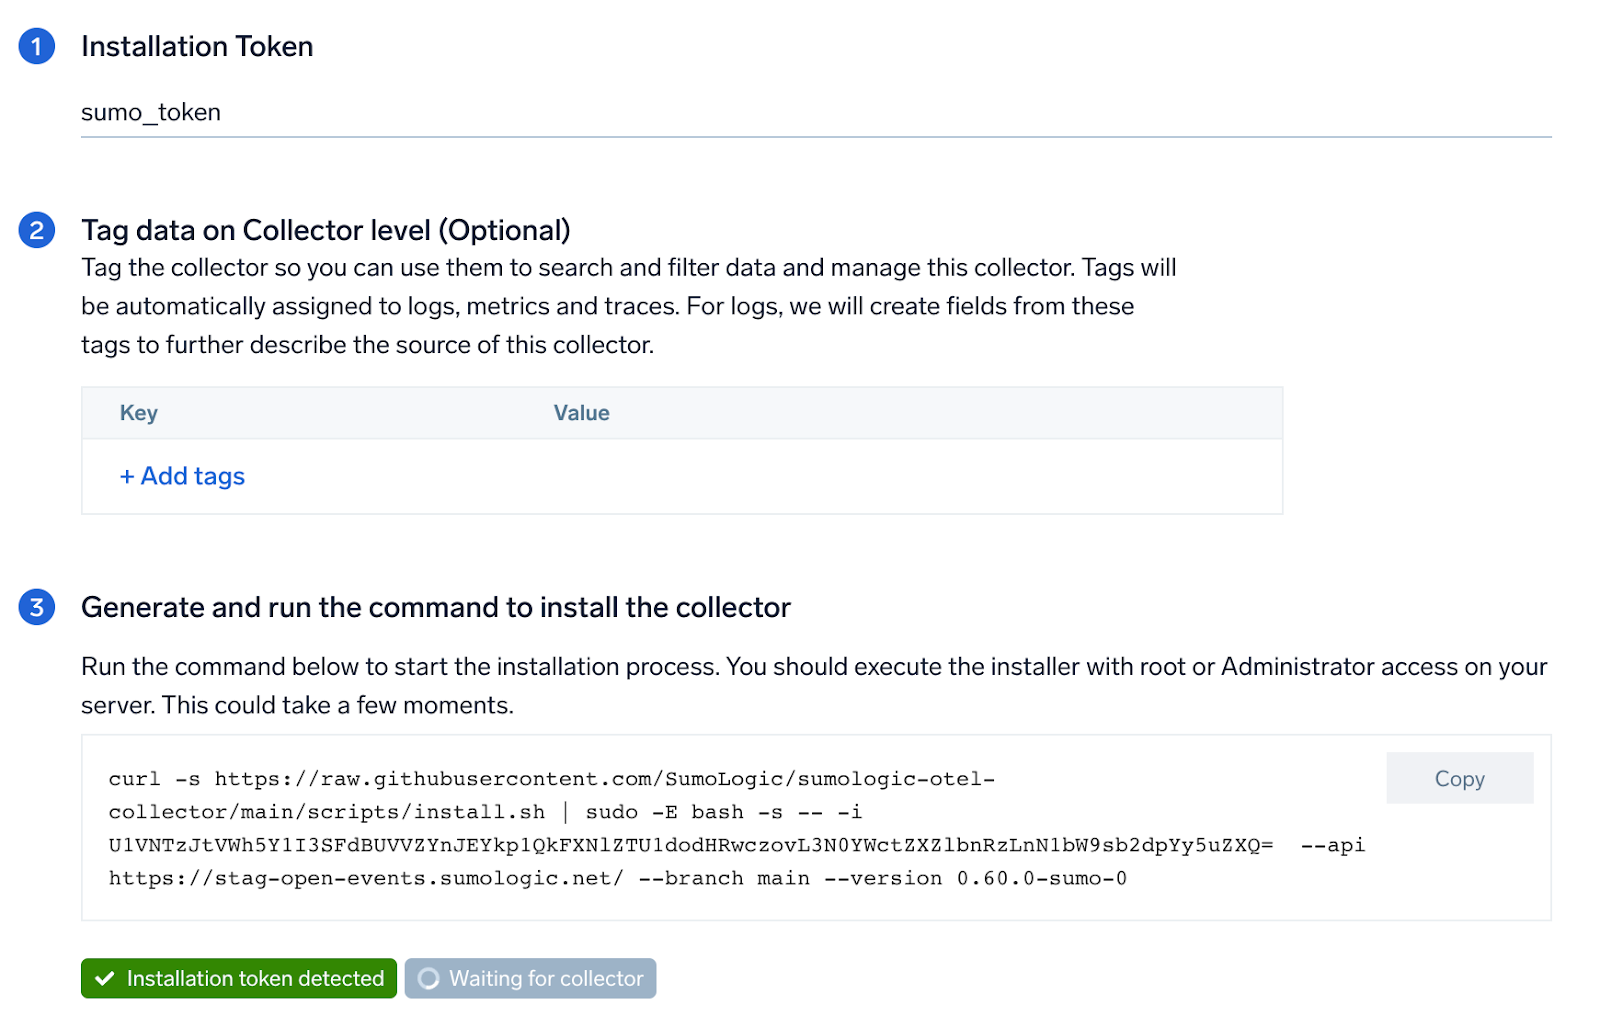
### Step 1: Set up Collector
import SetupColl from '../../../reuse/apps/opentelemetry/set-up-collector.md';
- Make a note of the HTTP address for the source. You will supply it when you configure a Jira webhook in the next step.
## Register webhook in Jira
Follow the instructions on [Webhooks](https://developer.atlassian.com/server/jira/platform/webhooks/) in Jira help to register a webhook for the following events:
- Issue related:
- created (jira:issue_created)
- updated (jira:issue_updated)
- deleted (jira:issue_deleted)
- worklog changed (jira:worklog_updated)
- User related:
- created (user_created)
- updated (user_updated)
- deleted (user_deleted)
- Sprint related:
- created (sprint_created)
- deleted (sprint_deleted)
- updated (sprint_updated)
- started (sprint_started)
- closed (sprint_closed)
When you configure the webhook, enter the URL for the [HTTP source you created](#configure-hosted-collector-to-receive-webhooks) as the endpoint for the webhook.
## Collection configuration and app installation
import ConfigAppInstall from '../../../reuse/apps/opentelemetry/config-app-install.md';
### Step 1: Set up Collector
import SetupColl from '../../../reuse/apps/opentelemetry/set-up-collector.md';
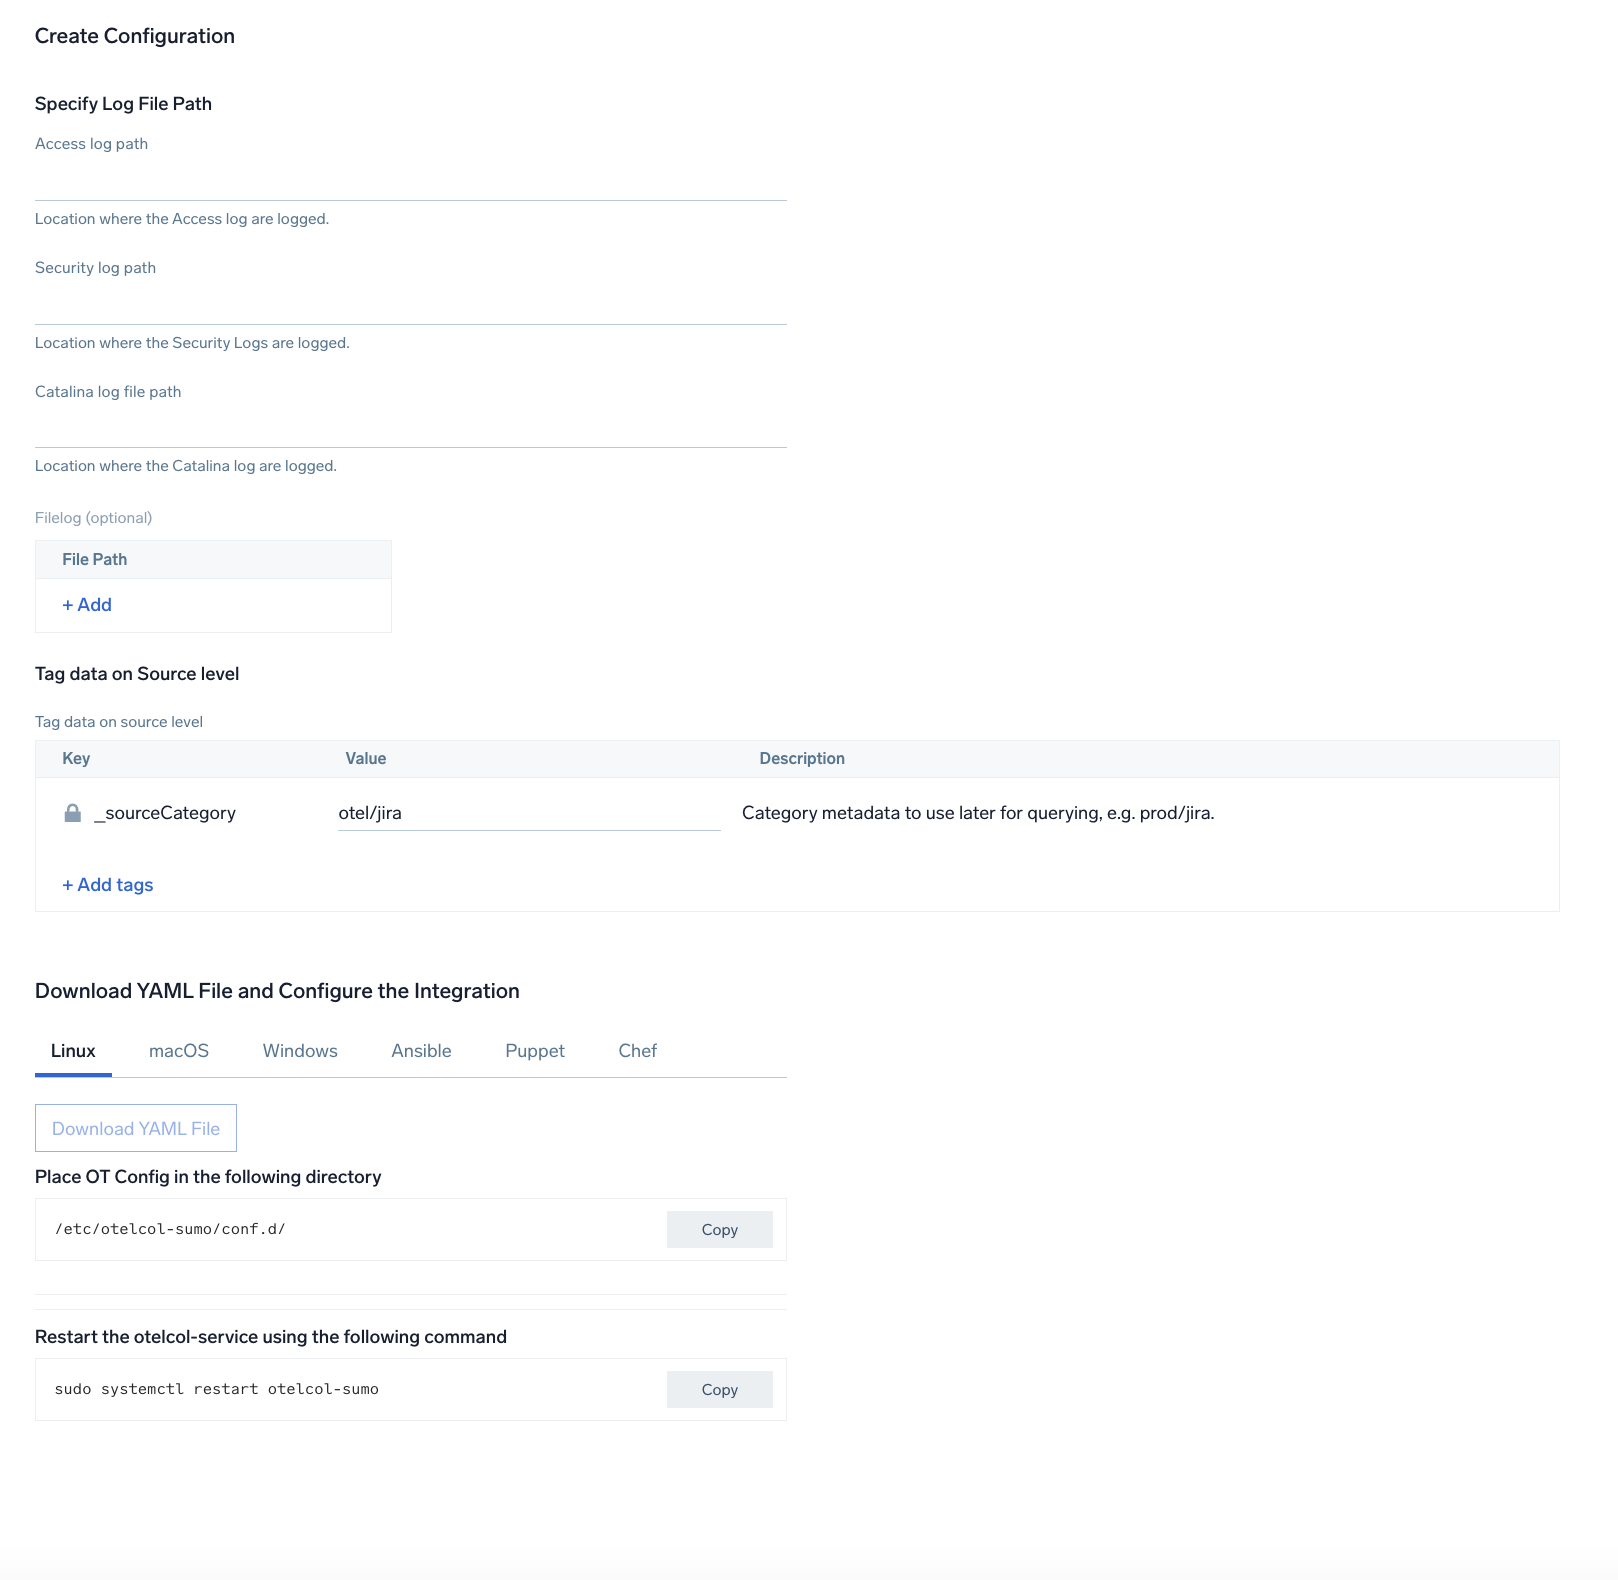
 ### Step 2: Configure integration
In this step, you will configure the yaml file required for Jira Collection.
Path of the different log file configured to capture Jira logs is needed to be given here:
- Jira Access Logs. Apache HTTP server log files. Default path `/var/log/apache2/*.log`.
- Jira Security Logs. Security-related information. Default path `/home/jira/atlassian/application-data/jira/log/atlassian-jira-security.log`.
- Jira Catalina Logs. The application server log file. Default path `/home/jira/atlassian/application-data/jira/log/*.log`.
Click on the **Download YAML File** button to get the yaml file.
import CollectorVersionNote from '../../../reuse/apps/opentelemetry/collector-version-note.md';
### Step 2: Configure integration
In this step, you will configure the yaml file required for Jira Collection.
Path of the different log file configured to capture Jira logs is needed to be given here:
- Jira Access Logs. Apache HTTP server log files. Default path `/var/log/apache2/*.log`.
- Jira Security Logs. Security-related information. Default path `/home/jira/atlassian/application-data/jira/log/atlassian-jira-security.log`.
- Jira Catalina Logs. The application server log file. Default path `/home/jira/atlassian/application-data/jira/log/*.log`.
Click on the **Download YAML File** button to get the yaml file.
import CollectorVersionNote from '../../../reuse/apps/opentelemetry/collector-version-note.md';
 ### Step 3: Send logs to Sumo Logic
import LogsIntro from '../../../reuse/apps/opentelemetry/send-logs-intro.md';
1. Copy the yaml file to `/etc/otelcol-sumo/conf.d/` folder in the Jira instance that needs to be monitored.
2. Place Env file in the following directory:
```sh
/etc/otelcol-sumo/env/
```
3. Restart the collector using:
```sh
sudo systemctl restart otelcol-sumo
```
1. Copy the yaml file to `C:\ProgramData\Sumo Logic\OpenTelemetry Collector\config\conf.d` folder in the machine that needs to be monitored.
2. Restart the collector using:
```sh
Restart-Service -Name OtelcolSumo
```
1. Copy the yaml file to `/etc/otelcol-sumo/conf.d/` folder in the Jira instance that needs to be monitored.
2. Restart the otelcol-sumo process using:
```sh
otelcol-sumo --config /etc/otelcol-sumo/sumologic.yaml --config "glob:/etc/otelcol-sumo/conf.d/*.yaml"
```
import ChefNoEnv from '../../../reuse/apps/opentelemetry/chef-without-env.md';
import AnsibleNoEnv from '../../../reuse/apps/opentelemetry/ansible-without-env.md';
import PuppetNoEnv from '../../../reuse/apps/opentelemetry/puppet-without-env.md';
import LogsOutro from '../../../reuse/apps/opentelemetry/send-logs-outro.md';
## Sample log messages
```sh title="Sample Log Message (Non-Kubernetes environment)"
bluechip-office - - 19/01/2023:05:02:10 Z "GET /jira/rest/gadget/1.0/averageage/generate?projectOrFilterId=filter-16392&periodName=monthly&daysprevious=730&width=428&height=285&inline=true&_=1541539601115 HTTP/1.1" 401 8509 "https://jira.kumoroku.com/jira/plugins/servlet/gadgets/ifr?container=atlassian&mid=17024&country=US&lang=en&view=default&view-params=%7B%22writable%22%3A%22true%22%7D&st=atlassian%3A7udmdg9B2kTj%2FIang%2FZBXDM3COYkLIHJIzAUYmw9QDAiuHR4StJpZph6bTEtMMfxwx46%2B7cTTIjSGz%2B%2FNBJa4GLMS7e3ijRtWhIEIi4u19i2WXZsBZ8ZP8AekcT1JzwwkH9lGt9IRgXmL05epIw8kYAzDpKI1E%2FdHLFYtwo7m1M%2FRSsPMdoYGmwUfuIHM6%2FKGMsCDzToTKRzay85Sw9O7Db6%2B7A9MkQm0BxSmX3hMpV%2BPWgw%2BKDuNwPC0HCzrkMb4V2M3pJE0qBbvJqM2O6ezII938KZBz0%2B1zKnC9Rw2ePrbrm7TjCWGiR77NxKFtowNo3Xfg%3D%3D&up_isConfigured=true&up_isPopup=false&up_refresh=15&up_projectOrFilterId=filter-
```
## Sample queries
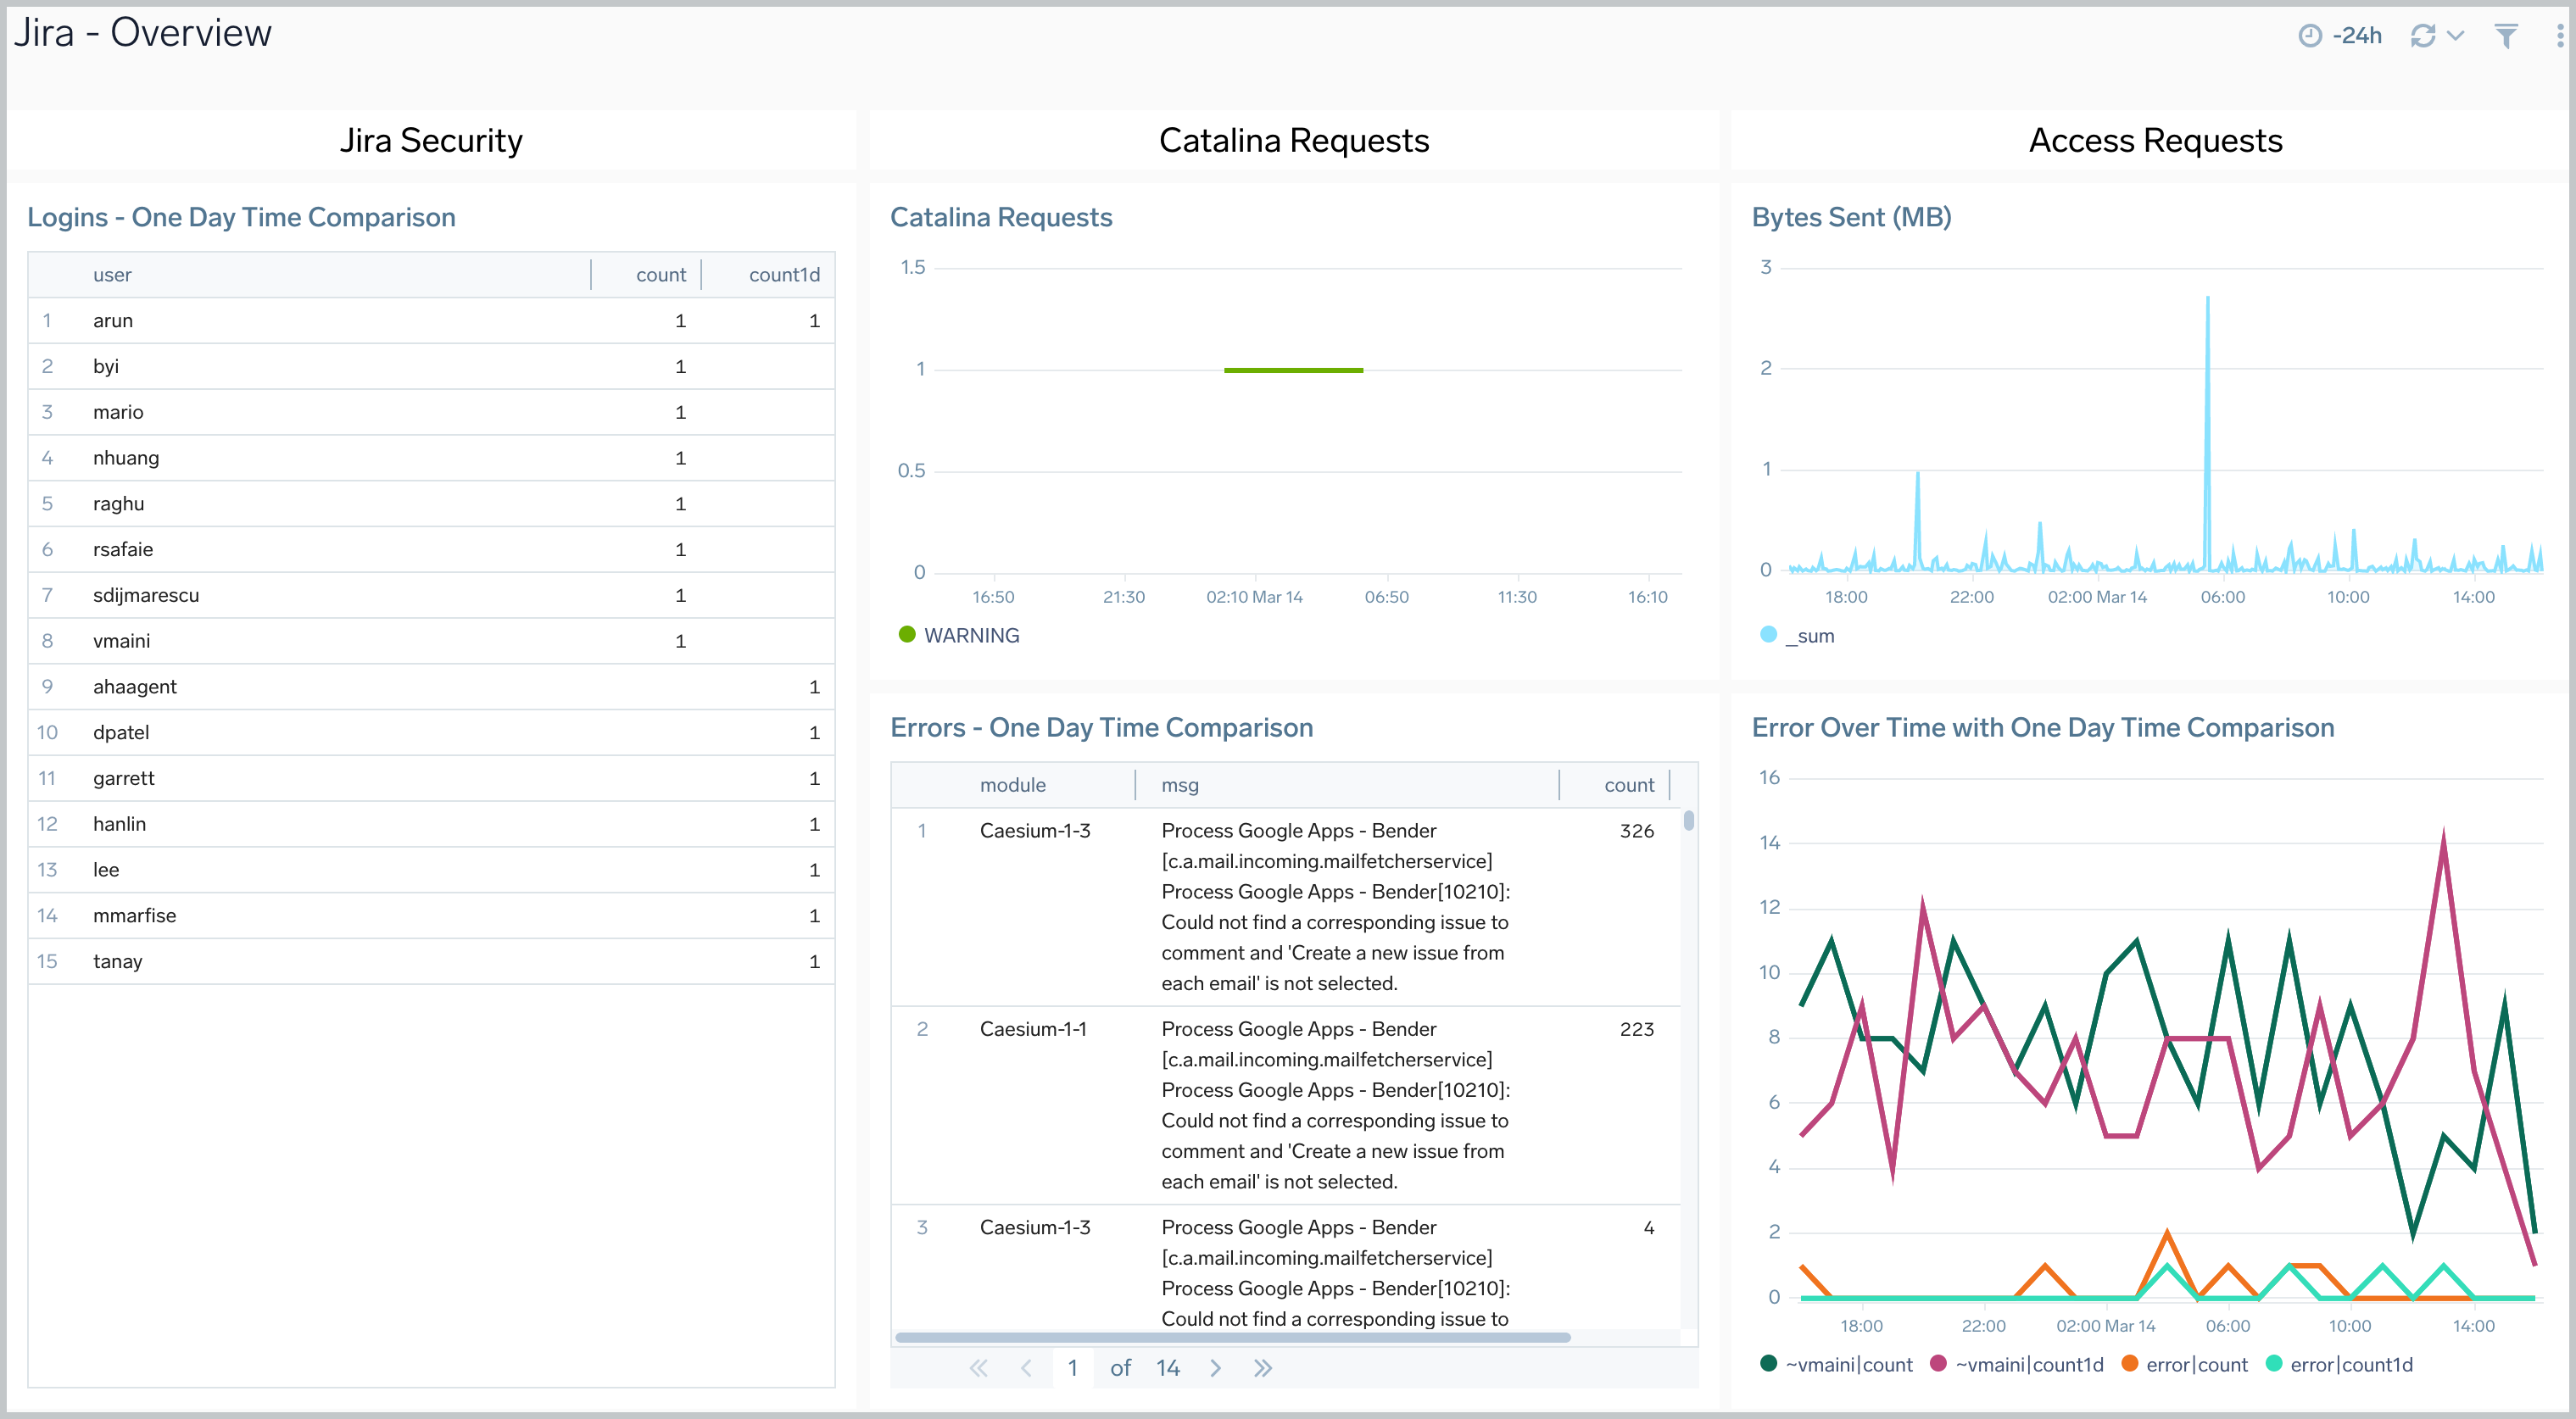
This sample query is from the **Jira - Overview** dashboard > **Catalina Requests** panel.
```sumo
"%"sumo.datasource"=jira
| parse "URI *," as URI
| parse regex "\d{2}-\w{3}-\d{4}\s\d{2}:\d{2}:\d{2}.\d{3}\s(?\w+)\s\[(?[^\]]+)\]\s(?\S+)\s(?.*)"
| timeslice 5m
| count _timeslice, log_level
| compare with timeshift 1d
| _count as count
| _count_1d as count1d
| fields - _count, _count_1d
| transpose row _timeslice column log_level
"
```
## Viewing Jira Dashboards
### Overview
The **Jira - Overview** dashboard provides a high-level view of Jira activities, including the location of event authentications, login comparisons, Jira requests, errors and error trends, and data usage.
### Step 3: Send logs to Sumo Logic
import LogsIntro from '../../../reuse/apps/opentelemetry/send-logs-intro.md';
1. Copy the yaml file to `/etc/otelcol-sumo/conf.d/` folder in the Jira instance that needs to be monitored.
2. Place Env file in the following directory:
```sh
/etc/otelcol-sumo/env/
```
3. Restart the collector using:
```sh
sudo systemctl restart otelcol-sumo
```
1. Copy the yaml file to `C:\ProgramData\Sumo Logic\OpenTelemetry Collector\config\conf.d` folder in the machine that needs to be monitored.
2. Restart the collector using:
```sh
Restart-Service -Name OtelcolSumo
```
1. Copy the yaml file to `/etc/otelcol-sumo/conf.d/` folder in the Jira instance that needs to be monitored.
2. Restart the otelcol-sumo process using:
```sh
otelcol-sumo --config /etc/otelcol-sumo/sumologic.yaml --config "glob:/etc/otelcol-sumo/conf.d/*.yaml"
```
import ChefNoEnv from '../../../reuse/apps/opentelemetry/chef-without-env.md';
import AnsibleNoEnv from '../../../reuse/apps/opentelemetry/ansible-without-env.md';
import PuppetNoEnv from '../../../reuse/apps/opentelemetry/puppet-without-env.md';
import LogsOutro from '../../../reuse/apps/opentelemetry/send-logs-outro.md';
## Sample log messages
```sh title="Sample Log Message (Non-Kubernetes environment)"
bluechip-office - - 19/01/2023:05:02:10 Z "GET /jira/rest/gadget/1.0/averageage/generate?projectOrFilterId=filter-16392&periodName=monthly&daysprevious=730&width=428&height=285&inline=true&_=1541539601115 HTTP/1.1" 401 8509 "https://jira.kumoroku.com/jira/plugins/servlet/gadgets/ifr?container=atlassian&mid=17024&country=US&lang=en&view=default&view-params=%7B%22writable%22%3A%22true%22%7D&st=atlassian%3A7udmdg9B2kTj%2FIang%2FZBXDM3COYkLIHJIzAUYmw9QDAiuHR4StJpZph6bTEtMMfxwx46%2B7cTTIjSGz%2B%2FNBJa4GLMS7e3ijRtWhIEIi4u19i2WXZsBZ8ZP8AekcT1JzwwkH9lGt9IRgXmL05epIw8kYAzDpKI1E%2FdHLFYtwo7m1M%2FRSsPMdoYGmwUfuIHM6%2FKGMsCDzToTKRzay85Sw9O7Db6%2B7A9MkQm0BxSmX3hMpV%2BPWgw%2BKDuNwPC0HCzrkMb4V2M3pJE0qBbvJqM2O6ezII938KZBz0%2B1zKnC9Rw2ePrbrm7TjCWGiR77NxKFtowNo3Xfg%3D%3D&up_isConfigured=true&up_isPopup=false&up_refresh=15&up_projectOrFilterId=filter-
```
## Sample queries
This sample query is from the **Jira - Overview** dashboard > **Catalina Requests** panel.
```sumo
"%"sumo.datasource"=jira
| parse "URI *," as URI
| parse regex "\d{2}-\w{3}-\d{4}\s\d{2}:\d{2}:\d{2}.\d{3}\s(?\w+)\s\[(?[^\]]+)\]\s(?\S+)\s(?.*)"
| timeslice 5m
| count _timeslice, log_level
| compare with timeshift 1d
| _count as count
| _count_1d as count1d
| fields - _count, _count_1d
| transpose row _timeslice column log_level
"
```
## Viewing Jira Dashboards
### Overview
The **Jira - Overview** dashboard provides a high-level view of Jira activities, including the location of event authentications, login comparisons, Jira requests, errors and error trends, and data usage.
 ### Access
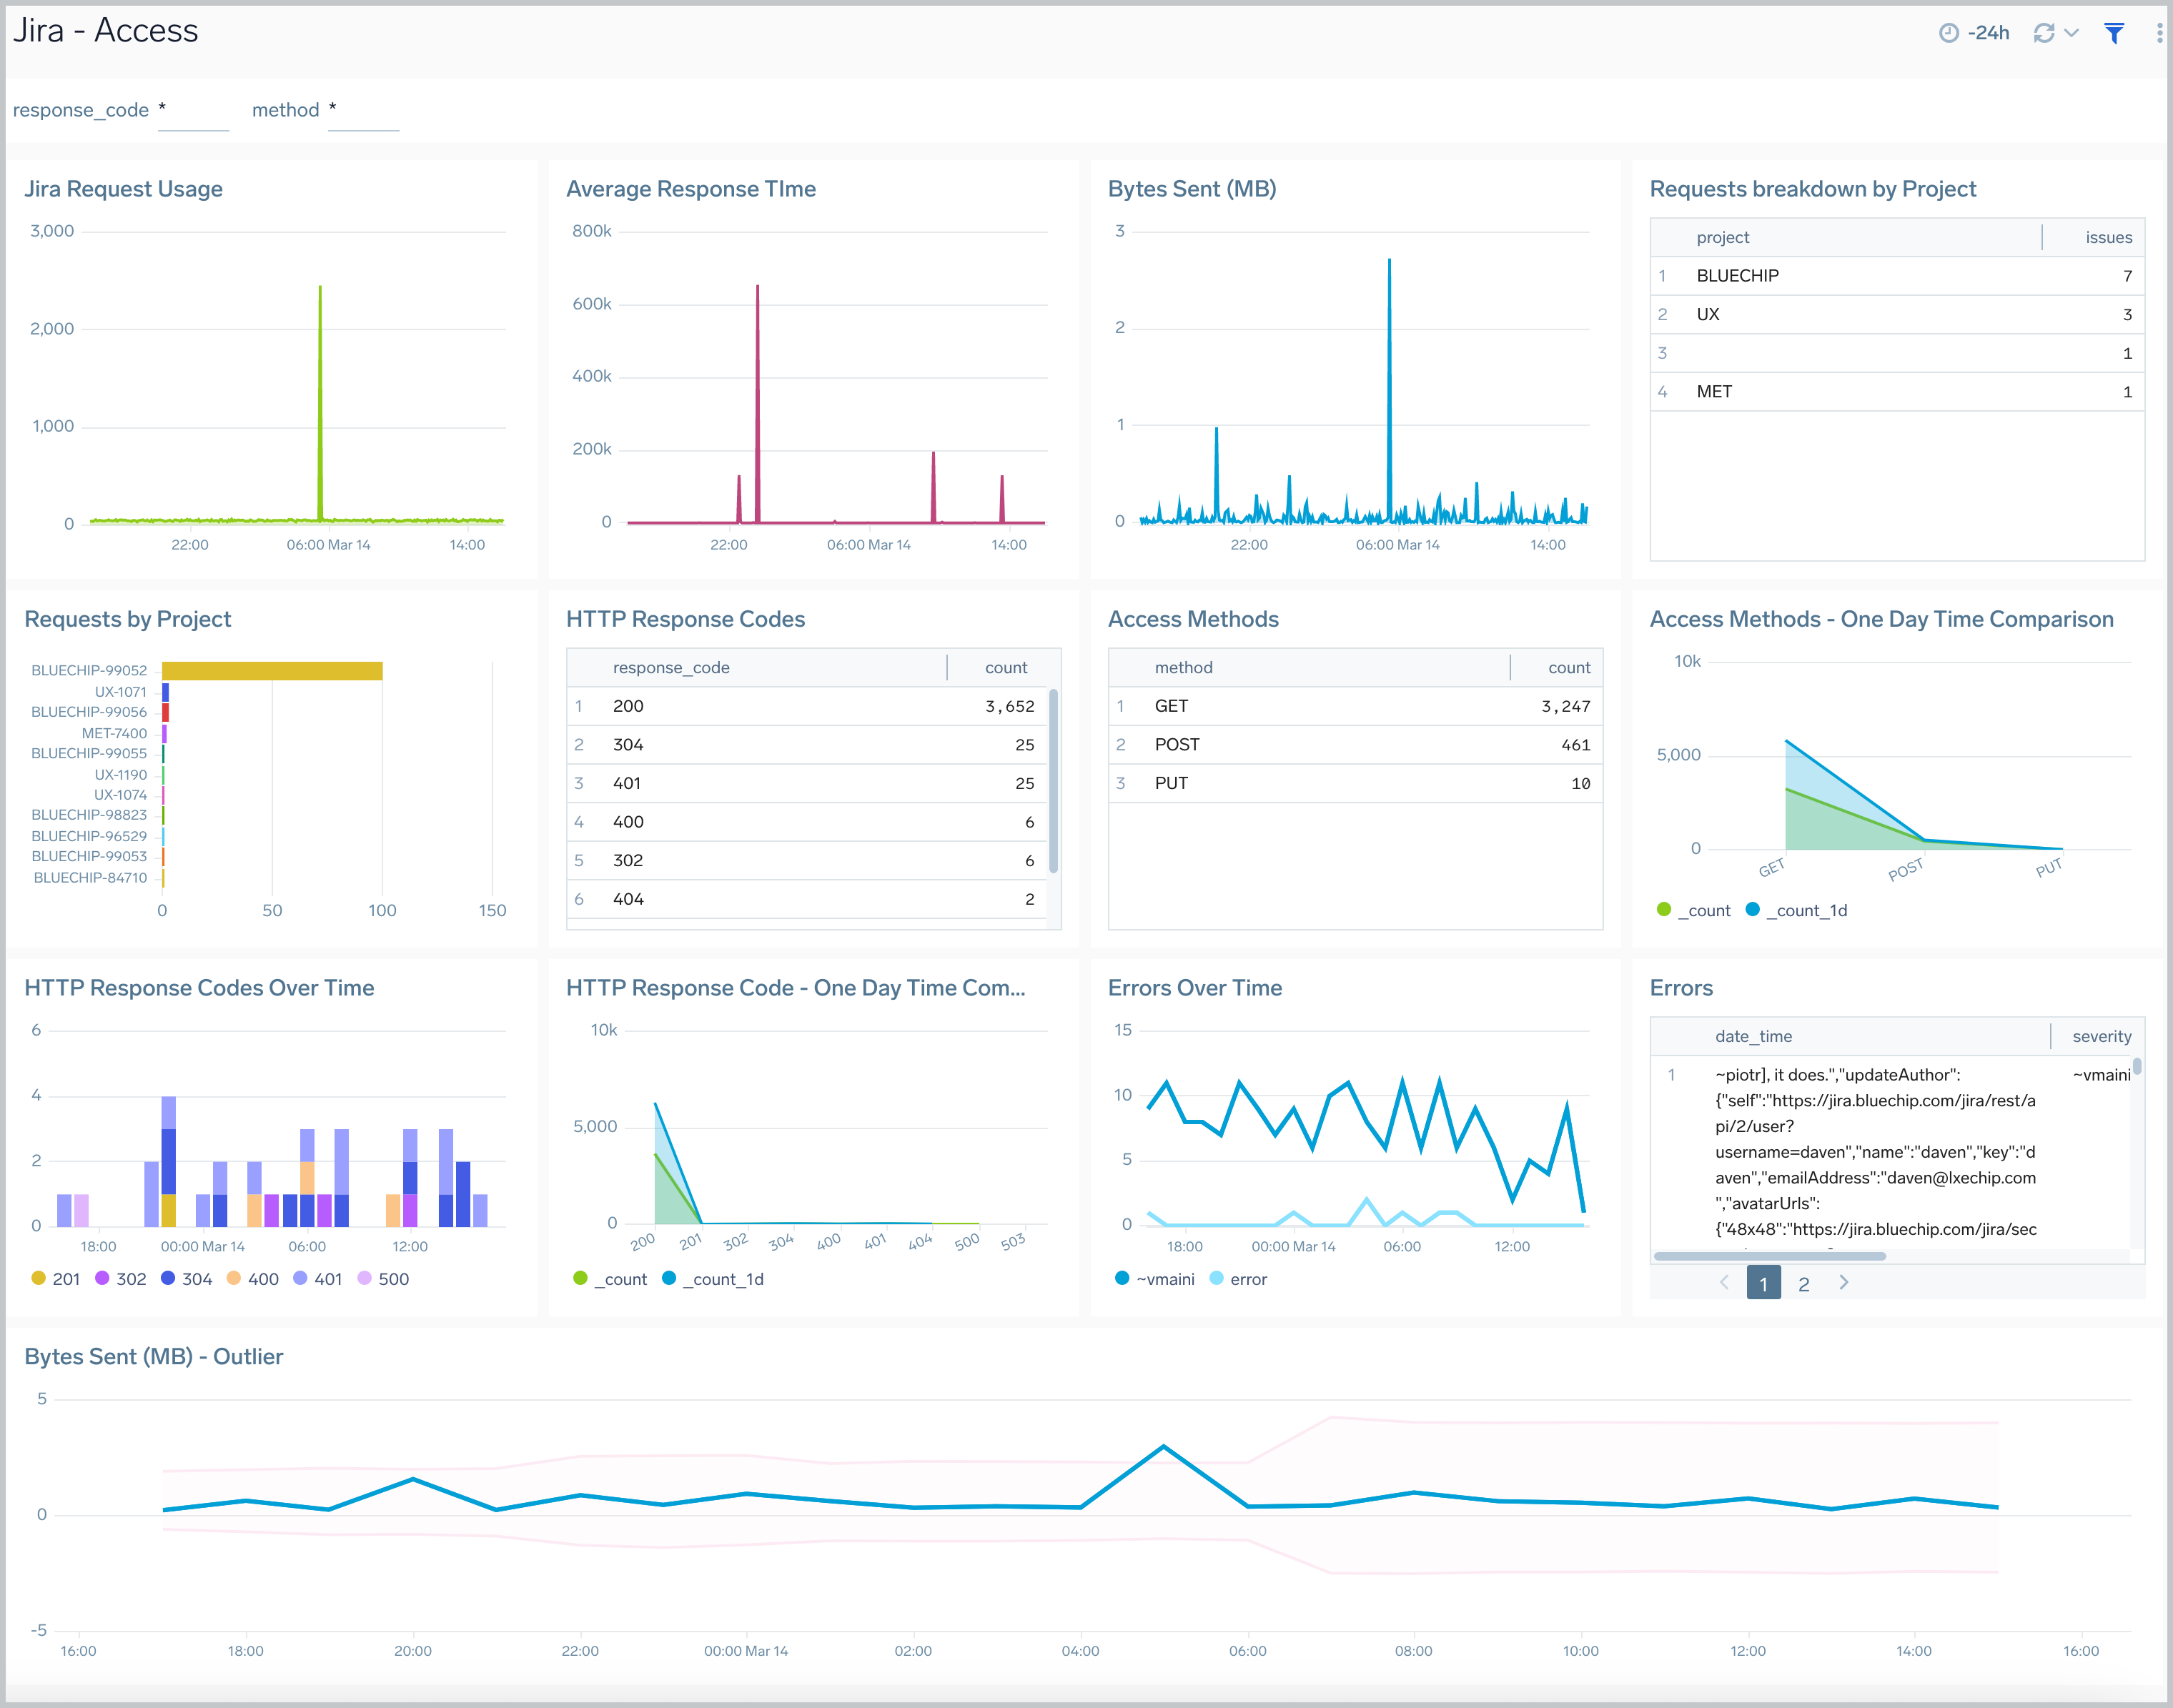
The **Jira - Access** dashboard provides information about Jira user access, including request trends, average response times, issues by project, response codes, and errors.
### Access
The **Jira - Access** dashboard provides information about Jira user access, including request trends, average response times, issues by project, response codes, and errors.
 ### Catalina
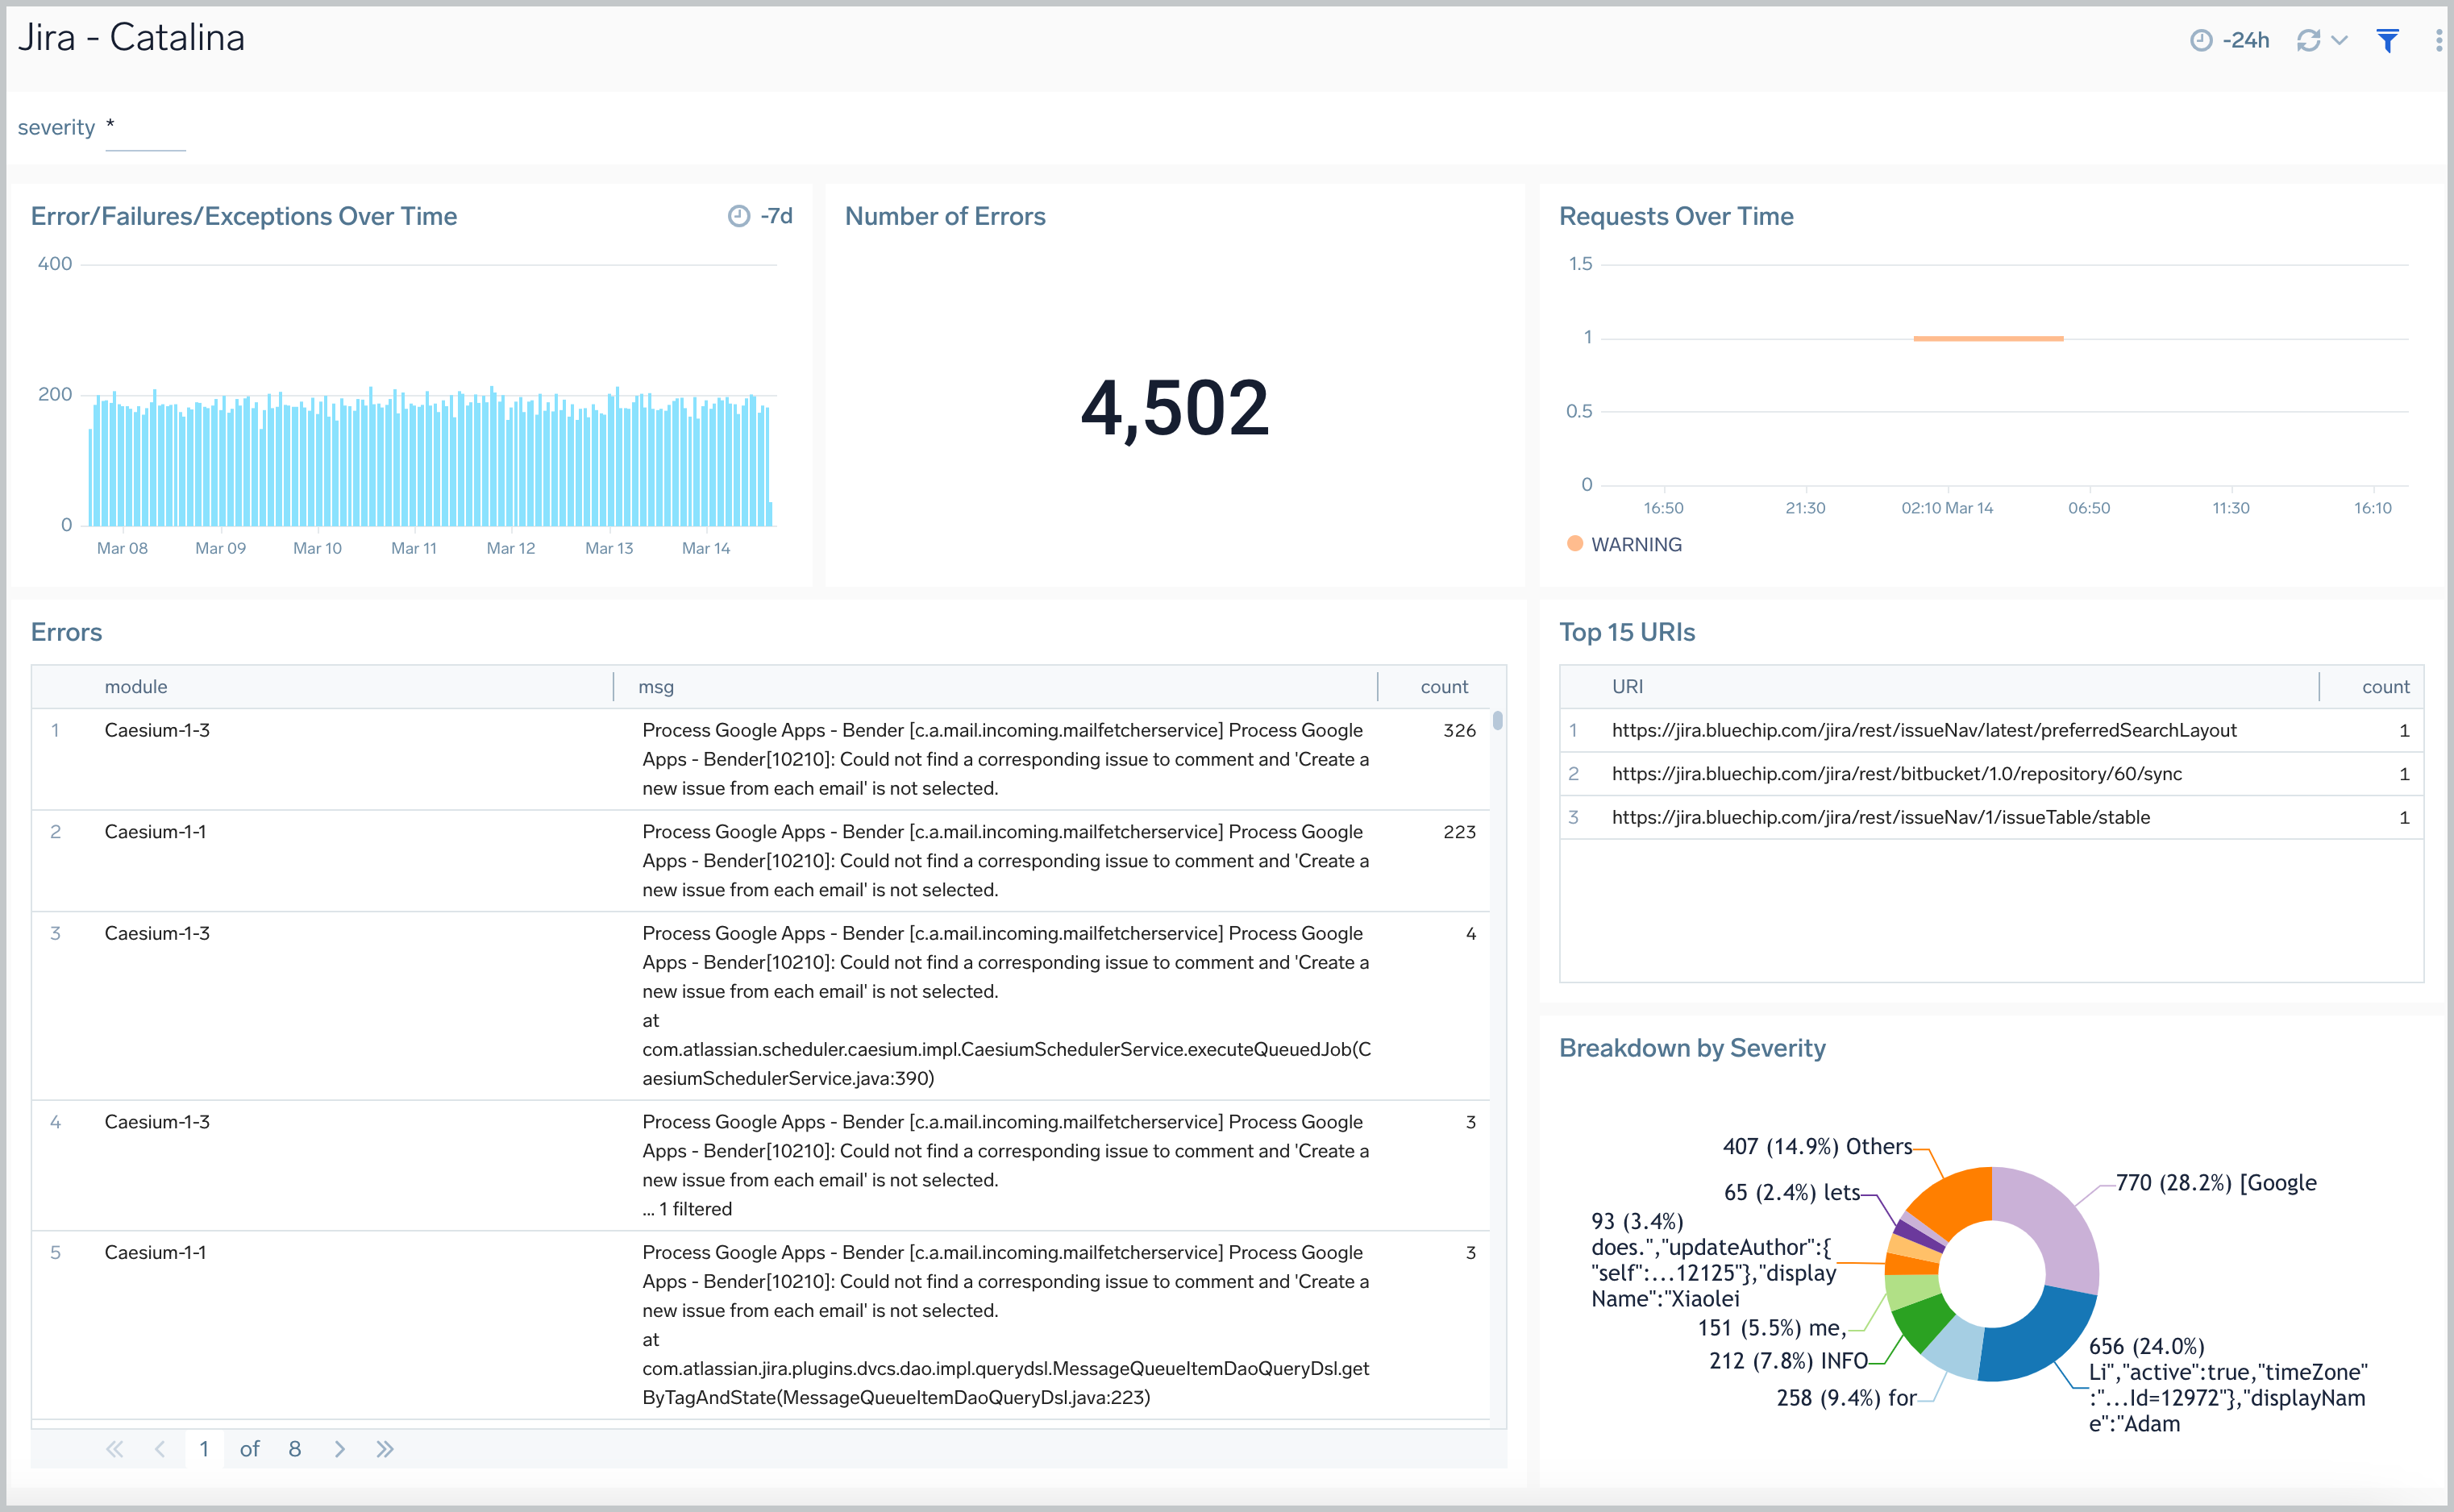
The **Jira - Catalina** dashboard provides information on the Jira internal web server. Panels display analytics for errors, failures, exceptions, request trends, and top ranked URLs
### Catalina
The **Jira - Catalina** dashboard provides information on the Jira internal web server. Panels display analytics for errors, failures, exceptions, request trends, and top ranked URLs
 ### Issue Details
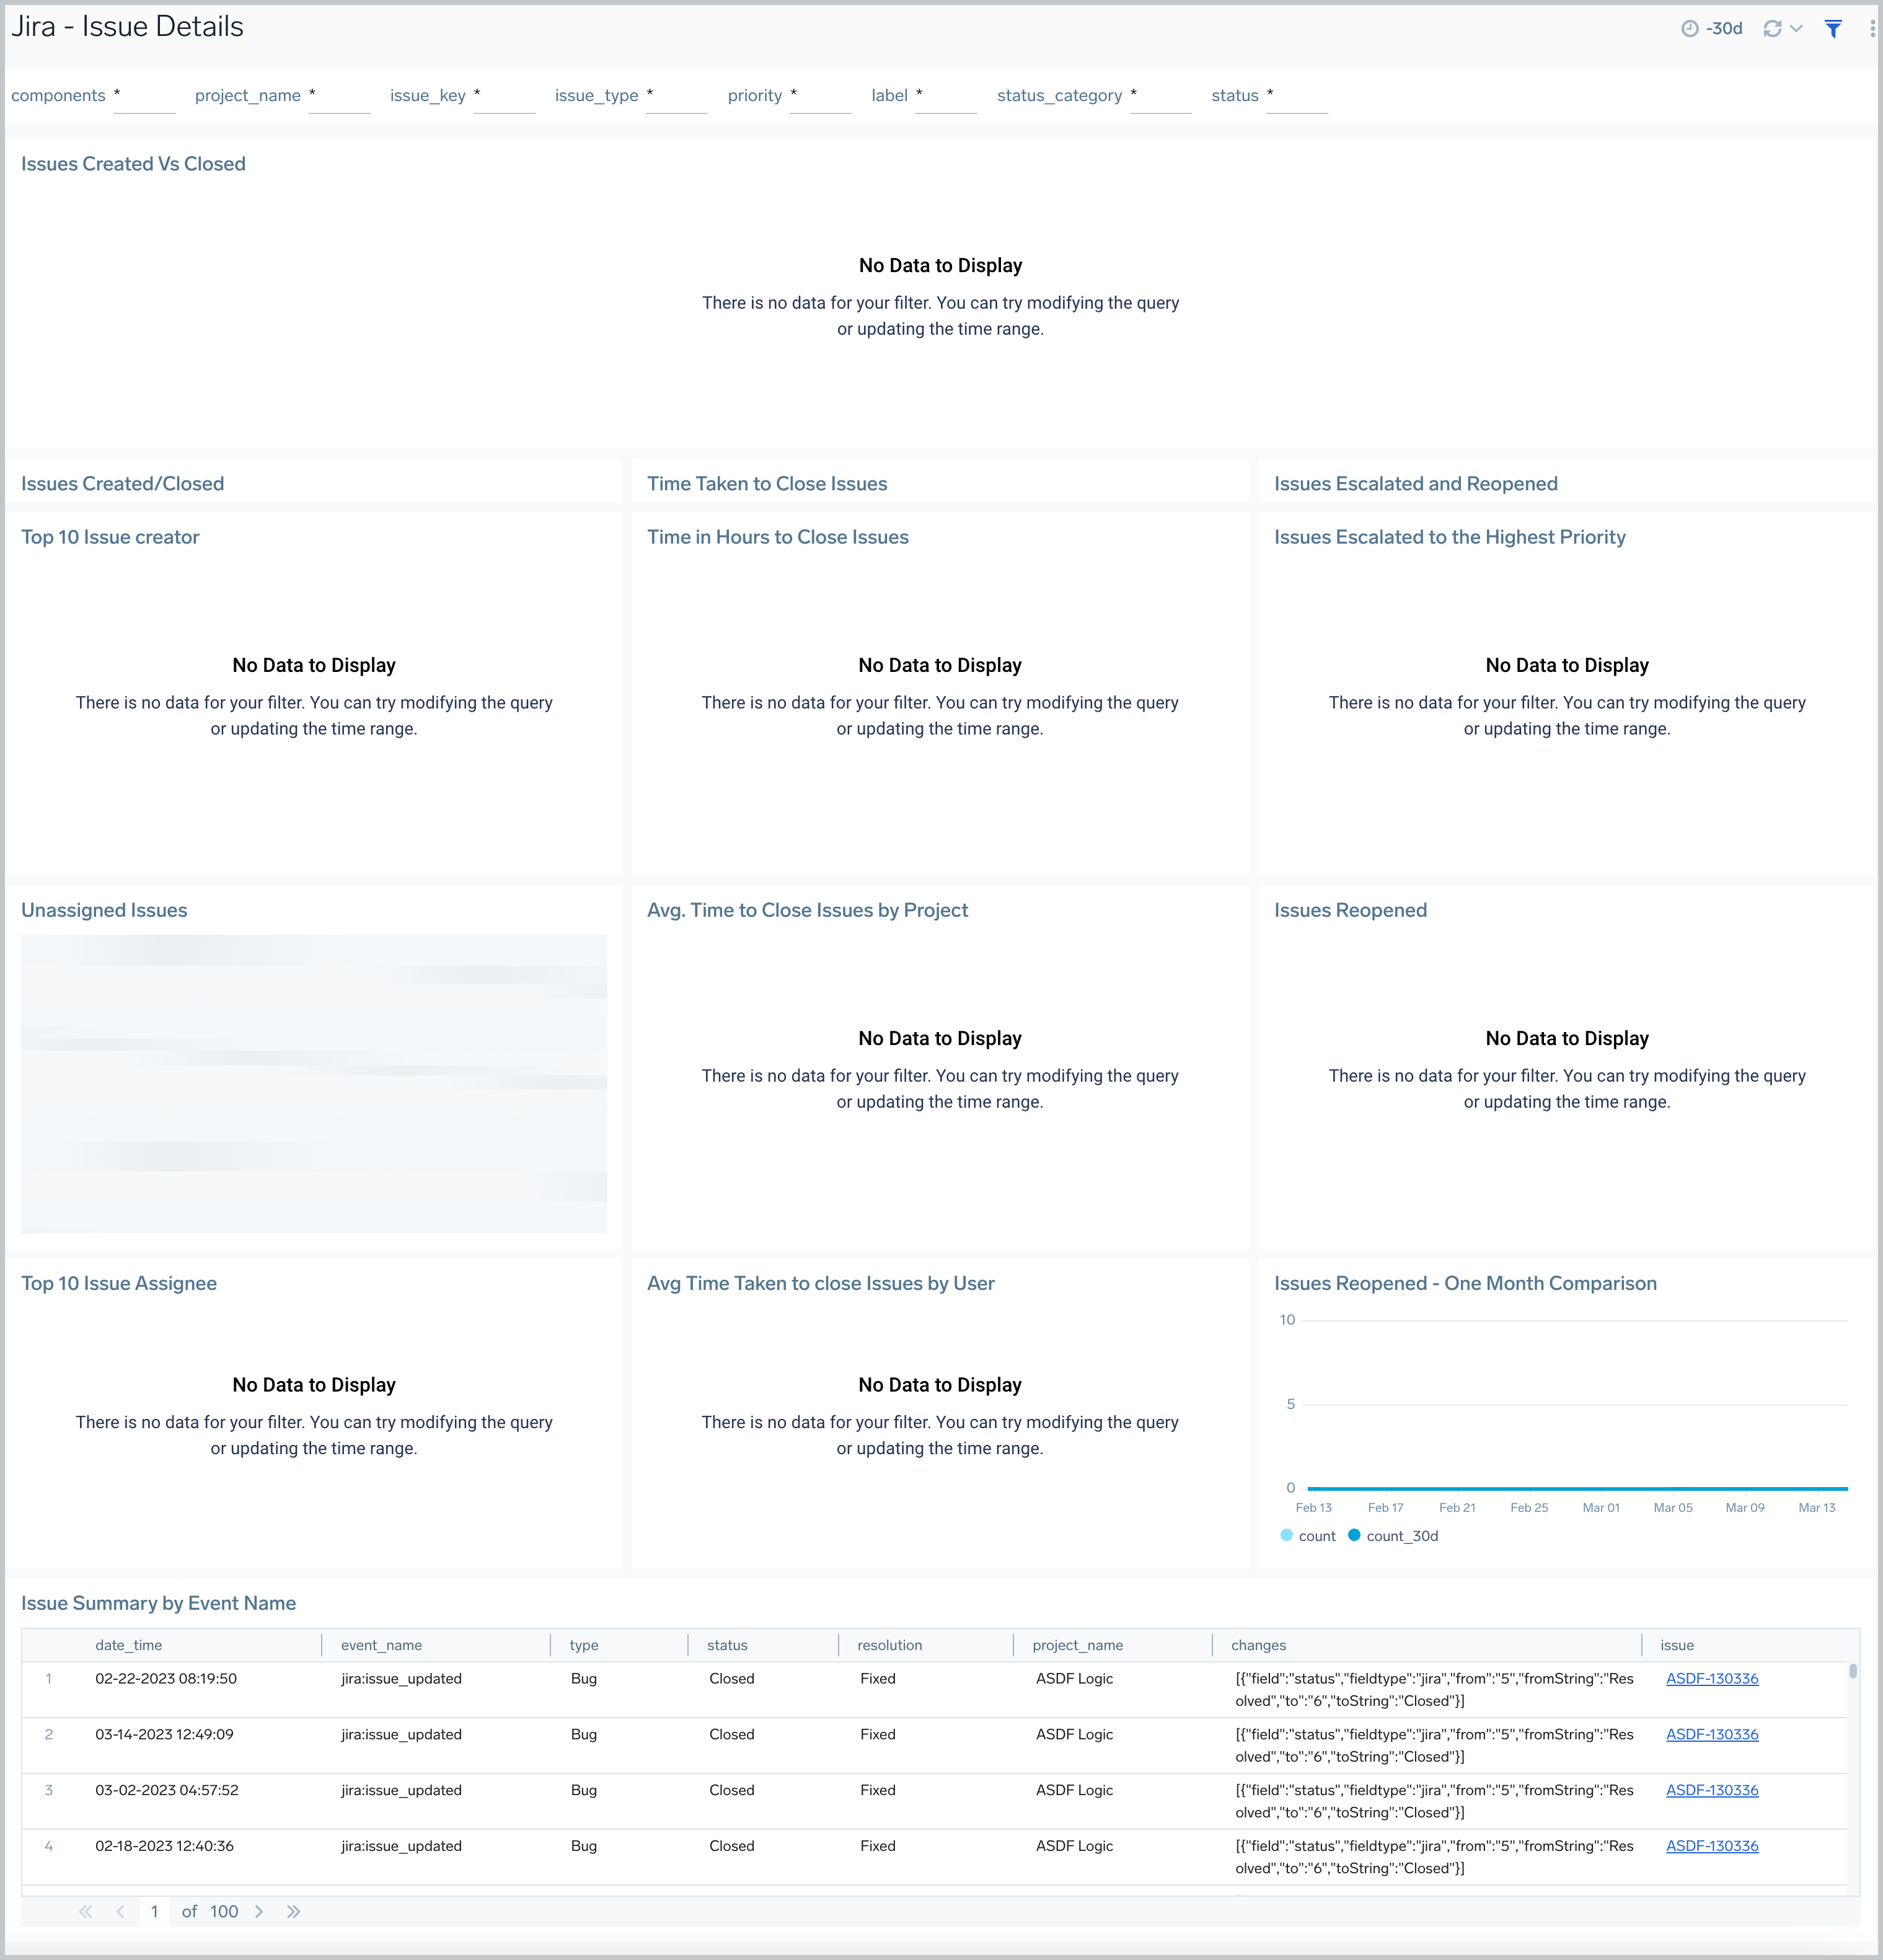
The **Jira - Issues Details** dashboard provides insights into Jira issues, showing analytics on open, closed, and reopened issues. Panels also display details on issue assignments and escalations and the average time to close issues, allowing you to prioritize and strategize issue management.
### Issue Details
The **Jira - Issues Details** dashboard provides insights into Jira issues, showing analytics on open, closed, and reopened issues. Panels also display details on issue assignments and escalations and the average time to close issues, allowing you to prioritize and strategize issue management.
 ### Issue Overview
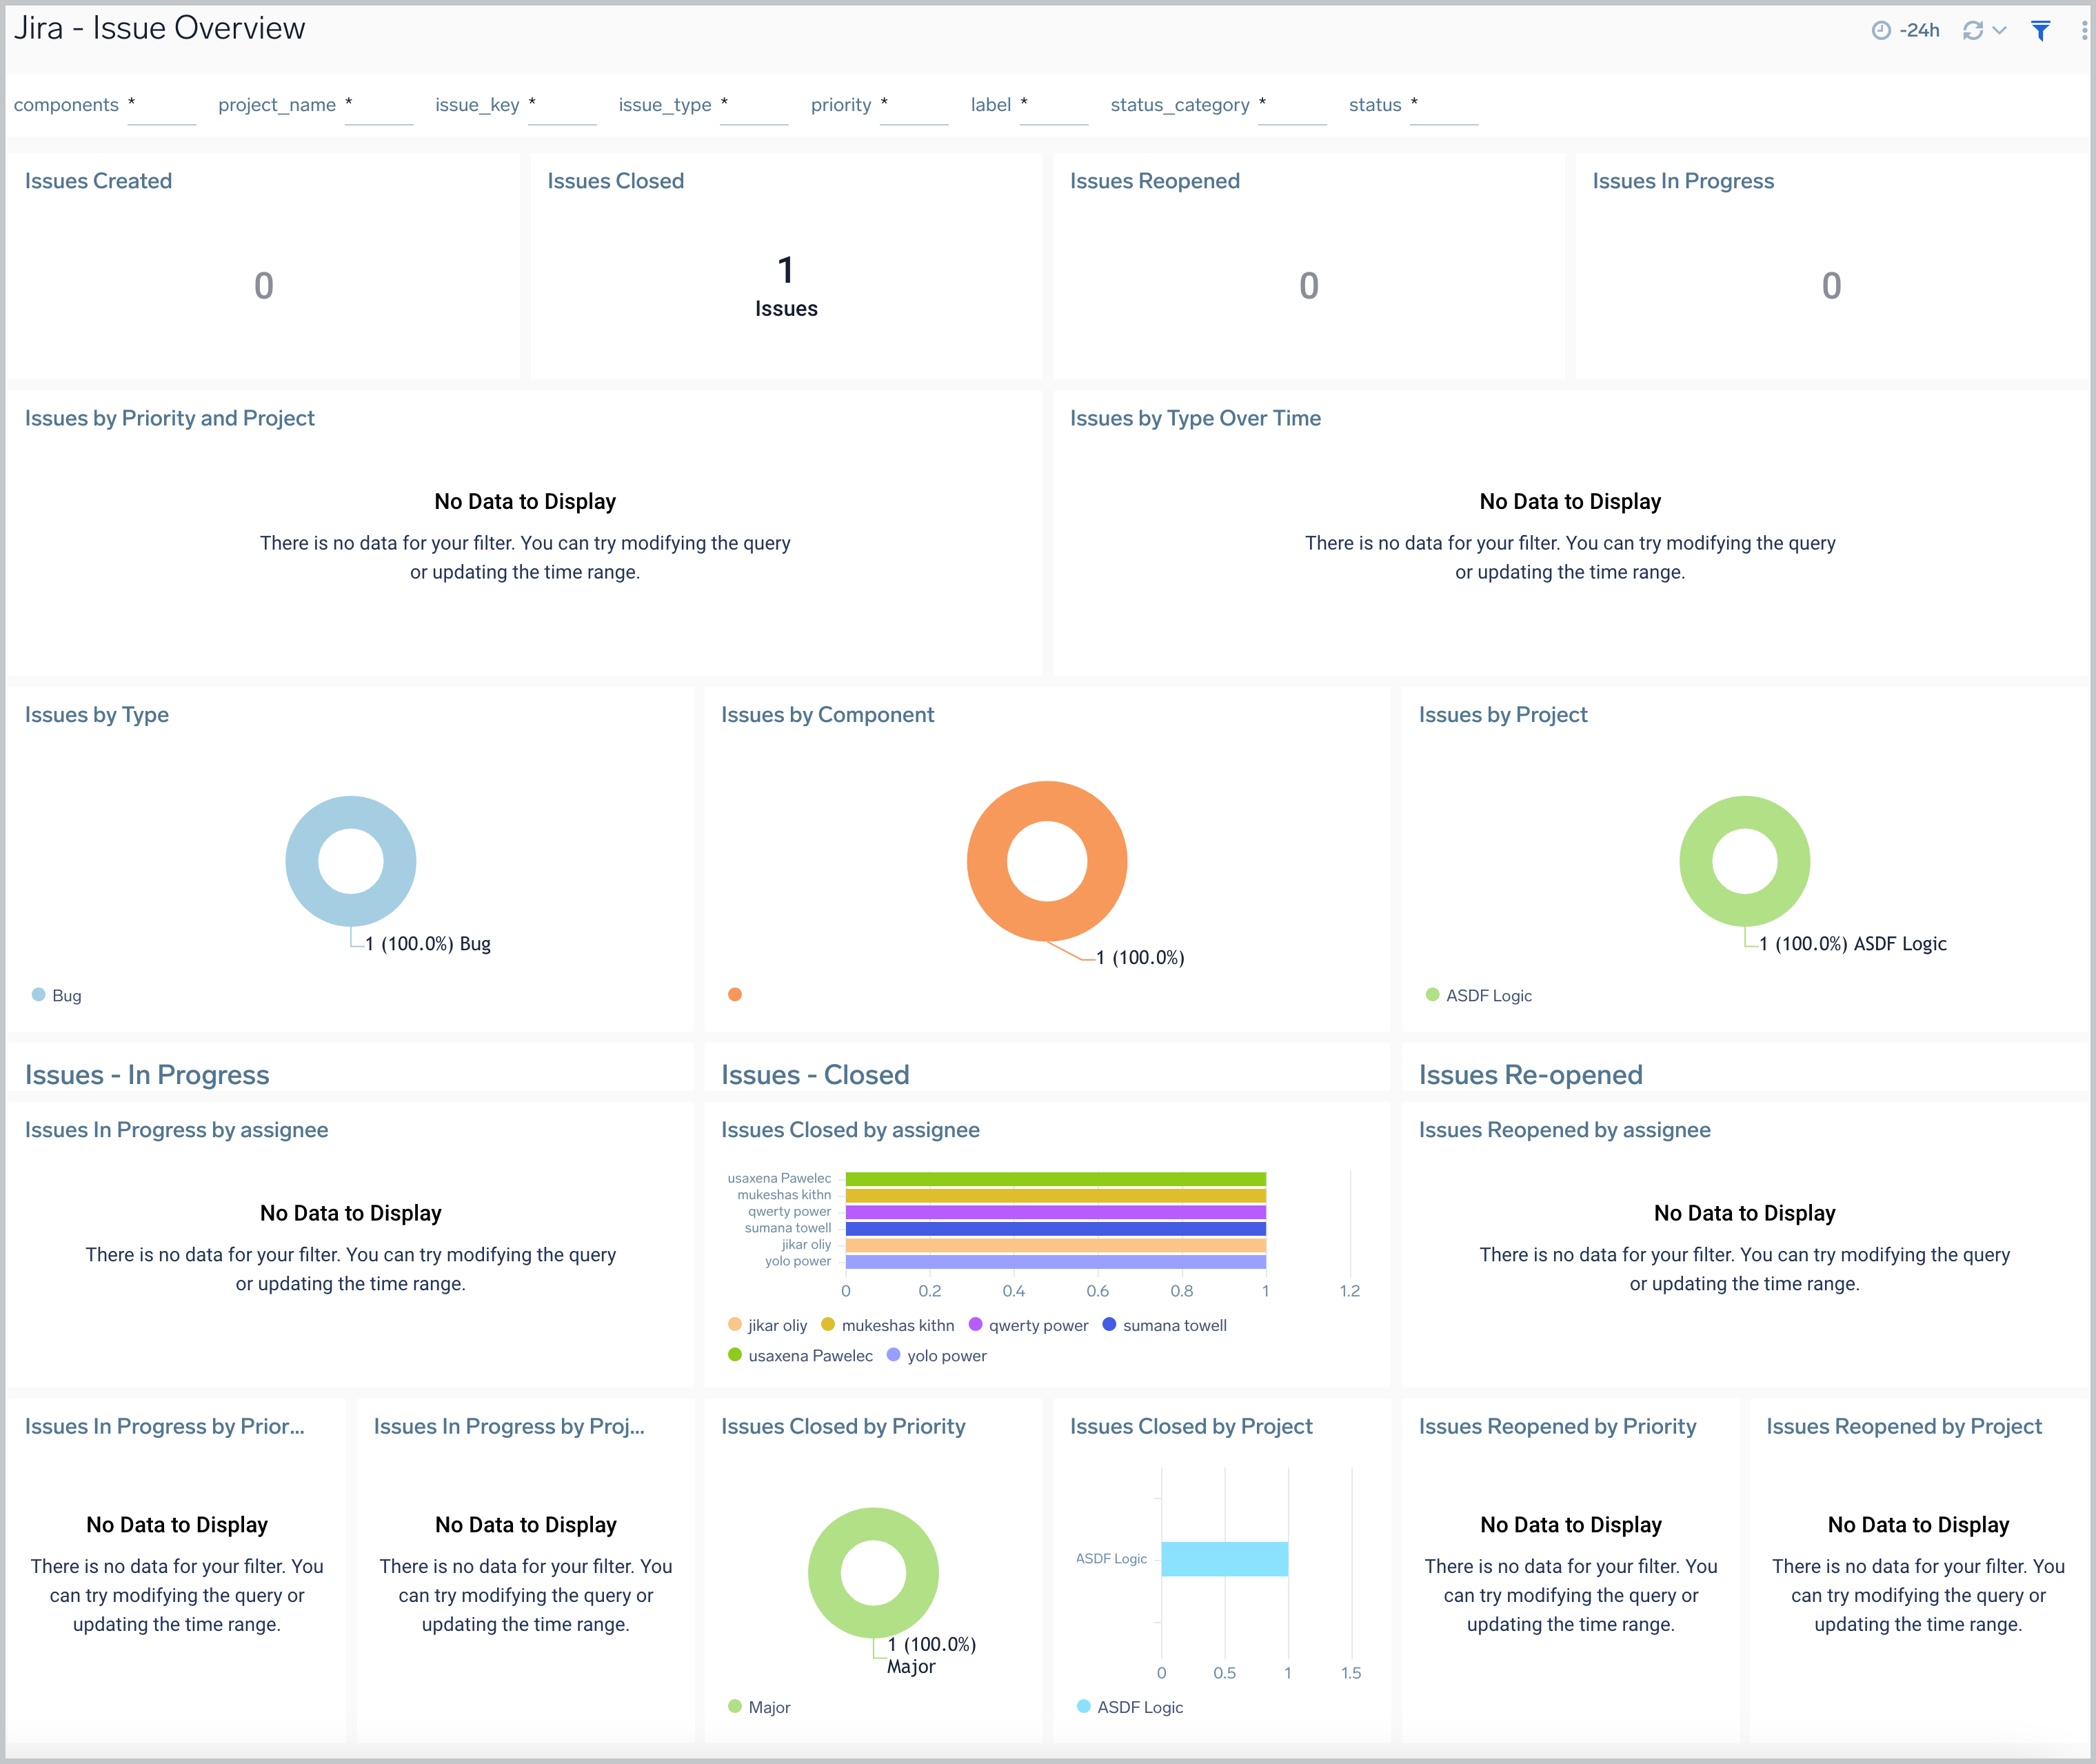
The **Jira - Issue Overview** dashboard provides a high-level view of Jira issue activities, so you can monitor work from creation to completion. The panels display analytics for issues that have been created, closed, reopened, and still in progress.
### Issue Overview
The **Jira - Issue Overview** dashboard provides a high-level view of Jira issue activities, so you can monitor work from creation to completion. The panels display analytics for issues that have been created, closed, reopened, and still in progress.
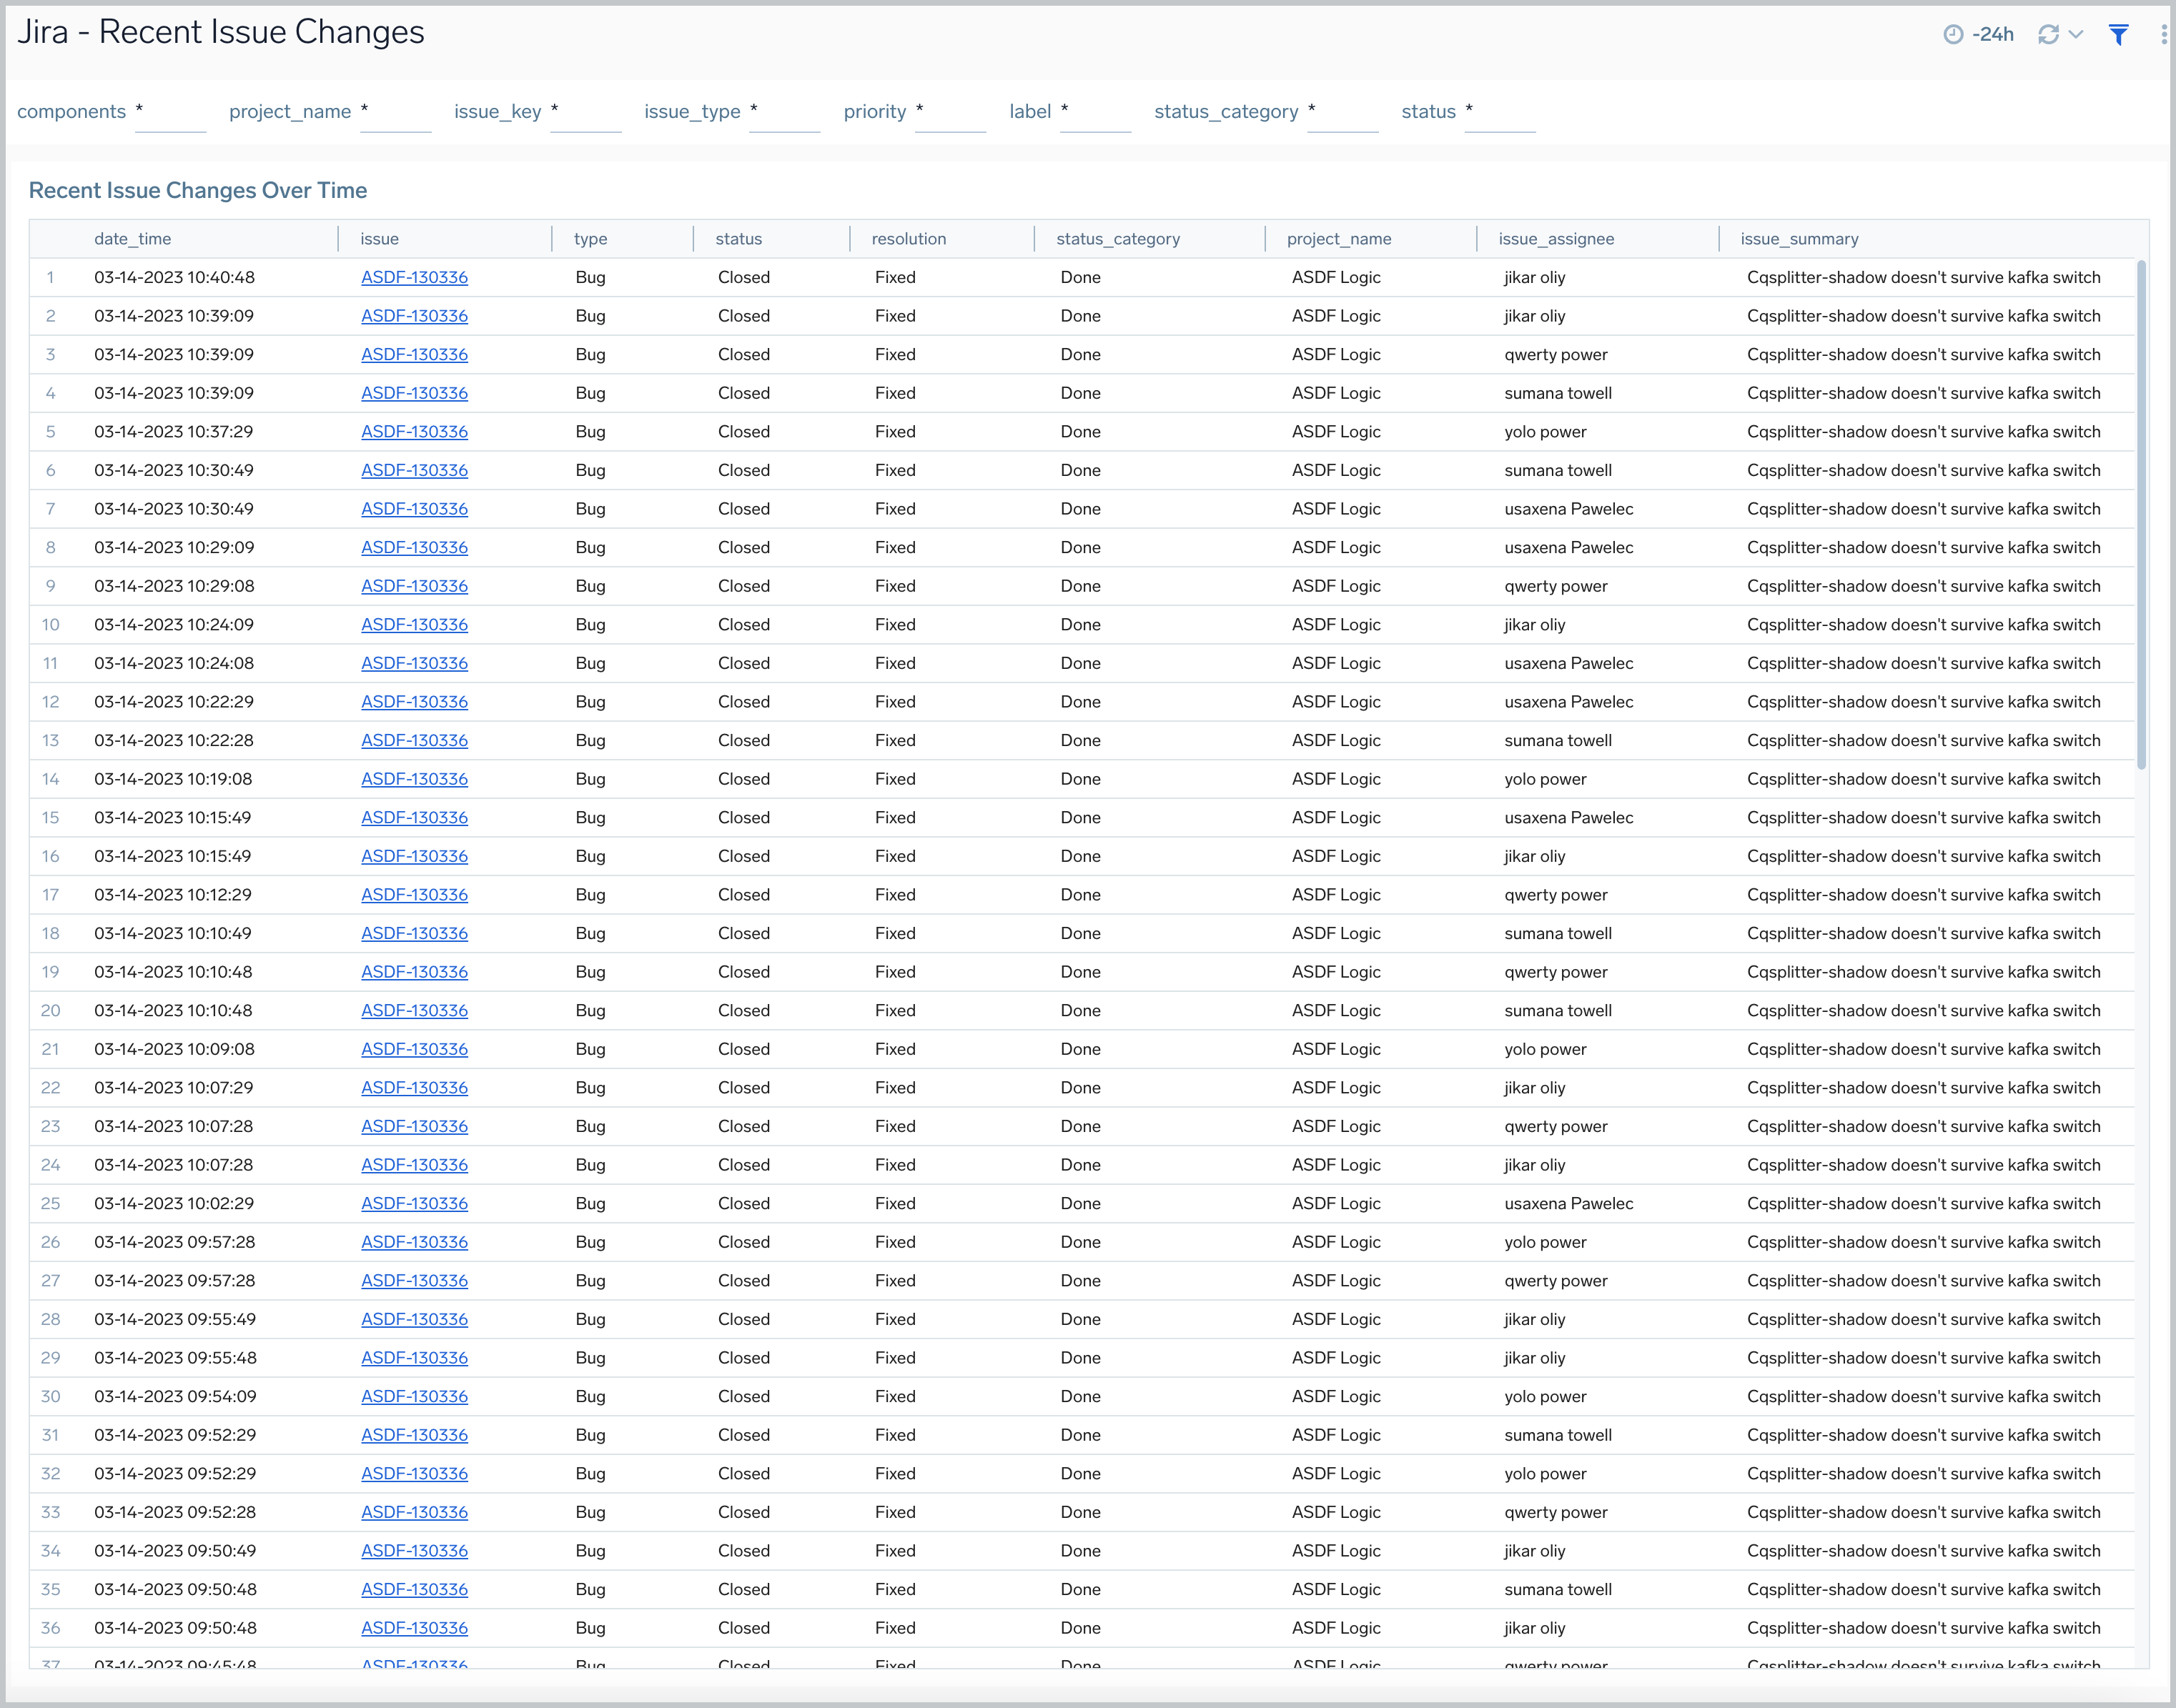
 ### Recent Issue Changes
The **Jira - Recent Issue Changes** dashboard tracks recent progress of Jira issues. You can view detailed information on the type of issue, including when it was created, its status, assignee, and a summary of the issue.
### Recent Issue Changes
The **Jira - Recent Issue Changes** dashboard tracks recent progress of Jira issues. You can view detailed information on the type of issue, including when it was created, its status, assignee, and a summary of the issue.
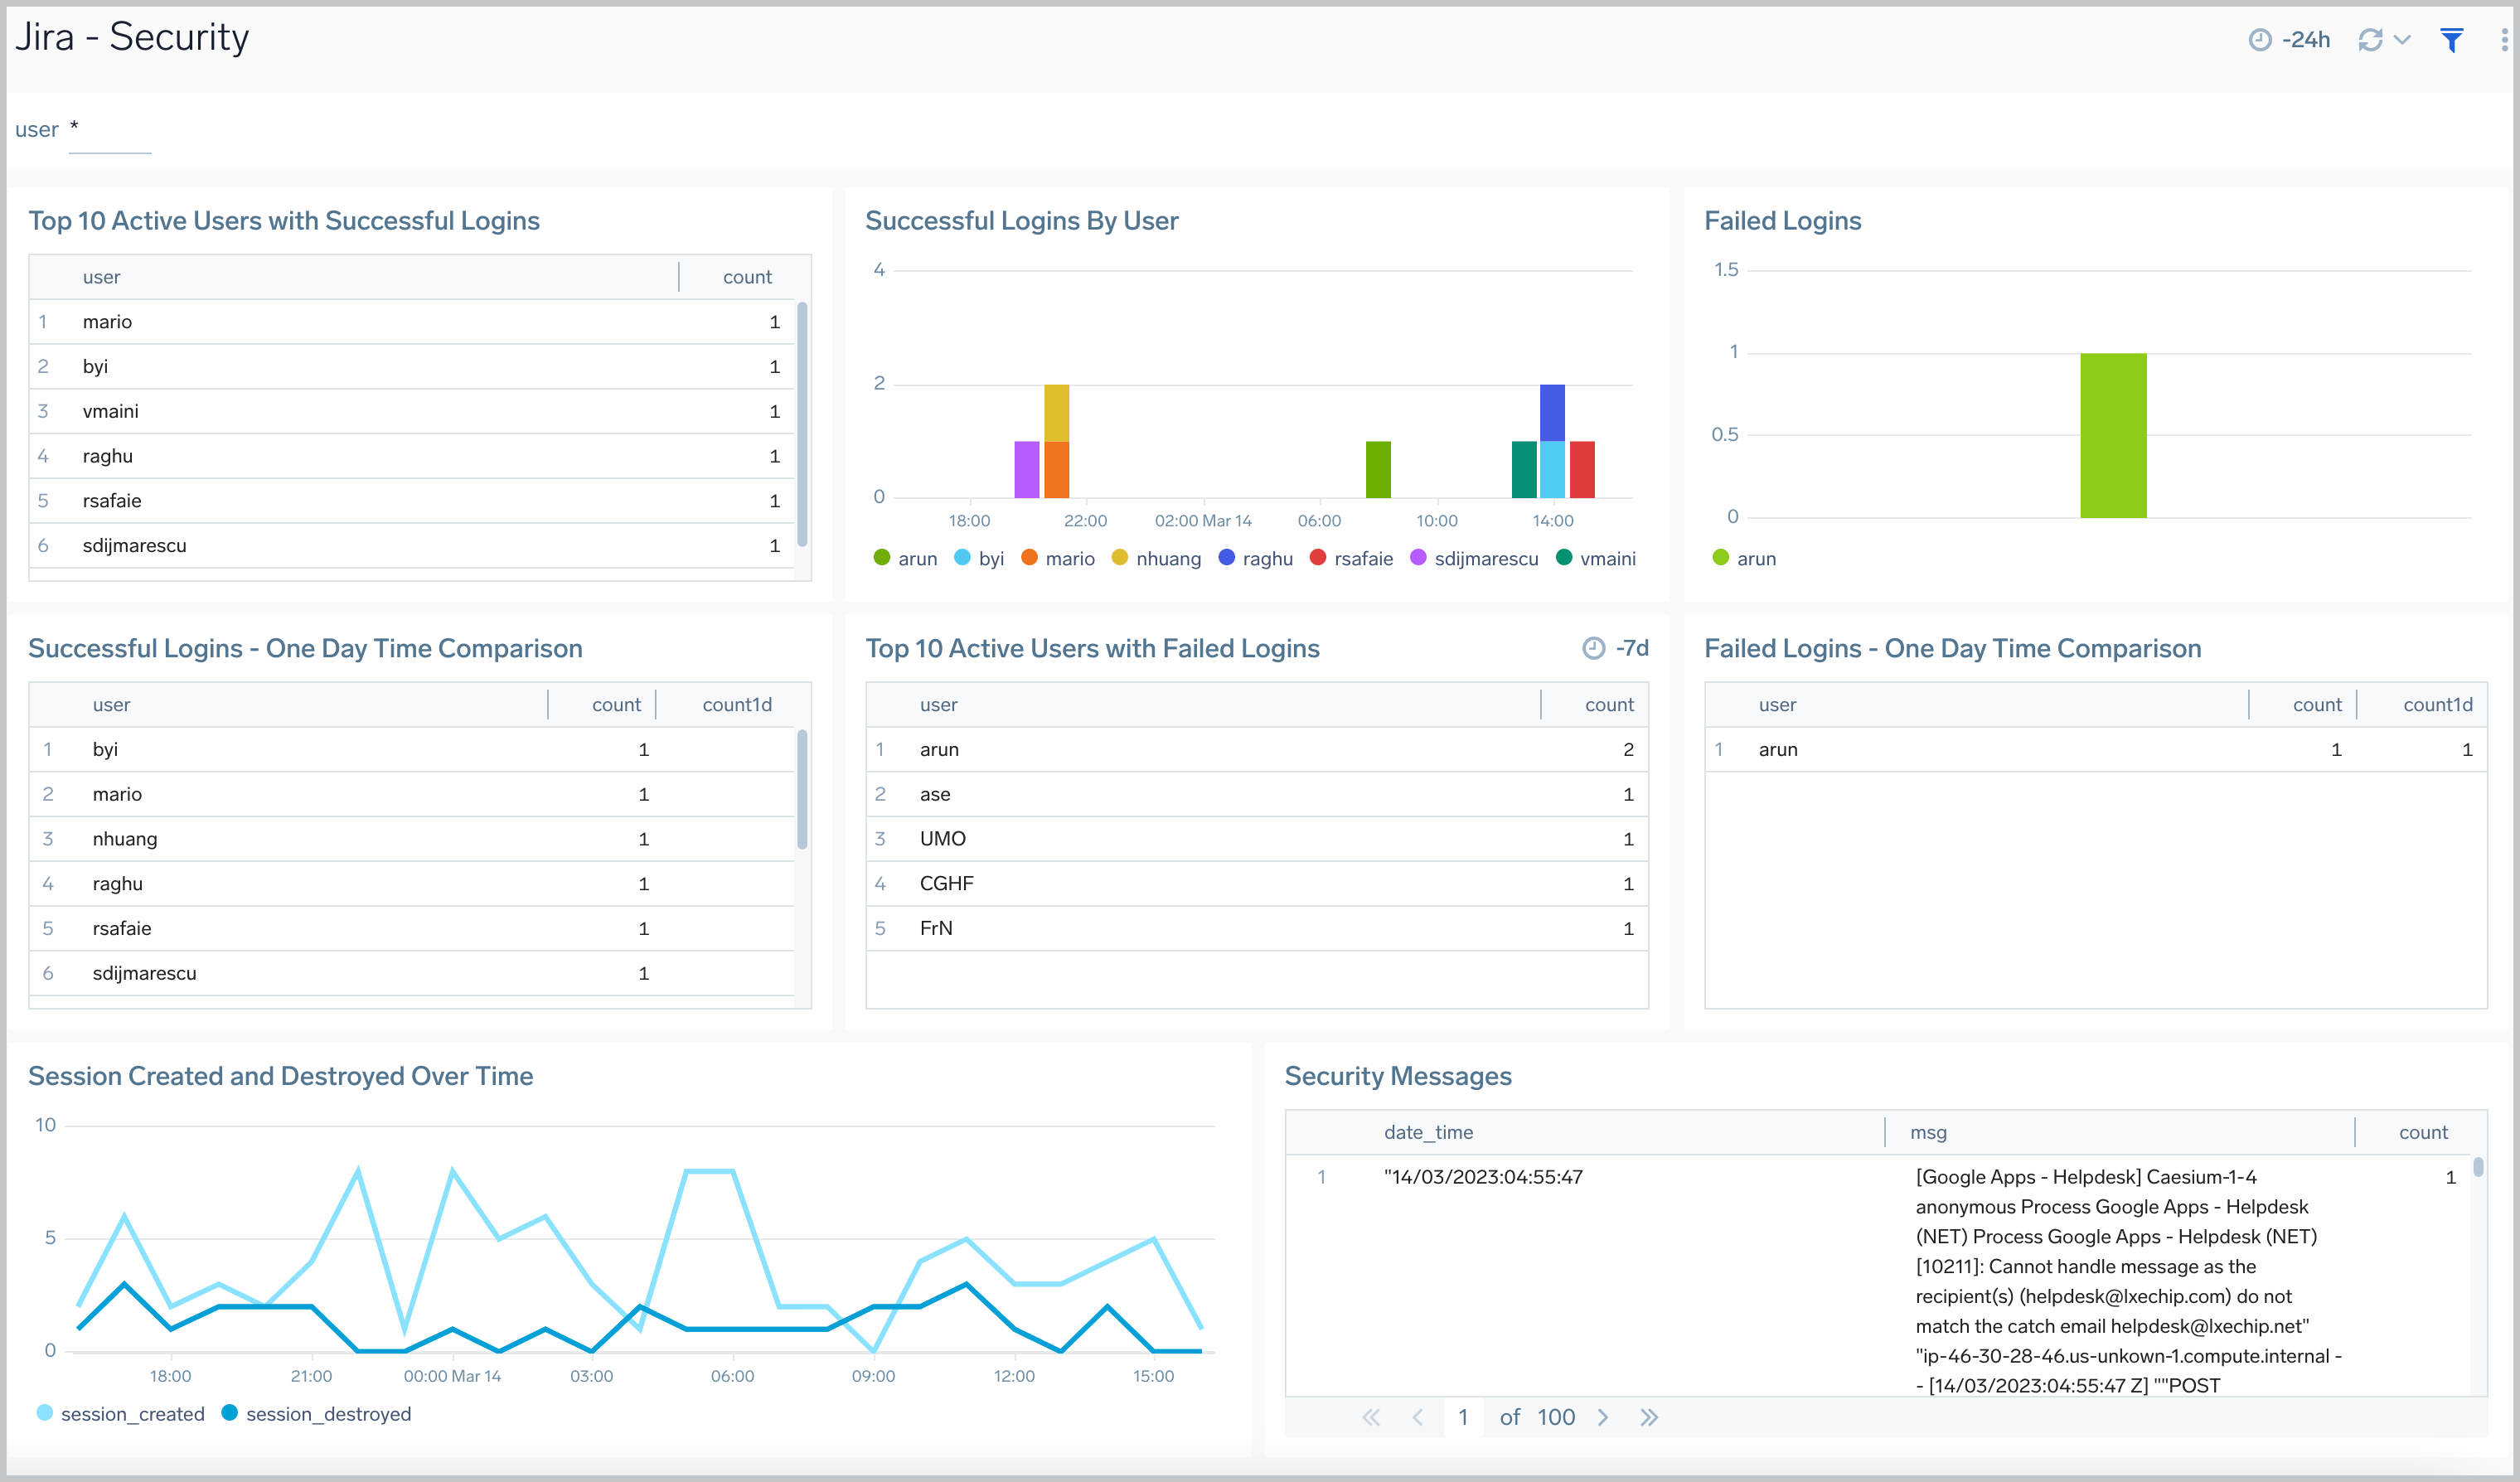
 ### Security
The **Jira - Security** dashboard provides information on security in Jira. The panels show analytics for the location of successful and failed logins, successful and failed logins for active users, comparisons of successful and failed logins, and session trends.
### Security
The **Jira - Security** dashboard provides information on security in Jira. The panels show analytics for the location of successful and failed logins, successful and failed logins for active users, comparisons of successful and failed logins, and session trends.
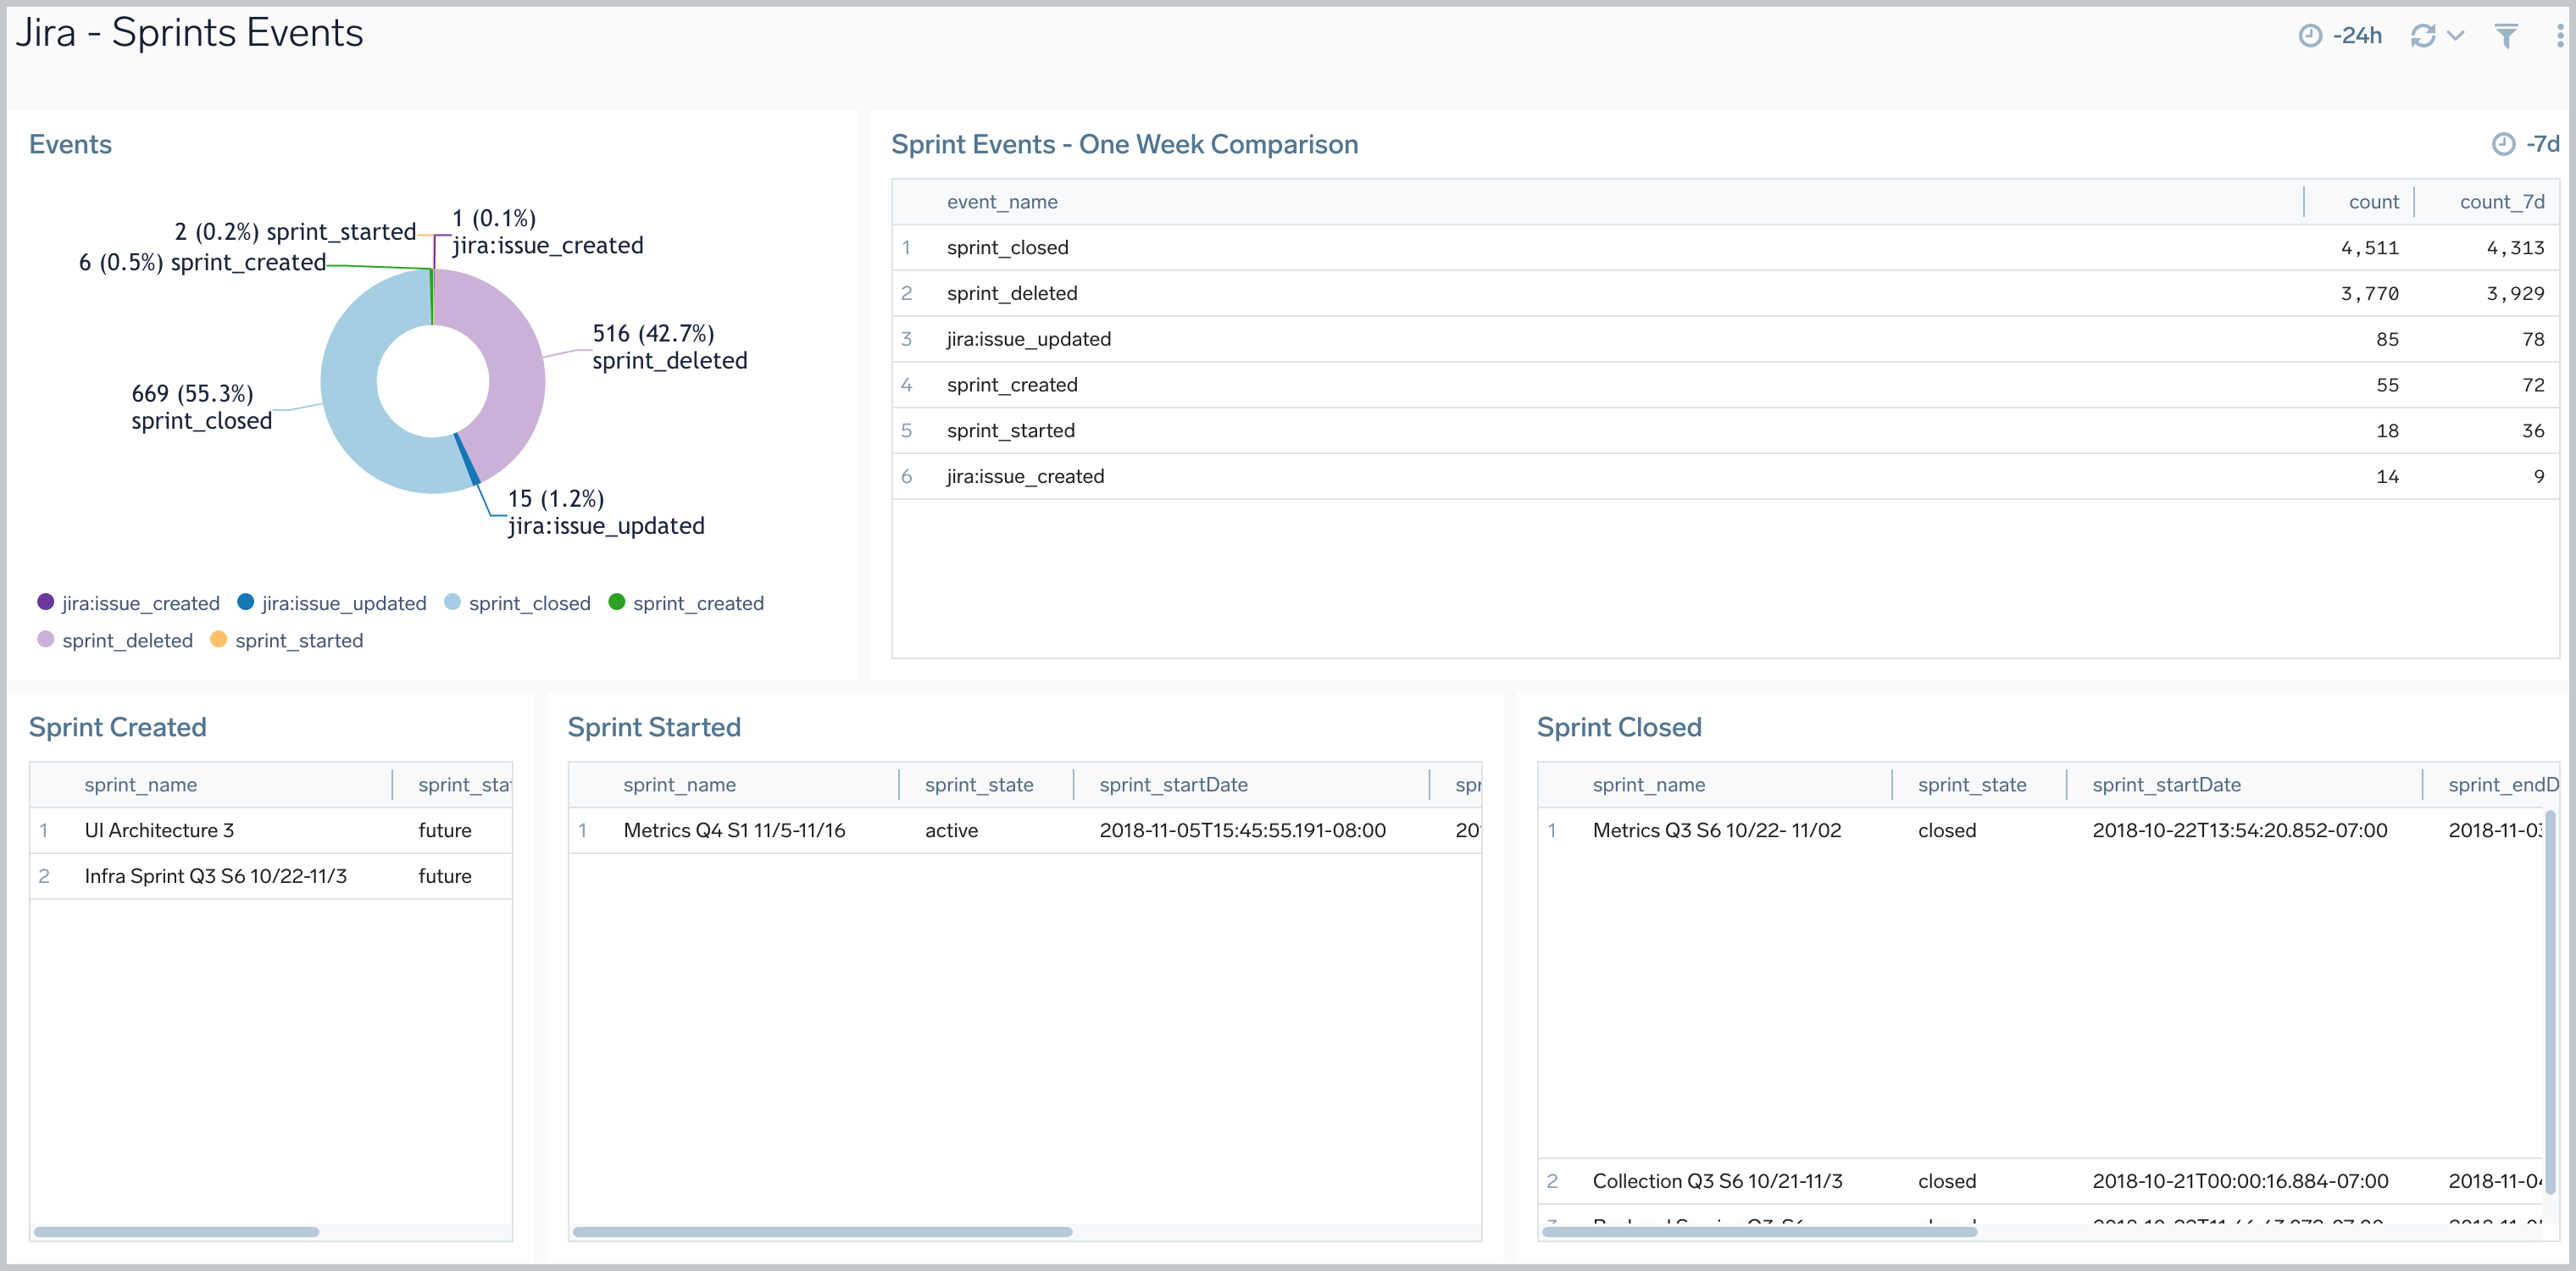
 ### Sprints Events
The **Jira - Sprints Events** dashboard provides insights on sprint events in Jira, including the number of sprint events, event trends, and sprints closed and created.
### Sprints Events
The **Jira - Sprints Events** dashboard provides insights on sprint events in Jira, including the number of sprint events, event trends, and sprints closed and created.
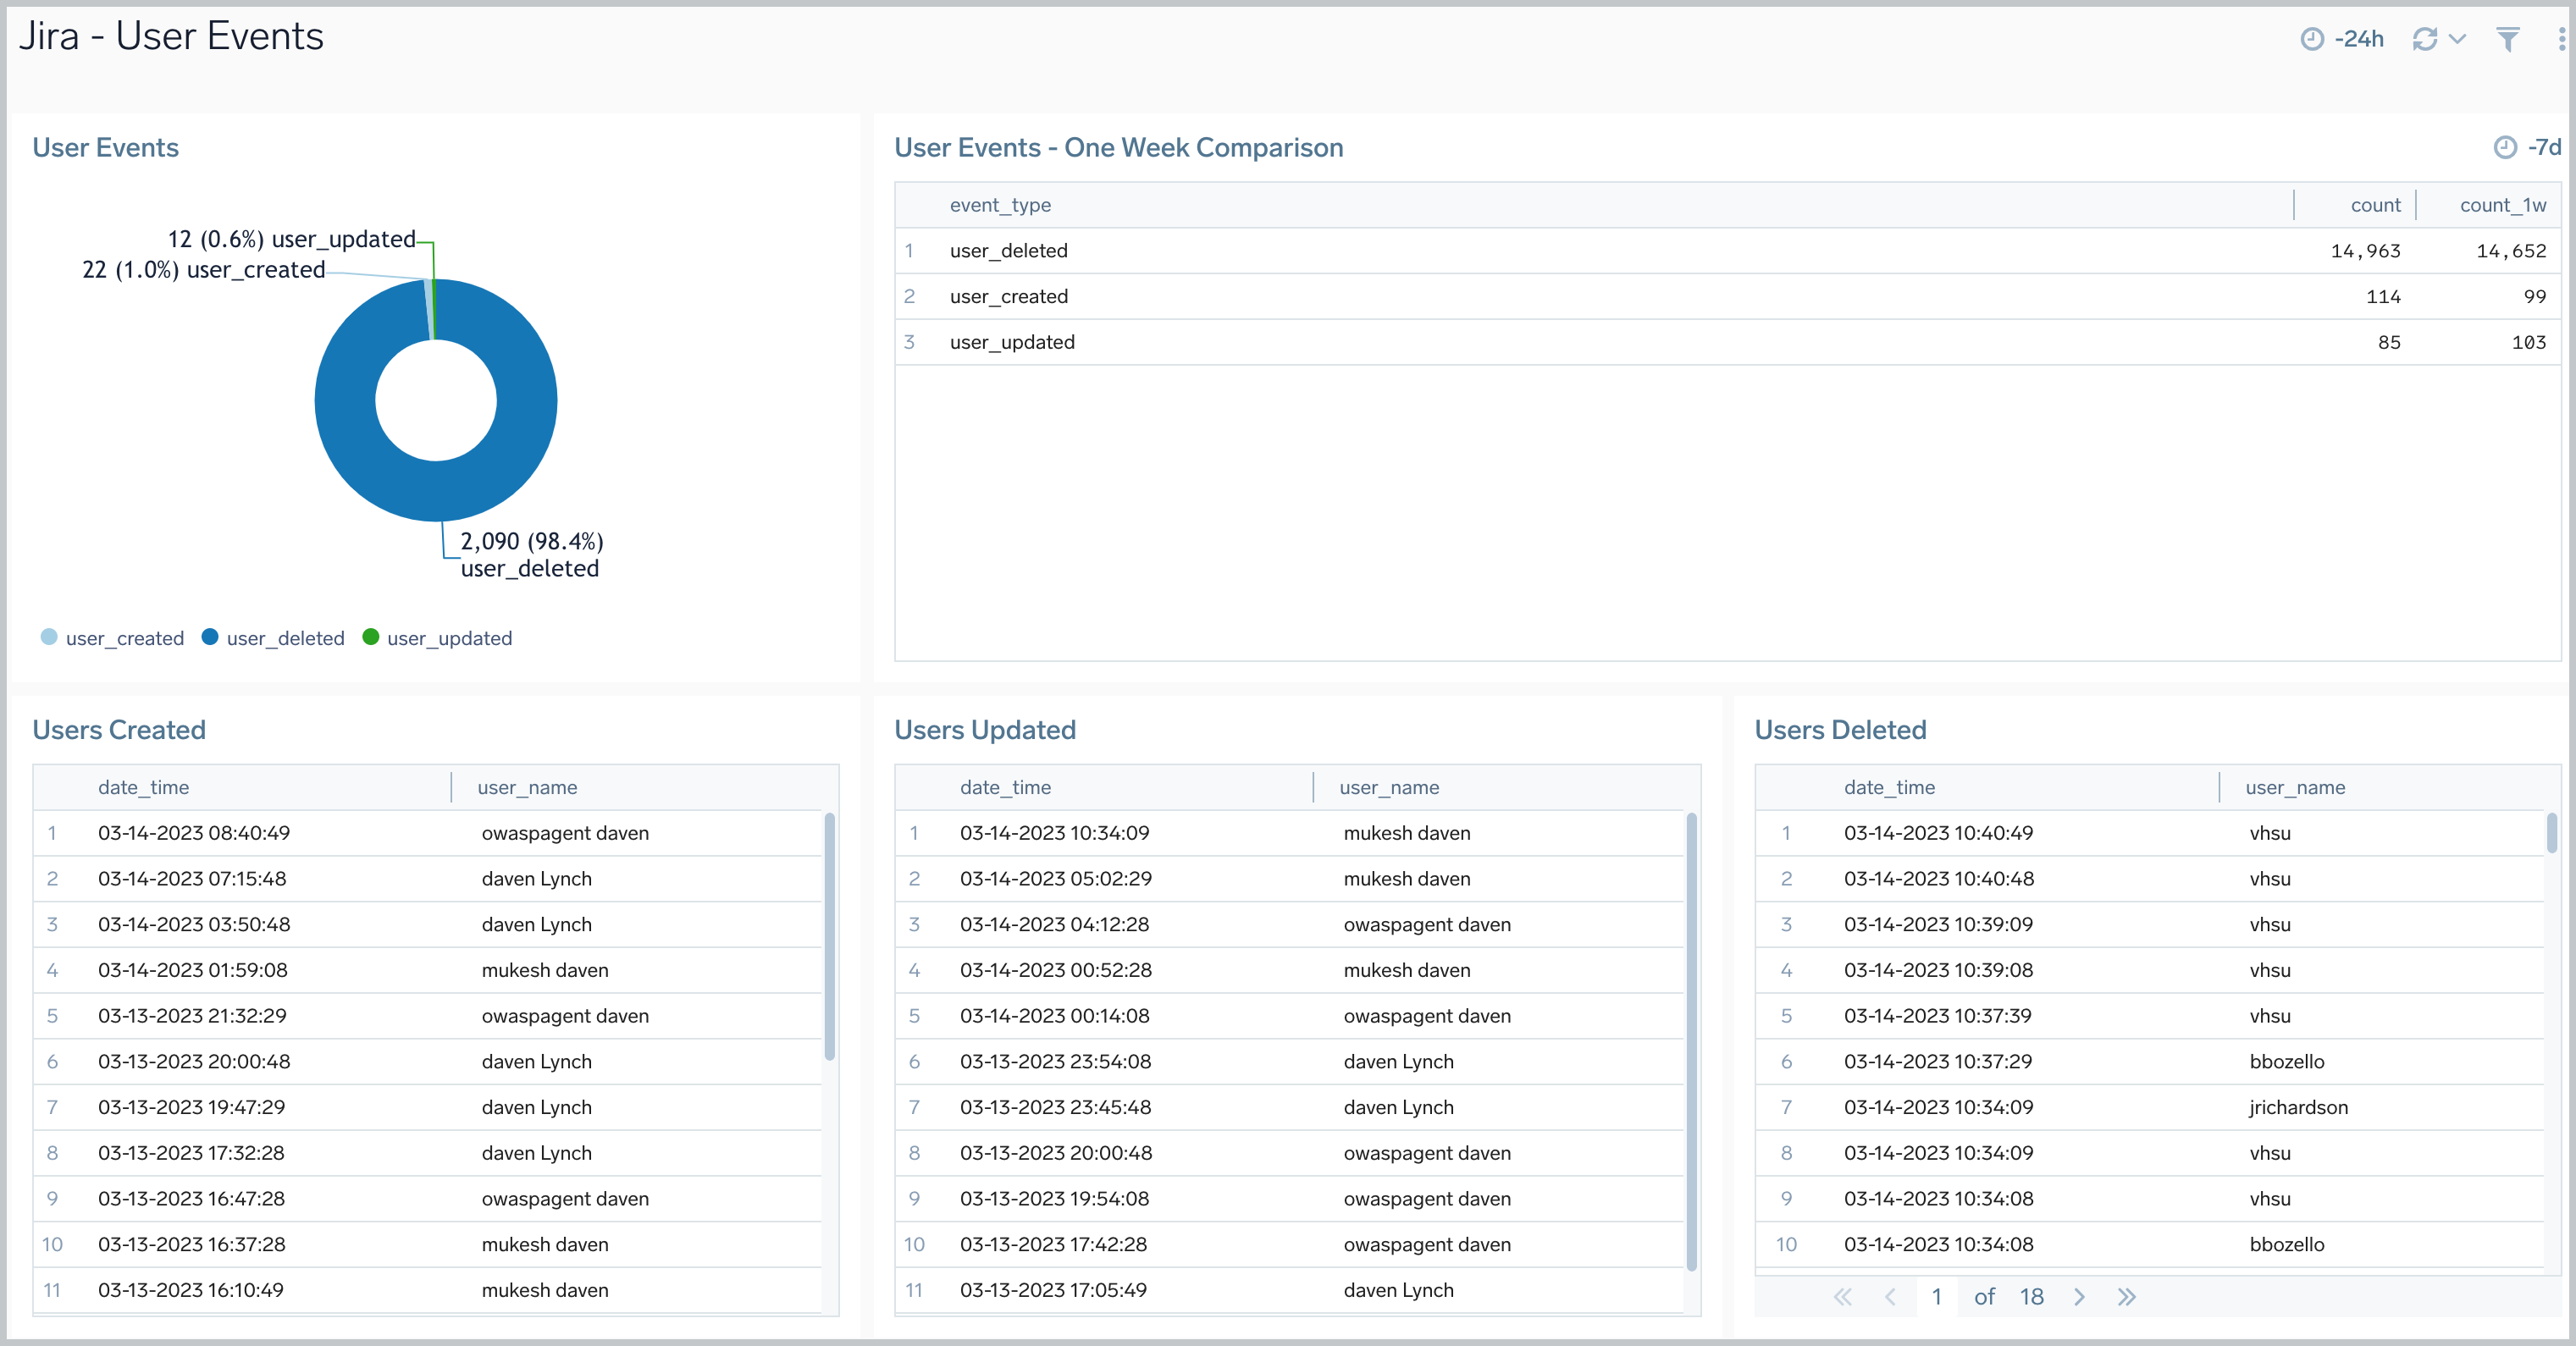
 ### User Events
The **Jira - User Events** dashboard provides information about user events in Jira, including the number of user events, trends, and users that have been updated, created, and deleted.
### User Events
The **Jira - User Events** dashboard provides information about user events in Jira, including the number of user events, trends, and users that have been updated, created, and deleted.
 ## Create monitors for Jira app
import CreateMonitors from '../../../reuse/apps/create-monitors.md';
### Jira alerts
| Name | Description | Alert Condition | Recover Condition |
|:--|:--|:--|:--|
| `Jira - Abnormal Session Creation Rate Alert` | This alert is triggered when there are unusual patterns in session creation/destruction that might indicate security issues or system problems. | Count >= 1 | Count < 1 |
| `Jira - High Average Response Time Alert` | This alert is triggered when elevated response times in Jira are detected, indicating potential performance degradation. | Count >= 5000 | Count < 5000 |
| `Jira - High HTTP 4xx Error Rate Alert` | This alert is triggered when there is increase in HTTP 4xx errors to detect service disruptions. | Count >= 50 | Count < 50 |
| `Jira - High HTTP 5xx Error Rate Alert` | This alert is triggered when there is increase in HTTP 5xx errors to detect service disruptions. | Count >= 50 | Count < 50 |
| `Jira - High Priority Issues Unassigned SLA Alert` | This alert is triggered when high-priority issues remain unassigned beyond the Default SLA threshold of 30 minutes (1800000 milliseconds). To adjust the SLA, update the value in the query to the desired time in milliseconds (e.g., 15 minutes = 900000, 1 hour = 3600000). | Count >= 1 | Count < 1 |
| `Jira - Rapid Authentication Failures Alert` | This alert is triggered when a single user experiences more than 10 failed login attempts within 5 minutes, indicating potential password guessing attempts or account lockout issues. | Count > 10 | Count \<= 10 |
## Create monitors for Jira app
import CreateMonitors from '../../../reuse/apps/create-monitors.md';
### Jira alerts
| Name | Description | Alert Condition | Recover Condition |
|:--|:--|:--|:--|
| `Jira - Abnormal Session Creation Rate Alert` | This alert is triggered when there are unusual patterns in session creation/destruction that might indicate security issues or system problems. | Count >= 1 | Count < 1 |
| `Jira - High Average Response Time Alert` | This alert is triggered when elevated response times in Jira are detected, indicating potential performance degradation. | Count >= 5000 | Count < 5000 |
| `Jira - High HTTP 4xx Error Rate Alert` | This alert is triggered when there is increase in HTTP 4xx errors to detect service disruptions. | Count >= 50 | Count < 50 |
| `Jira - High HTTP 5xx Error Rate Alert` | This alert is triggered when there is increase in HTTP 5xx errors to detect service disruptions. | Count >= 50 | Count < 50 |
| `Jira - High Priority Issues Unassigned SLA Alert` | This alert is triggered when high-priority issues remain unassigned beyond the Default SLA threshold of 30 minutes (1800000 milliseconds). To adjust the SLA, update the value in the query to the desired time in milliseconds (e.g., 15 minutes = 900000, 1 hour = 3600000). | Count >= 1 | Count < 1 |
| `Jira - Rapid Authentication Failures Alert` | This alert is triggered when a single user experiences more than 10 failed login attempts within 5 minutes, indicating potential password guessing attempts or account lockout issues. | Count > 10 | Count \<= 10 |