---
id: puppet-opentelemetry
title: Puppet - OpenTelemetry Collector
sidebar_label: Puppet - OTel Collector
description: Learn about the Sumo Logic OpenTelemetry App for Puppet.
slug: /help/docs/integrations/app-development/opentelemetry/puppet-opentelemetry/
canonical: https://www.sumologic.com/help/docs/integrations/app-development/opentelemetry/puppet-opentelemetry/
---
import useBaseUrl from '@docusaurus/useBaseUrl';
import Tabs from '@theme/Tabs';
import TabItem from '@theme/TabItem';
})
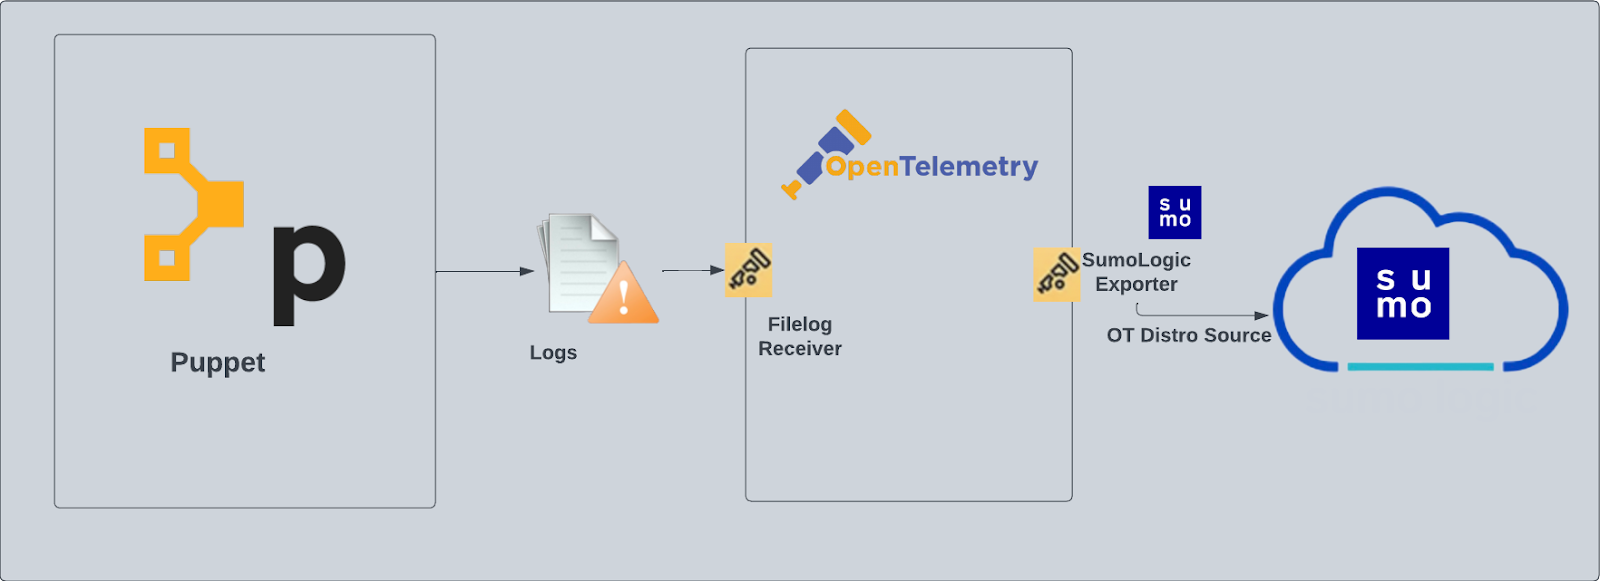
}) Puppet is a software configuration management tool. Puppet can provision infrastructure and enforce desired configurations across new and existing servers. The Sumo Logic App for Puppet helps you monitor Puppet events. Puppet logs are sent to Sumo Logic through OpenTelemetry [filelog receiver](https://github.com/open-telemetry/opentelemetry-collector-contrib/tree/main/receiver/filelogreceiver).
Puppet is a software configuration management tool. Puppet can provision infrastructure and enforce desired configurations across new and existing servers. The Sumo Logic App for Puppet helps you monitor Puppet events. Puppet logs are sent to Sumo Logic through OpenTelemetry [filelog receiver](https://github.com/open-telemetry/opentelemetry-collector-contrib/tree/main/receiver/filelogreceiver).
 ## Fields creation in Sumo Logic for Puppet
Following are the tags which will be created as part of Puppet App install if not already present.
- `sumo.datasource`. Has a fixed value of **Puppet**.
## Prerequisites
This section provides instructions for configuring log collection for Puppet running on a non-Kubernetes environment for the Sumo Logic App for Puppet. F
We use OpenTelemetry collector to gather the following data from Puppet:
- **Puppet Server logs**. For more information about the logs location, see [Puppet Server Logs](https://puppet.com/docs/puppetserver/5.3/config_file_logbackxml.html).
- **Puppet Server Access logs**. For more information about the logs location, see [Puppet Server Logs](https://puppet.com/docs/puppetserver/5.3/config_file_logbackxml.html).
- Puppet Reports. Puppet generates reports in YAML format. SumoLogic supports report format 10. This is the format of reports output by Puppet versions 5.5.3 and newer. It is backward compatible with report format 9 (in Puppet versions 5.5.0 to 5.5.2). For more information about the puppet reports, see [Puppet Reports](https://puppet.com/docs/puppet/5.5/format_report.html).
The default Puppet Server Access log file is: `/var/log/puppetlabs/puppetserver/puppetserver-access.log`. If your Puppet Server Access logs are located elsewhere, please note the path this will be used later while app installation.
Puppet reports are in YAML format. They must be converted into JSON format before Sumo ingests them. You can convert the YAML files using the Sumo-provided shell script below:
```json
MaxFileSize=20
log_file_name=puppet_rpt_conversion.log
#Get size in bytes**
file_size=`du -b puppet_rpt_conversion.log | tr -s '\t' ' ' | cut -d' ' -f1`
file_size=$(($file_size/1048576))
if [ $file_size -gt "$MaxFileSize" ];then
timestamp=`date +%s`
mv puppet_rpt_conversion.log puppet_rpt_conversion.log.$timestamp
fi
echo "YAML to JSON conversion started!!" >> "$log_file_name"
echo "Start Time: $(date)" >> "$log_file_name"
if [ ! -e last_run_date.tmp ]
then
date "+%Y-%m-%d" --date=1970-01-01 > last_run_date.tmp;
fi
find . -maxdepth 2 -type f -name "*.yaml" -newermt "$(cat last_run_date.tmp)" |
while read f;
do
if [ -s "$f" ]
then
sed 1d "$f" > tmpfile;
ruby -rjson -ryaml -e "resource_list = ''
json = JSON.generate({});data = JSON.parse(json);
obj = JSON.parse(YAML.load_file('tmpfile').to_json);
data['host'] = obj['host'];
data['time'] = obj['time'];
data['configuration_version'] = obj['configuration_version'];
data['transaction_uuid'] = obj['transaction_uuid'];
data['report_format'] = obj['report_format'];
data['puppet_version'] = obj['puppet_version'];
data['status'] = obj['status'];
data['transaction_completed'] = obj['transaction_completed'];
data['noop'] = obj['noop'];
data['noop_pending'] = obj['noop_pending'];
data['environment'] = obj['environment'];
data['metrics'] = obj['metrics'];
data['resource_list'] = resource_list;
i = 0;
obj['resource_statuses'].each{
|j|
if i == 0 then
tempdata = j[0];
else
tempdata = ',' + j[0];
end
data['resource_list'] << tempdata;
i = i + 1;
};
puts data.to_json;
obj['resource_statuses'].each{
|y| logsres = y[1];
logsres['transaction_uuid'] = obj['transaction_uuid'];
logsres['environment'] = obj['environment'];
logsres['host'] = obj['host'];
puts logsres.to_json;
};
obj['logs'].each {
|x|logsjson = x;
logsjson['host'] = obj['host'];
logsjson['transaction_uuid'] = obj['transaction_uuid'];
logsjson['environment'] = obj['environment'];
puts logsjson.to_json
};"
echo "$f conversion status:" $? >> "$log_file_name"
date "+%d-%b-%Y %H:%M:%S" > last_run_date.tmp
fi
done
echo "Conversion Completed. End Time: $(date)" >> "$log_file_name"
```
Copy this script to `/opt/puppetlabs/server/data/puppetserver/reports` with the name `puppetReport.sh`. If Puppet is installed in a different location, copy the script to the correct path.
Configure a cron job to trigger the python script using crontab. Frequency of this job can be set following the instructions from [here](https://www.python-engineer.com/posts/cron-jobs-for-python/#crontab). Here is the command which needs to be configured as part of cron to trigger the script:
```sh
/opt/puppetlabs/server/data/puppetserver/reports/puppetReport.sh
```
Please modify the location of the `puppetReport.sh` if required in the above command. The execution of the script above will generate a log file named `puppet_rpt_conversion.log`. The path to this log file needs to be provided during the app installation.
import LogsCollectionPrereqisites from '../../../reuse/apps/logs-collection-prereqisites.md';
For Windows systems, log files which are collected should be accessible by the SYSTEM group. Use the following set of PowerShell commands if the SYSTEM group does not have access.
```
$NewAcl = Get-Acl -Path ""
# Set properties
$identity = "NT AUTHORITY\SYSTEM"
$fileSystemRights = "ReadAndExecute"
$type = "Allow"
# Create new rule
$fileSystemAccessRuleArgumentList = $identity, $fileSystemRights, $type
$fileSystemAccessRule = New-Object -TypeName System.Security.AccessControl.FileSystemAccessRule -ArgumentList $fileSystemAccessRuleArgumentList
# Apply new rule
$NewAcl.SetAccessRule($fileSystemAccessRule)
Set-Acl -Path "" -AclObject $NewAcl
```
## Collection configuration and app installation
import ConfigAppInstall from '../../../reuse/apps/opentelemetry/config-app-install.md';
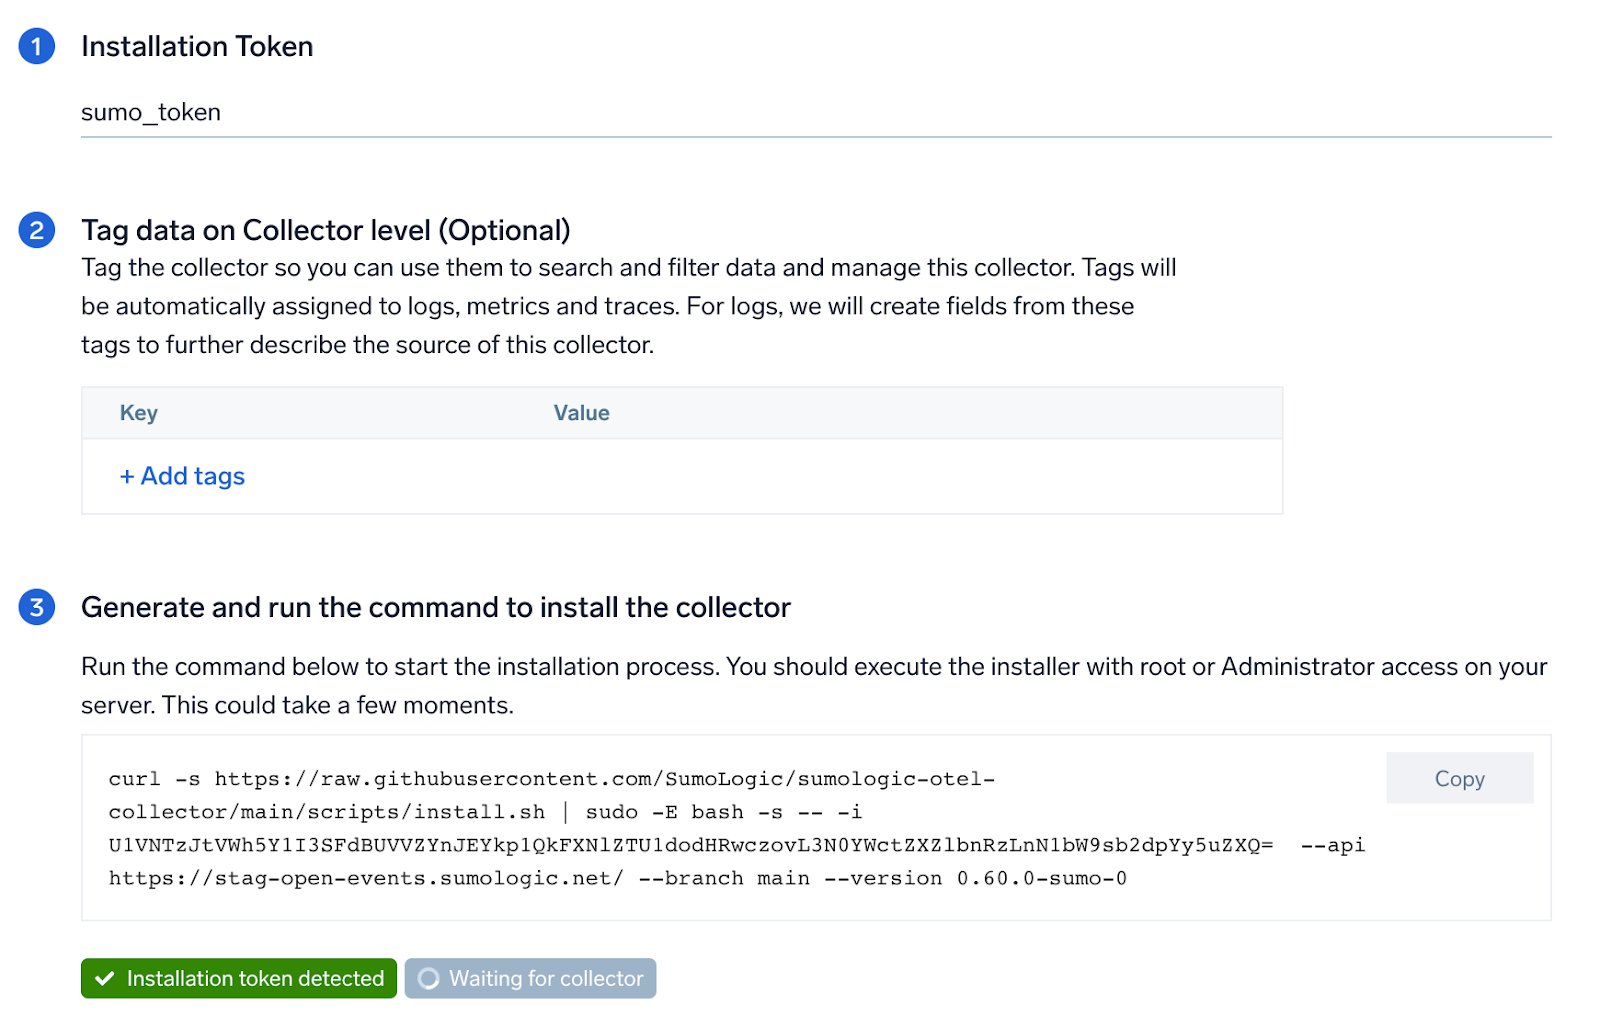
### Step 1: Set up Collector
import SetupColl from '../../../reuse/apps/opentelemetry/set-up-collector.md';
## Fields creation in Sumo Logic for Puppet
Following are the tags which will be created as part of Puppet App install if not already present.
- `sumo.datasource`. Has a fixed value of **Puppet**.
## Prerequisites
This section provides instructions for configuring log collection for Puppet running on a non-Kubernetes environment for the Sumo Logic App for Puppet. F
We use OpenTelemetry collector to gather the following data from Puppet:
- **Puppet Server logs**. For more information about the logs location, see [Puppet Server Logs](https://puppet.com/docs/puppetserver/5.3/config_file_logbackxml.html).
- **Puppet Server Access logs**. For more information about the logs location, see [Puppet Server Logs](https://puppet.com/docs/puppetserver/5.3/config_file_logbackxml.html).
- Puppet Reports. Puppet generates reports in YAML format. SumoLogic supports report format 10. This is the format of reports output by Puppet versions 5.5.3 and newer. It is backward compatible with report format 9 (in Puppet versions 5.5.0 to 5.5.2). For more information about the puppet reports, see [Puppet Reports](https://puppet.com/docs/puppet/5.5/format_report.html).
The default Puppet Server Access log file is: `/var/log/puppetlabs/puppetserver/puppetserver-access.log`. If your Puppet Server Access logs are located elsewhere, please note the path this will be used later while app installation.
Puppet reports are in YAML format. They must be converted into JSON format before Sumo ingests them. You can convert the YAML files using the Sumo-provided shell script below:
```json
MaxFileSize=20
log_file_name=puppet_rpt_conversion.log
#Get size in bytes**
file_size=`du -b puppet_rpt_conversion.log | tr -s '\t' ' ' | cut -d' ' -f1`
file_size=$(($file_size/1048576))
if [ $file_size -gt "$MaxFileSize" ];then
timestamp=`date +%s`
mv puppet_rpt_conversion.log puppet_rpt_conversion.log.$timestamp
fi
echo "YAML to JSON conversion started!!" >> "$log_file_name"
echo "Start Time: $(date)" >> "$log_file_name"
if [ ! -e last_run_date.tmp ]
then
date "+%Y-%m-%d" --date=1970-01-01 > last_run_date.tmp;
fi
find . -maxdepth 2 -type f -name "*.yaml" -newermt "$(cat last_run_date.tmp)" |
while read f;
do
if [ -s "$f" ]
then
sed 1d "$f" > tmpfile;
ruby -rjson -ryaml -e "resource_list = ''
json = JSON.generate({});data = JSON.parse(json);
obj = JSON.parse(YAML.load_file('tmpfile').to_json);
data['host'] = obj['host'];
data['time'] = obj['time'];
data['configuration_version'] = obj['configuration_version'];
data['transaction_uuid'] = obj['transaction_uuid'];
data['report_format'] = obj['report_format'];
data['puppet_version'] = obj['puppet_version'];
data['status'] = obj['status'];
data['transaction_completed'] = obj['transaction_completed'];
data['noop'] = obj['noop'];
data['noop_pending'] = obj['noop_pending'];
data['environment'] = obj['environment'];
data['metrics'] = obj['metrics'];
data['resource_list'] = resource_list;
i = 0;
obj['resource_statuses'].each{
|j|
if i == 0 then
tempdata = j[0];
else
tempdata = ',' + j[0];
end
data['resource_list'] << tempdata;
i = i + 1;
};
puts data.to_json;
obj['resource_statuses'].each{
|y| logsres = y[1];
logsres['transaction_uuid'] = obj['transaction_uuid'];
logsres['environment'] = obj['environment'];
logsres['host'] = obj['host'];
puts logsres.to_json;
};
obj['logs'].each {
|x|logsjson = x;
logsjson['host'] = obj['host'];
logsjson['transaction_uuid'] = obj['transaction_uuid'];
logsjson['environment'] = obj['environment'];
puts logsjson.to_json
};"
echo "$f conversion status:" $? >> "$log_file_name"
date "+%d-%b-%Y %H:%M:%S" > last_run_date.tmp
fi
done
echo "Conversion Completed. End Time: $(date)" >> "$log_file_name"
```
Copy this script to `/opt/puppetlabs/server/data/puppetserver/reports` with the name `puppetReport.sh`. If Puppet is installed in a different location, copy the script to the correct path.
Configure a cron job to trigger the python script using crontab. Frequency of this job can be set following the instructions from [here](https://www.python-engineer.com/posts/cron-jobs-for-python/#crontab). Here is the command which needs to be configured as part of cron to trigger the script:
```sh
/opt/puppetlabs/server/data/puppetserver/reports/puppetReport.sh
```
Please modify the location of the `puppetReport.sh` if required in the above command. The execution of the script above will generate a log file named `puppet_rpt_conversion.log`. The path to this log file needs to be provided during the app installation.
import LogsCollectionPrereqisites from '../../../reuse/apps/logs-collection-prereqisites.md';
For Windows systems, log files which are collected should be accessible by the SYSTEM group. Use the following set of PowerShell commands if the SYSTEM group does not have access.
```
$NewAcl = Get-Acl -Path ""
# Set properties
$identity = "NT AUTHORITY\SYSTEM"
$fileSystemRights = "ReadAndExecute"
$type = "Allow"
# Create new rule
$fileSystemAccessRuleArgumentList = $identity, $fileSystemRights, $type
$fileSystemAccessRule = New-Object -TypeName System.Security.AccessControl.FileSystemAccessRule -ArgumentList $fileSystemAccessRuleArgumentList
# Apply new rule
$NewAcl.SetAccessRule($fileSystemAccessRule)
Set-Acl -Path "" -AclObject $NewAcl
```
## Collection configuration and app installation
import ConfigAppInstall from '../../../reuse/apps/opentelemetry/config-app-install.md';
### Step 1: Set up Collector
import SetupColl from '../../../reuse/apps/opentelemetry/set-up-collector.md';
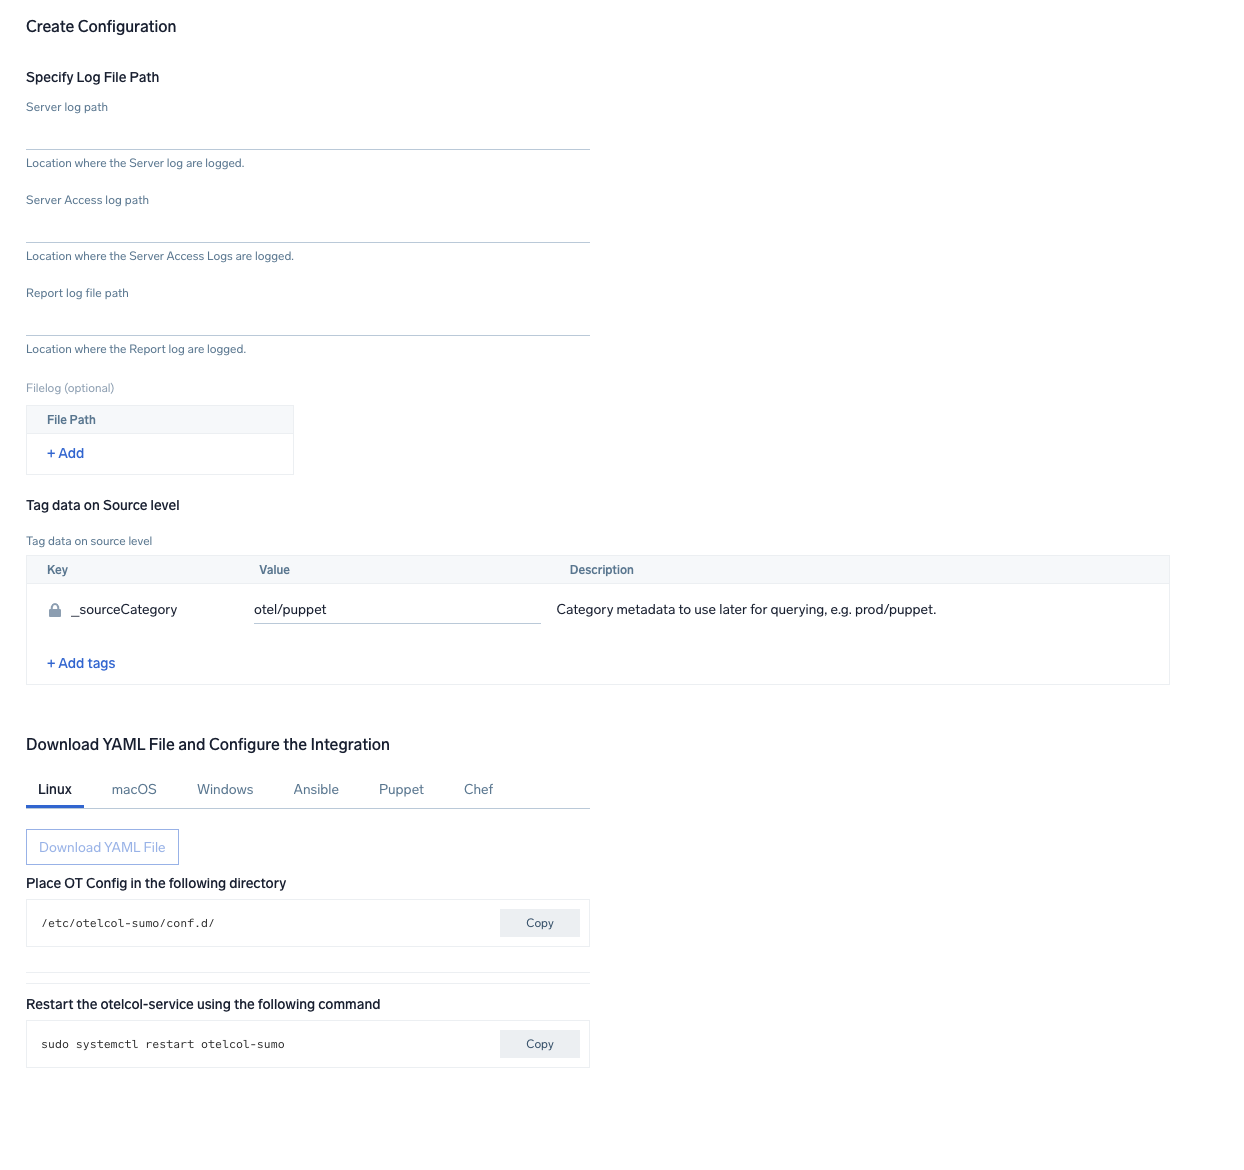
 ### Step 2: Configure integration
In this step, you will configure the yaml required for Puppet collection.
Path of the log file configured to capture puppet access logs and puppet report are needed to be given here. Refer to the Prerequisites section of this document.
Click on the **Download YAML File** button to get the yaml file.
import CollectorVersionNote from '../../../reuse/apps/opentelemetry/collector-version-note.md';
### Step 2: Configure integration
In this step, you will configure the yaml required for Puppet collection.
Path of the log file configured to capture puppet access logs and puppet report are needed to be given here. Refer to the Prerequisites section of this document.
Click on the **Download YAML File** button to get the yaml file.
import CollectorVersionNote from '../../../reuse/apps/opentelemetry/collector-version-note.md';
 ### Step 3: Send logs to Sumo Logic
import LogsIntro from '../../../reuse/apps/opentelemetry/send-logs-intro.md';
1. Copy the yaml file to `/etc/otelcol-sumo/conf.d/` folder in the Puppet instance that needs to be monitored.
2. Place your Env file in the following directory:
```sh
/etc/otelcol-sumo/env/
```
3. Restart the collector using:
```sh
sudo systemctl restart otelcol-sumo
```
1. Copy the yaml file to `C:\ProgramData\Sumo Logic\OpenTelemetry Collector\config\conf.d` folder in the machine that needs to be monitored.
2. Restart the collector using:
```sh
Restart-Service -Name OtelcolSumo
```
1. Copy the yaml file to `/etc/otelcol-sumo/conf.d/` folder in the Puppet instance that needs to be monitored.
2. Restart the otelcol-sumo process using:
```sh
otelcol-sumo --config /etc/otelcol-sumo/sumologic.yaml --config "glob:/etc/otelcol-sumo/conf.d/*.yaml"
```
import ChefNoEnv from '../../../reuse/apps/opentelemetry/chef-without-env.md';
import AnsibleNoEnv from '../../../reuse/apps/opentelemetry/ansible-without-env.md';
import PuppetNoEnv from '../../../reuse/apps/opentelemetry/puppet-without-env.md';
import LogsOutro from '../../../reuse/apps/opentelemetry/send-logs-outro.md';
## Sample log messages
This is a sample log message for non-Kubernetes environments.
```sql
5.35.225.115 - - [2023-01-16 06:49:18.751 +0000] "POST /puppet/v3/file_content/plugins/facter/sources_dir_exists_win.rb?environment=production& HTTP/1.1" 500 4484 "-" "Puppet/5.5.2 Ruby/2.4.4-p296 (x86_64-linux)" 5
```
## Sample queries
This sample query is from the **Puppet - Overview** dashboard > **Node Requests Summary Over Time** panel.
```sumo
%"sumo.datasource"=puppet
| parse regex "^(?\d{1,3}\.\d{1,3}\.\d{1,3}\.\d{1,3})" nodrop
| parse regex "(?[A-Z]+)\s(?\S+)\sHTTP/[\d\.]+\"\s(?\d+)\s(?[\d-]+)\s\"(?.*?)\"\s\"(?.+?)\".*"
| if(status_code matches "2*", 1, 0) as successes
| if(status_code matches "3*", 1, 0) as redirects
| if(status_code matches "4*", 1, 0) as client_errors
| if(status_code matches "5*", 1, 0) as server_errors
| timeslice by 1h
| sum(successes) as successes, sum(redirects) as redirects, sum(client_errors) as client_errors, sum(server_errors) as server_errors by _timeslice
```
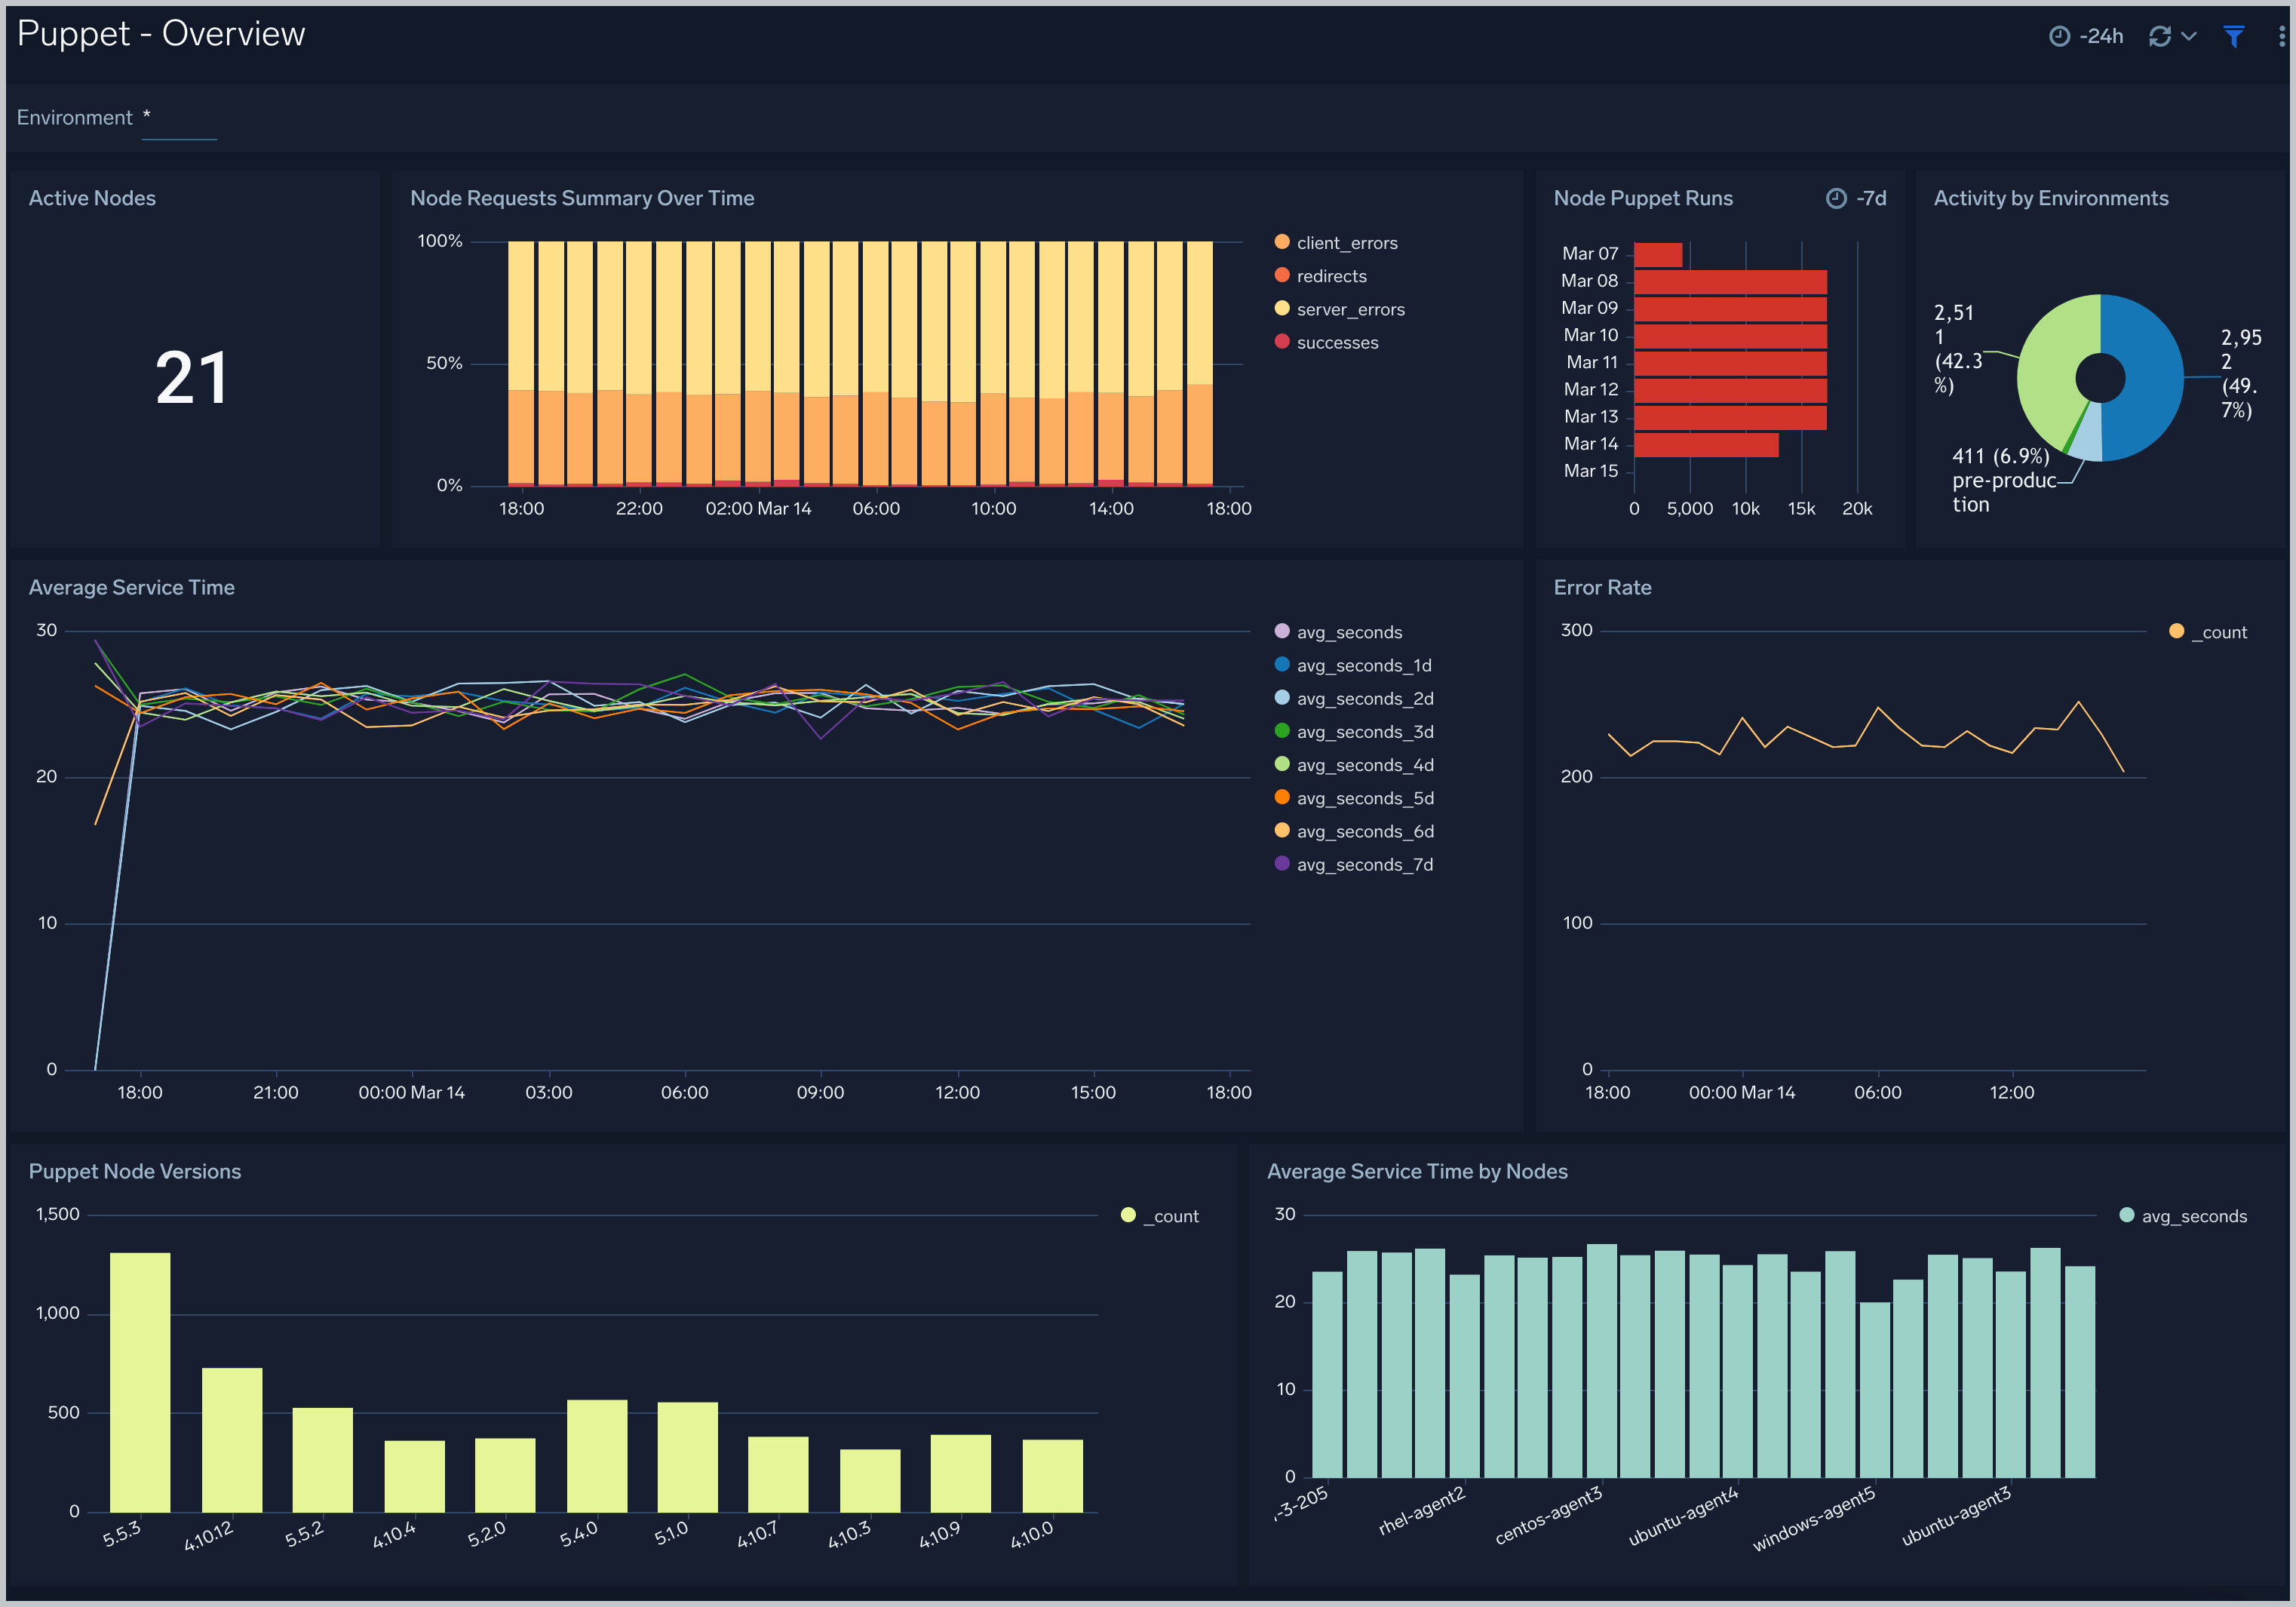
## Viewing Puppet Dashboards
### Overview
### Step 3: Send logs to Sumo Logic
import LogsIntro from '../../../reuse/apps/opentelemetry/send-logs-intro.md';
1. Copy the yaml file to `/etc/otelcol-sumo/conf.d/` folder in the Puppet instance that needs to be monitored.
2. Place your Env file in the following directory:
```sh
/etc/otelcol-sumo/env/
```
3. Restart the collector using:
```sh
sudo systemctl restart otelcol-sumo
```
1. Copy the yaml file to `C:\ProgramData\Sumo Logic\OpenTelemetry Collector\config\conf.d` folder in the machine that needs to be monitored.
2. Restart the collector using:
```sh
Restart-Service -Name OtelcolSumo
```
1. Copy the yaml file to `/etc/otelcol-sumo/conf.d/` folder in the Puppet instance that needs to be monitored.
2. Restart the otelcol-sumo process using:
```sh
otelcol-sumo --config /etc/otelcol-sumo/sumologic.yaml --config "glob:/etc/otelcol-sumo/conf.d/*.yaml"
```
import ChefNoEnv from '../../../reuse/apps/opentelemetry/chef-without-env.md';
import AnsibleNoEnv from '../../../reuse/apps/opentelemetry/ansible-without-env.md';
import PuppetNoEnv from '../../../reuse/apps/opentelemetry/puppet-without-env.md';
import LogsOutro from '../../../reuse/apps/opentelemetry/send-logs-outro.md';
## Sample log messages
This is a sample log message for non-Kubernetes environments.
```sql
5.35.225.115 - - [2023-01-16 06:49:18.751 +0000] "POST /puppet/v3/file_content/plugins/facter/sources_dir_exists_win.rb?environment=production& HTTP/1.1" 500 4484 "-" "Puppet/5.5.2 Ruby/2.4.4-p296 (x86_64-linux)" 5
```
## Sample queries
This sample query is from the **Puppet - Overview** dashboard > **Node Requests Summary Over Time** panel.
```sumo
%"sumo.datasource"=puppet
| parse regex "^(?\d{1,3}\.\d{1,3}\.\d{1,3}\.\d{1,3})" nodrop
| parse regex "(?[A-Z]+)\s(?\S+)\sHTTP/[\d\.]+\"\s(?\d+)\s(?[\d-]+)\s\"(?.*?)\"\s\"(?.+?)\".*"
| if(status_code matches "2*", 1, 0) as successes
| if(status_code matches "3*", 1, 0) as redirects
| if(status_code matches "4*", 1, 0) as client_errors
| if(status_code matches "5*", 1, 0) as server_errors
| timeslice by 1h
| sum(successes) as successes, sum(redirects) as redirects, sum(client_errors) as client_errors, sum(server_errors) as server_errors by _timeslice
```
## Viewing Puppet Dashboards
### Overview
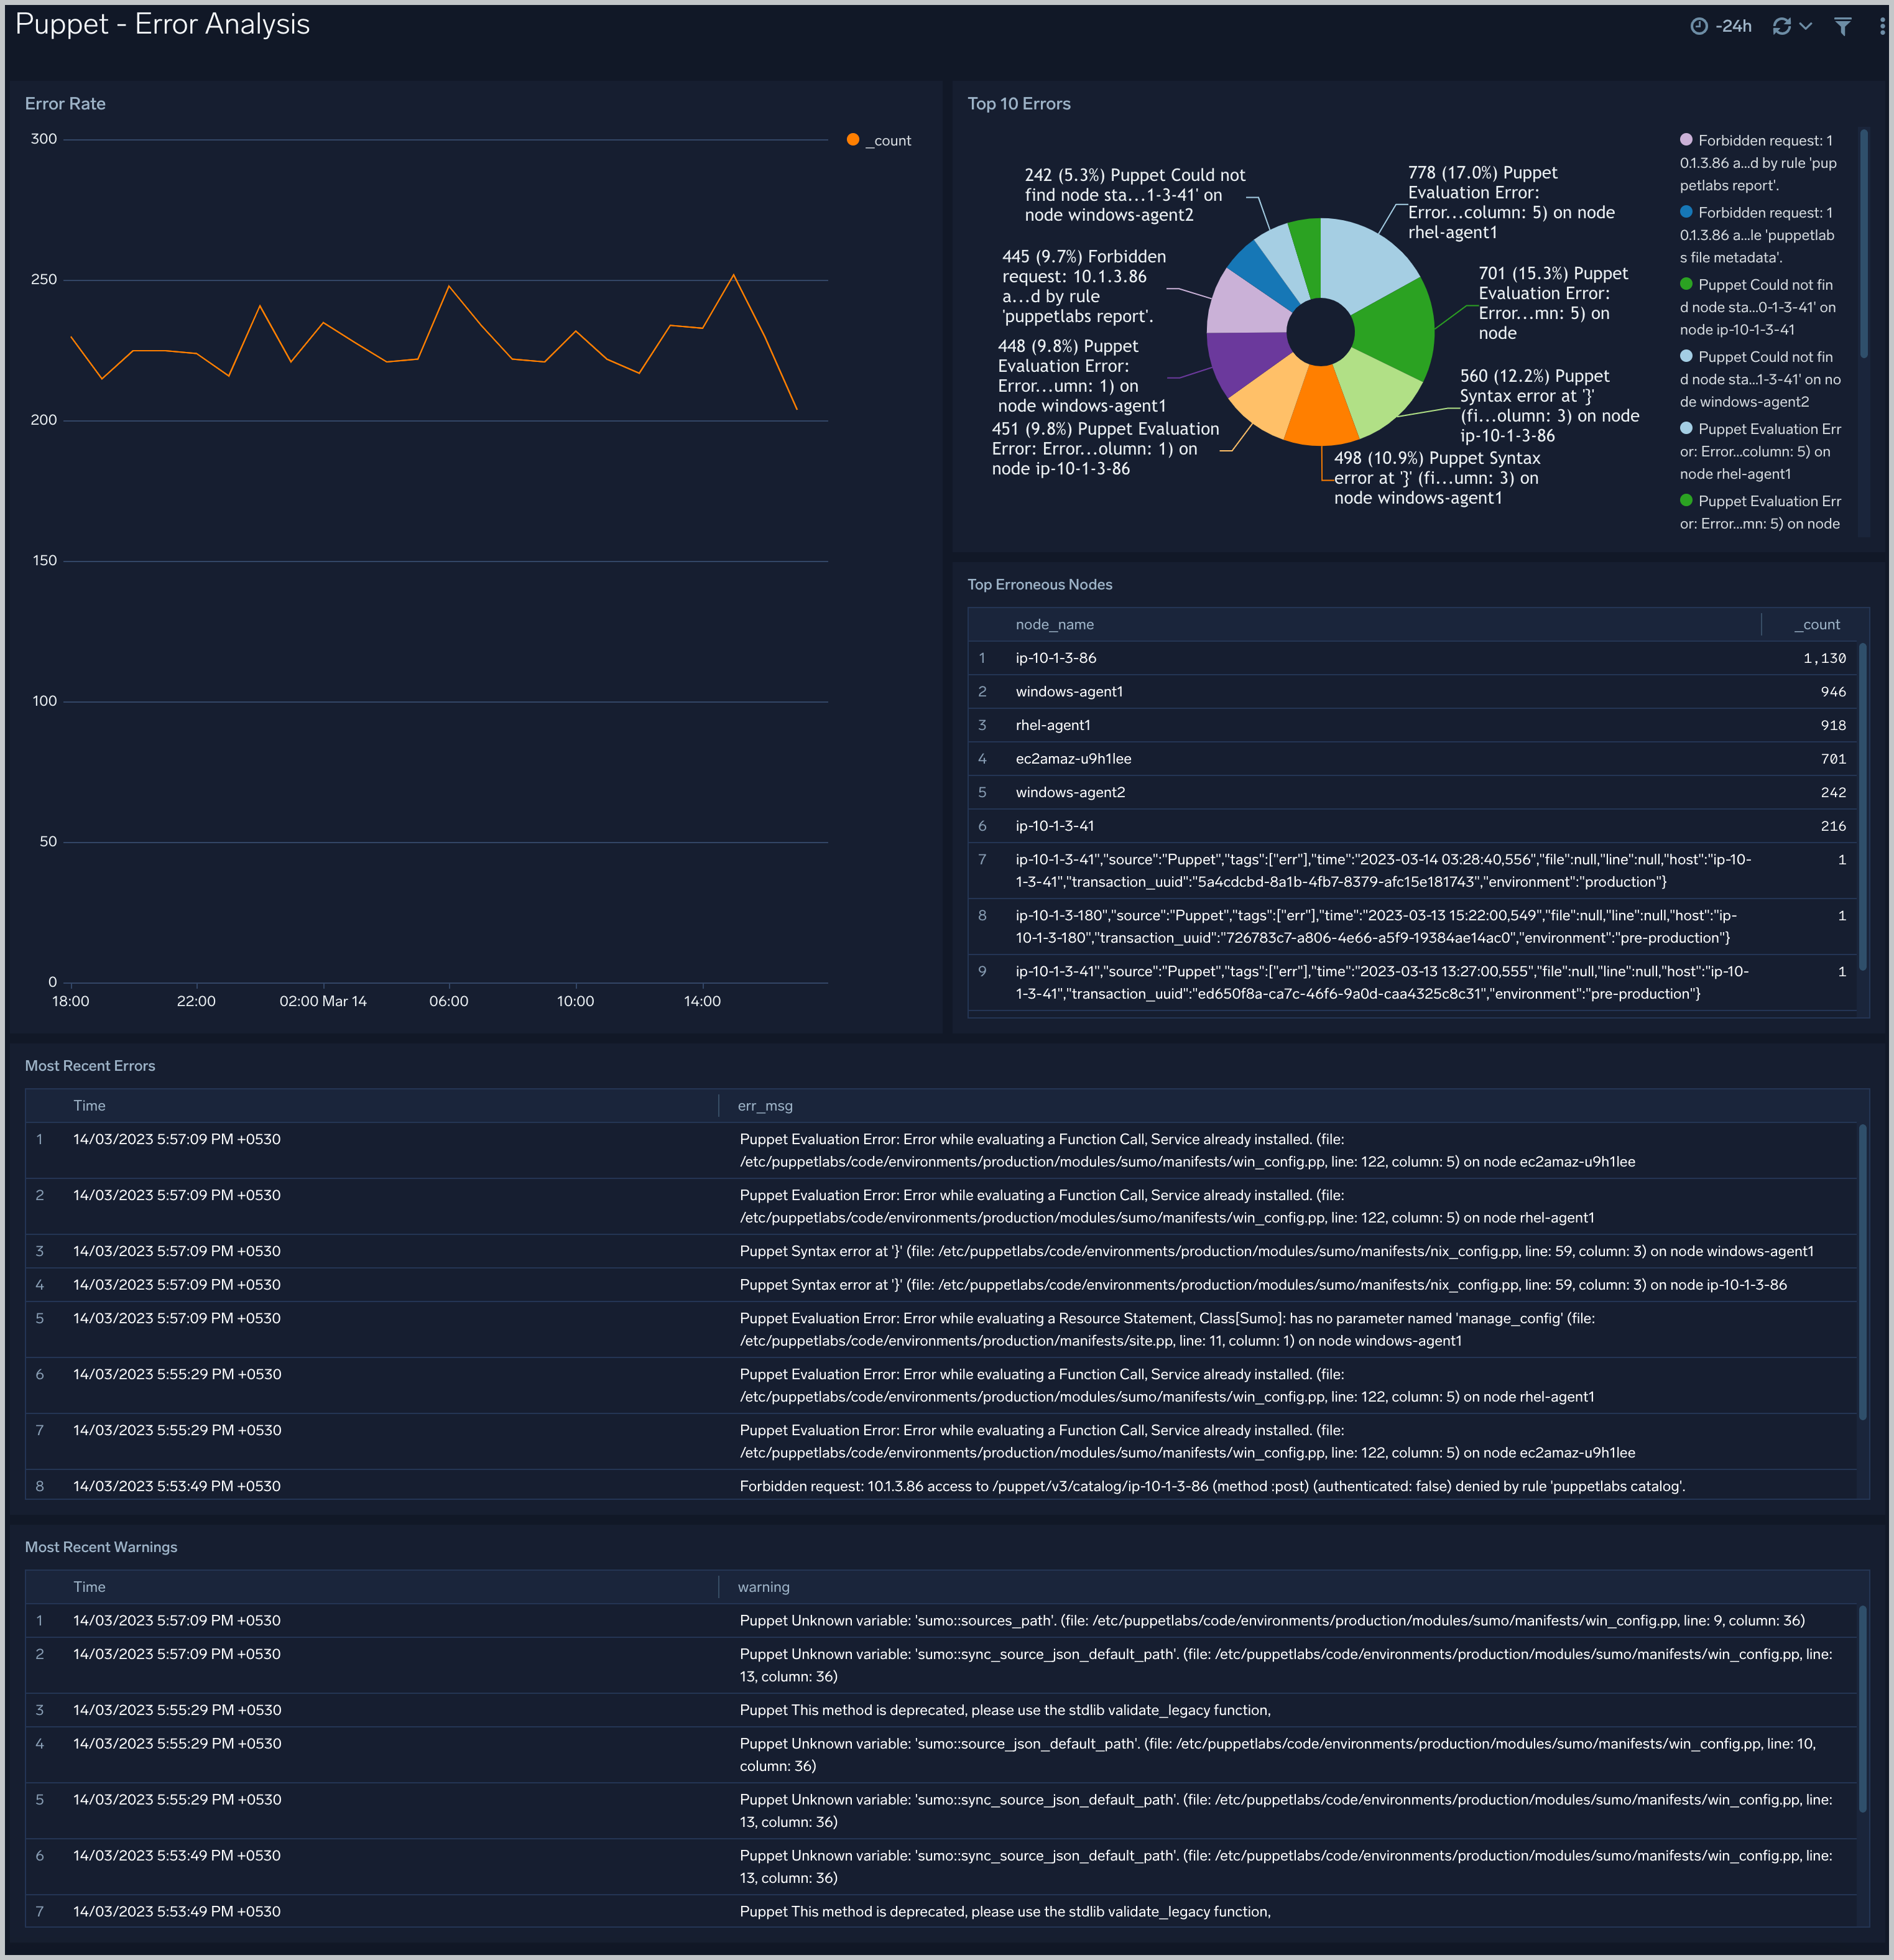
 ### Error Analysis: Puppet Server and Node Error Analysis
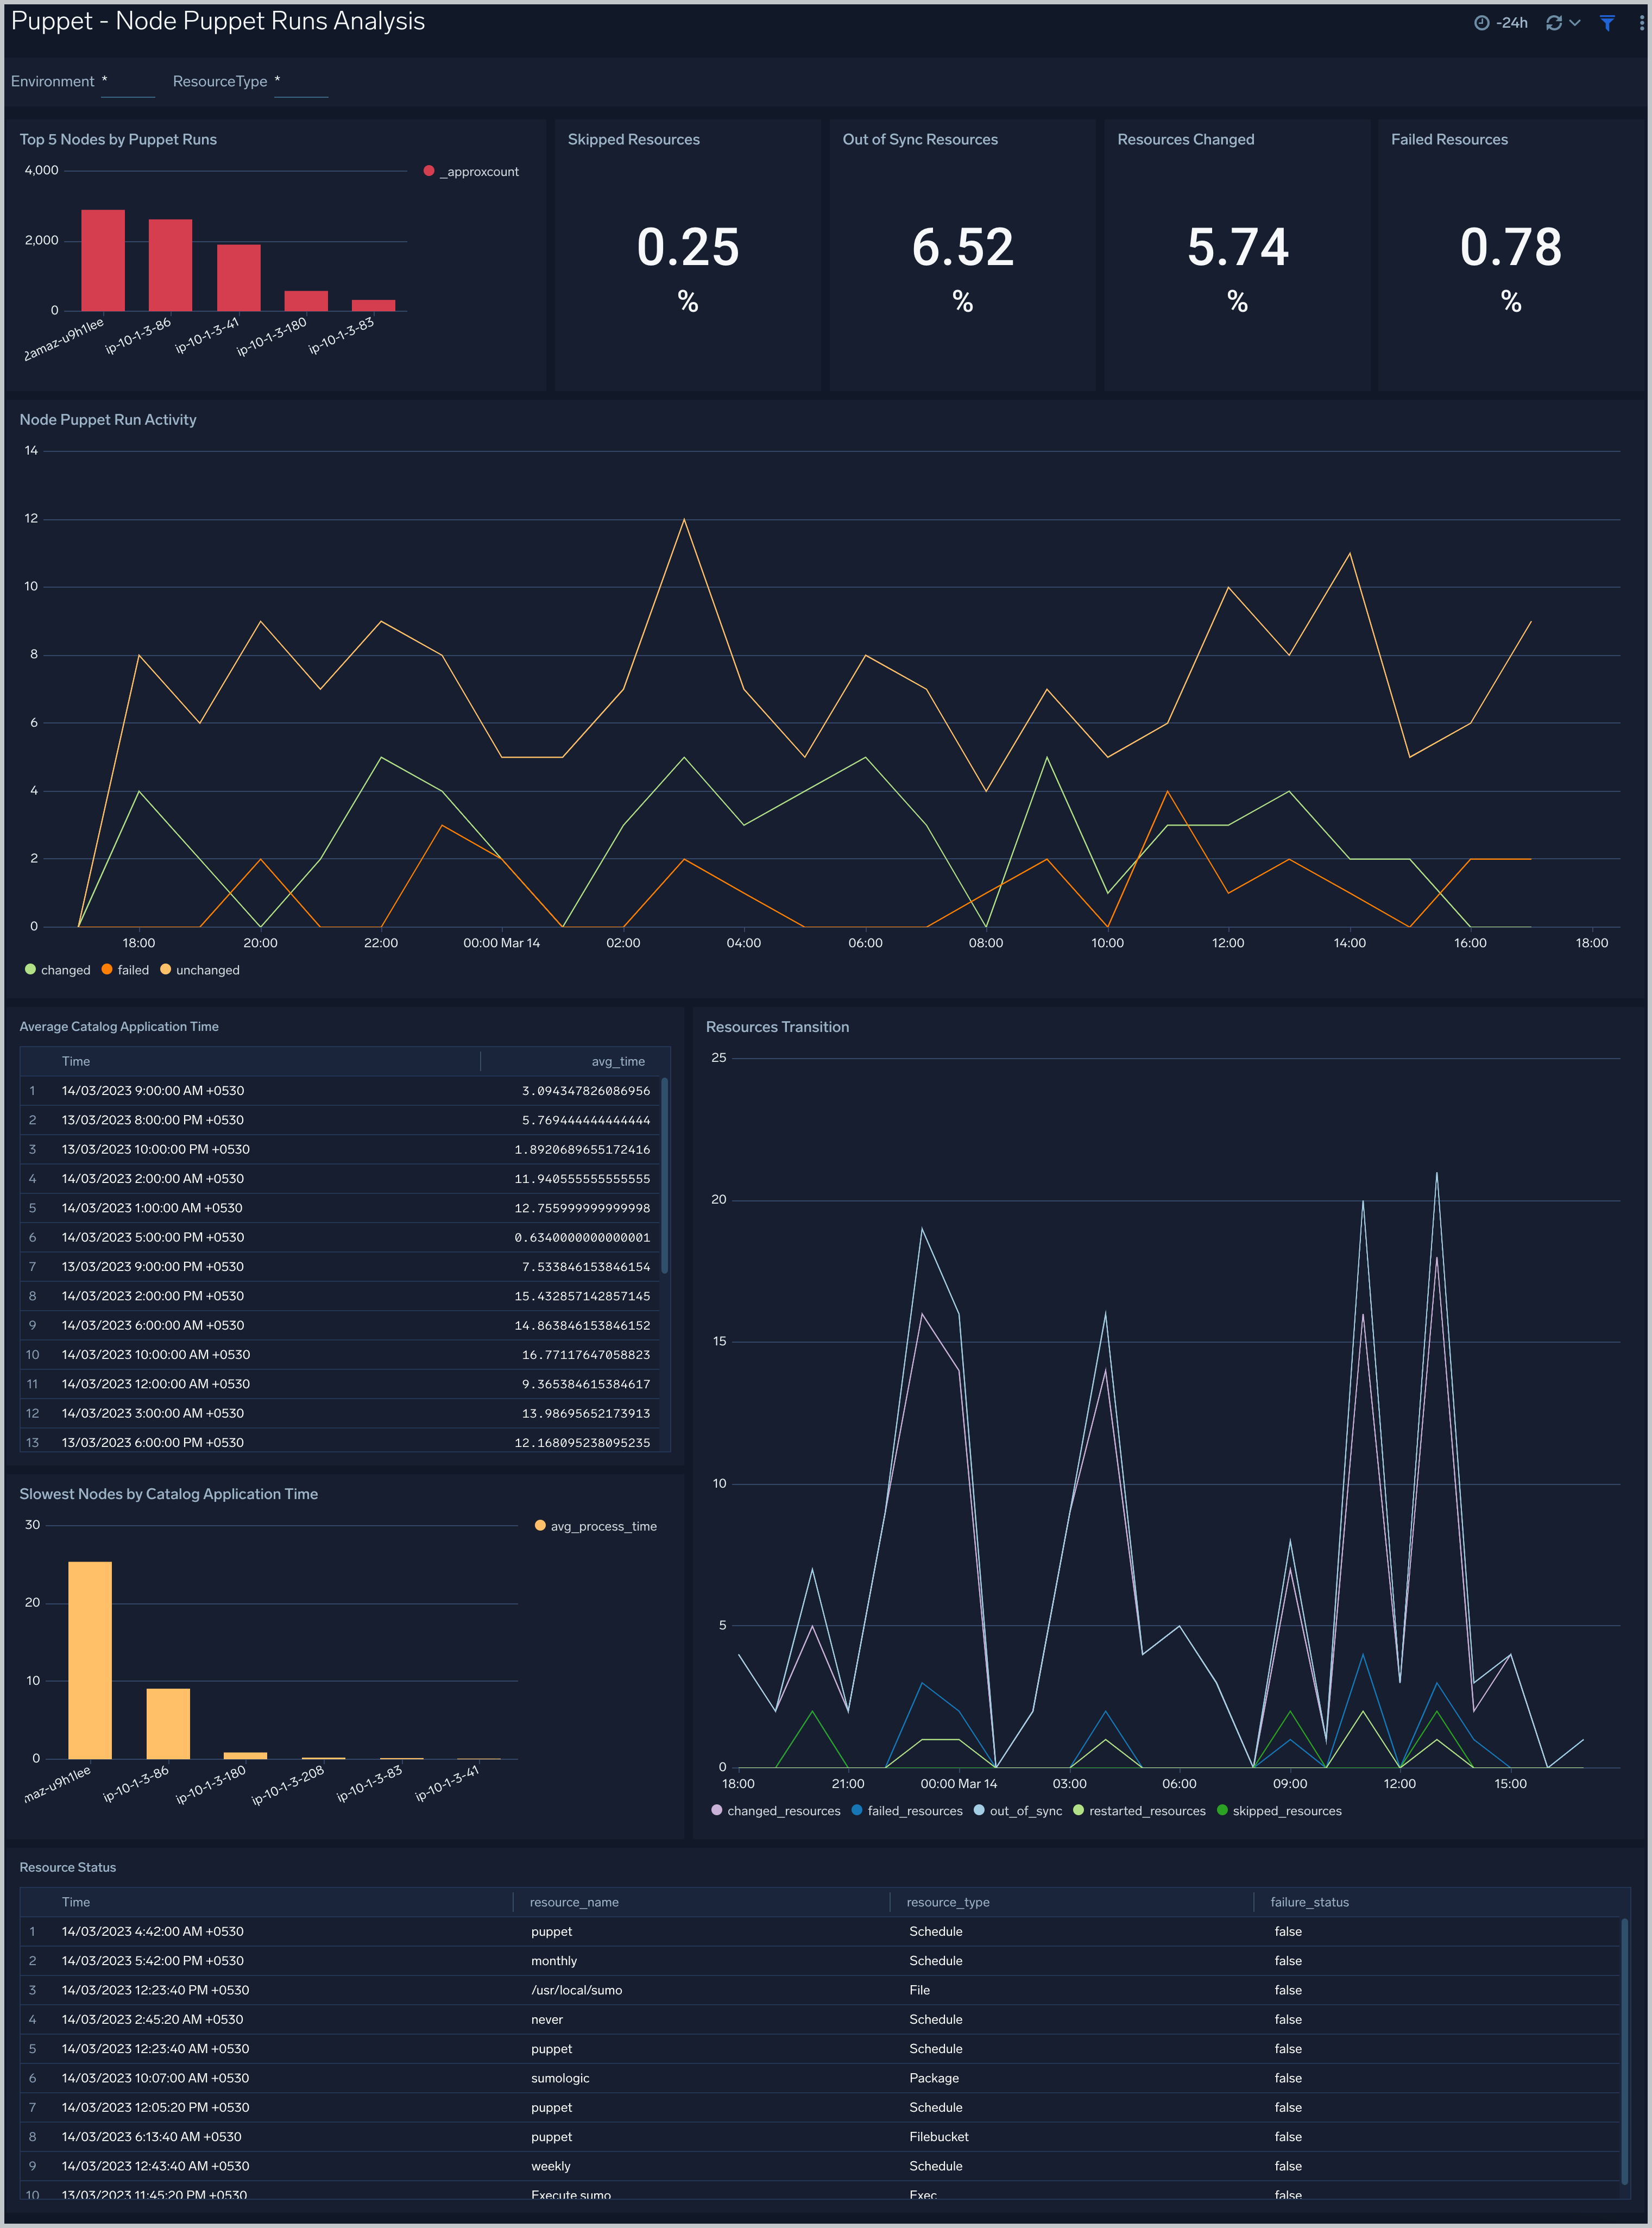
 ### Node Puppet Runs Analysis: Puppet Node Runs Analysis
 ## Create monitors for Puppet app
import CreateMonitors from '../../../reuse/apps/create-monitors.md';
### Puppet alerts
| Name | Description | Alert Condition | Recover Condition |
|:--|:--|:--|:--|
| `Puppet - Catalog Compilation Performance` | This alert is triggered when average time taken to compile Puppet catalogs is greater than given value (Default 30 seconds). Extended compilation times can indicate Puppet master performance issues, complex catalogs, or resource constraints. | Count \>= 30 | Count \< 30 |
| `Puppet - Erroneous Nodes` | This alert is triggered when a node has error more errors then given value (Default 5). | Count \>= 5 | Count \< 5 |
| `Puppet - Error Pattern Analysis` | This alert is triggered when Puppet error logs show recurring patterns that may indicate issues, helping detect problems that need investigation. | Count \>= 20 | Count \< 20 |
| `Puppet - Resource Status Failures` | This alert is triggered when there are specific resource failures greater than given value (Default 5). | Count \>= 5 | Count \< 5 |
## Create monitors for Puppet app
import CreateMonitors from '../../../reuse/apps/create-monitors.md';
### Puppet alerts
| Name | Description | Alert Condition | Recover Condition |
|:--|:--|:--|:--|
| `Puppet - Catalog Compilation Performance` | This alert is triggered when average time taken to compile Puppet catalogs is greater than given value (Default 30 seconds). Extended compilation times can indicate Puppet master performance issues, complex catalogs, or resource constraints. | Count \>= 30 | Count \< 30 |
| `Puppet - Erroneous Nodes` | This alert is triggered when a node has error more errors then given value (Default 5). | Count \>= 5 | Count \< 5 |
| `Puppet - Error Pattern Analysis` | This alert is triggered when Puppet error logs show recurring patterns that may indicate issues, helping detect problems that need investigation. | Count \>= 20 | Count \< 20 |
| `Puppet - Resource Status Failures` | This alert is triggered when there are specific resource failures greater than given value (Default 5). | Count \>= 5 | Count \< 5 |