---
id: apache-hadoop-opentelemetry
title: Apache Hadoop - OpenTelemetry Collector
sidebar_label: Apache Hadoop - OTel Collector
description: Learn about the Sumo Logic OpenTelemetry app for Apache Hadoop.
slug: /help/docs/integrations/bigdata/opentelemetry/apache-hadoop-opentelemetry/
canonical: https://www.sumologic.com/help/docs/integrations/bigdata/opentelemetry/apache-hadoop-opentelemetry/
---
import useBaseUrl from '@docusaurus/useBaseUrl';
import Tabs from '@theme/Tabs';
import TabItem from '@theme/TabItem';

}) The Sumo Logic app for [Apache Hadoop](https://hadoop.apache.org/docs/stable/) provides logs and metrics to help you monitor the health, performance, availability, and resource utilization of Hadoop clusters. It provides preconfigured dashboards and searches that offer deep visibility into HDFS and YARN components for real-time and historical analysis.
The app delivers end-to-end observability across NameNode, DataNode, and ResourceManager services, enabling faster troubleshooting, capacity planning, and operational stability.
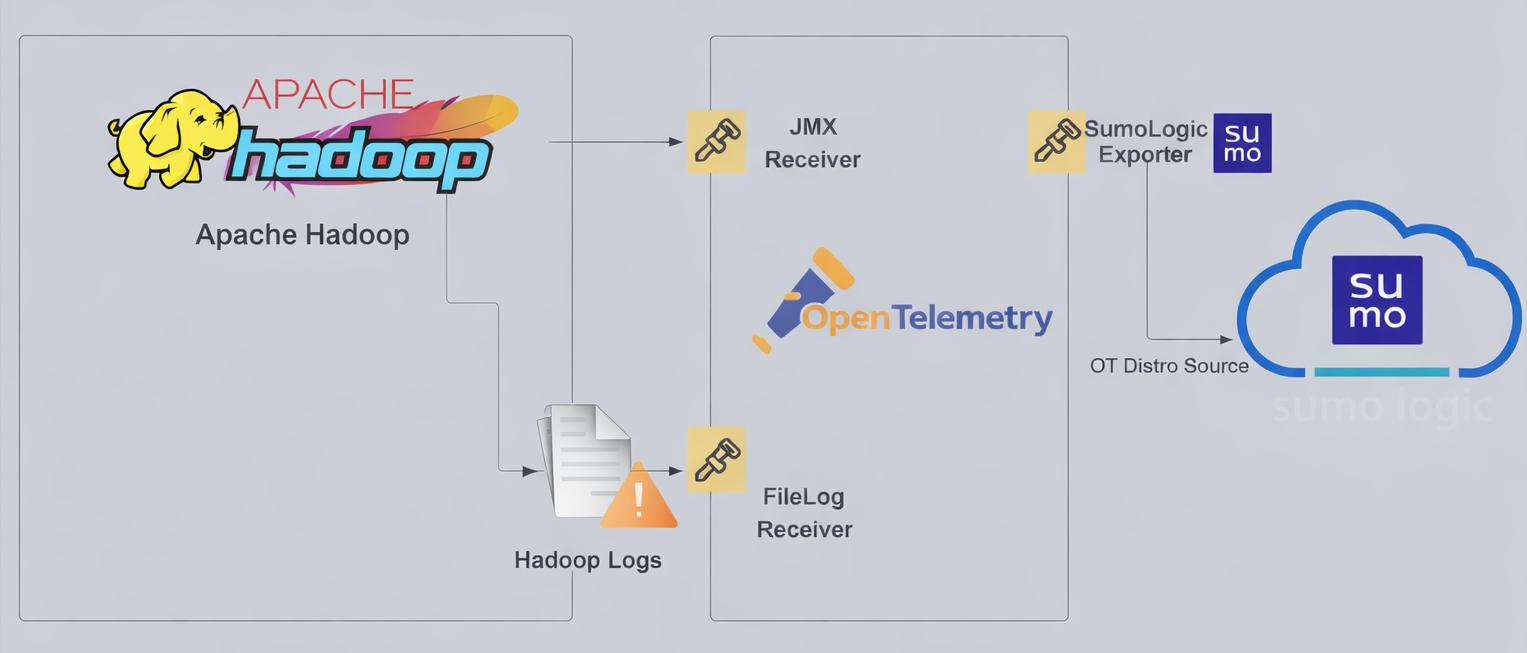
Hadoop logs are sent to Sumo Logic through the OpenTelemetry [filelog receiver](https://github.com/open-telemetry/opentelemetry-collector-contrib/tree/main/receiver/filelogreceiver) and metrics are sent through the [JMX](https://github.com/open-telemetry/opentelemetry-collector-contrib/tree/main/receiver/jmxreceiver) receiver with the `target_system` set as [`Hadoop`](https://github.com/open-telemetry/opentelemetry-java-contrib/blob/main/jmx-metrics/docs/target-systems/hadoop.md).
The Sumo Logic app for [Apache Hadoop](https://hadoop.apache.org/docs/stable/) provides logs and metrics to help you monitor the health, performance, availability, and resource utilization of Hadoop clusters. It provides preconfigured dashboards and searches that offer deep visibility into HDFS and YARN components for real-time and historical analysis.
The app delivers end-to-end observability across NameNode, DataNode, and ResourceManager services, enabling faster troubleshooting, capacity planning, and operational stability.
Hadoop logs are sent to Sumo Logic through the OpenTelemetry [filelog receiver](https://github.com/open-telemetry/opentelemetry-collector-contrib/tree/main/receiver/filelogreceiver) and metrics are sent through the [JMX](https://github.com/open-telemetry/opentelemetry-collector-contrib/tree/main/receiver/jmxreceiver) receiver with the `target_system` set as [`Hadoop`](https://github.com/open-telemetry/opentelemetry-java-contrib/blob/main/jmx-metrics/docs/target-systems/hadoop.md).
 ## Hadoop log types
The app supports logs from the open source version of Hadoop. This app is tested on the `3.3.6` version of Hadoop.
The Hadoop logs are generated in files as configured in the configuration file `$HADOOP_HOME/etc/hadoop/log4j.properties` ([learn more](https://hadoop.apache.org/docs/stable/hadoop-project-dist/hadoop-common/ClusterSetup.html#Logging)).
:::info
This app includes [built-in monitors](#apache-hadoop-alerts). For details on creating custom monitors, refer to the [Create monitors for Hadoop app](#create-monitors-for-apache-hadoop-app).
:::
## Fields created in Sumo Logic for Hadoop
Following are the [Fields](/docs/manage/fields/) which will be created as part of Hadoop app installation if not already present.
- **`sumo.datasource`**. Has fixed value of **hadoop**.
- **`bigdata.cluster.name`**. User configured. Enter a name to identify the Hadoop cluster. This cluster name will be shown in the Sumo Logic dashboards.
- **`bigdata.node.name`**. Has the value of the host name of the machine which is being monitored.
- **`deployment.environment`**. User configured. This is the deployment environment where the Memcache cluster resides. For example, dev, prod, or qa.
### Prerequisites
#### For metric collection
JMX receiver collects Hadoop metrics (NameNode metrics) from Hadoop cluster as part of the OpenTelemetry Collector (OTC).
1. Follow the instructions in [JMX - OpenTelemetry's prerequisites section](/docs/integrations/app-development/opentelemetry/jmx-opentelemetry/#prerequisites) to download the [JMX Metric Gatherer](https://github.com/open-telemetry/opentelemetry-java-contrib/blob/main/jmx-metrics/README.md). This gatherer is used by the [JMX Receiver](https://github.com/open-telemetry/opentelemetry-collector-contrib/tree/main/receiver/jmxreceiver#details).
2. Set the JMX port by setting it as part of `HDFS_NAMENODE_OPTS` for Hadoop startup. Usually it is set in the `$HADOOP_HOME/etc/hadoop/hadoop-env.sh` file.
```bash
export HDFS_NAMENODE_OPTS="$HDFS_NAMENODE_OPTS \
-Dcom.sun.management.jmxremote \
-Dcom.sun.management.jmxremote.port=8004 \
-Dcom.sun.management.jmxremote.rmi.port=8004 \
-Dcom.sun.management.jmxremote.authenticate=false \
-Dcom.sun.management.jmxremote.ssl=false \
-Djava.rmi.server.hostname=localhost"
```
#### For log collection
The Sumo Logic app for Apache Hadoop uses two primary types of logs:
1. **Hadoop HDFS logs**
- These logs include output from the NameNode, DataNode, and Secondary NameNode services.
- Log format description: Plain-text logs generated by HDFS daemons, typically found in the Hadoop logs directory.
2. **Hadoop YARN logs**
- These logs include entries from the ResourceManager and NodeManager components.
- Log format description: Plain-text logs that record cluster resource management and scheduling activities.
By default, Hadoop logs are stored in `$HADOOP_HOME/logs` or `/usr/local/hadoop/logs` The default directory for log files is listed in the `$HADOOP_HOME/etc/hadoop/log4j.properties` file.
import LogsCollectionPrereqisites from '../../../reuse/apps/logs-collection-prereqisites.md';
For Windows systems, log files which are collected should be accessible by the SYSTEM group. Use the following set of PowerShell commands if the SYSTEM group does not have access.
```
$NewAcl = Get-Acl -Path ""
# Set properties
$identity = "NT AUTHORITY\SYSTEM"
$fileSystemRights = "ReadAndExecute"
$type = "Allow"
# Create new rule
$fileSystemAccessRuleArgumentList = $identity, $fileSystemRights, $type
$fileSystemAccessRule = New-Object -TypeName System.Security.AccessControl.FileSystemAccessRule -ArgumentList $fileSystemAccessRuleArgumentList
# Apply new rule
$NewAcl.SetAccessRule($fileSystemAccessRule)
Set-Acl -Path "" -AclObject $NewAcl
```
## Collection configuration and app installation
import ConfigAppInstall from '../../../reuse/apps/opentelemetry/config-app-install.md';
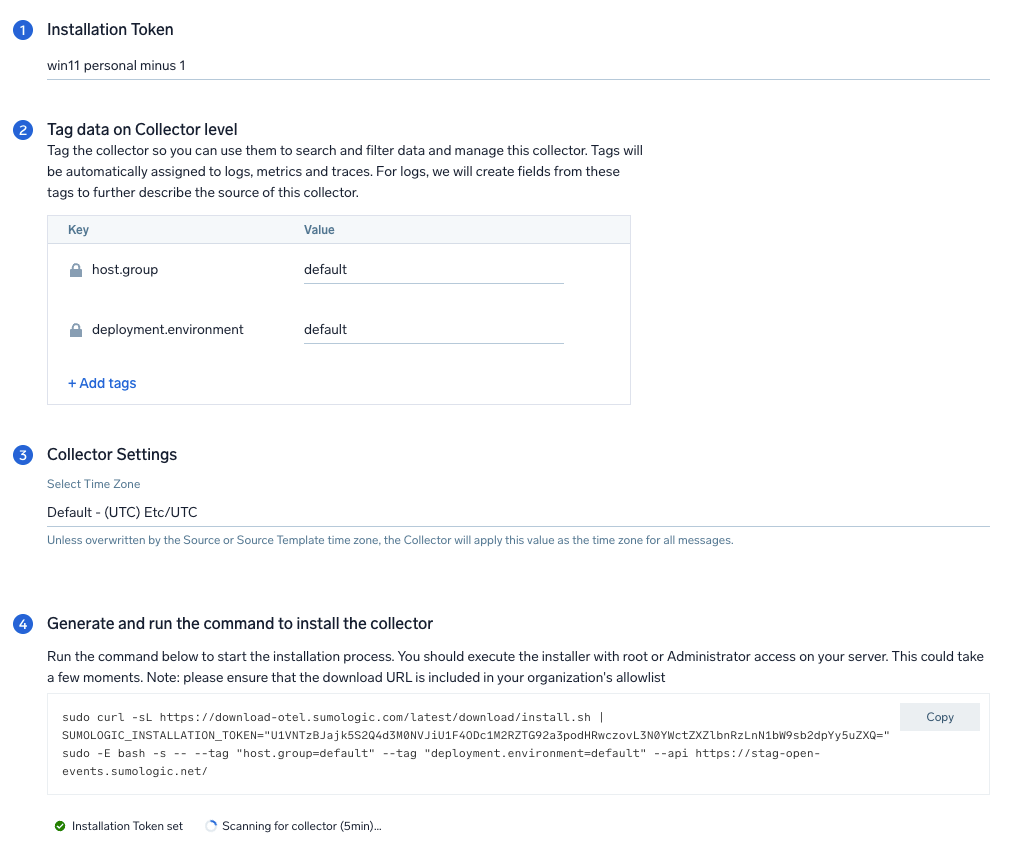
### Step 1: Set up Collector
import SetupColl from '../../../reuse/apps/opentelemetry/set-up-collector.md';
## Hadoop log types
The app supports logs from the open source version of Hadoop. This app is tested on the `3.3.6` version of Hadoop.
The Hadoop logs are generated in files as configured in the configuration file `$HADOOP_HOME/etc/hadoop/log4j.properties` ([learn more](https://hadoop.apache.org/docs/stable/hadoop-project-dist/hadoop-common/ClusterSetup.html#Logging)).
:::info
This app includes [built-in monitors](#apache-hadoop-alerts). For details on creating custom monitors, refer to the [Create monitors for Hadoop app](#create-monitors-for-apache-hadoop-app).
:::
## Fields created in Sumo Logic for Hadoop
Following are the [Fields](/docs/manage/fields/) which will be created as part of Hadoop app installation if not already present.
- **`sumo.datasource`**. Has fixed value of **hadoop**.
- **`bigdata.cluster.name`**. User configured. Enter a name to identify the Hadoop cluster. This cluster name will be shown in the Sumo Logic dashboards.
- **`bigdata.node.name`**. Has the value of the host name of the machine which is being monitored.
- **`deployment.environment`**. User configured. This is the deployment environment where the Memcache cluster resides. For example, dev, prod, or qa.
### Prerequisites
#### For metric collection
JMX receiver collects Hadoop metrics (NameNode metrics) from Hadoop cluster as part of the OpenTelemetry Collector (OTC).
1. Follow the instructions in [JMX - OpenTelemetry's prerequisites section](/docs/integrations/app-development/opentelemetry/jmx-opentelemetry/#prerequisites) to download the [JMX Metric Gatherer](https://github.com/open-telemetry/opentelemetry-java-contrib/blob/main/jmx-metrics/README.md). This gatherer is used by the [JMX Receiver](https://github.com/open-telemetry/opentelemetry-collector-contrib/tree/main/receiver/jmxreceiver#details).
2. Set the JMX port by setting it as part of `HDFS_NAMENODE_OPTS` for Hadoop startup. Usually it is set in the `$HADOOP_HOME/etc/hadoop/hadoop-env.sh` file.
```bash
export HDFS_NAMENODE_OPTS="$HDFS_NAMENODE_OPTS \
-Dcom.sun.management.jmxremote \
-Dcom.sun.management.jmxremote.port=8004 \
-Dcom.sun.management.jmxremote.rmi.port=8004 \
-Dcom.sun.management.jmxremote.authenticate=false \
-Dcom.sun.management.jmxremote.ssl=false \
-Djava.rmi.server.hostname=localhost"
```
#### For log collection
The Sumo Logic app for Apache Hadoop uses two primary types of logs:
1. **Hadoop HDFS logs**
- These logs include output from the NameNode, DataNode, and Secondary NameNode services.
- Log format description: Plain-text logs generated by HDFS daemons, typically found in the Hadoop logs directory.
2. **Hadoop YARN logs**
- These logs include entries from the ResourceManager and NodeManager components.
- Log format description: Plain-text logs that record cluster resource management and scheduling activities.
By default, Hadoop logs are stored in `$HADOOP_HOME/logs` or `/usr/local/hadoop/logs` The default directory for log files is listed in the `$HADOOP_HOME/etc/hadoop/log4j.properties` file.
import LogsCollectionPrereqisites from '../../../reuse/apps/logs-collection-prereqisites.md';
For Windows systems, log files which are collected should be accessible by the SYSTEM group. Use the following set of PowerShell commands if the SYSTEM group does not have access.
```
$NewAcl = Get-Acl -Path ""
# Set properties
$identity = "NT AUTHORITY\SYSTEM"
$fileSystemRights = "ReadAndExecute"
$type = "Allow"
# Create new rule
$fileSystemAccessRuleArgumentList = $identity, $fileSystemRights, $type
$fileSystemAccessRule = New-Object -TypeName System.Security.AccessControl.FileSystemAccessRule -ArgumentList $fileSystemAccessRuleArgumentList
# Apply new rule
$NewAcl.SetAccessRule($fileSystemAccessRule)
Set-Acl -Path "" -AclObject $NewAcl
```
## Collection configuration and app installation
import ConfigAppInstall from '../../../reuse/apps/opentelemetry/config-app-install.md';
### Step 1: Set up Collector
import SetupColl from '../../../reuse/apps/opentelemetry/set-up-collector.md';
 ### Step 2: Configure integration
In this step, you will configure the YAML required for Hadoop collection.
Below are the inputs required for configuration:
- The path of the log file configured to capture Hadoop logs is needed to be given here.
- The files are typically located in `/usr/local/hadoop/logs/*`. If you're using a customized path, check the conf file for this information.
- For metrics, you're required to provide the JMX endpoint along with the `collection_interval` (default is 1 minute).
You can add any custom fields which you want to tag along with the data ingested in Sumo Logic. Click the **Download YAML File** button to get the YAML file.
import CollectorVersionNote from '../../../reuse/apps/opentelemetry/collector-version-note.md';
import EnvVarOpt from '../../../reuse/apps/opentelemetry/env-var-optional.md';
### Step 2: Configure integration
In this step, you will configure the YAML required for Hadoop collection.
Below are the inputs required for configuration:
- The path of the log file configured to capture Hadoop logs is needed to be given here.
- The files are typically located in `/usr/local/hadoop/logs/*`. If you're using a customized path, check the conf file for this information.
- For metrics, you're required to provide the JMX endpoint along with the `collection_interval` (default is 1 minute).
You can add any custom fields which you want to tag along with the data ingested in Sumo Logic. Click the **Download YAML File** button to get the YAML file.
import CollectorVersionNote from '../../../reuse/apps/opentelemetry/collector-version-note.md';
import EnvVarOpt from '../../../reuse/apps/opentelemetry/env-var-optional.md';
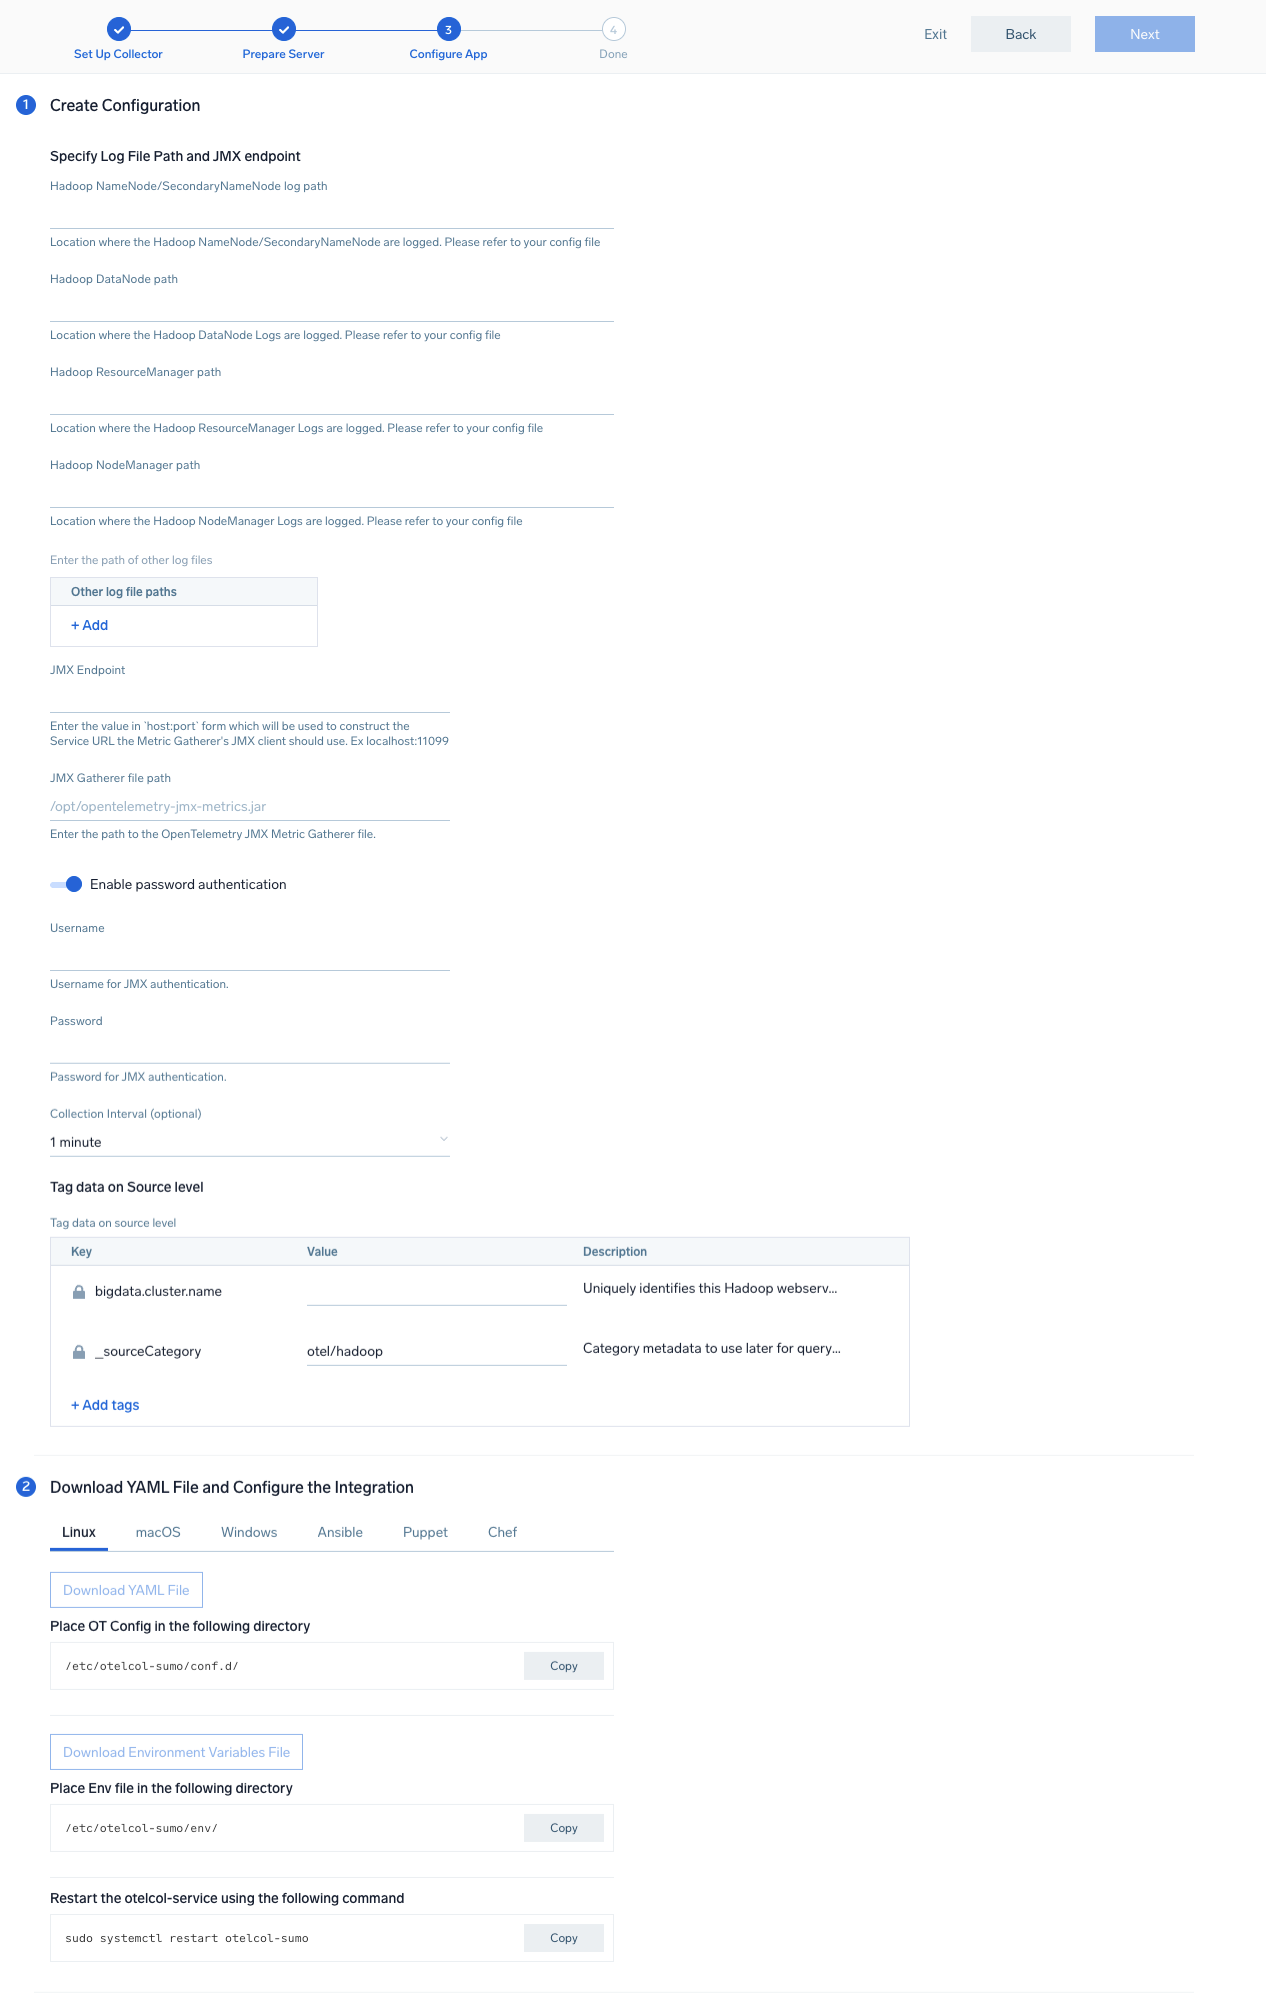 ### Step 3: Send logs and metrics to Sumo Logic
import LogsIntro from '../../../reuse/apps/opentelemetry/send-logs-intro.md';
1. Copy the YAML file to `/etc/otelcol-sumo/conf.d/` folder in the Hadoop nodes which needs to be monitored.
2. Restart the collector using:
```sh
sudo systemctl restart otelcol-sumo
```
1. Copy the YAML file to `C:\ProgramData\Sumo Logic\OpenTelemetry Collector\config\conf.d` folder in the machine which needs to be monitored.
2. Restart the collector using:
```sh
Restart-Service -Name OtelcolSumo
```
1. Copy the YAML file to `/etc/otelcol-sumo/conf.d/` folder in the Hadoop nodes which needs to be monitored.
2. Restart the otelcol-sumo process using the below command:
```sh
otelcol-sumo --config /etc/otelcol-sumo/sumologic.yaml --config "glob:/etc/otelcol-sumo/conf.d/*.yaml"
```
import ChefNoEnv from '../../../reuse/apps/opentelemetry/chef-without-env.md';
import AnsibleNoEnv from '../../../reuse/apps/opentelemetry/ansible-without-env.md';
import PuppetNoEnv from '../../../reuse/apps/opentelemetry/puppet-without-env.md';
import LogsOutro from '../../../reuse/apps/opentelemetry/send-logs-outro.md';
## Sample log messages
```
2026-01-27 01:37:04,603 INFO org.apache.hadoop.yarn.server.resourcemanager.scheduler.capacity.CapacityScheduler: Added node localhost:60271 clusterResource: <memory:8192, vCores:8>
```
## Sample log queries
```sumo
_source="hadoop/filelog"
| json "message" nodrop
| if (_raw matches "{*", message, _raw) as message
| where contains(message, "Added node")
| parse regex field=message "Added node (?[^ ]+).*memory:(?\d+), vCores:(?\d+)"
| timeslice 1m
| sum(memory_mb) as memory_mb, sum(vcores) as vcores by _timeslice, node
| sort by _timeslice
| limit 100
```
## Sample metrics
```
{
"Query": "A",
"metric": "hadoop.name_node.block.missing",
"_collector": "sumo.host-mac-mac",
"_collectorId": "00005AF3122798EB",
"_contentType": "OpenTelemetry",
"_metricId": "UPGPWtf3xWkqN-P5A1ovjA",
"_source": "hadoop/jmx",
"_sourceCategory": "OTC Metric Input",
"_sourceHost": "sumo.host-mac-mac",
"_sourceId": "0000000000000000",
"_sourceName": "hadoop",
"bigdata.cluster.name": "test-hadoop",
"bigdata.node.name": "sumo.host-mac-mac",
"bigdata.system": "hadoop",
"deployment.environment": "default",
"host.group": "default",
"host.name": "sumo.host-mac-mac",
"node_name": "sumo.host-mac-mac",
"os.type": "darwin",
"service.name": "unknown_service:java",
"sumo.datasource": "hadoop",
"telemetry.sdk.language": "java",
"telemetry.sdk.name": "opentelemetry",
"telemetry.sdk.version": "1.56.0",
"unit": "{block}",
"min": 0,
"max": 0,
"latest": 0,
"avg": 0,
"sum": 0,
"count": 169
}
```
## Sample metrics query
```
sumo.datasource=hadoop metric=hadoop.name_node.block.missing deployment.environment=* bigdata.cluster.name=* bigdata.node.name=* | avg by deployment.environment, bigdata.cluster.name, bigdata.node.name
```
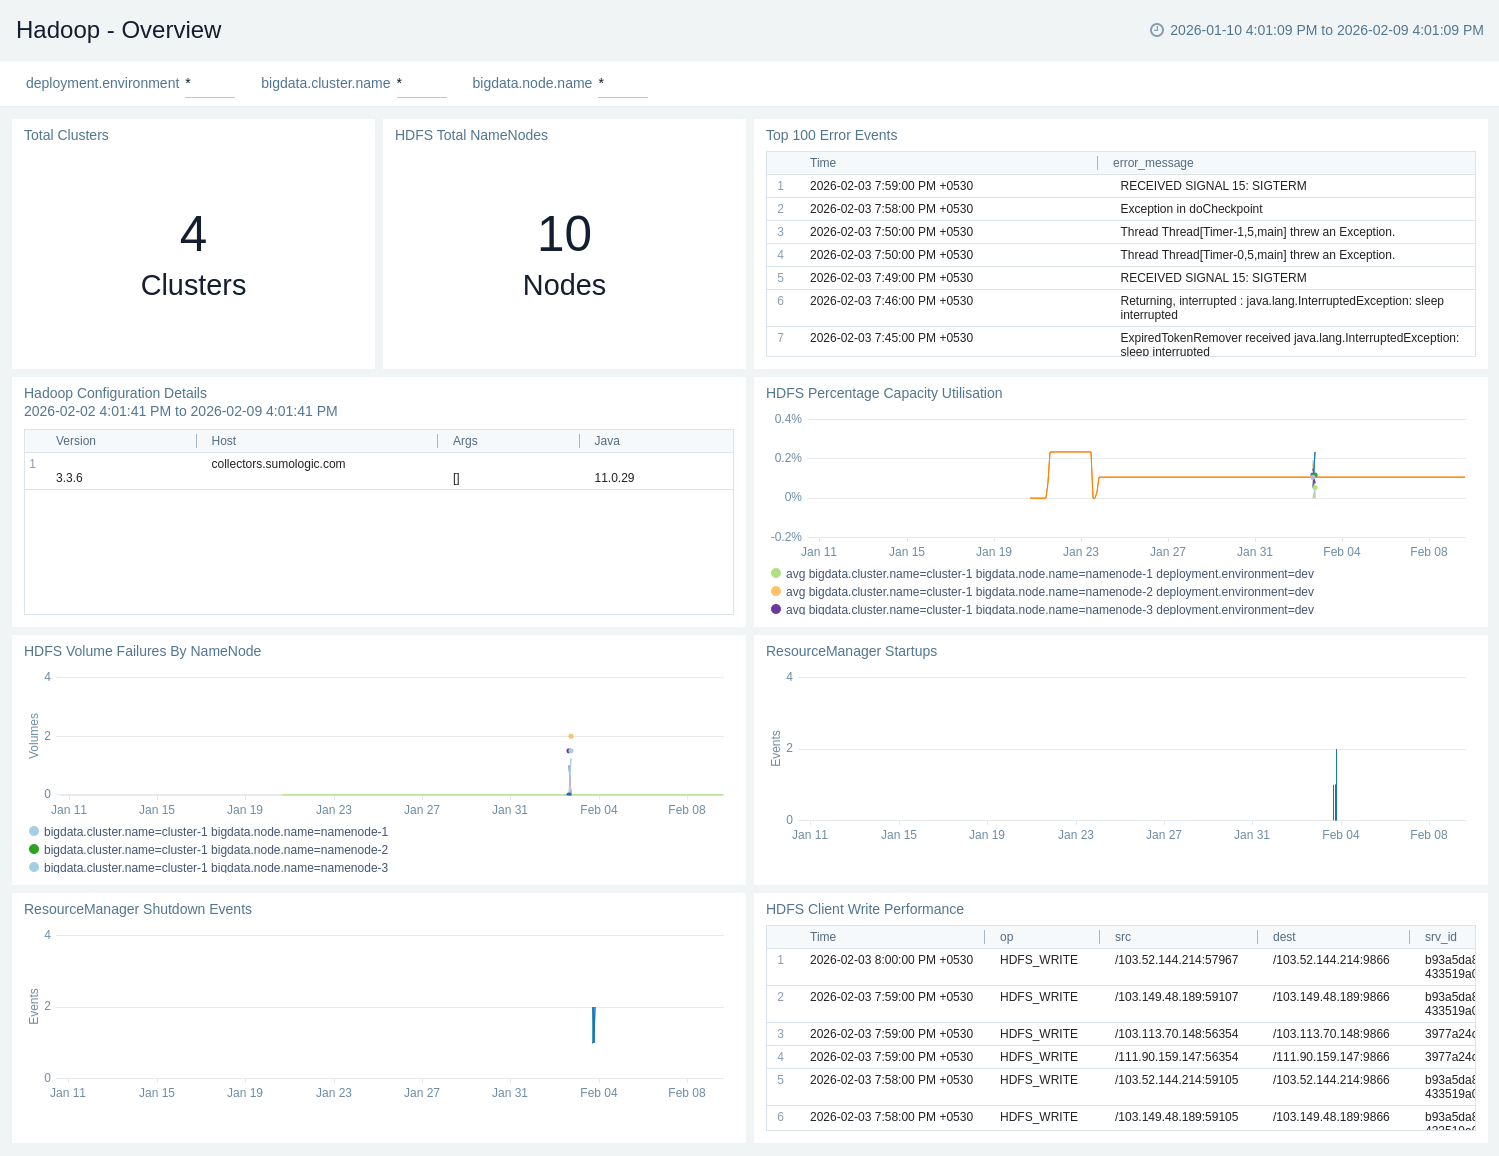
## Viewing the Apache Hadoop dashboards
### Apache Hadoop - Overview
The **Apache Hadoop – Overview dashboard** gives a quick snapshot of cluster health, capacity utilisation, and NameNode availability. It highlights volume failures, client write performance, top error events, and ResourceManager start/shutdown activity.
Use this dashboard to:
- Gain a high-level view of Hadoop environments, including total clusters, NameNodes, and overall HDFS capacity utilisation.
- Monitor HDFS health and reliability, tracking volume failures, client write performance, and critical error events.
- Track ResourceManager lifecycle events and review configuration details to quickly identify stability issues and operational risks.
### Step 3: Send logs and metrics to Sumo Logic
import LogsIntro from '../../../reuse/apps/opentelemetry/send-logs-intro.md';
1. Copy the YAML file to `/etc/otelcol-sumo/conf.d/` folder in the Hadoop nodes which needs to be monitored.
2. Restart the collector using:
```sh
sudo systemctl restart otelcol-sumo
```
1. Copy the YAML file to `C:\ProgramData\Sumo Logic\OpenTelemetry Collector\config\conf.d` folder in the machine which needs to be monitored.
2. Restart the collector using:
```sh
Restart-Service -Name OtelcolSumo
```
1. Copy the YAML file to `/etc/otelcol-sumo/conf.d/` folder in the Hadoop nodes which needs to be monitored.
2. Restart the otelcol-sumo process using the below command:
```sh
otelcol-sumo --config /etc/otelcol-sumo/sumologic.yaml --config "glob:/etc/otelcol-sumo/conf.d/*.yaml"
```
import ChefNoEnv from '../../../reuse/apps/opentelemetry/chef-without-env.md';
import AnsibleNoEnv from '../../../reuse/apps/opentelemetry/ansible-without-env.md';
import PuppetNoEnv from '../../../reuse/apps/opentelemetry/puppet-without-env.md';
import LogsOutro from '../../../reuse/apps/opentelemetry/send-logs-outro.md';
## Sample log messages
```
2026-01-27 01:37:04,603 INFO org.apache.hadoop.yarn.server.resourcemanager.scheduler.capacity.CapacityScheduler: Added node localhost:60271 clusterResource: <memory:8192, vCores:8>
```
## Sample log queries
```sumo
_source="hadoop/filelog"
| json "message" nodrop
| if (_raw matches "{*", message, _raw) as message
| where contains(message, "Added node")
| parse regex field=message "Added node (?[^ ]+).*memory:(?\d+), vCores:(?\d+)"
| timeslice 1m
| sum(memory_mb) as memory_mb, sum(vcores) as vcores by _timeslice, node
| sort by _timeslice
| limit 100
```
## Sample metrics
```
{
"Query": "A",
"metric": "hadoop.name_node.block.missing",
"_collector": "sumo.host-mac-mac",
"_collectorId": "00005AF3122798EB",
"_contentType": "OpenTelemetry",
"_metricId": "UPGPWtf3xWkqN-P5A1ovjA",
"_source": "hadoop/jmx",
"_sourceCategory": "OTC Metric Input",
"_sourceHost": "sumo.host-mac-mac",
"_sourceId": "0000000000000000",
"_sourceName": "hadoop",
"bigdata.cluster.name": "test-hadoop",
"bigdata.node.name": "sumo.host-mac-mac",
"bigdata.system": "hadoop",
"deployment.environment": "default",
"host.group": "default",
"host.name": "sumo.host-mac-mac",
"node_name": "sumo.host-mac-mac",
"os.type": "darwin",
"service.name": "unknown_service:java",
"sumo.datasource": "hadoop",
"telemetry.sdk.language": "java",
"telemetry.sdk.name": "opentelemetry",
"telemetry.sdk.version": "1.56.0",
"unit": "{block}",
"min": 0,
"max": 0,
"latest": 0,
"avg": 0,
"sum": 0,
"count": 169
}
```
## Sample metrics query
```
sumo.datasource=hadoop metric=hadoop.name_node.block.missing deployment.environment=* bigdata.cluster.name=* bigdata.node.name=* | avg by deployment.environment, bigdata.cluster.name, bigdata.node.name
```
## Viewing the Apache Hadoop dashboards
### Apache Hadoop - Overview
The **Apache Hadoop – Overview dashboard** gives a quick snapshot of cluster health, capacity utilisation, and NameNode availability. It highlights volume failures, client write performance, top error events, and ResourceManager start/shutdown activity.
Use this dashboard to:
- Gain a high-level view of Hadoop environments, including total clusters, NameNodes, and overall HDFS capacity utilisation.
- Monitor HDFS health and reliability, tracking volume failures, client write performance, and critical error events.
- Track ResourceManager lifecycle events and review configuration details to quickly identify stability issues and operational risks.
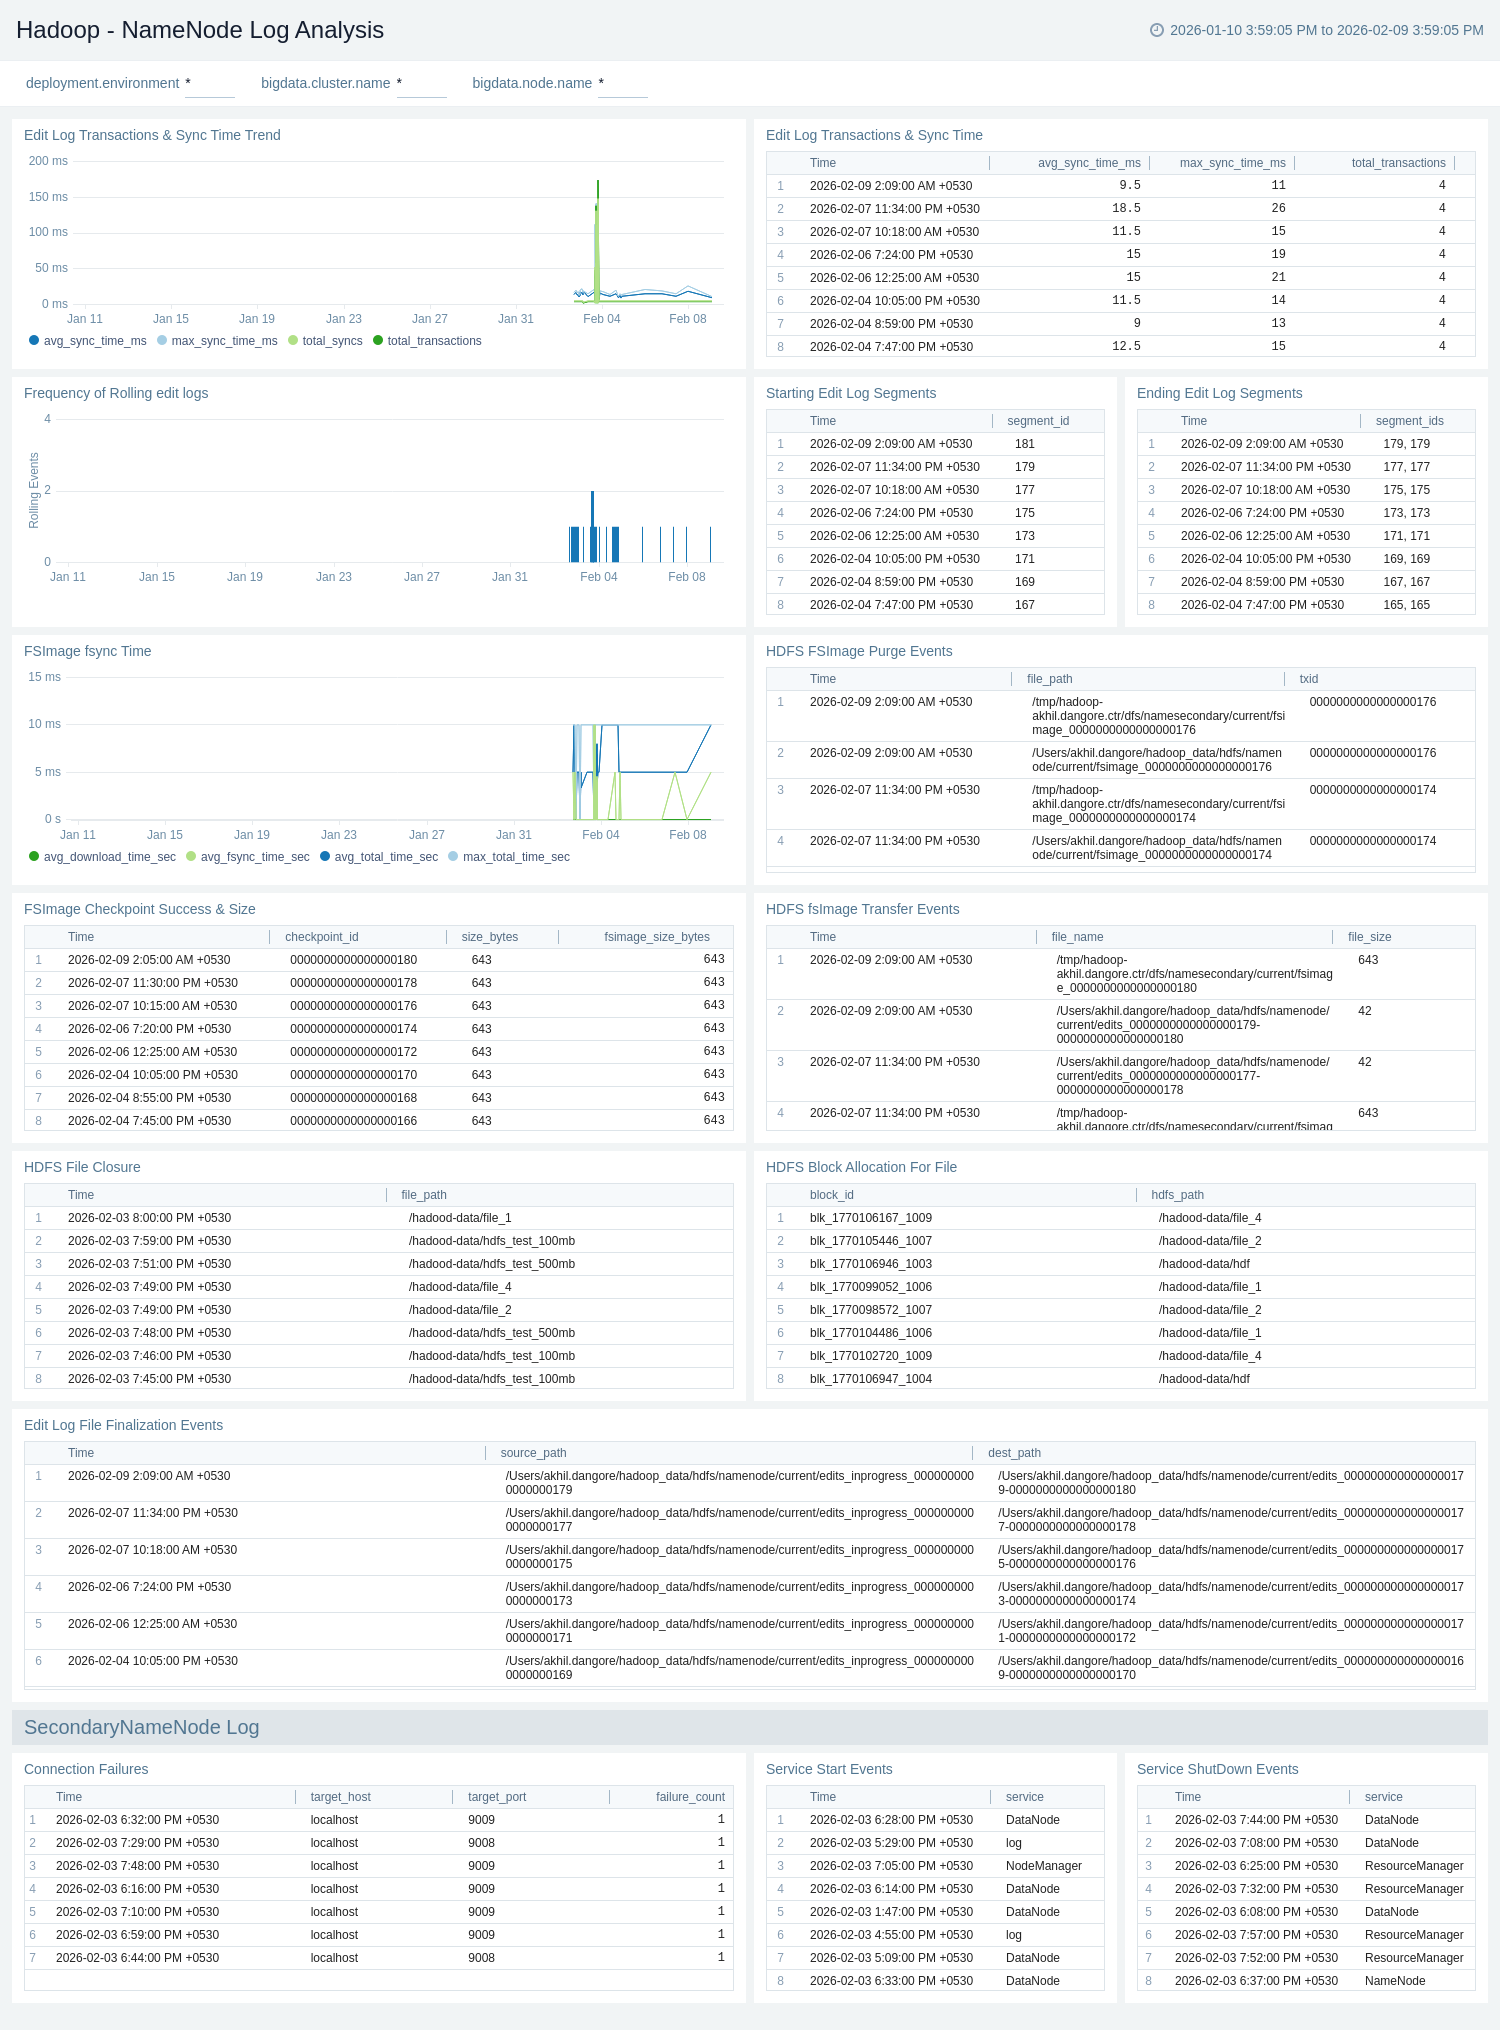
 ### Apache Hadoop - NameNode Log Analysis
The **Apache Hadoop – NameNode Log Analysis** dashboard provides visibility into NameNode metadata operations and stability, including edit log transactions, sync times, and edit log segment lifecycle events.
Use this dashboard to:
* Monitor **NameNode metadata operations**, including edit log transactions, sync times, and edit log segment lifecycle events.
* Track **FSImage activity and health**, such as checkpoints, transfers, purge events, and fsync performance.
* Identify **operational and stability issues** by monitoring block allocation, file operations, connection failures, and NameNode service startup and shutdown events.
### Apache Hadoop - NameNode Log Analysis
The **Apache Hadoop – NameNode Log Analysis** dashboard provides visibility into NameNode metadata operations and stability, including edit log transactions, sync times, and edit log segment lifecycle events.
Use this dashboard to:
* Monitor **NameNode metadata operations**, including edit log transactions, sync times, and edit log segment lifecycle events.
* Track **FSImage activity and health**, such as checkpoints, transfers, purge events, and fsync performance.
* Identify **operational and stability issues** by monitoring block allocation, file operations, connection failures, and NameNode service startup and shutdown events.
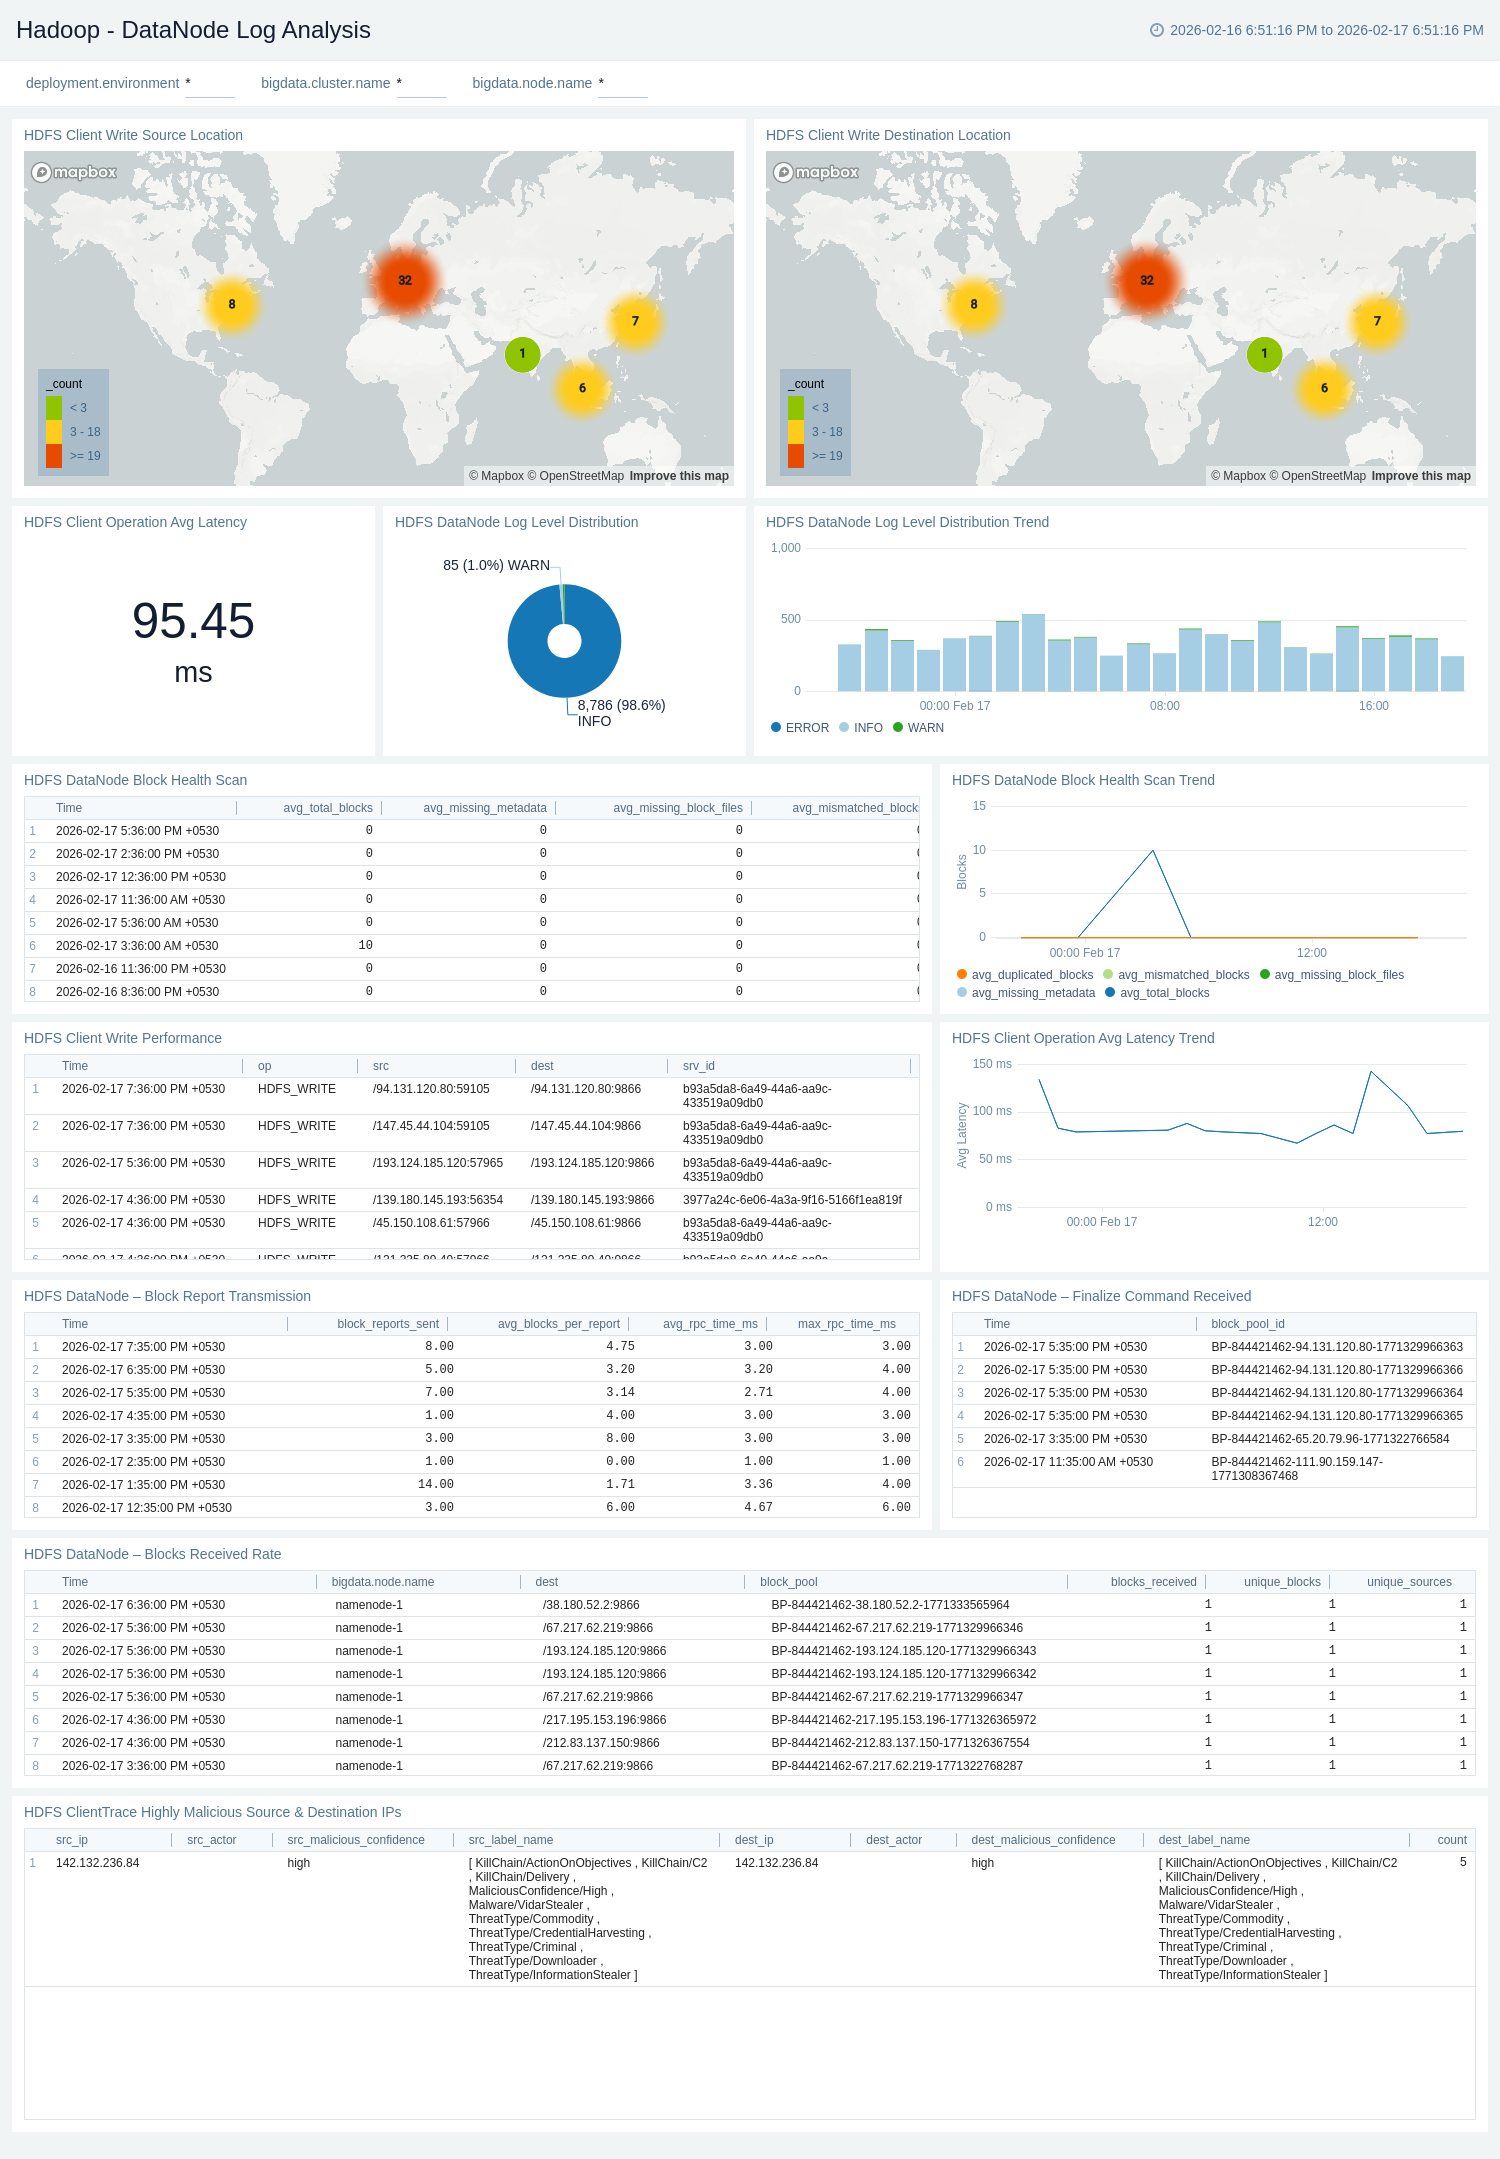
 ### Apache Hadoop - DataNode Log Analysis
The **Apache Hadoop – DataNode Log Analysis** dashboard provides visibility into HDFS DataNode health, performance, and client activity. It monitors block health scans, write performance, operational latency trends, and log-level distribution. The dashboard also includes source/destination analysis and threat intelligence insights to help detect anomalies and potential security risks.
Use this dashboard to:
* Monitor **DataNode block health and integrity**, including block health scan trends, scan results, and block-level inconsistencies.
* Track **DataNode operational events**, such as block report transmissions, finalize commands, blocks received rate, and log level distribution trends for proactive health monitoring.
* Analyze **HDFS client performance**, including write performance metrics, average operation latency (current and trend), and client activity patterns.
* Visualize **client write source and destination locations** to understand traffic flow across DataNodes.
* Detect potential security risks by identifying **highly malicious source and destination IPs** from HDFS client trace logs.
### Apache Hadoop - DataNode Log Analysis
The **Apache Hadoop – DataNode Log Analysis** dashboard provides visibility into HDFS DataNode health, performance, and client activity. It monitors block health scans, write performance, operational latency trends, and log-level distribution. The dashboard also includes source/destination analysis and threat intelligence insights to help detect anomalies and potential security risks.
Use this dashboard to:
* Monitor **DataNode block health and integrity**, including block health scan trends, scan results, and block-level inconsistencies.
* Track **DataNode operational events**, such as block report transmissions, finalize commands, blocks received rate, and log level distribution trends for proactive health monitoring.
* Analyze **HDFS client performance**, including write performance metrics, average operation latency (current and trend), and client activity patterns.
* Visualize **client write source and destination locations** to understand traffic flow across DataNodes.
* Detect potential security risks by identifying **highly malicious source and destination IPs** from HDFS client trace logs.
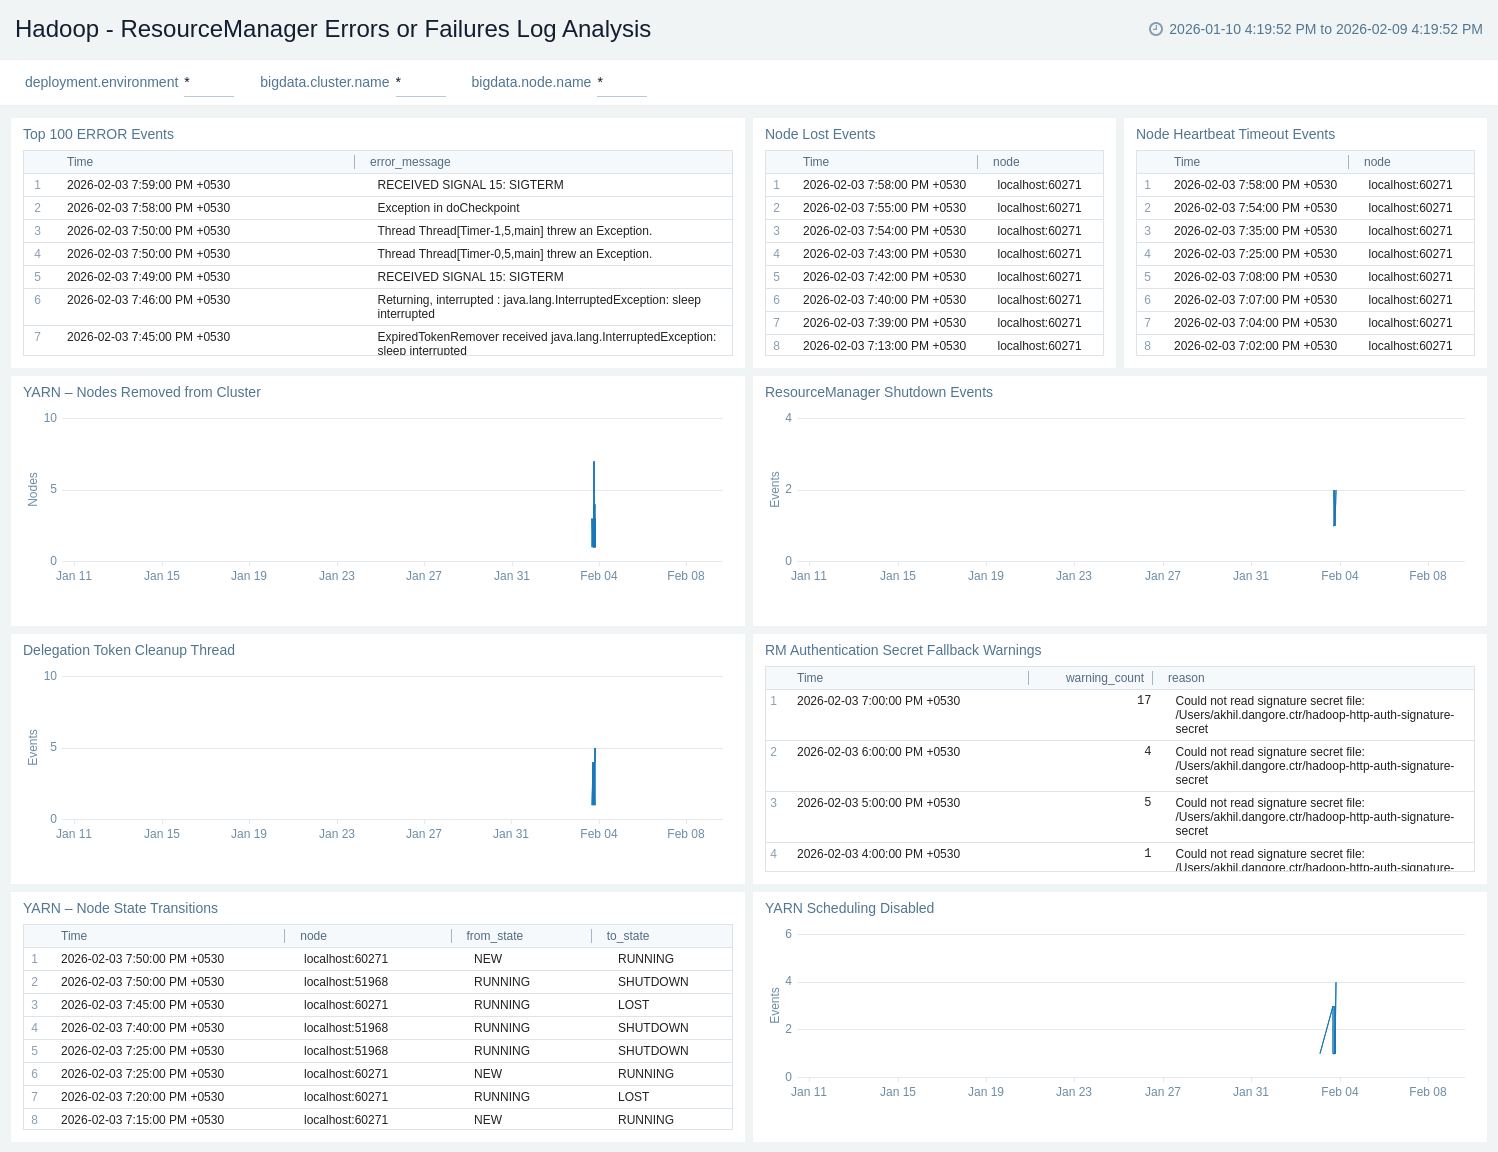
 ### Apache Hadoop - ResourceManager Errors or Failures Log Analysis
The **Apache Hadoop – ResourceManager Errors or Failures Log Analysis** provides quick visibility into critical YARN failures and instability, including node loss, heartbeat timeouts, scheduling disablement, and ResourceManager shutdowns.
Use this dashboard to:
* Detect **critical YARN failures and cluster instability**, including node loss, heartbeat timeouts, node removals, and scheduling disablement.
* Monitor **ResourceManager shutdowns, security-related warnings, and high-severity error events** to quickly identify issues impacting YARN availability and reliability.
### Apache Hadoop - ResourceManager Errors or Failures Log Analysis
The **Apache Hadoop – ResourceManager Errors or Failures Log Analysis** provides quick visibility into critical YARN failures and instability, including node loss, heartbeat timeouts, scheduling disablement, and ResourceManager shutdowns.
Use this dashboard to:
* Detect **critical YARN failures and cluster instability**, including node loss, heartbeat timeouts, node removals, and scheduling disablement.
* Monitor **ResourceManager shutdowns, security-related warnings, and high-severity error events** to quickly identify issues impacting YARN availability and reliability.
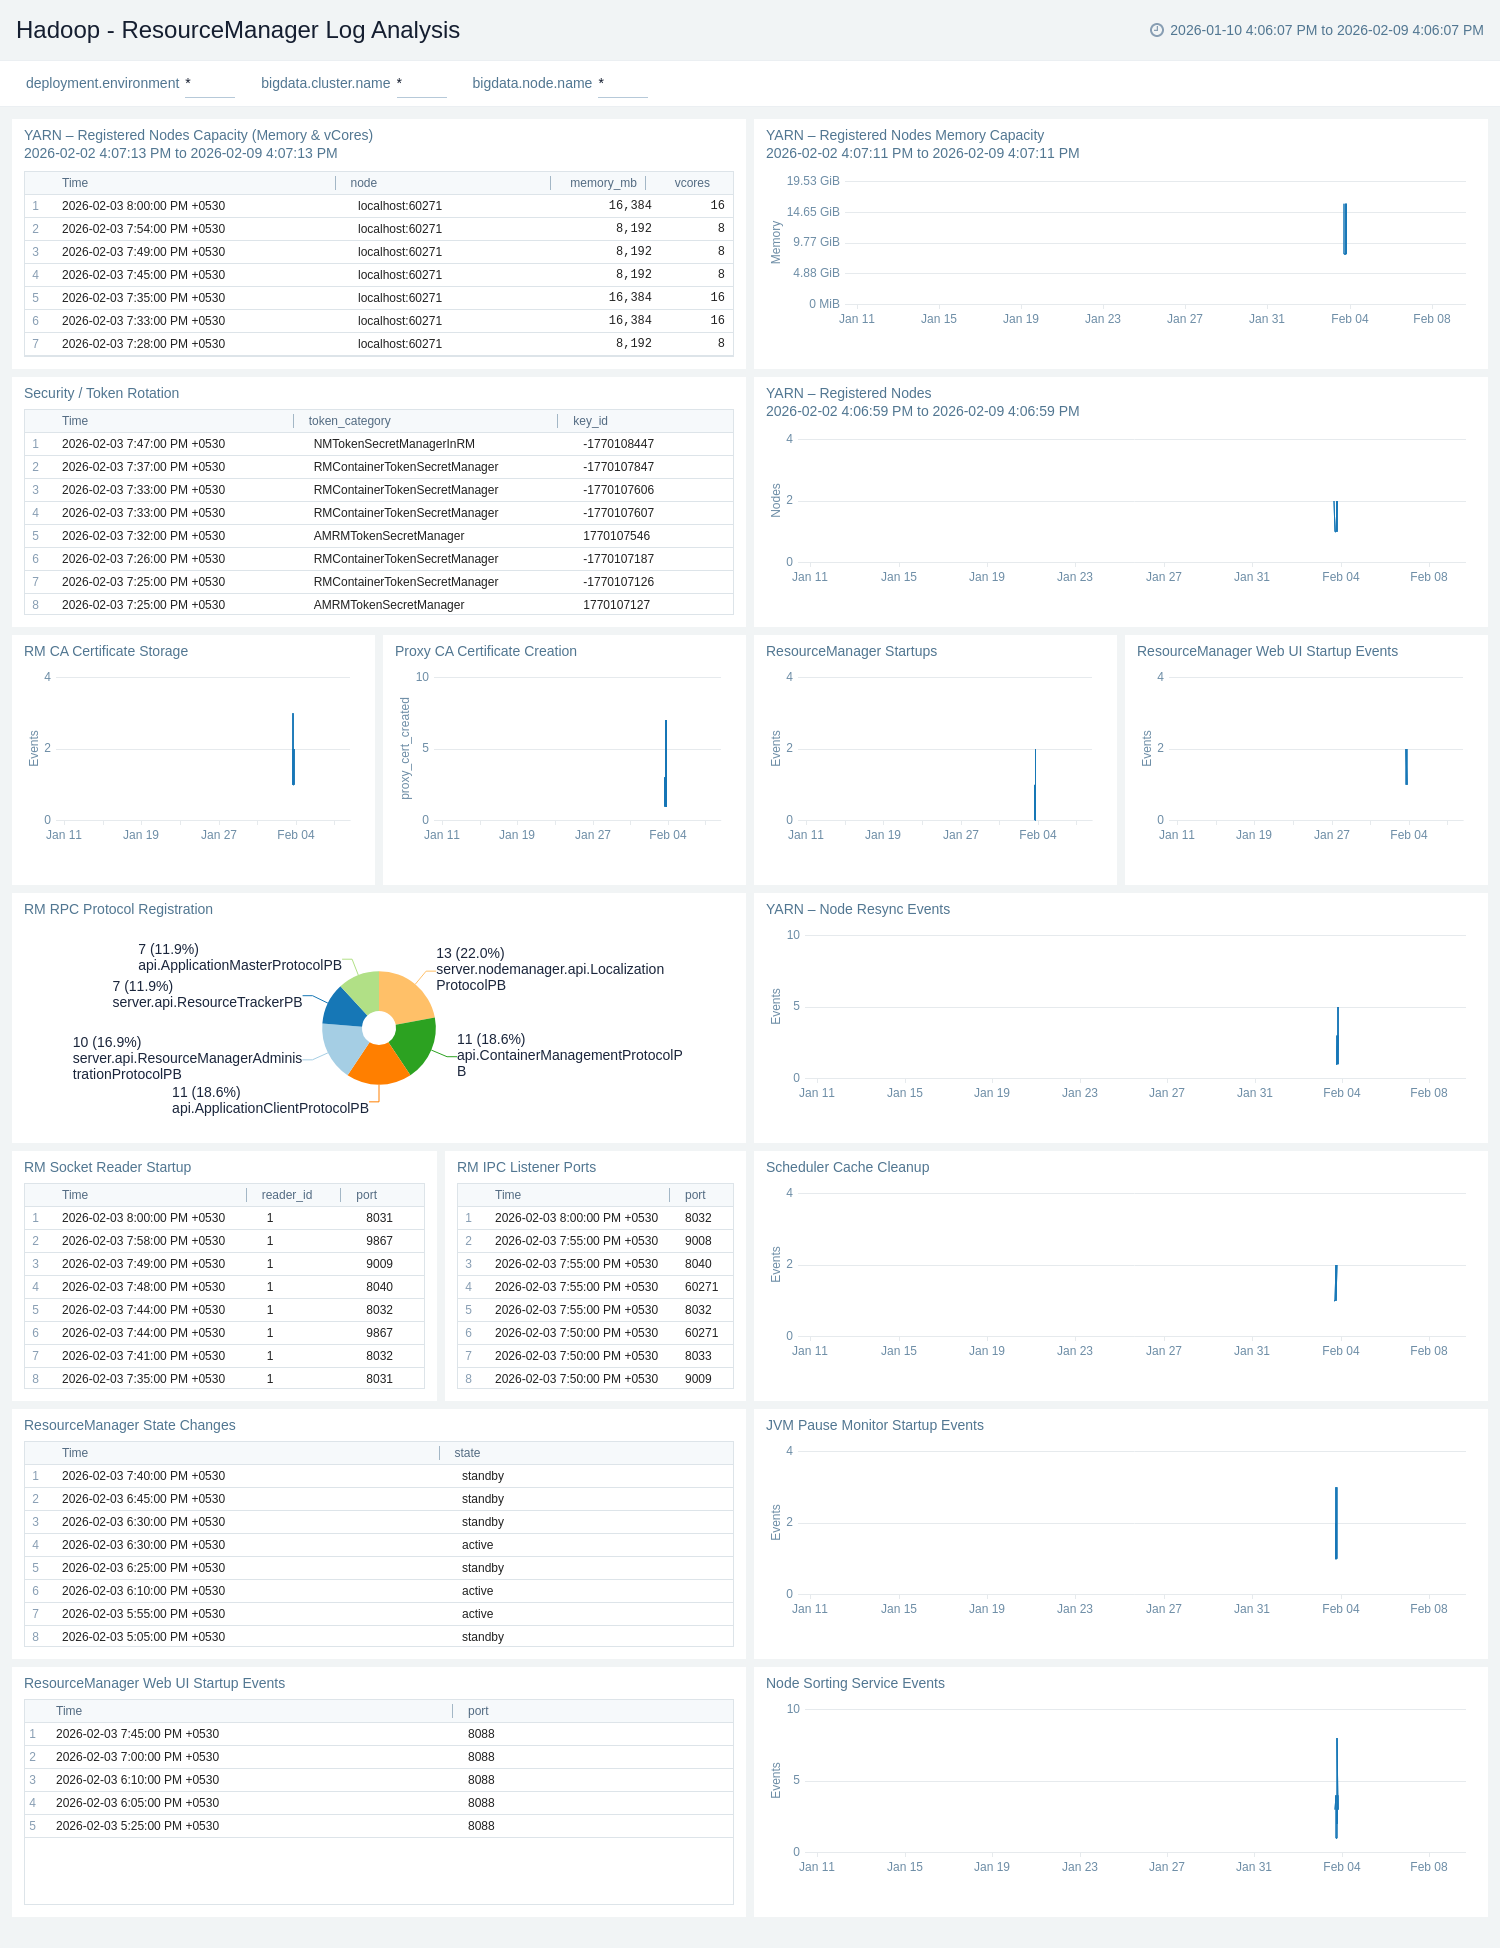
 ### Apache Hadoop - ResourceManager Log Analysis
The **Apache Hadoop – ResourceManager Log Analysis** provides visibility into ResourceManager startup, configuration, and internal service readiness.
Use this dashboard to:
- Monitor YARN ResourceManager operational health, including startups, state changes, and internal service readiness events.
- Track registered NodeManagers and cluster capacity (memory and vCores), along with node resync and scheduling-related activities.
- Gain visibility into security, certificate, JVM, and core ResourceManager services, helping identify configuration issues and operational risks before they impact workloads.
### Apache Hadoop - ResourceManager Log Analysis
The **Apache Hadoop – ResourceManager Log Analysis** provides visibility into ResourceManager startup, configuration, and internal service readiness.
Use this dashboard to:
- Monitor YARN ResourceManager operational health, including startups, state changes, and internal service readiness events.
- Track registered NodeManagers and cluster capacity (memory and vCores), along with node resync and scheduling-related activities.
- Gain visibility into security, certificate, JVM, and core ResourceManager services, helping identify configuration issues and operational risks before they impact workloads.
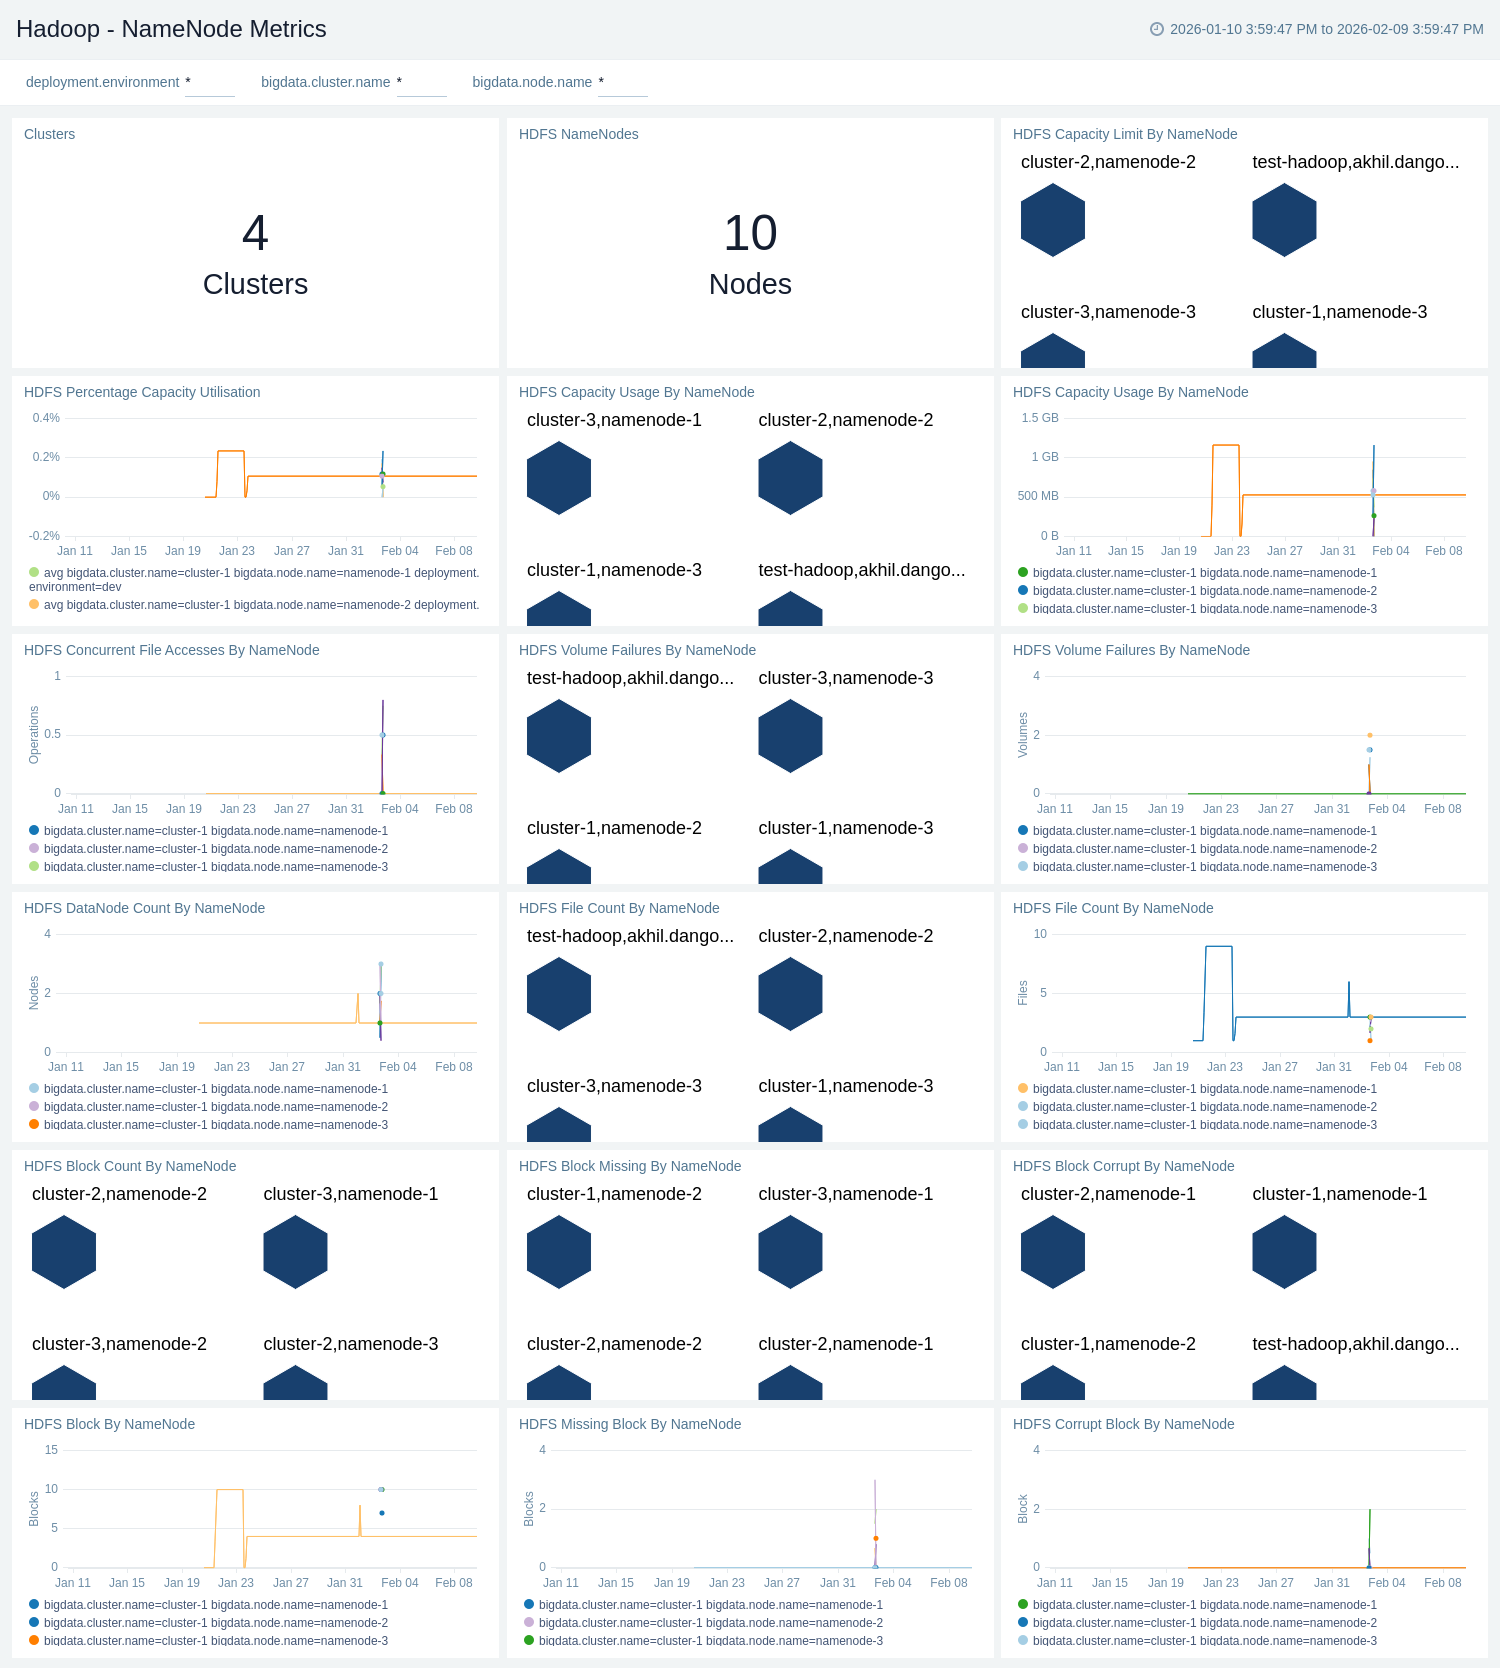
 ### Apache Hadoop - NameNode Metrics
The **Apache Hadoop – NameNode Metrics** provides a consolidated view of HDFS capacity, usage, and limits across NameNodes and clusters.
Use this dashboard to:
* Monitor **HDFS capacity and utilisation** across NameNodes and clusters, including total capacity, usage, and percentage utilisation.
* Track **HDFS block and file health**, such as total, missing, and corrupt blocks, file counts, and concurrent file accesses by NameNode.
* Gain visibility into **DataNode availability and volume health**, helping identify capacity risks and HDFS reliability issues early.
### Apache Hadoop - NameNode Metrics
The **Apache Hadoop – NameNode Metrics** provides a consolidated view of HDFS capacity, usage, and limits across NameNodes and clusters.
Use this dashboard to:
* Monitor **HDFS capacity and utilisation** across NameNodes and clusters, including total capacity, usage, and percentage utilisation.
* Track **HDFS block and file health**, such as total, missing, and corrupt blocks, file counts, and concurrent file accesses by NameNode.
* Gain visibility into **DataNode availability and volume health**, helping identify capacity risks and HDFS reliability issues early.
 ## Create monitors for Apache Hadoop app
import CreateMonitors from '../../../reuse/apps/create-monitors.md';
### Apache Hadoop alerts
| Name | Description | Alert Condition | Recover Condition |
|:--|:--|:--|:--|
| `Hadoop - HDFS Capacity Utilisation High` | This alert gets triggered when HDFS capacity utilisation exceeds the defined threshold, indicating risk of storage exhaustion. | Count > 95 % | Count < = 95 |
| `Hadoop - HDFS Corrupt Blocks Detected` | This alert gets triggered when one or more HDFS blocks are corrupt. | Count > 0 | Count < = 0 |
| `Hadoop - HDFS Missing Blocks Detected` | This alert gets triggered when HDFS reports missing blocks, indicating potential data loss. | Count > 0 | Count < = 0 |
| `Hadoop - HDFS Volume Failures Detected` | This alert gets triggered when HDFS reports volume failures, indicating disk or filesystem issues on DataNodes. | Count > 0 | Count < = 0 |
| `Hadoop - HDFS NameNode Down` | This alert gets triggered when HDFS does not detect an active NameNode, impacting filesystem availability. | Count < = 0 | Count > 0 |
| `Hadoop - HDFS DataNodes Down` | This alert gets triggered when the number of active HDFS DataNodes drops below the expected threshold. | Count < = 0 | Count > 0 |
## Create monitors for Apache Hadoop app
import CreateMonitors from '../../../reuse/apps/create-monitors.md';
### Apache Hadoop alerts
| Name | Description | Alert Condition | Recover Condition |
|:--|:--|:--|:--|
| `Hadoop - HDFS Capacity Utilisation High` | This alert gets triggered when HDFS capacity utilisation exceeds the defined threshold, indicating risk of storage exhaustion. | Count > 95 % | Count < = 95 |
| `Hadoop - HDFS Corrupt Blocks Detected` | This alert gets triggered when one or more HDFS blocks are corrupt. | Count > 0 | Count < = 0 |
| `Hadoop - HDFS Missing Blocks Detected` | This alert gets triggered when HDFS reports missing blocks, indicating potential data loss. | Count > 0 | Count < = 0 |
| `Hadoop - HDFS Volume Failures Detected` | This alert gets triggered when HDFS reports volume failures, indicating disk or filesystem issues on DataNodes. | Count > 0 | Count < = 0 |
| `Hadoop - HDFS NameNode Down` | This alert gets triggered when HDFS does not detect an active NameNode, impacting filesystem availability. | Count < = 0 | Count > 0 |
| `Hadoop - HDFS DataNodes Down` | This alert gets triggered when the number of active HDFS DataNodes drops below the expected threshold. | Count < = 0 | Count > 0 |