---
id: activemq-opentelemetry
title: ActiveMQ - OpenTelemetry Collector
sidebar_label: ActiveMQ - OTel Collector
description: The ActiveMQ app is a unified logs and metrics app that helps you monitor the availability, performance, health, and resource utilization of your ActiveMQ messaging clusters.
slug: /help/docs/integrations/containers-orchestration/opentelemetry/activemq-opentelemetry/
canonical: https://www.sumologic.com/help/docs/integrations/containers-orchestration/opentelemetry/activemq-opentelemetry/
---
import useBaseUrl from '@docusaurus/useBaseUrl';
import Tabs from '@theme/Tabs';
import TabItem from '@theme/TabItem';
}) The **ActiveMQ** app is a unified logs and metrics app that helps you monitor the availability, performance, health, and resource utilization of your ActiveMQ messaging clusters. Preconfigured dashboards provide insight into cluster status, nodes, producers, consumers, destinations, resource utilization, message rates, and error logs.
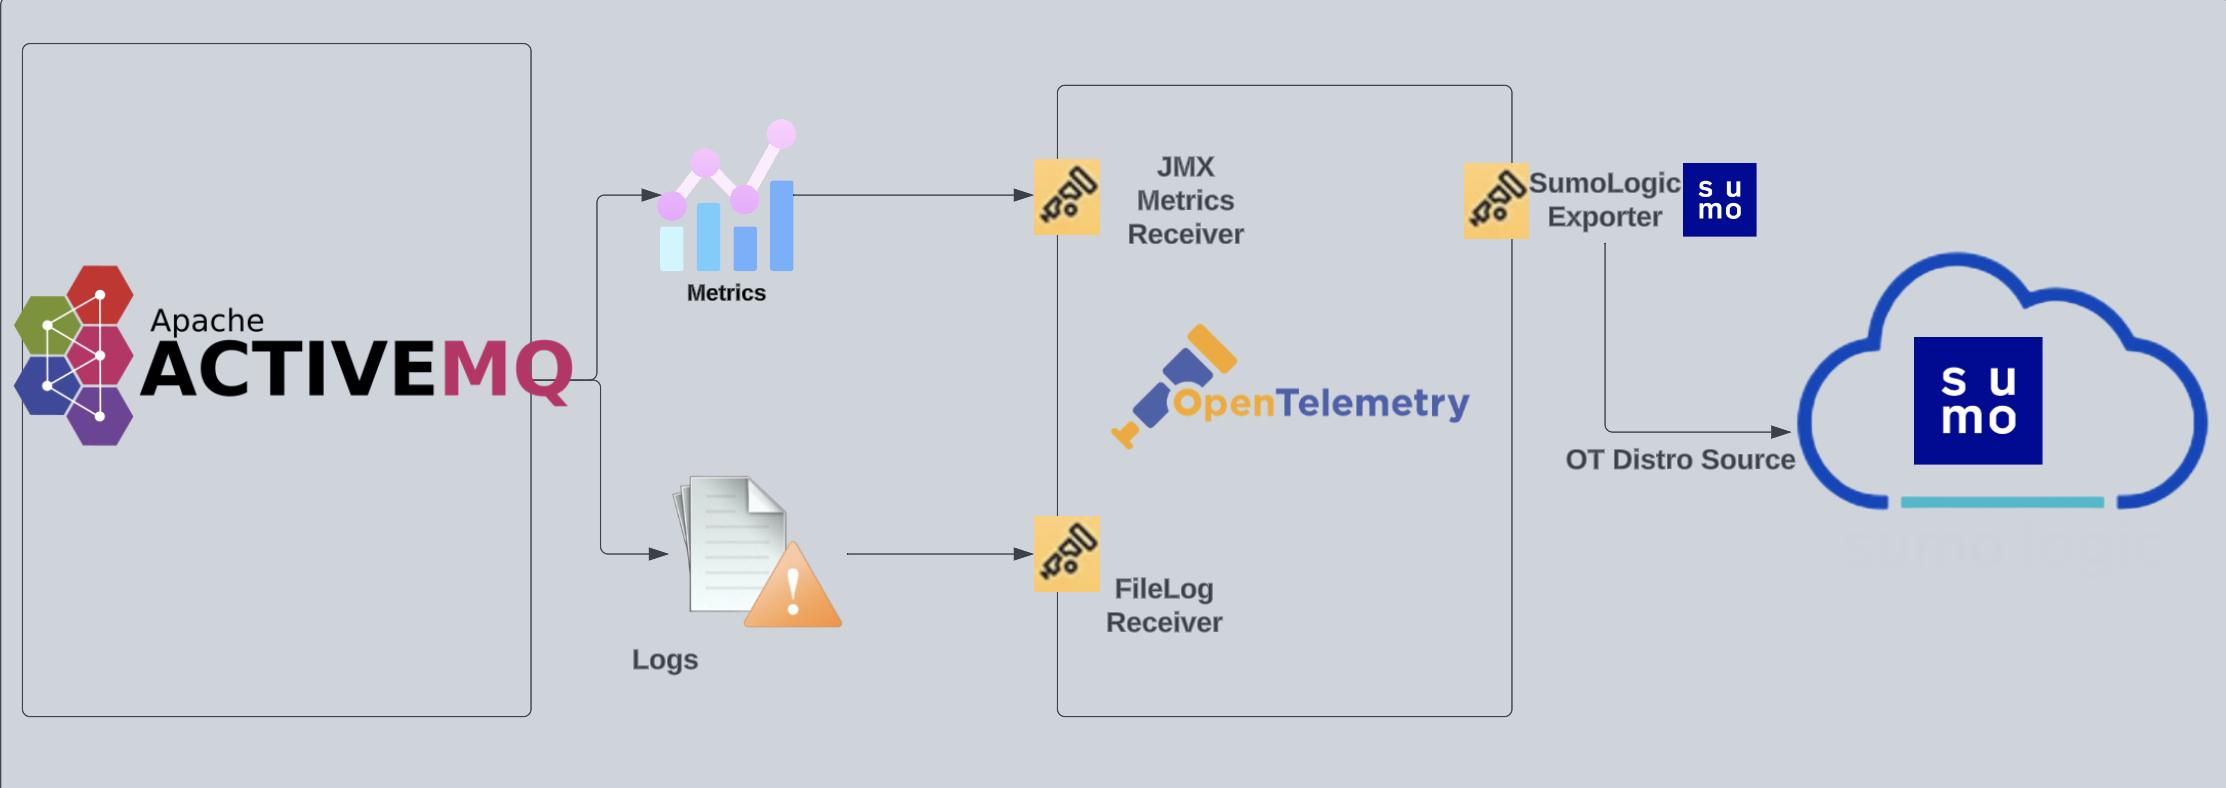
We use the OpenTelemetry collector for ActiveMQ metrics and logs collection.
The diagram below illustrates the components of the ActiveMQ collection for each ActiveMQ broker node. OpenTelemetry collector runs on the same host as ActiveMQ broker, and uses the [JMX Receiver](https://github.com/open-telemetry/opentelemetry-collector-contrib/tree/main/receiver/jmxreceiver) to obtain ActiveMQ metrics, and the [Sumo Logic OpenTelemetry Exporter](https://github.com/open-telemetry/opentelemetry-collector-contrib/tree/main/exporter/sumologicexporter) to send the metrics to Sumo Logic. ActiveMQ logs are sent to Sumo Logic through a [filelog receiver](https://github.com/open-telemetry/opentelemetry-collector-contrib/tree/main/receiver/filelogreceiver).
The **ActiveMQ** app is a unified logs and metrics app that helps you monitor the availability, performance, health, and resource utilization of your ActiveMQ messaging clusters. Preconfigured dashboards provide insight into cluster status, nodes, producers, consumers, destinations, resource utilization, message rates, and error logs.
We use the OpenTelemetry collector for ActiveMQ metrics and logs collection.
The diagram below illustrates the components of the ActiveMQ collection for each ActiveMQ broker node. OpenTelemetry collector runs on the same host as ActiveMQ broker, and uses the [JMX Receiver](https://github.com/open-telemetry/opentelemetry-collector-contrib/tree/main/receiver/jmxreceiver) to obtain ActiveMQ metrics, and the [Sumo Logic OpenTelemetry Exporter](https://github.com/open-telemetry/opentelemetry-collector-contrib/tree/main/exporter/sumologicexporter) to send the metrics to Sumo Logic. ActiveMQ logs are sent to Sumo Logic through a [filelog receiver](https://github.com/open-telemetry/opentelemetry-collector-contrib/tree/main/receiver/filelogreceiver).
 This app has been tested with the following ActiveMQ versions:
* `5.17.4`
* `5.18.2`
:::info
This app includes [built-in monitors](#activemq-alerts). For details on creating custom monitors, refer to [Create monitors for ActiveMQ app](#create-monitors-for-activemq-app).
:::
## Log and metrics types
The Sumo Logic app for ActiveMQ uses:
- ActiveMQ app supports the below log format in the `log4j2.properties` file.
* [Audit Logs](https://activemq.apache.org/audit-logging). Every management action made through JMX or Web Console management interface is logged in audit log files.
`appender.auditlog.layout.pattern=%d | %-5p | %m | %t%n`
* ActiveMQ Logs:
`appender.logfile.layout.pattern=%d | %-5p | %m | %c | %t%n%throwable{full}`
- For a list of metrics that are collected and used by the app, refer to the [ActiveMQ Metrics](https://github.com/open-telemetry/opentelemetry-java-contrib/blob/main/jmx-metrics/docs/target-systems/activemq.md).
## Fields creation in Sumo Logic for ActiveMQ
Following are the [fields](/docs/manage/fields/) which will be created as part of ActiveMQ app installation, if not already present.
* `messaging.cluster.name`. User configured. Enter a name to uniquely identify your ActiveMQ cluster. This cluster name will be shown in the Sumo Logic dashboards.
* `messaging.node.name`. Has value of `host name`.
* `messaging.system`. Has fixed value of `activemq`.
* `sumo.datasource`. Has fixed value of `activemq`.
If process metrics are enabled it will also create [fields for JMX metrics](/docs/integrations/app-development/opentelemetry/jmx-opentelemetry#fields-creation-in-sumo-logic-for-jmx).
## Prerequisites
### Configure logging in ActiveMQ
1. By default, ActiveMQ logs (`audit.log` and `activemq.log`) are stored in the directory called `${ACTIVEMQ_HOME}/data/activemq.log`. Make a note of this logs directory.
1. [Enable auditing](https://activemq.apache.org/audit-logging) if not enabled by default.
`ACTIVEMQ_OPTS="$ACTIVEMQ_OPTS -Dorg.apache.activemq.audit=true"`
1. Ensure that below log formats are present in [logging configuration](https://activemq.apache.org/how-do-i-change-the-logging). Also make sure appropriate log level is set.
* [Audit Logs](https://activemq.apache.org/audit-logging):
`appender.auditlog.layout.pattern=%d | %-5p | %m | %t%n`
* ActiveMQ Logs:
`appender.logfile.layout.pattern=%d | %-5p | %m | %c | %t%n%throwable{full}`
import LogsCollectionPrereqisites from '../../../reuse/apps/logs-collection-prereqisites.md';
For Windows systems, log files which are collected should be accessible by the SYSTEM group. Use the following set of PowerShell commands if the SYSTEM group does not have access.
```
$NewAcl = Get-Acl -Path ""
# Set properties
$identity = "NT AUTHORITY\SYSTEM"
$fileSystemRights = "ReadAndExecute"
$type = "Allow"
# Create new rule
$fileSystemAccessRuleArgumentList = $identity, $fileSystemRights, $type
$fileSystemAccessRule = New-Object -TypeName System.Security.AccessControl.FileSystemAccessRule -ArgumentList $fileSystemAccessRuleArgumentList
# Apply new rule
$NewAcl.SetAccessRule($fileSystemAccessRule)
Set-Acl -Path "" -AclObject $NewAcl
```
### Configure metrics in ActiveMQ
1. Follow the instructions in [JMX - OpenTelemetry's prerequisites section](/docs/integrations/app-development/opentelemetry/jmx-opentelemetry#prerequisites) to download the [JMX Metric Gatherer](https://github.com/open-telemetry/opentelemetry-java-contrib/blob/main/jmx-metrics/README.md) used by the [JMX Receiver](https://github.com/open-telemetry/opentelemetry-collector-contrib/tree/main/receiver/jmxreceiver#details).
1. Enable reads metrics from ActiveMQ servers via the [JMX MBeans](https://activemq.apache.org/jmx) by setting `useJmx="true"` in file config [ActiveMQ.xml](https://activemq.apache.org/xml-configuration.html)
```xml
...
```
1. Set the JMX port by changing the `ACTIVEMQ_SUNJMX_START` parameter. Usually it is set in `/opt/activemq/bin/env` or `C:\Program Files\apache-activemq\bin\activemq.bat` file.
```
ACTIVEMQ_SUNJMX_START="$ACTIVEMQ_SUNJMX_START -Dcom.sun.management.jmxremote -Dcom.sun.management.jmxremote.port=11099 -Dcom.sun.management.jmxremote.ssl=false -Dcom.sun.management.jmxremote.password.file=${ACTIVEMQ_CONF_DIR}/jmx.password -Dcom.sun.management.jmxremote.access.file=${ACTIVEMQ_CONF_DIR}/jmx.access"
```
## Collection configuration and app installation
import ConfigAppInstall from '../../../reuse/apps/opentelemetry/config-app-install.md';
### Step 1: Set up OpenTelemetry Collector
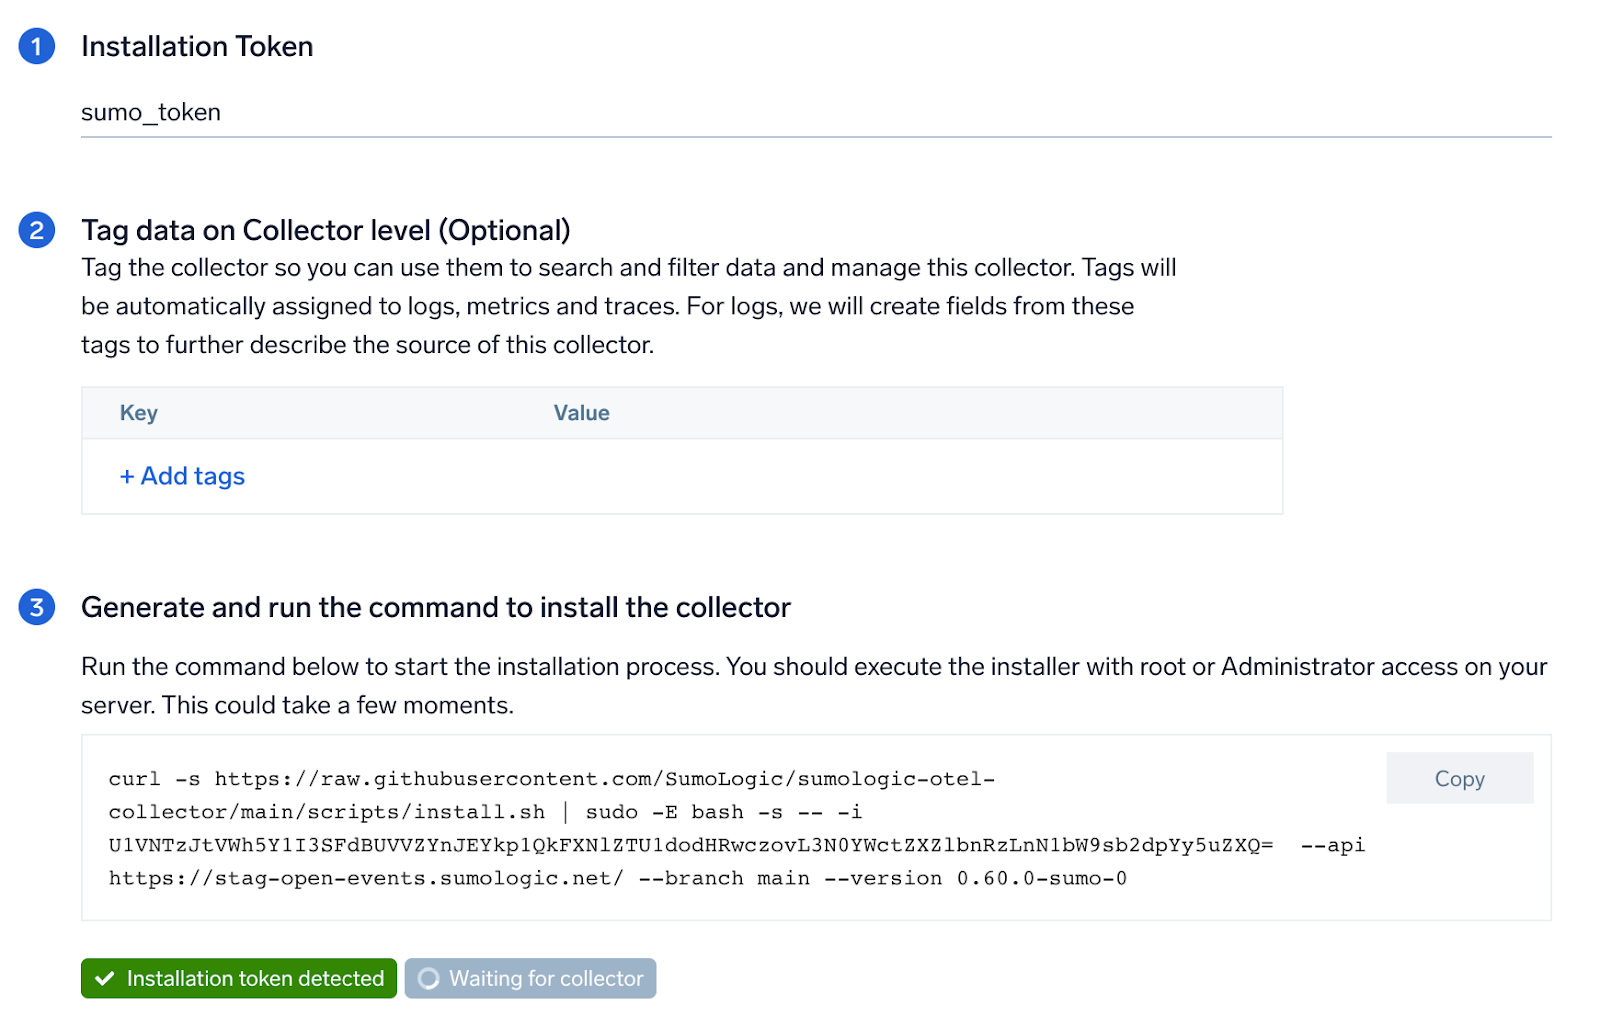
import SetupColl from '../../../reuse/apps/opentelemetry/set-up-collector.md';
This app has been tested with the following ActiveMQ versions:
* `5.17.4`
* `5.18.2`
:::info
This app includes [built-in monitors](#activemq-alerts). For details on creating custom monitors, refer to [Create monitors for ActiveMQ app](#create-monitors-for-activemq-app).
:::
## Log and metrics types
The Sumo Logic app for ActiveMQ uses:
- ActiveMQ app supports the below log format in the `log4j2.properties` file.
* [Audit Logs](https://activemq.apache.org/audit-logging). Every management action made through JMX or Web Console management interface is logged in audit log files.
`appender.auditlog.layout.pattern=%d | %-5p | %m | %t%n`
* ActiveMQ Logs:
`appender.logfile.layout.pattern=%d | %-5p | %m | %c | %t%n%throwable{full}`
- For a list of metrics that are collected and used by the app, refer to the [ActiveMQ Metrics](https://github.com/open-telemetry/opentelemetry-java-contrib/blob/main/jmx-metrics/docs/target-systems/activemq.md).
## Fields creation in Sumo Logic for ActiveMQ
Following are the [fields](/docs/manage/fields/) which will be created as part of ActiveMQ app installation, if not already present.
* `messaging.cluster.name`. User configured. Enter a name to uniquely identify your ActiveMQ cluster. This cluster name will be shown in the Sumo Logic dashboards.
* `messaging.node.name`. Has value of `host name`.
* `messaging.system`. Has fixed value of `activemq`.
* `sumo.datasource`. Has fixed value of `activemq`.
If process metrics are enabled it will also create [fields for JMX metrics](/docs/integrations/app-development/opentelemetry/jmx-opentelemetry#fields-creation-in-sumo-logic-for-jmx).
## Prerequisites
### Configure logging in ActiveMQ
1. By default, ActiveMQ logs (`audit.log` and `activemq.log`) are stored in the directory called `${ACTIVEMQ_HOME}/data/activemq.log`. Make a note of this logs directory.
1. [Enable auditing](https://activemq.apache.org/audit-logging) if not enabled by default.
`ACTIVEMQ_OPTS="$ACTIVEMQ_OPTS -Dorg.apache.activemq.audit=true"`
1. Ensure that below log formats are present in [logging configuration](https://activemq.apache.org/how-do-i-change-the-logging). Also make sure appropriate log level is set.
* [Audit Logs](https://activemq.apache.org/audit-logging):
`appender.auditlog.layout.pattern=%d | %-5p | %m | %t%n`
* ActiveMQ Logs:
`appender.logfile.layout.pattern=%d | %-5p | %m | %c | %t%n%throwable{full}`
import LogsCollectionPrereqisites from '../../../reuse/apps/logs-collection-prereqisites.md';
For Windows systems, log files which are collected should be accessible by the SYSTEM group. Use the following set of PowerShell commands if the SYSTEM group does not have access.
```
$NewAcl = Get-Acl -Path ""
# Set properties
$identity = "NT AUTHORITY\SYSTEM"
$fileSystemRights = "ReadAndExecute"
$type = "Allow"
# Create new rule
$fileSystemAccessRuleArgumentList = $identity, $fileSystemRights, $type
$fileSystemAccessRule = New-Object -TypeName System.Security.AccessControl.FileSystemAccessRule -ArgumentList $fileSystemAccessRuleArgumentList
# Apply new rule
$NewAcl.SetAccessRule($fileSystemAccessRule)
Set-Acl -Path "" -AclObject $NewAcl
```
### Configure metrics in ActiveMQ
1. Follow the instructions in [JMX - OpenTelemetry's prerequisites section](/docs/integrations/app-development/opentelemetry/jmx-opentelemetry#prerequisites) to download the [JMX Metric Gatherer](https://github.com/open-telemetry/opentelemetry-java-contrib/blob/main/jmx-metrics/README.md) used by the [JMX Receiver](https://github.com/open-telemetry/opentelemetry-collector-contrib/tree/main/receiver/jmxreceiver#details).
1. Enable reads metrics from ActiveMQ servers via the [JMX MBeans](https://activemq.apache.org/jmx) by setting `useJmx="true"` in file config [ActiveMQ.xml](https://activemq.apache.org/xml-configuration.html)
```xml
...
```
1. Set the JMX port by changing the `ACTIVEMQ_SUNJMX_START` parameter. Usually it is set in `/opt/activemq/bin/env` or `C:\Program Files\apache-activemq\bin\activemq.bat` file.
```
ACTIVEMQ_SUNJMX_START="$ACTIVEMQ_SUNJMX_START -Dcom.sun.management.jmxremote -Dcom.sun.management.jmxremote.port=11099 -Dcom.sun.management.jmxremote.ssl=false -Dcom.sun.management.jmxremote.password.file=${ACTIVEMQ_CONF_DIR}/jmx.password -Dcom.sun.management.jmxremote.access.file=${ACTIVEMQ_CONF_DIR}/jmx.access"
```
## Collection configuration and app installation
import ConfigAppInstall from '../../../reuse/apps/opentelemetry/config-app-install.md';
### Step 1: Set up OpenTelemetry Collector
import SetupColl from '../../../reuse/apps/opentelemetry/set-up-collector.md';
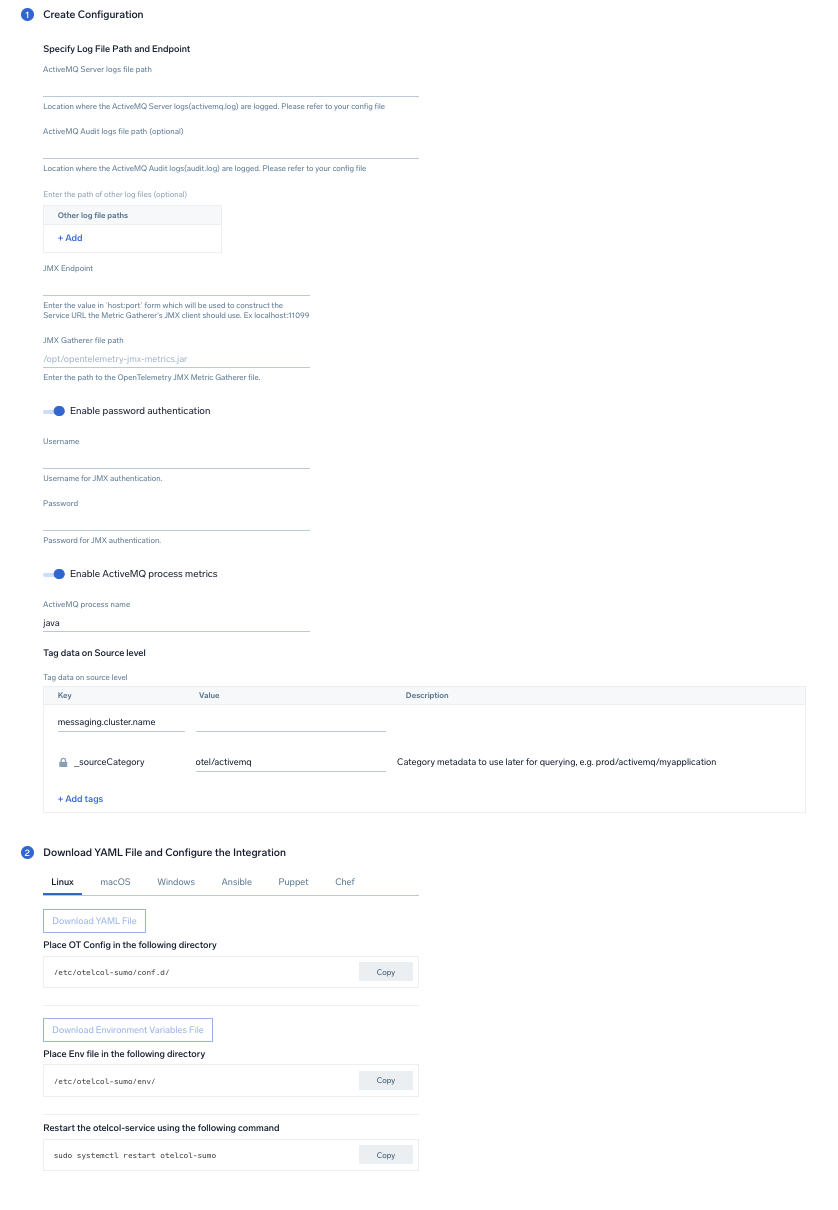
 ### Step 2: Configure integration
In this step we will be configuring the YAML required for ActiveMQ Collection.
Below is the input required:
- **ActiveMQ Server logs file path**. Enter the path to the ActiveMQ log file for your ActiveMQ instance.
- **ActiveMQ Audit logs file path**. Enter the path to the Audit log file for your ActiveMQ instance.
- **JMX Endpoint**. Enter the value in `host:port` form which will be used to construct the Service URL, the Metric Gatherer's JMX client should use.
- **JMX Gatherer file path**. Enter the path to the OpenTelemetry JMX Metric Gatherer file configured in the prerequisites section.
- **Enable password authentication**. Toggle this if you are using password based jmx authentication.
- **UserName**. Username for JMX authentication, if applicable.
- **Password**. Password for JMX authentication, if applicable.
- **Enable ActiveMQ process metrics**. Toggle this to collect ActiveMQ Process metrics. Disable this if you are already collecting process metrics from the host.
- **ActiveMQ process name**. Enter the ActiveMQ process name.It will be used for filtering process metrics based on process name.
- **Fields**. `messaging.cluster.name` User configured. Enter a name to identify this ActiveMQ cluster. This cluster name will be shown in the Sumo Logic dashboards.
Click on the **Download YAML File** button to get the YAML file.
import CollectorVersionNote from '../../../reuse/apps/opentelemetry/collector-version-note.md';
import EnvVarOpt from '../../../reuse/apps/opentelemetry/env-var-optional.md';
### Step 2: Configure integration
In this step we will be configuring the YAML required for ActiveMQ Collection.
Below is the input required:
- **ActiveMQ Server logs file path**. Enter the path to the ActiveMQ log file for your ActiveMQ instance.
- **ActiveMQ Audit logs file path**. Enter the path to the Audit log file for your ActiveMQ instance.
- **JMX Endpoint**. Enter the value in `host:port` form which will be used to construct the Service URL, the Metric Gatherer's JMX client should use.
- **JMX Gatherer file path**. Enter the path to the OpenTelemetry JMX Metric Gatherer file configured in the prerequisites section.
- **Enable password authentication**. Toggle this if you are using password based jmx authentication.
- **UserName**. Username for JMX authentication, if applicable.
- **Password**. Password for JMX authentication, if applicable.
- **Enable ActiveMQ process metrics**. Toggle this to collect ActiveMQ Process metrics. Disable this if you are already collecting process metrics from the host.
- **ActiveMQ process name**. Enter the ActiveMQ process name.It will be used for filtering process metrics based on process name.
- **Fields**. `messaging.cluster.name` User configured. Enter a name to identify this ActiveMQ cluster. This cluster name will be shown in the Sumo Logic dashboards.
Click on the **Download YAML File** button to get the YAML file.
import CollectorVersionNote from '../../../reuse/apps/opentelemetry/collector-version-note.md';
import EnvVarOpt from '../../../reuse/apps/opentelemetry/env-var-optional.md';
 ### Step 3: Send logs and metrics to Sumo Logic
import LogsIntro from '../../../reuse/apps/opentelemetry/send-logs-intro.md';
1. Copy the YAML file to `/etc/otelcol-sumo/conf.d/` folder in the ActiveMQ instance that needs to be monitored.
1. Restart the collector using:
```
sudo systemctl restart otelcol-sumo
```
1. Copy the YAML file to `C:\ProgramData\Sumo Logic\OpenTelemetry Collector\config\conf.d` folder in the machine which needs to be monitored.
1. Restart the collector using:
```
Restart-Service -Name OtelcolSumo
```
1. Copy the YAML file to `/etc/otelcol-sumo/conf.d/` folder in the ActiveMQ instance which needs to be monitored.
1. Restart the `otelcol-sumo` process using the below command:
```
otelcol-sumo --config /etc/otelcol-sumo/sumologic.yaml --config "glob:/etc/otelcol-sumo/conf.d/*.yaml"
```
import ChefEnv from '../../../reuse/apps/opentelemetry/chef-with-env.md';
import AnsEnv from '../../../reuse/apps/opentelemetry/ansible-with-env.md';
import PuppetEnv from '../../../reuse/apps/opentelemetry/puppet-with-env.md';
import LogsOutro from '../../../reuse/apps/opentelemetry/send-logs-outro.md';
## Sample log messages
```json title="ActiveMQ Logs"
2021-06-22 15:00:41,922 | DEBUG | Stopping transport tcp:///192.168.100.8:36302@61616 | org.apache.activemq.transport.tcp.TcpTransport | ActiveMQ BrokerService[localhost] Task-15300
```
```json title="Audit Logs"
2010-12-22 12:12:07,225 | INFO | admin requested /admin/createDestination.action [JMSDestination='test' JMSDestinationType='queue' secret='4eb0bc3e-9d7a-4256-844c-24f40fda98f1' ] from 127.0.0.1 | qtp12205619-39
2010-12-22 12:12:14,512 | INFO | admin requested /admin/purgeDestination.action [JMSDestination='test' JMSDestinationType='queue' secret='eff6a932-1b58-45da-a64a-1b30b246cfc9' ] from 127.0.0.1 | qtp12205619-36
2010-12-22 12:12:17,802 | INFO | admin requested /admin/sendMessage.action [JMSTimeToLive='' JMSXGroupSeq='' AMQ_SCHEDULED_DELAY='' JMSType='' JMSMessageCountHeader='JMSXMessageCounter' JMSXGroupID='' JMSReplyTo='' JMSDestination='test' AMQ_SCHEDULED_PERIOD='' JMSText='Enter some text
here for the message body...' JMSDestinationType='queue' AMQ_SCHEDULED_CRON='' JMSCorrelationID='' AMQ_SCHEDULED_REPEAT='' JMSMessageCount='1' secret='a0e1df62-14d6-4425-82a2-17aa01a16e7d' JMSPriority='' ] from 127.0.0.1 | qtp12205619-37
```
## Sample metrics
```sql
"Query","metric","deployment.environment","host.name","messaging.cluster.name","messaging.node.name","messaging.system","os.type","sumo.datasource","broker","destination","unit","latest"
```
```sql
"#A","activemq.message.wait_time.avg","testprod","ip-10-0-10-92","activemq_cluster","ip-10-0-10-92","activemq","linux","activemq","localhost","testtopic","ms","254.4"
```
## Sample queries
### Log query
This sample log query is from the **Events by Severity** panel of the **ActiveMQ - Logs** dashboard.
```sql
sumo.datasource=activemq deployment.environment={{deployment.environment}} messaging.cluster.name={{messaging.cluster.name}} messaging.node.name={{messaging.node.name}}
| json auto maxdepth 1 nodrop
| if (isEmpty(log), _raw, log) as raw_log_message
| parse field=raw_log_message "*|*|*|*|*" as timedate,severity,msg,class,address |trim(severity) as severity | count by severity
```
### Metrics query
This sample metrics query from the **Average Enqueue Latency** panel of the **ActiveMQ - Destinations** dashboard.
```sql
sumo.datasource=activemq deployment.environment={{deployment.environment}} messaging.cluster.name={{messaging.cluster.name}} messaging.node.name={{messaging.node.name}} destination={{destination}} !(destination=activemq.*) metric=activemq.message.wait_time.avg | avg by destination,messaging.cluster.name
```
## Viewing the ActiveMQ dashboards
All dashboards have a set of filters that you can apply to the entire dashboard. Use these filters to drill down and examine the data to a granular level.
- You can change the time range for a dashboard or panel by selecting a predefined interval from a drop-down list, choosing a recently used time range, or specifying custom dates and times. [Learn more](/docs/dashboards/set-custom-time-ranges/).
- You can use template variables to drill down and examine the data on a granular level. For more information, see [Filtering Dashboards with Template Variables](/docs/dashboards/filter-template-variables/).
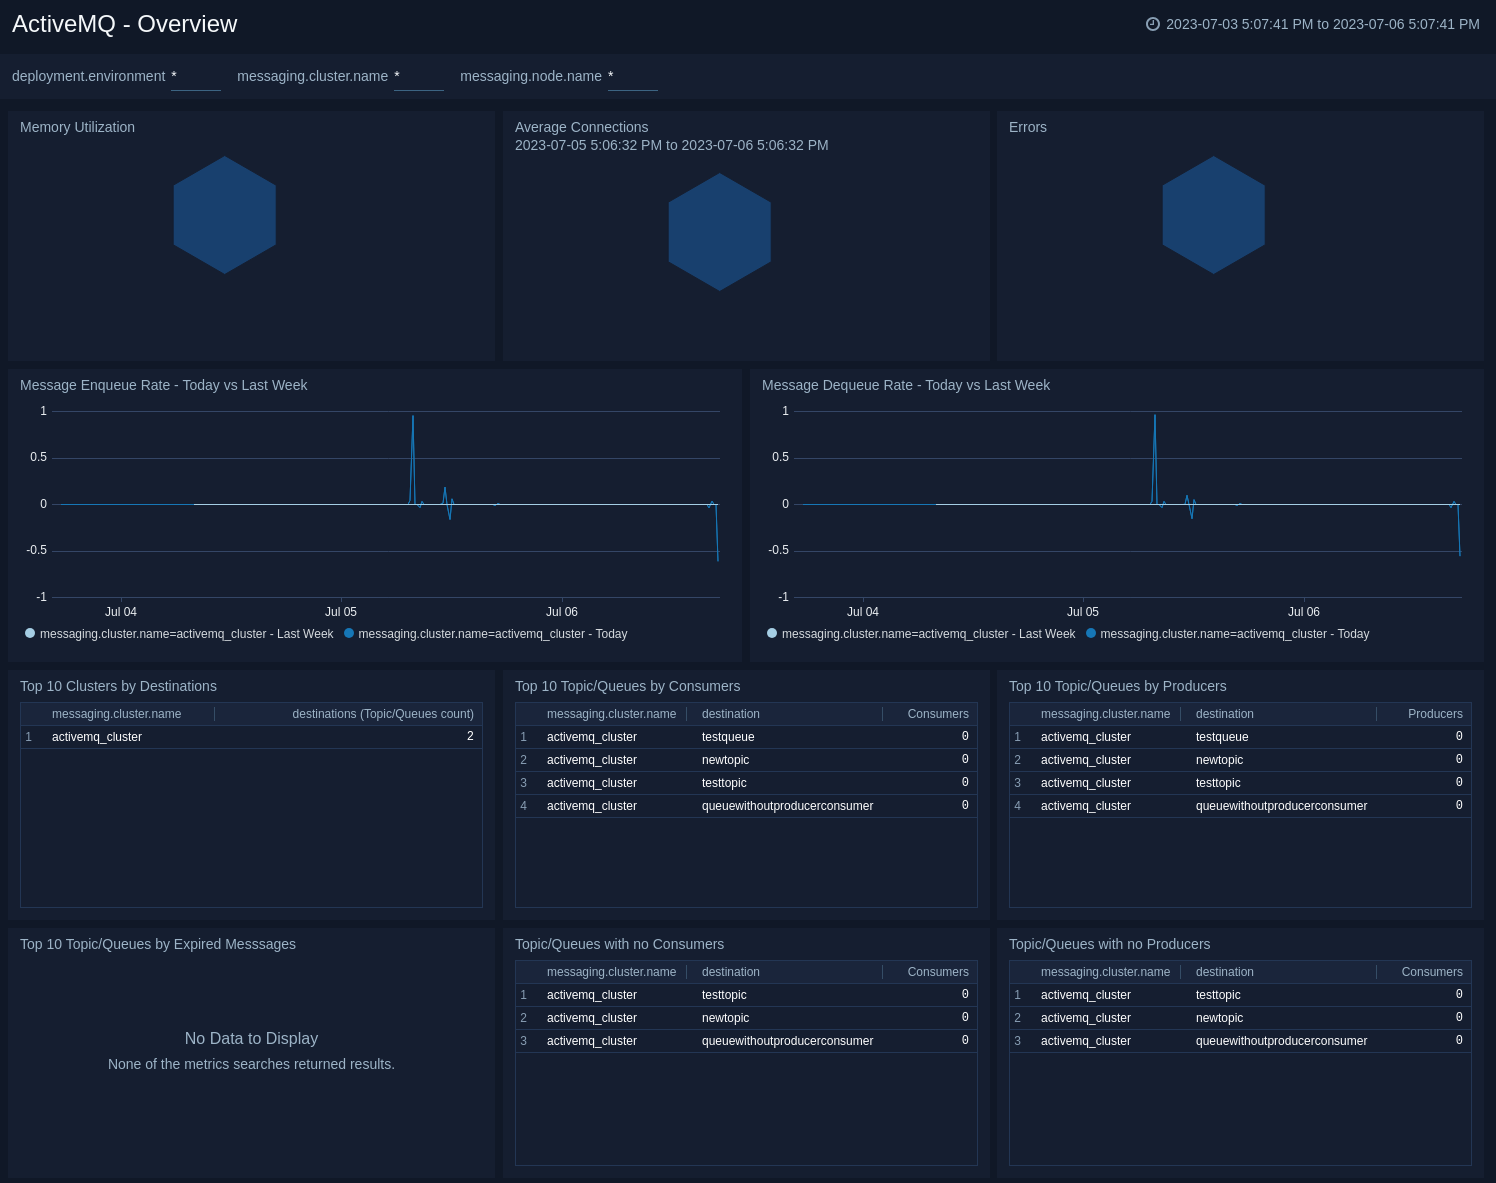
### Overview
The **ActiveMQ - Overview** dashboard gives you an at-a-glance view of your ActiveMQ deployment across brokers, queues, topics, and messages.
Use this dashboard to:
* Analyze memory, errors and connections.
* Gain insights into Enqueue messages for your ActiveMQ server and compare it with last week's trend.
* Gain insights into Dequeue messages for your ActiveMQ server and compare it with last week's trend.
* Determine queues/topics with no producers and consumers.
* Determine queues/topics with expired messages.
### Step 3: Send logs and metrics to Sumo Logic
import LogsIntro from '../../../reuse/apps/opentelemetry/send-logs-intro.md';
1. Copy the YAML file to `/etc/otelcol-sumo/conf.d/` folder in the ActiveMQ instance that needs to be monitored.
1. Restart the collector using:
```
sudo systemctl restart otelcol-sumo
```
1. Copy the YAML file to `C:\ProgramData\Sumo Logic\OpenTelemetry Collector\config\conf.d` folder in the machine which needs to be monitored.
1. Restart the collector using:
```
Restart-Service -Name OtelcolSumo
```
1. Copy the YAML file to `/etc/otelcol-sumo/conf.d/` folder in the ActiveMQ instance which needs to be monitored.
1. Restart the `otelcol-sumo` process using the below command:
```
otelcol-sumo --config /etc/otelcol-sumo/sumologic.yaml --config "glob:/etc/otelcol-sumo/conf.d/*.yaml"
```
import ChefEnv from '../../../reuse/apps/opentelemetry/chef-with-env.md';
import AnsEnv from '../../../reuse/apps/opentelemetry/ansible-with-env.md';
import PuppetEnv from '../../../reuse/apps/opentelemetry/puppet-with-env.md';
import LogsOutro from '../../../reuse/apps/opentelemetry/send-logs-outro.md';
## Sample log messages
```json title="ActiveMQ Logs"
2021-06-22 15:00:41,922 | DEBUG | Stopping transport tcp:///192.168.100.8:36302@61616 | org.apache.activemq.transport.tcp.TcpTransport | ActiveMQ BrokerService[localhost] Task-15300
```
```json title="Audit Logs"
2010-12-22 12:12:07,225 | INFO | admin requested /admin/createDestination.action [JMSDestination='test' JMSDestinationType='queue' secret='4eb0bc3e-9d7a-4256-844c-24f40fda98f1' ] from 127.0.0.1 | qtp12205619-39
2010-12-22 12:12:14,512 | INFO | admin requested /admin/purgeDestination.action [JMSDestination='test' JMSDestinationType='queue' secret='eff6a932-1b58-45da-a64a-1b30b246cfc9' ] from 127.0.0.1 | qtp12205619-36
2010-12-22 12:12:17,802 | INFO | admin requested /admin/sendMessage.action [JMSTimeToLive='' JMSXGroupSeq='' AMQ_SCHEDULED_DELAY='' JMSType='' JMSMessageCountHeader='JMSXMessageCounter' JMSXGroupID='' JMSReplyTo='' JMSDestination='test' AMQ_SCHEDULED_PERIOD='' JMSText='Enter some text
here for the message body...' JMSDestinationType='queue' AMQ_SCHEDULED_CRON='' JMSCorrelationID='' AMQ_SCHEDULED_REPEAT='' JMSMessageCount='1' secret='a0e1df62-14d6-4425-82a2-17aa01a16e7d' JMSPriority='' ] from 127.0.0.1 | qtp12205619-37
```
## Sample metrics
```sql
"Query","metric","deployment.environment","host.name","messaging.cluster.name","messaging.node.name","messaging.system","os.type","sumo.datasource","broker","destination","unit","latest"
```
```sql
"#A","activemq.message.wait_time.avg","testprod","ip-10-0-10-92","activemq_cluster","ip-10-0-10-92","activemq","linux","activemq","localhost","testtopic","ms","254.4"
```
## Sample queries
### Log query
This sample log query is from the **Events by Severity** panel of the **ActiveMQ - Logs** dashboard.
```sql
sumo.datasource=activemq deployment.environment={{deployment.environment}} messaging.cluster.name={{messaging.cluster.name}} messaging.node.name={{messaging.node.name}}
| json auto maxdepth 1 nodrop
| if (isEmpty(log), _raw, log) as raw_log_message
| parse field=raw_log_message "*|*|*|*|*" as timedate,severity,msg,class,address |trim(severity) as severity | count by severity
```
### Metrics query
This sample metrics query from the **Average Enqueue Latency** panel of the **ActiveMQ - Destinations** dashboard.
```sql
sumo.datasource=activemq deployment.environment={{deployment.environment}} messaging.cluster.name={{messaging.cluster.name}} messaging.node.name={{messaging.node.name}} destination={{destination}} !(destination=activemq.*) metric=activemq.message.wait_time.avg | avg by destination,messaging.cluster.name
```
## Viewing the ActiveMQ dashboards
All dashboards have a set of filters that you can apply to the entire dashboard. Use these filters to drill down and examine the data to a granular level.
- You can change the time range for a dashboard or panel by selecting a predefined interval from a drop-down list, choosing a recently used time range, or specifying custom dates and times. [Learn more](/docs/dashboards/set-custom-time-ranges/).
- You can use template variables to drill down and examine the data on a granular level. For more information, see [Filtering Dashboards with Template Variables](/docs/dashboards/filter-template-variables/).
### Overview
The **ActiveMQ - Overview** dashboard gives you an at-a-glance view of your ActiveMQ deployment across brokers, queues, topics, and messages.
Use this dashboard to:
* Analyze memory, errors and connections.
* Gain insights into Enqueue messages for your ActiveMQ server and compare it with last week's trend.
* Gain insights into Dequeue messages for your ActiveMQ server and compare it with last week's trend.
* Determine queues/topics with no producers and consumers.
* Determine queues/topics with expired messages.
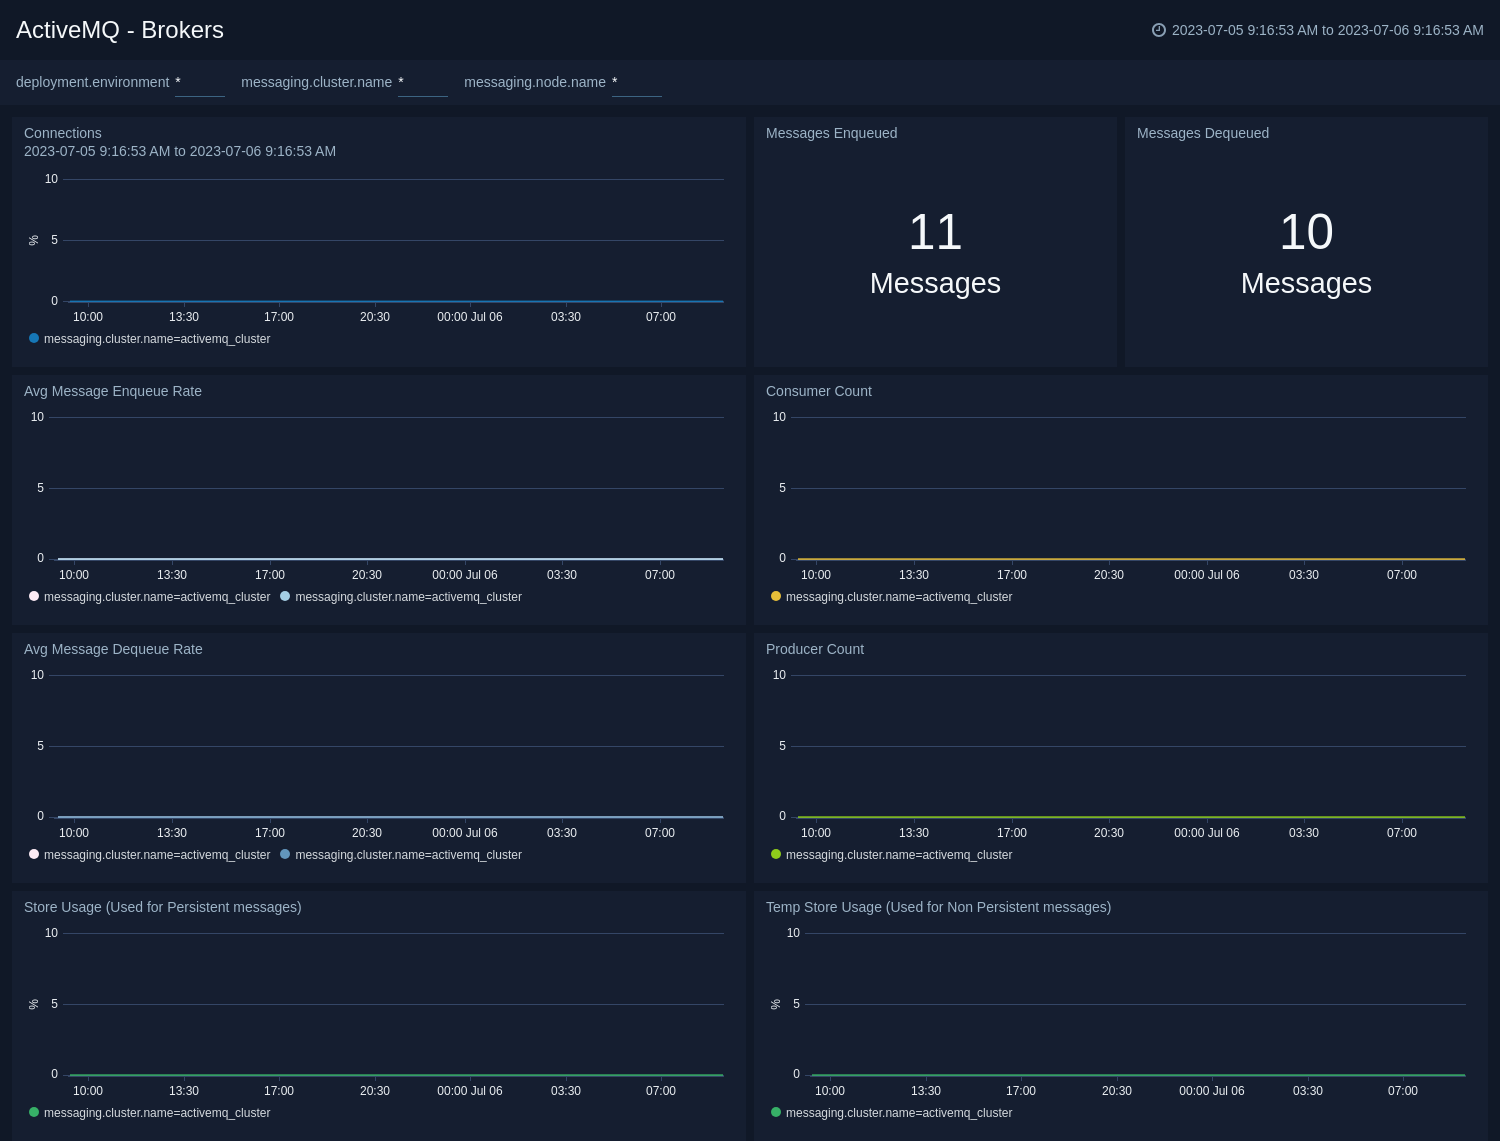
 ### Brokers
The **ActiveMQ - Brokers** dashboard provides an at-a-glance view of the state of your brokers in the ActiveMQ cluster.
Use this dashboard to:
* Gain insights into the storage and temp storage for your ActiveMQ brokers.
* Gain insights into enqueue rate, dequeue rate for your ActiveMQ brokers.
* Determine the amount of current connections, producers, and consumers for your ActiveMQ brokers.
### Brokers
The **ActiveMQ - Brokers** dashboard provides an at-a-glance view of the state of your brokers in the ActiveMQ cluster.
Use this dashboard to:
* Gain insights into the storage and temp storage for your ActiveMQ brokers.
* Gain insights into enqueue rate, dequeue rate for your ActiveMQ brokers.
* Determine the amount of current connections, producers, and consumers for your ActiveMQ brokers.
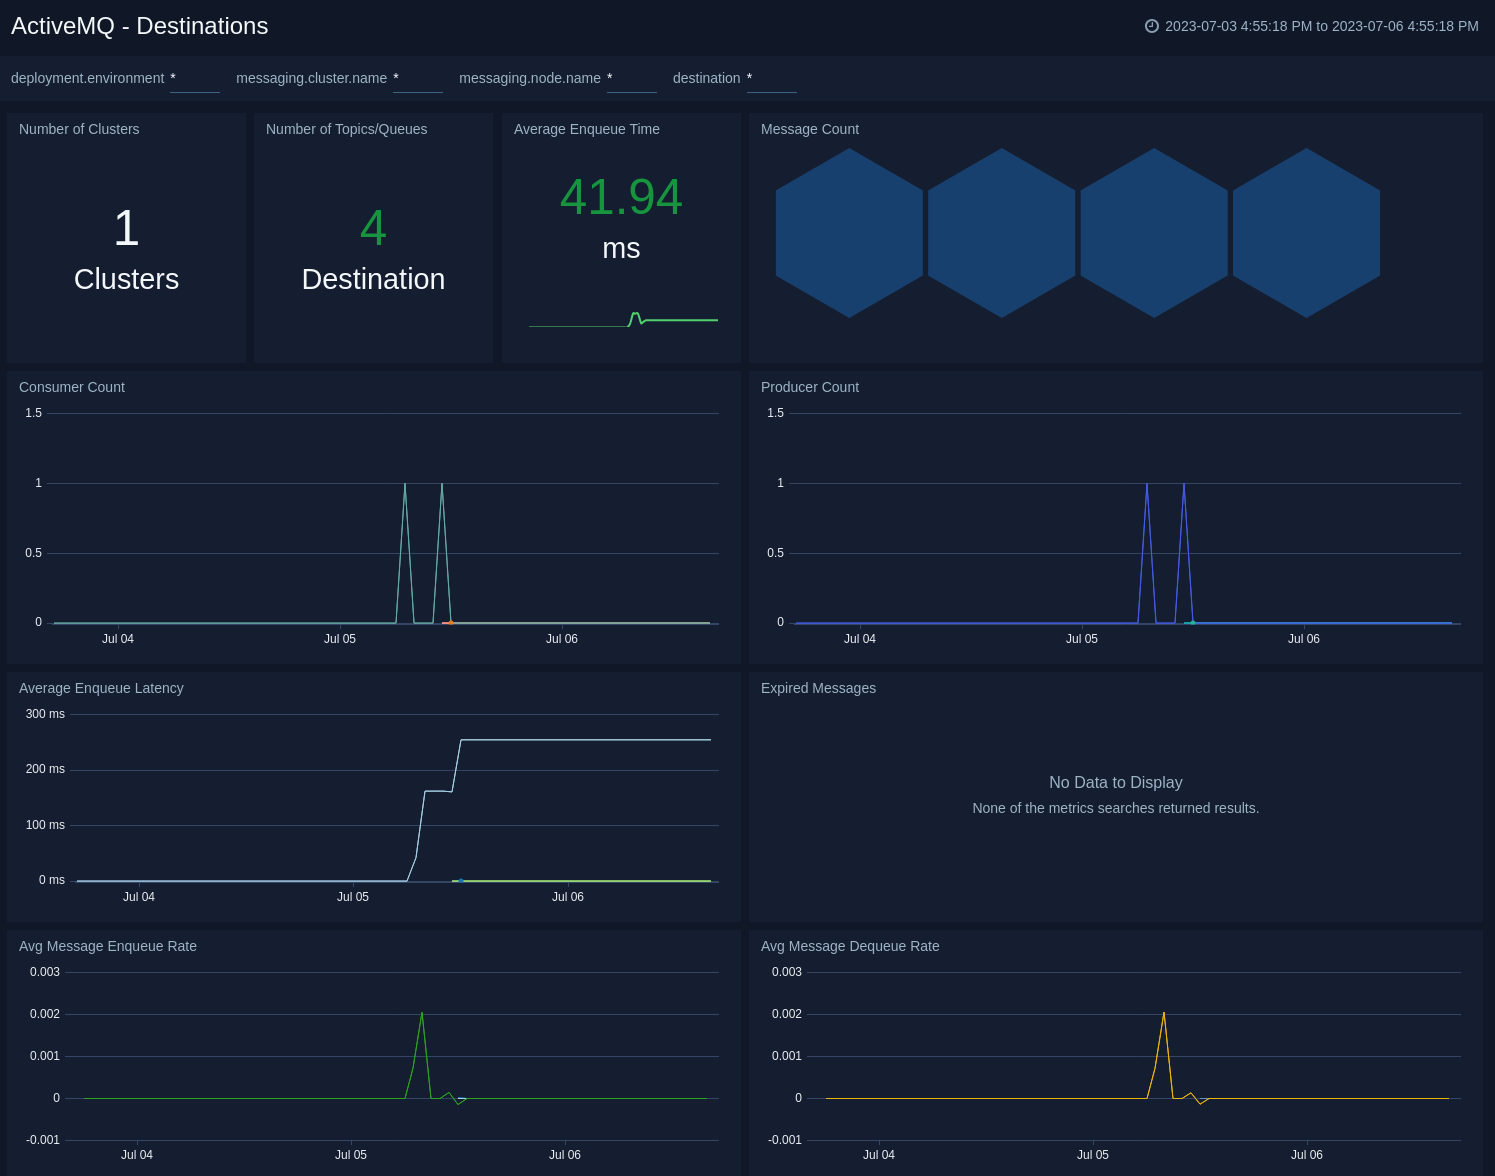
 ### Destinations
The **ActiveMQ - Destinations** dashboard provides an at-a-glance view of the state of your topics/queues in ActiveMQ clusters.
Use this dashboard to:
* Monitor enqueue latency across topics/queues.
* Gain insights into enqueue rate, dequeue rate across topics/queues.
* Monitor producers, consumers and expired messages on topics/queues.
* Determine the number of topics/queues.
### Destinations
The **ActiveMQ - Destinations** dashboard provides an at-a-glance view of the state of your topics/queues in ActiveMQ clusters.
Use this dashboard to:
* Monitor enqueue latency across topics/queues.
* Gain insights into enqueue rate, dequeue rate across topics/queues.
* Monitor producers, consumers and expired messages on topics/queues.
* Determine the number of topics/queues.
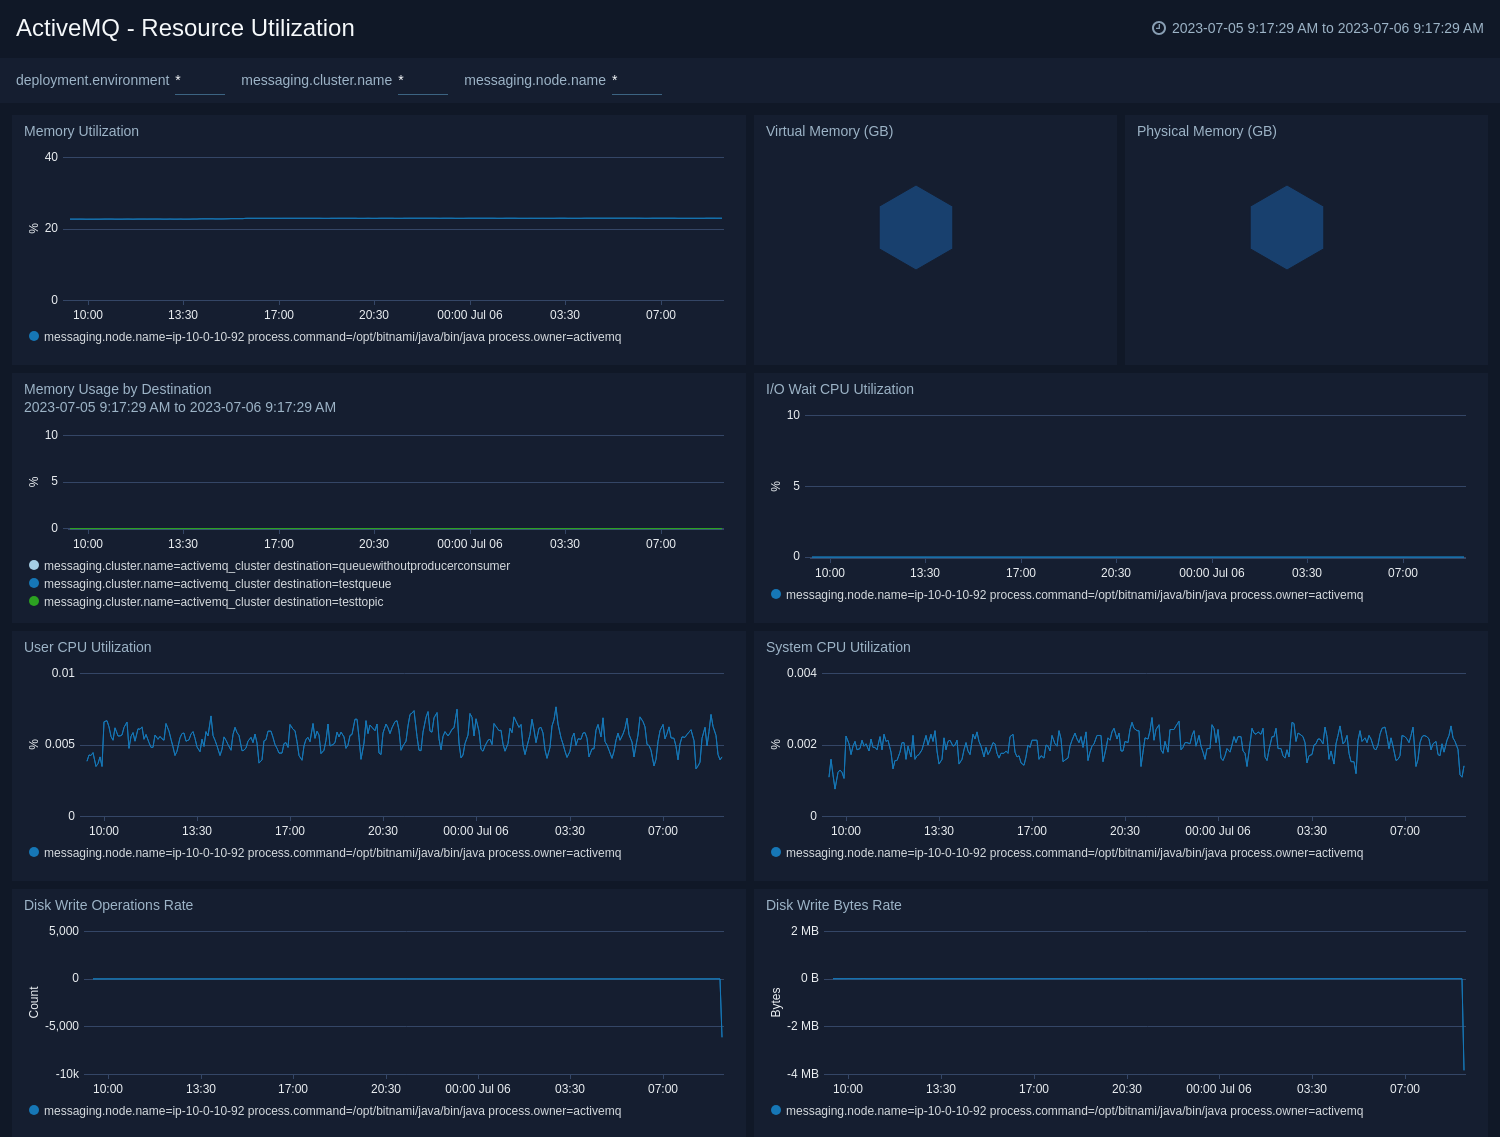
 ### Resource utilization
The **ActiveMQ - Resource Utilization** dashboard provides an at-a-glance view of the state of system loads in clusters: Virtual memory usage, physical memory usage, CPU utilization, disk operations, disk writes, and I/O wait.
Use this dashboard to:
* Analyze memory and CPU utilization of activemq process.
* Gain insights into disk write operations and disk write bytes of activemq process.
* Gain insights into memory utilization by topics/queues.
### Resource utilization
The **ActiveMQ - Resource Utilization** dashboard provides an at-a-glance view of the state of system loads in clusters: Virtual memory usage, physical memory usage, CPU utilization, disk operations, disk writes, and I/O wait.
Use this dashboard to:
* Analyze memory and CPU utilization of activemq process.
* Gain insights into disk write operations and disk write bytes of activemq process.
* Gain insights into memory utilization by topics/queues.
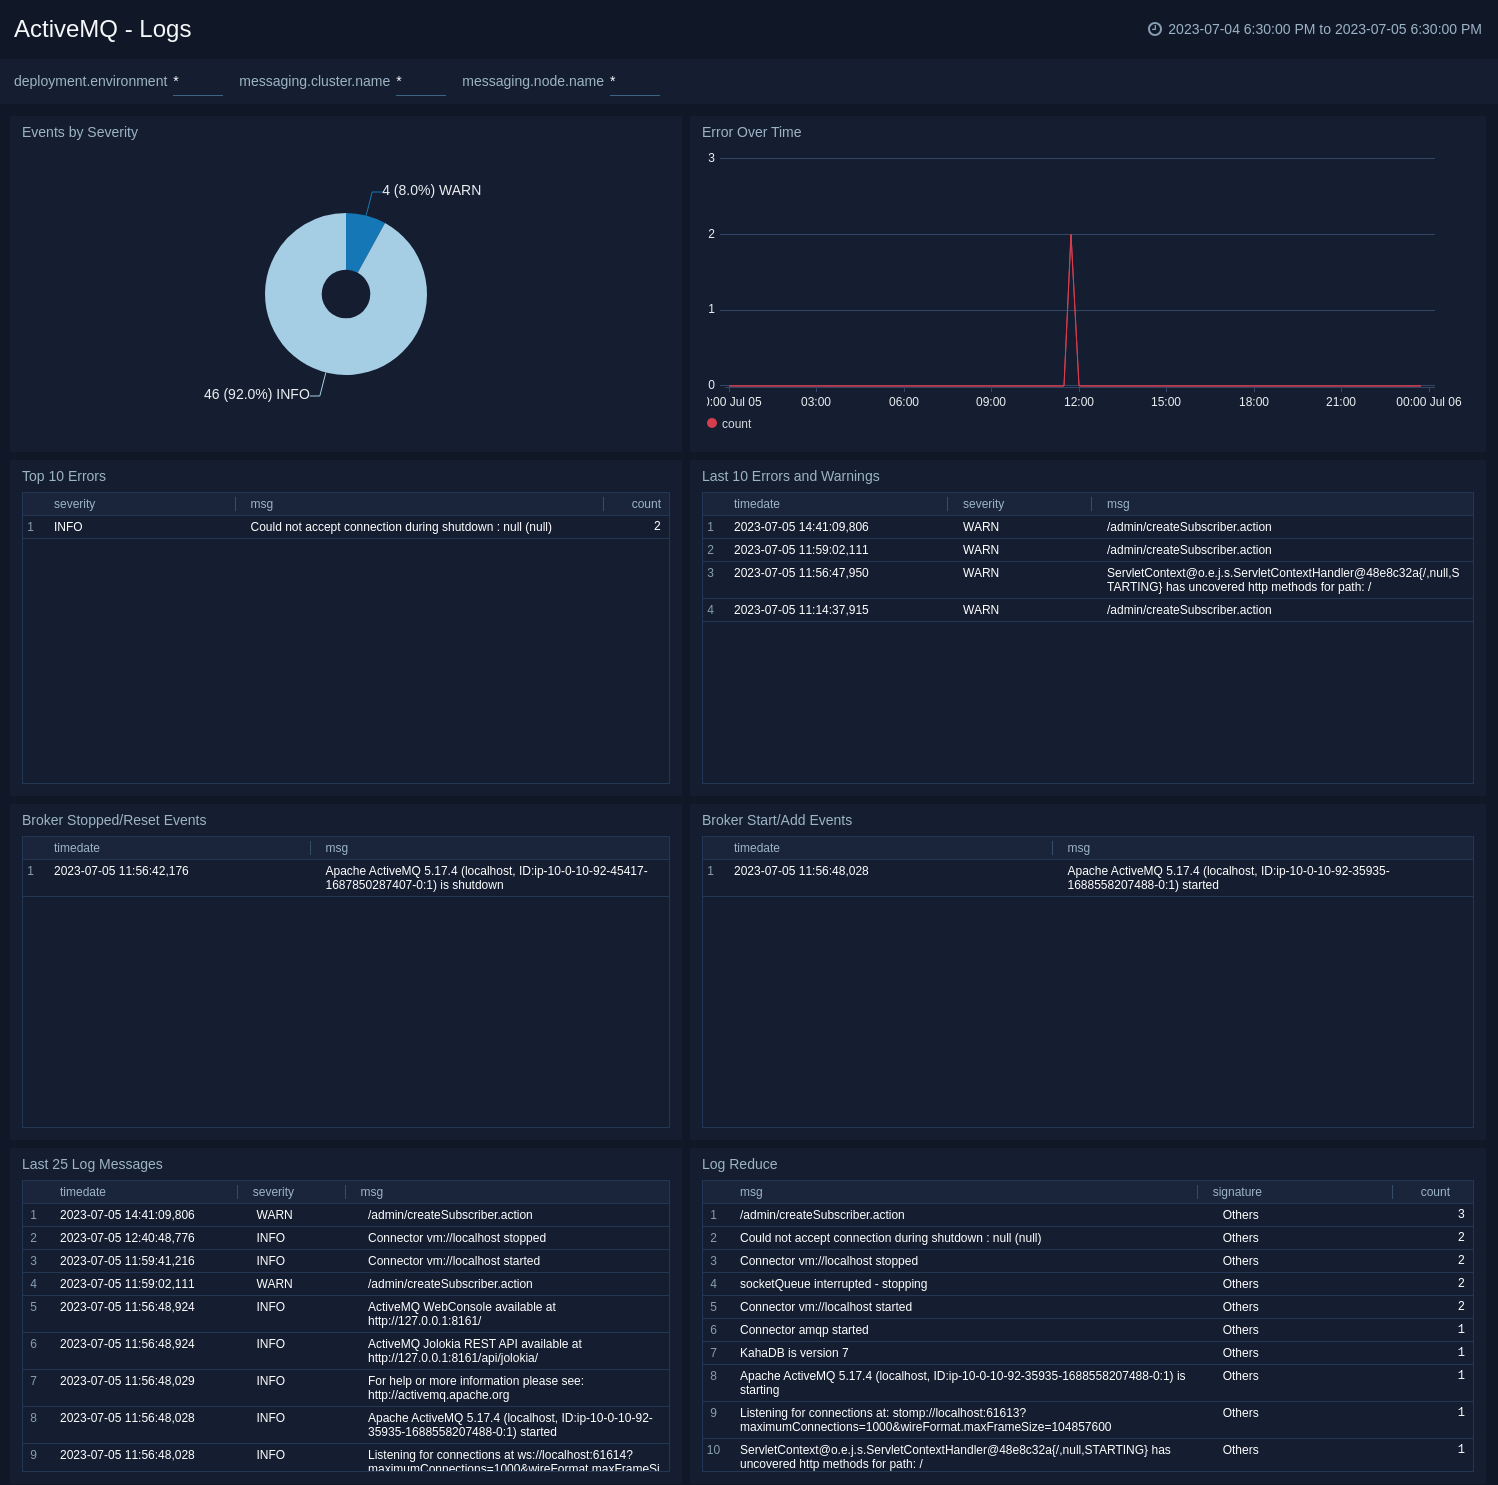
 ### Logs
The **ActiveMQ - Logs** dashboard helps you quickly analyze your ActiveMQ error logs across all clusters.
Use this dashboard to:
* Identify critical events in your ActiveMQ cluster.
* Examine trends to detect spikes in error or fatal events
* Monitor Broker added/started and shutdown events in your cluster.
* Quickly determine patterns across all error logs in a given ActiveMQ cluster.
### Logs
The **ActiveMQ - Logs** dashboard helps you quickly analyze your ActiveMQ error logs across all clusters.
Use this dashboard to:
* Identify critical events in your ActiveMQ cluster.
* Examine trends to detect spikes in error or fatal events
* Monitor Broker added/started and shutdown events in your cluster.
* Quickly determine patterns across all error logs in a given ActiveMQ cluster.
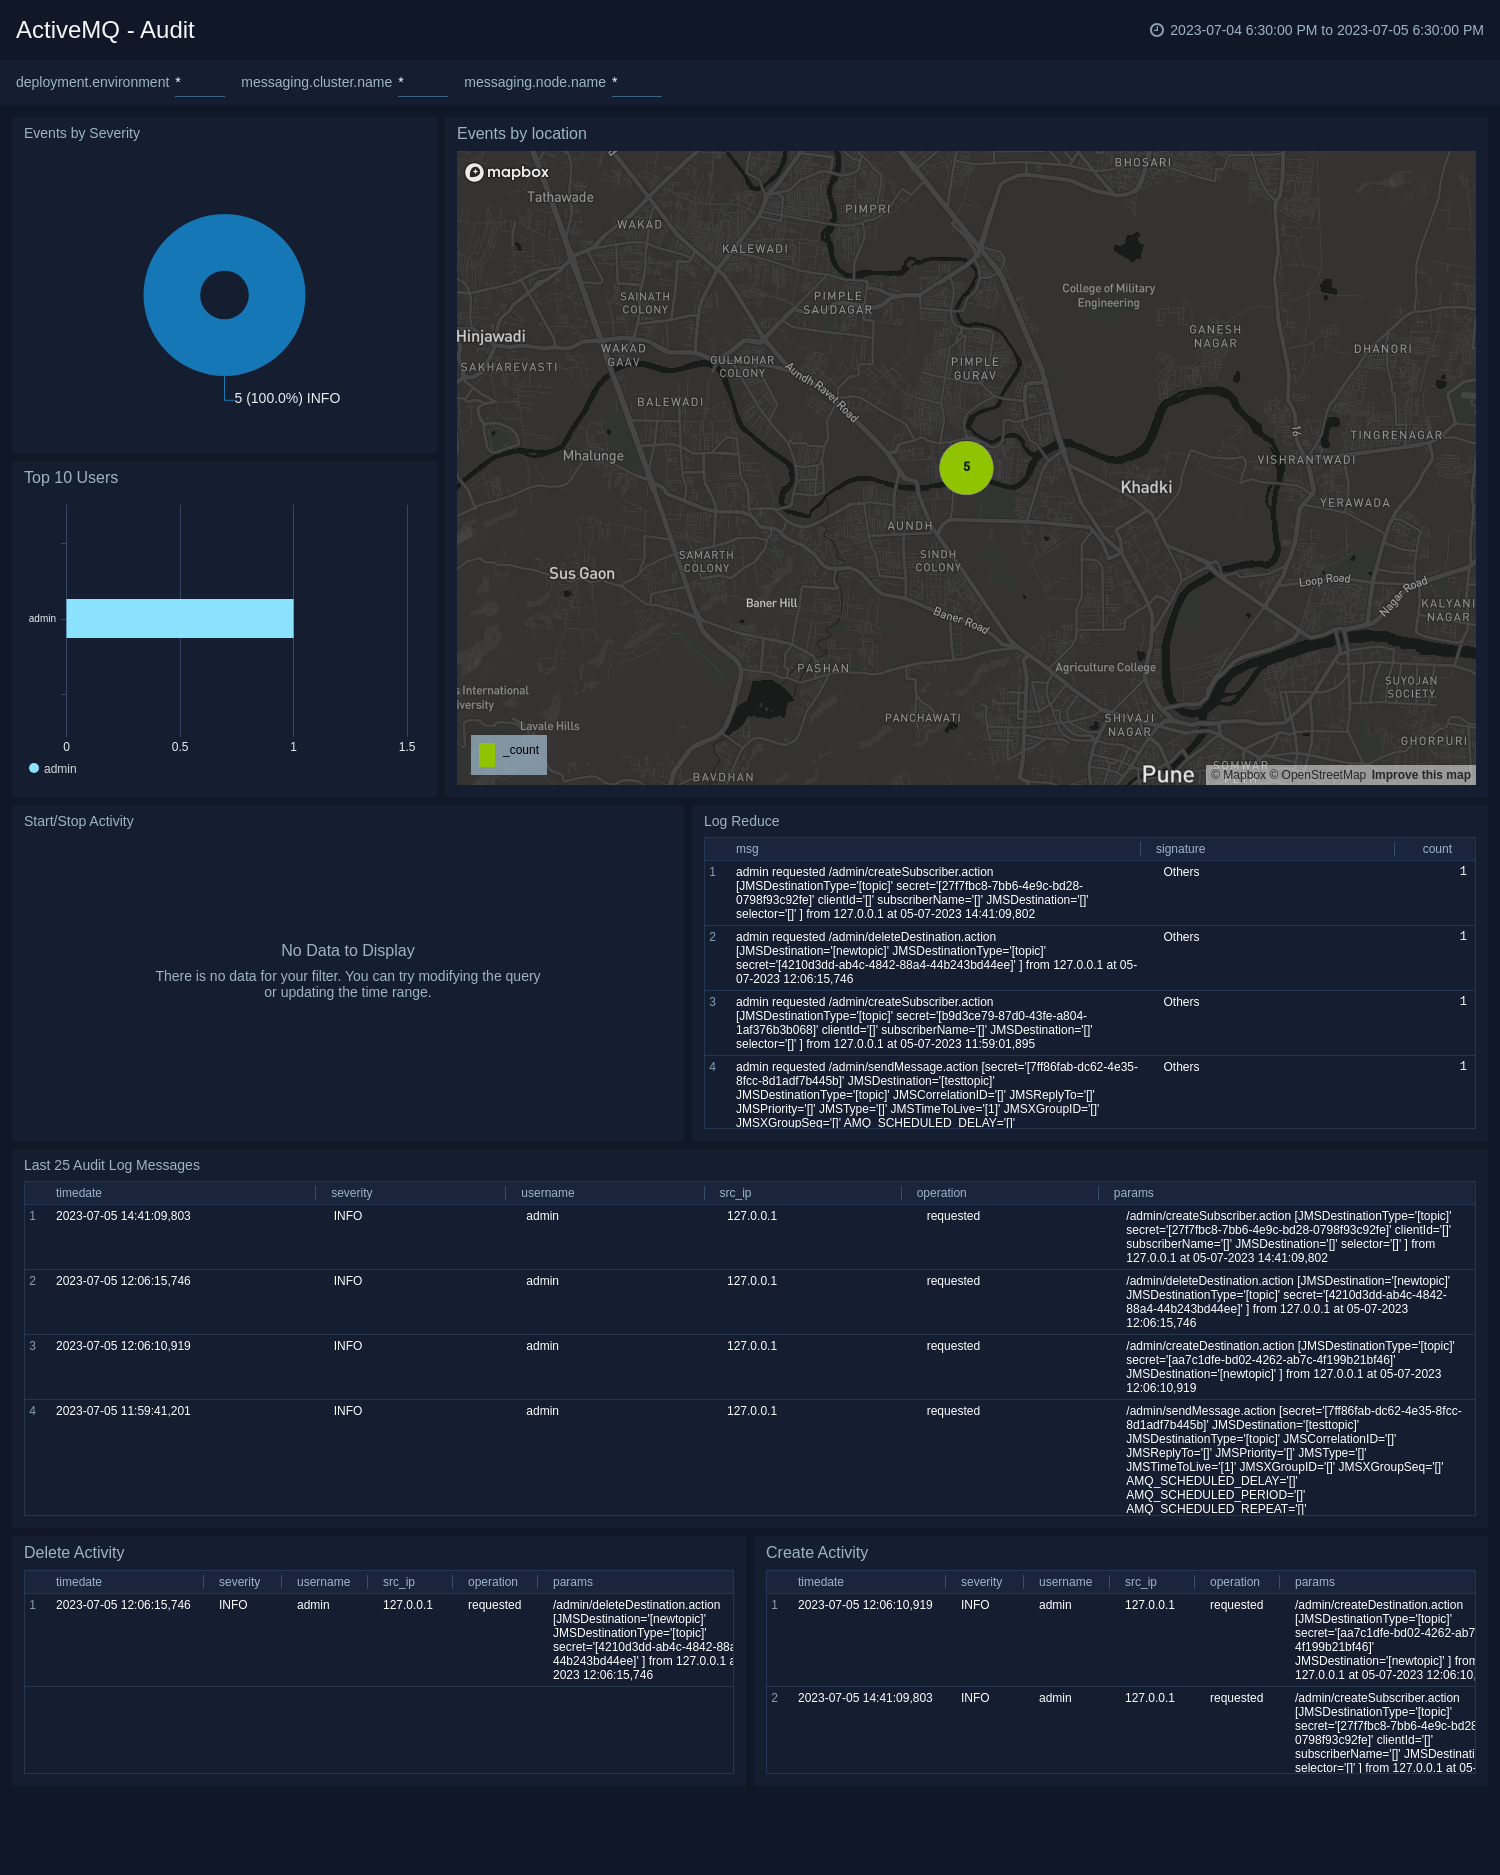
 ### Audit
This **ActiveMQ - Audit** dashboard helps you quickly analyze your ActiveMQ audit logs across all clusters.
Use this dashboard to:
* Identify locations of users performing management action.
* Track username, operation, and IP address for each management level event.
* Monitor create and delete activity in your cluster.
* Quickly determine patterns across all audit logs in a given ActiveMQ cluster.
### Audit
This **ActiveMQ - Audit** dashboard helps you quickly analyze your ActiveMQ audit logs across all clusters.
Use this dashboard to:
* Identify locations of users performing management action.
* Track username, operation, and IP address for each management level event.
* Monitor create and delete activity in your cluster.
* Quickly determine patterns across all audit logs in a given ActiveMQ cluster.
 ## Create monitors for ActiveMQ app
import CreateMonitors from '../../../reuse/apps/create-monitors.md';
### ActiveMQ alerts
| Alert Name | Alert Description and conditions | Alert Condition | Recover Condition |
|:--|:--|:--|:--|
| `ActiveMQ - High CPU Usage Alert` | This alert gets triggered when CPU usage on a node in a ActiveMQ cluster is high. | Count >= 80 | Count < 80 |
| `ActiveMQ - High Memory Usage Alert` | This alert gets triggered when memory usage on a node in a ActiveMQ cluster is high. | Count >= 80 | Count < 80 |
| `ActiveMQ - High Storage Used Alert` | This alert gets triggered when there is high store usage on a node in a ActiveMQ cluster. | Count >= 80 | Count < 80 |
| `ActiveMQ - Maximum Connection Alert` | This alert gets triggered when one node in ActiveMQ cluster exceeds the maximum allowed client connection limit. | Count >= 1 | Count < 1 |
| `ActiveMQ - No Consumers on Queues Alert` | This alert gets triggered when a ActiveMQ queue has no consumers. | Count < 1 | Count >= 1 |
| `ActiveMQ - Node Down Alert` | This alert gets triggered when a node in the ActiveMQ cluster is down. | Count >= 1 | Count < 1 |
| `ActiveMQ - Too Many Connections Alert` | This alert gets triggered when there are too many connections to a node in a ActiveMQ cluster. | Count >= 1000 | Count < 1000 |
## Create monitors for ActiveMQ app
import CreateMonitors from '../../../reuse/apps/create-monitors.md';
### ActiveMQ alerts
| Alert Name | Alert Description and conditions | Alert Condition | Recover Condition |
|:--|:--|:--|:--|
| `ActiveMQ - High CPU Usage Alert` | This alert gets triggered when CPU usage on a node in a ActiveMQ cluster is high. | Count >= 80 | Count < 80 |
| `ActiveMQ - High Memory Usage Alert` | This alert gets triggered when memory usage on a node in a ActiveMQ cluster is high. | Count >= 80 | Count < 80 |
| `ActiveMQ - High Storage Used Alert` | This alert gets triggered when there is high store usage on a node in a ActiveMQ cluster. | Count >= 80 | Count < 80 |
| `ActiveMQ - Maximum Connection Alert` | This alert gets triggered when one node in ActiveMQ cluster exceeds the maximum allowed client connection limit. | Count >= 1 | Count < 1 |
| `ActiveMQ - No Consumers on Queues Alert` | This alert gets triggered when a ActiveMQ queue has no consumers. | Count < 1 | Count >= 1 |
| `ActiveMQ - Node Down Alert` | This alert gets triggered when a node in the ActiveMQ cluster is down. | Count >= 1 | Count < 1 |
| `ActiveMQ - Too Many Connections Alert` | This alert gets triggered when there are too many connections to a node in a ActiveMQ cluster. | Count >= 1000 | Count < 1000 |