---
id: kafka-opentelemetry
title: Kafka - OpenTelemetry Collector
sidebar_label: Kafka - OTel Collector
description: Learn about the Sumo Logic OpenTelemetry App for Kafka.
slug: /help/docs/integrations/containers-orchestration/opentelemetry/kafka-opentelemetry/
canonical: https://www.sumologic.com/help/docs/integrations/containers-orchestration/opentelemetry/kafka-opentelemetry/
---
import useBaseUrl from '@docusaurus/useBaseUrl';
import Tabs from '@theme/Tabs';
import TabItem from '@theme/TabItem';
})
}) The Sumo Logic app for Kafka is a unified logs and metrics app. The app helps you to monitor the brokers, partition replicas, and consumer groups components of Kafka messaging/streaming clusters. Pre-configured dashboards provide insights into the broker operations, topics, replication, and error logs.
We use the OpenTelemetry collector for Kafka metrics and logs collection.
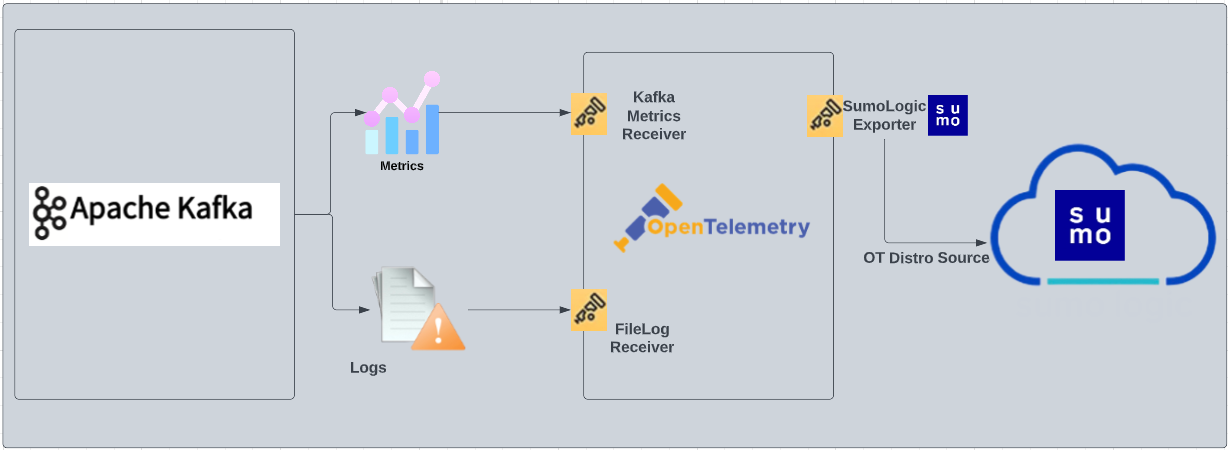
The diagram below illustrates the components of the Kafka collection for each Kafka broker node. OpenTelemetry collector runs on the same host as Kafka, and uses the [Kafka Receiver](https://github.com/open-telemetry/opentelemetry-collector-contrib/tree/main/receiver/kafkametricsreceiver) to obtain Kafka metrics, and the [Sumo Logic OpenTelemetry Exporter](https://github.com/open-telemetry/opentelemetry-collector-contrib/tree/main/exporter/sumologicexporter) to send the metrics to Sumo Logic. Kafka logs are sent to Sumo Logic through a [filelog receiver](https://github.com/open-telemetry/opentelemetry-collector-contrib/tree/main/receiver/filelogreceiver).
The Sumo Logic app for Kafka is a unified logs and metrics app. The app helps you to monitor the brokers, partition replicas, and consumer groups components of Kafka messaging/streaming clusters. Pre-configured dashboards provide insights into the broker operations, topics, replication, and error logs.
We use the OpenTelemetry collector for Kafka metrics and logs collection.
The diagram below illustrates the components of the Kafka collection for each Kafka broker node. OpenTelemetry collector runs on the same host as Kafka, and uses the [Kafka Receiver](https://github.com/open-telemetry/opentelemetry-collector-contrib/tree/main/receiver/kafkametricsreceiver) to obtain Kafka metrics, and the [Sumo Logic OpenTelemetry Exporter](https://github.com/open-telemetry/opentelemetry-collector-contrib/tree/main/exporter/sumologicexporter) to send the metrics to Sumo Logic. Kafka logs are sent to Sumo Logic through a [filelog receiver](https://github.com/open-telemetry/opentelemetry-collector-contrib/tree/main/receiver/filelogreceiver).
 This app has been tested with following Kafka versions:
- `2.6.0`
- `2.7.0`
- `3.1.2`
:::info
This app includes [built-in monitors](#kafka-alerts). For details on creating custom monitors, refer to [Create monitors for Kafka app](#create-monitors-for-kafka-app).
:::
## Log types and Metrics
The Sumo Logic app for Kafka uses:
- Kafka app supports the default logs format.
- For a list of metrics that are collected and used by the app, refer to the [Kafka Metrics](https://github.com/open-telemetry/opentelemetry-collector-contrib/blob/main/receiver/kafkametricsreceiver/documentation.md).
## Fields Creation in Sumo Logic for Kafka
Following are the [Fields](/docs/manage/fields/) which will be created as part of Kafka app installation, if not already present.
* `messaging.cluster.name`. User configured. Enter a name to uniquely identify your Kafka cluster. This cluster name will be shown in the Sumo Logic dashboards.
* `messaging.node.name`. Has value of `host name`.
* `messaging.system`. Has fixed value of `kafka`.
* `sumo.datasource`. Has fixed value of `kafka`.
## Prerequisites
### For metrics collection
Kafka metrics [receiver](https://github.com/open-telemetry/opentelemetry-collector-contrib/tree/main/receiver/kafkametricsreceiver) collects Kafka metrics (brokers, topics, partitions, and consumer groups) from the Kafka server.
### For logs collection
Configure logging in Kafka: By default, Kafka logs (`server.log` and `controller.log`) are stored in the `/opt/Kafka/kafka_/logs` directory. Make a note of this logs directory.
Ensure that the otelcol has adequate permissions to access all log file paths. Execute the following command:
```
sudo setfacl -R -m d:u:otelcol-sumo:r-x,u:otelcol-sumo:r-x,g:otelcol-sumo:r-x
```
import LogsCollectionPrereqisites from '../../../reuse/apps/logs-collection-prereqisites.md';
For Windows systems, log files which are collected should be accessible by the SYSTEM group. Use the following set of PowerShell commands if the SYSTEM group does not have access.
```
$NewAcl = Get-Acl -Path ""
# Set properties
$identity = "NT AUTHORITY\SYSTEM"
$fileSystemRights = "ReadAndExecute"
$type = "Allow"
# Create new rule
$fileSystemAccessRuleArgumentList = $identity, $fileSystemRights, $type
$fileSystemAccessRule = New-Object -TypeName System.Security.AccessControl.FileSystemAccessRule -ArgumentList $fileSystemAccessRuleArgumentList
# Apply new rule
$NewAcl.SetAccessRule($fileSystemAccessRule)
Set-Acl -Path "" -AclObject $NewAcl
```
## Collection configuration and app installation
Follow these steps to set up and deploy the source template to collect data in Sumo Logic from a remotely managed OpenTelemetry collector.
### Step 1: Set up remotely managed OpenTelemetry collector
import OtelCollectorInstallation from '../../../reuse/apps/opentelemetry/otel-collector-installation.md';
:::note
If you want to configure your source locally, you can do so by downloading the YAML file. For details, see [Configure OpenTelemetry collectors locally](/docs/integrations/sumo-apps/opentelemetry-collector-insights/#configure-opentelemetry-collectors-locally).
:::
### Step 2: Configure the source template
import KafkaConfigureSourceTemplate from '../../../reuse/send-data/kafka-configure-source-template.md';
import TimestampParsing from '../../../reuse/apps/opentelemetry/timestamp-parsing.md';
import ProcessingRules from '../../../reuse/opentelemetry/processing-rules.md';
### Step 3: Push the source template to the desired remotely managed collectors
import DataConfiguration from '../../../reuse/apps/opentelemetry/data-configuration.md';
## Sample log messages
```
[2021-03-10 20:12:28,742] INFO [KafkaServer id=0]
started (kafka.server.KafkaServer)
```
## Sample metrics
```
"Query","metric","deployment.environment","host.name","messaging.cluster.name","messaging.node.name","messaging.system","os.type","sumo.datasource","topic","unit","latest"
```
```
"A","kafka.topic.partitions","prod","ip-10-0-18-47","kafkaotdemo","ip-10-0-18-47","kafka","linux","kafka","otlp_spans","{partitions}","1"
```
## Sample queries
### Log query
This is a sample log query from the **Events by Severity** panel in the **Kafka - Logs** dashboard.
```sumo
sumo.datasource=kafka messaging.cluster.name={{messaging.cluster.name}}
| json auto maxdepth 1 nodrop
| if (isEmpty(log), _raw, log) as kafka_log_message
| parse field=kafka_log_message "[*] * *" as date_time,severity,msg
| where severity in ("DEBUG", "INFO", "ERROR", "TRACE", "FATAL")
| count by severity
```
### Metrics query
This is a sample metrics query from the **Partition by Topics** panel in the **Kafka - Metrics** dashboard.
```
sumo.datasource=kafka metric=kafka.topic.partitions messaging.cluster.name={{messaging.cluster.name}} | sum by messaging.cluster.name,topic
```
## Viewing Kafka Dashboards
All dashboards have a set of filters that you can apply to the entire dashboard. Use these filters to drill down and examine the data to a granular level.
- You can change the time range for a dashboard or panel by selecting a predefined interval from a drop-down list, choosing a recently used time range, or specifying custom dates and times. [Learn more](/docs/dashboards/set-custom-time-ranges/).
- You can use template variables to drill down and examine the data on a granular level. For more information, see [Filtering Dashboards with Template Variables](/docs/dashboards/filter-template-variables/).
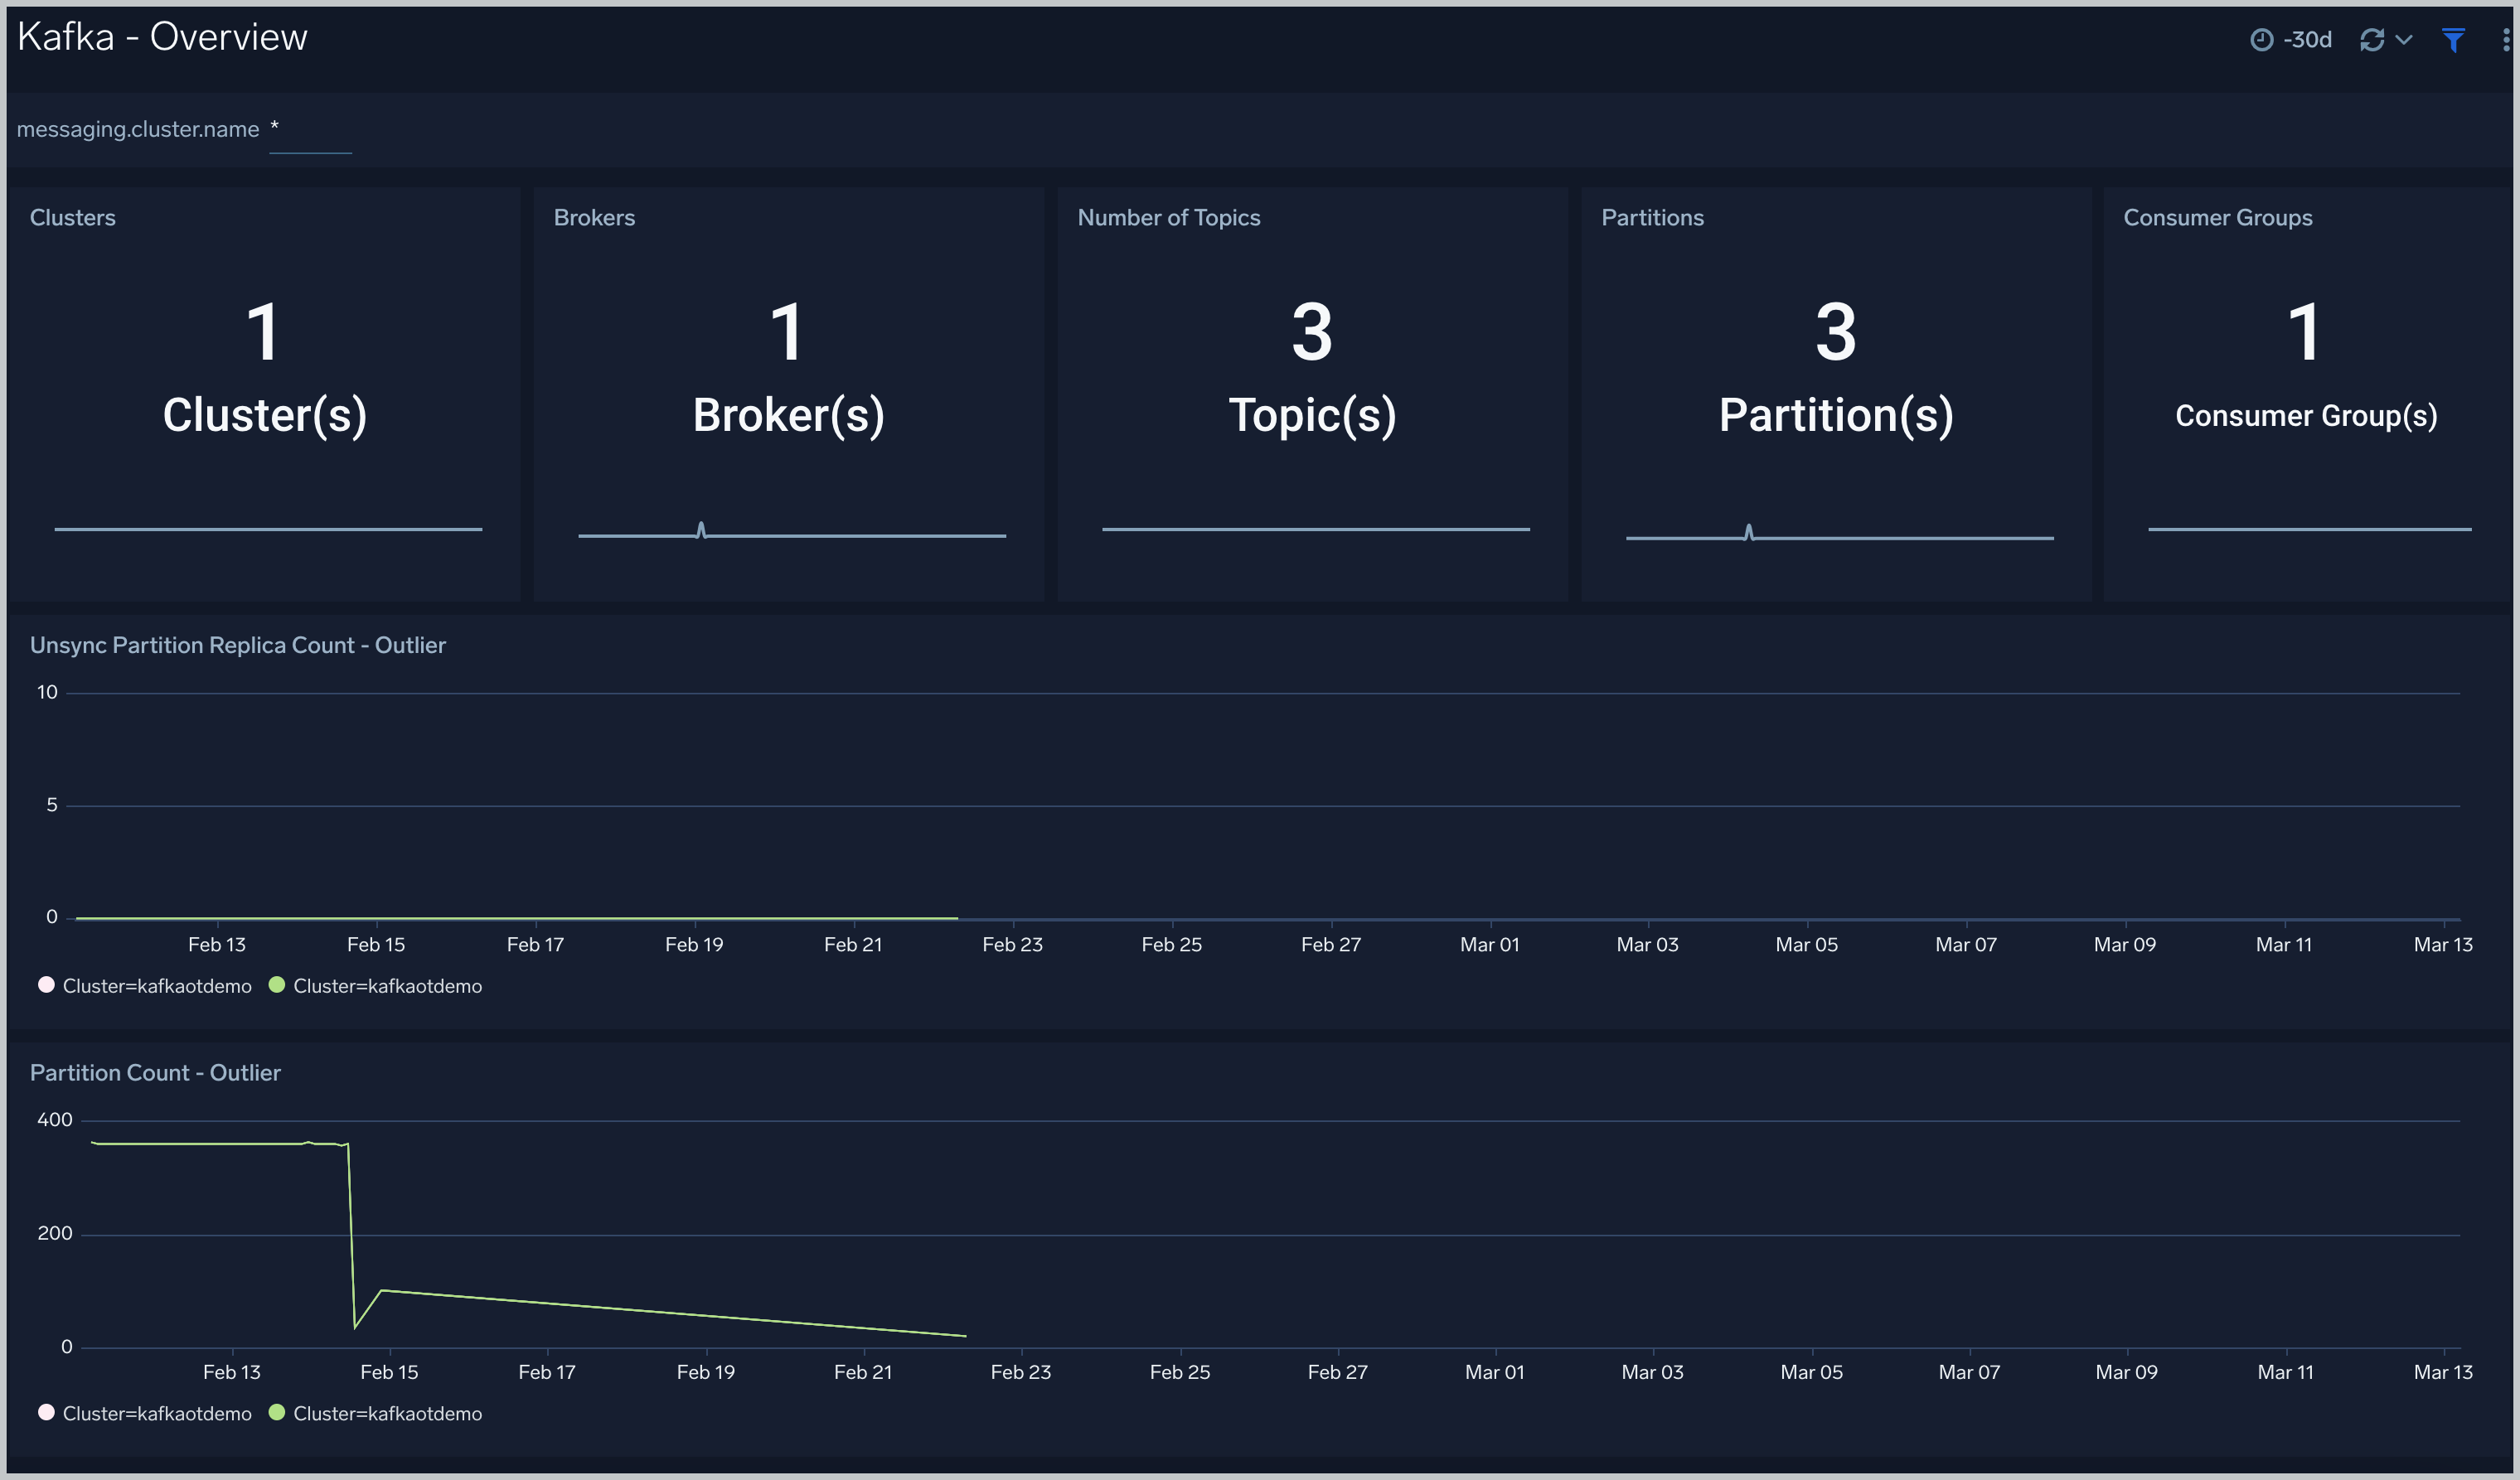
### Overview
The **Kafka - Overview** dashboard gives you an at-a-glance view of your Kafka deployment across brokers, topics, partitions and consumer groups.
Use this dashboard to:
- Analyze trends across Partition Count and Unsync Partition Replica count metrics.
- Determine the number of brokers, partitions and topics across each cluster and ensure they match with expectations
This app has been tested with following Kafka versions:
- `2.6.0`
- `2.7.0`
- `3.1.2`
:::info
This app includes [built-in monitors](#kafka-alerts). For details on creating custom monitors, refer to [Create monitors for Kafka app](#create-monitors-for-kafka-app).
:::
## Log types and Metrics
The Sumo Logic app for Kafka uses:
- Kafka app supports the default logs format.
- For a list of metrics that are collected and used by the app, refer to the [Kafka Metrics](https://github.com/open-telemetry/opentelemetry-collector-contrib/blob/main/receiver/kafkametricsreceiver/documentation.md).
## Fields Creation in Sumo Logic for Kafka
Following are the [Fields](/docs/manage/fields/) which will be created as part of Kafka app installation, if not already present.
* `messaging.cluster.name`. User configured. Enter a name to uniquely identify your Kafka cluster. This cluster name will be shown in the Sumo Logic dashboards.
* `messaging.node.name`. Has value of `host name`.
* `messaging.system`. Has fixed value of `kafka`.
* `sumo.datasource`. Has fixed value of `kafka`.
## Prerequisites
### For metrics collection
Kafka metrics [receiver](https://github.com/open-telemetry/opentelemetry-collector-contrib/tree/main/receiver/kafkametricsreceiver) collects Kafka metrics (brokers, topics, partitions, and consumer groups) from the Kafka server.
### For logs collection
Configure logging in Kafka: By default, Kafka logs (`server.log` and `controller.log`) are stored in the `/opt/Kafka/kafka_/logs` directory. Make a note of this logs directory.
Ensure that the otelcol has adequate permissions to access all log file paths. Execute the following command:
```
sudo setfacl -R -m d:u:otelcol-sumo:r-x,u:otelcol-sumo:r-x,g:otelcol-sumo:r-x
```
import LogsCollectionPrereqisites from '../../../reuse/apps/logs-collection-prereqisites.md';
For Windows systems, log files which are collected should be accessible by the SYSTEM group. Use the following set of PowerShell commands if the SYSTEM group does not have access.
```
$NewAcl = Get-Acl -Path ""
# Set properties
$identity = "NT AUTHORITY\SYSTEM"
$fileSystemRights = "ReadAndExecute"
$type = "Allow"
# Create new rule
$fileSystemAccessRuleArgumentList = $identity, $fileSystemRights, $type
$fileSystemAccessRule = New-Object -TypeName System.Security.AccessControl.FileSystemAccessRule -ArgumentList $fileSystemAccessRuleArgumentList
# Apply new rule
$NewAcl.SetAccessRule($fileSystemAccessRule)
Set-Acl -Path "" -AclObject $NewAcl
```
## Collection configuration and app installation
Follow these steps to set up and deploy the source template to collect data in Sumo Logic from a remotely managed OpenTelemetry collector.
### Step 1: Set up remotely managed OpenTelemetry collector
import OtelCollectorInstallation from '../../../reuse/apps/opentelemetry/otel-collector-installation.md';
:::note
If you want to configure your source locally, you can do so by downloading the YAML file. For details, see [Configure OpenTelemetry collectors locally](/docs/integrations/sumo-apps/opentelemetry-collector-insights/#configure-opentelemetry-collectors-locally).
:::
### Step 2: Configure the source template
import KafkaConfigureSourceTemplate from '../../../reuse/send-data/kafka-configure-source-template.md';
import TimestampParsing from '../../../reuse/apps/opentelemetry/timestamp-parsing.md';
import ProcessingRules from '../../../reuse/opentelemetry/processing-rules.md';
### Step 3: Push the source template to the desired remotely managed collectors
import DataConfiguration from '../../../reuse/apps/opentelemetry/data-configuration.md';
## Sample log messages
```
[2021-03-10 20:12:28,742] INFO [KafkaServer id=0]
started (kafka.server.KafkaServer)
```
## Sample metrics
```
"Query","metric","deployment.environment","host.name","messaging.cluster.name","messaging.node.name","messaging.system","os.type","sumo.datasource","topic","unit","latest"
```
```
"A","kafka.topic.partitions","prod","ip-10-0-18-47","kafkaotdemo","ip-10-0-18-47","kafka","linux","kafka","otlp_spans","{partitions}","1"
```
## Sample queries
### Log query
This is a sample log query from the **Events by Severity** panel in the **Kafka - Logs** dashboard.
```sumo
sumo.datasource=kafka messaging.cluster.name={{messaging.cluster.name}}
| json auto maxdepth 1 nodrop
| if (isEmpty(log), _raw, log) as kafka_log_message
| parse field=kafka_log_message "[*] * *" as date_time,severity,msg
| where severity in ("DEBUG", "INFO", "ERROR", "TRACE", "FATAL")
| count by severity
```
### Metrics query
This is a sample metrics query from the **Partition by Topics** panel in the **Kafka - Metrics** dashboard.
```
sumo.datasource=kafka metric=kafka.topic.partitions messaging.cluster.name={{messaging.cluster.name}} | sum by messaging.cluster.name,topic
```
## Viewing Kafka Dashboards
All dashboards have a set of filters that you can apply to the entire dashboard. Use these filters to drill down and examine the data to a granular level.
- You can change the time range for a dashboard or panel by selecting a predefined interval from a drop-down list, choosing a recently used time range, or specifying custom dates and times. [Learn more](/docs/dashboards/set-custom-time-ranges/).
- You can use template variables to drill down and examine the data on a granular level. For more information, see [Filtering Dashboards with Template Variables](/docs/dashboards/filter-template-variables/).
### Overview
The **Kafka - Overview** dashboard gives you an at-a-glance view of your Kafka deployment across brokers, topics, partitions and consumer groups.
Use this dashboard to:
- Analyze trends across Partition Count and Unsync Partition Replica count metrics.
- Determine the number of brokers, partitions and topics across each cluster and ensure they match with expectations
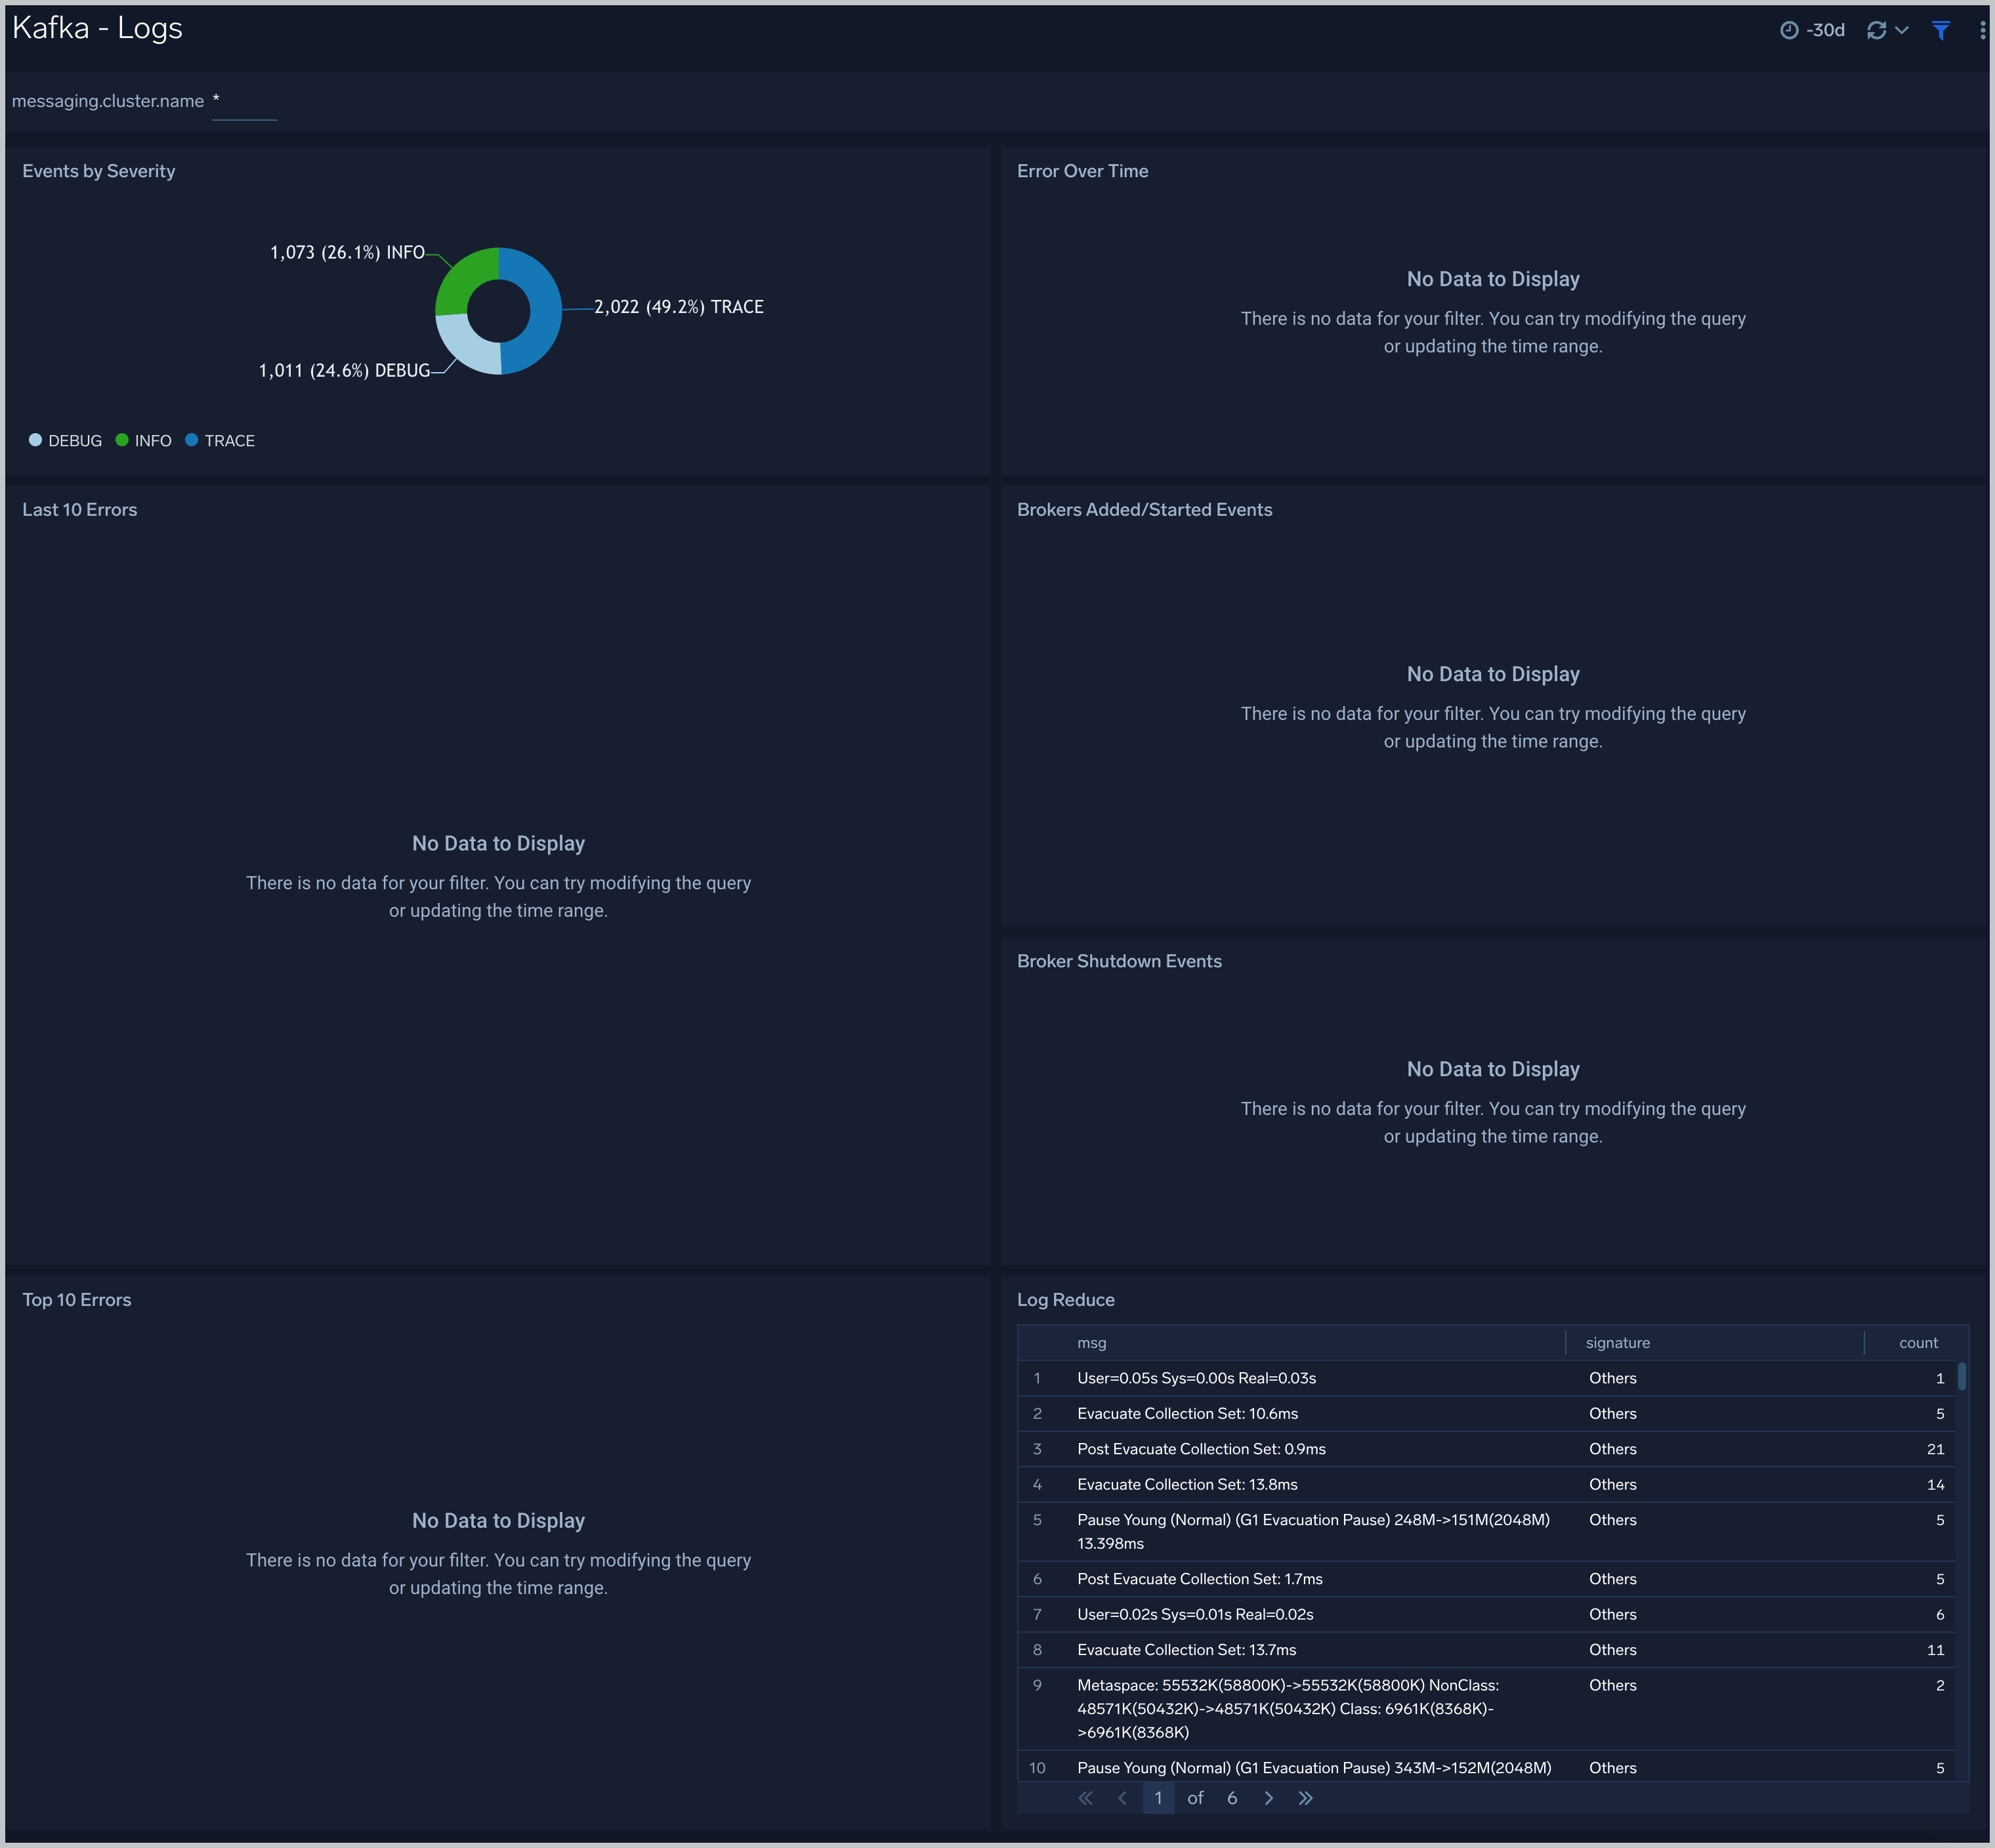
 ### Logs
The **Kafka - Logs** dashboard helps you quickly analyze your Kafka error logs across all clusters.
Use this dashboard to:
- Identify critical events in your Kafka broker and controller logs.
- Examine trends to detect spikes in Error or Fatal events.
- Monitor Broker added/started and shutdown events in your cluster.
- Quickly determine patterns across all logs in a given Kafka cluster.
### Logs
The **Kafka - Logs** dashboard helps you quickly analyze your Kafka error logs across all clusters.
Use this dashboard to:
- Identify critical events in your Kafka broker and controller logs.
- Examine trends to detect spikes in Error or Fatal events.
- Monitor Broker added/started and shutdown events in your cluster.
- Quickly determine patterns across all logs in a given Kafka cluster.
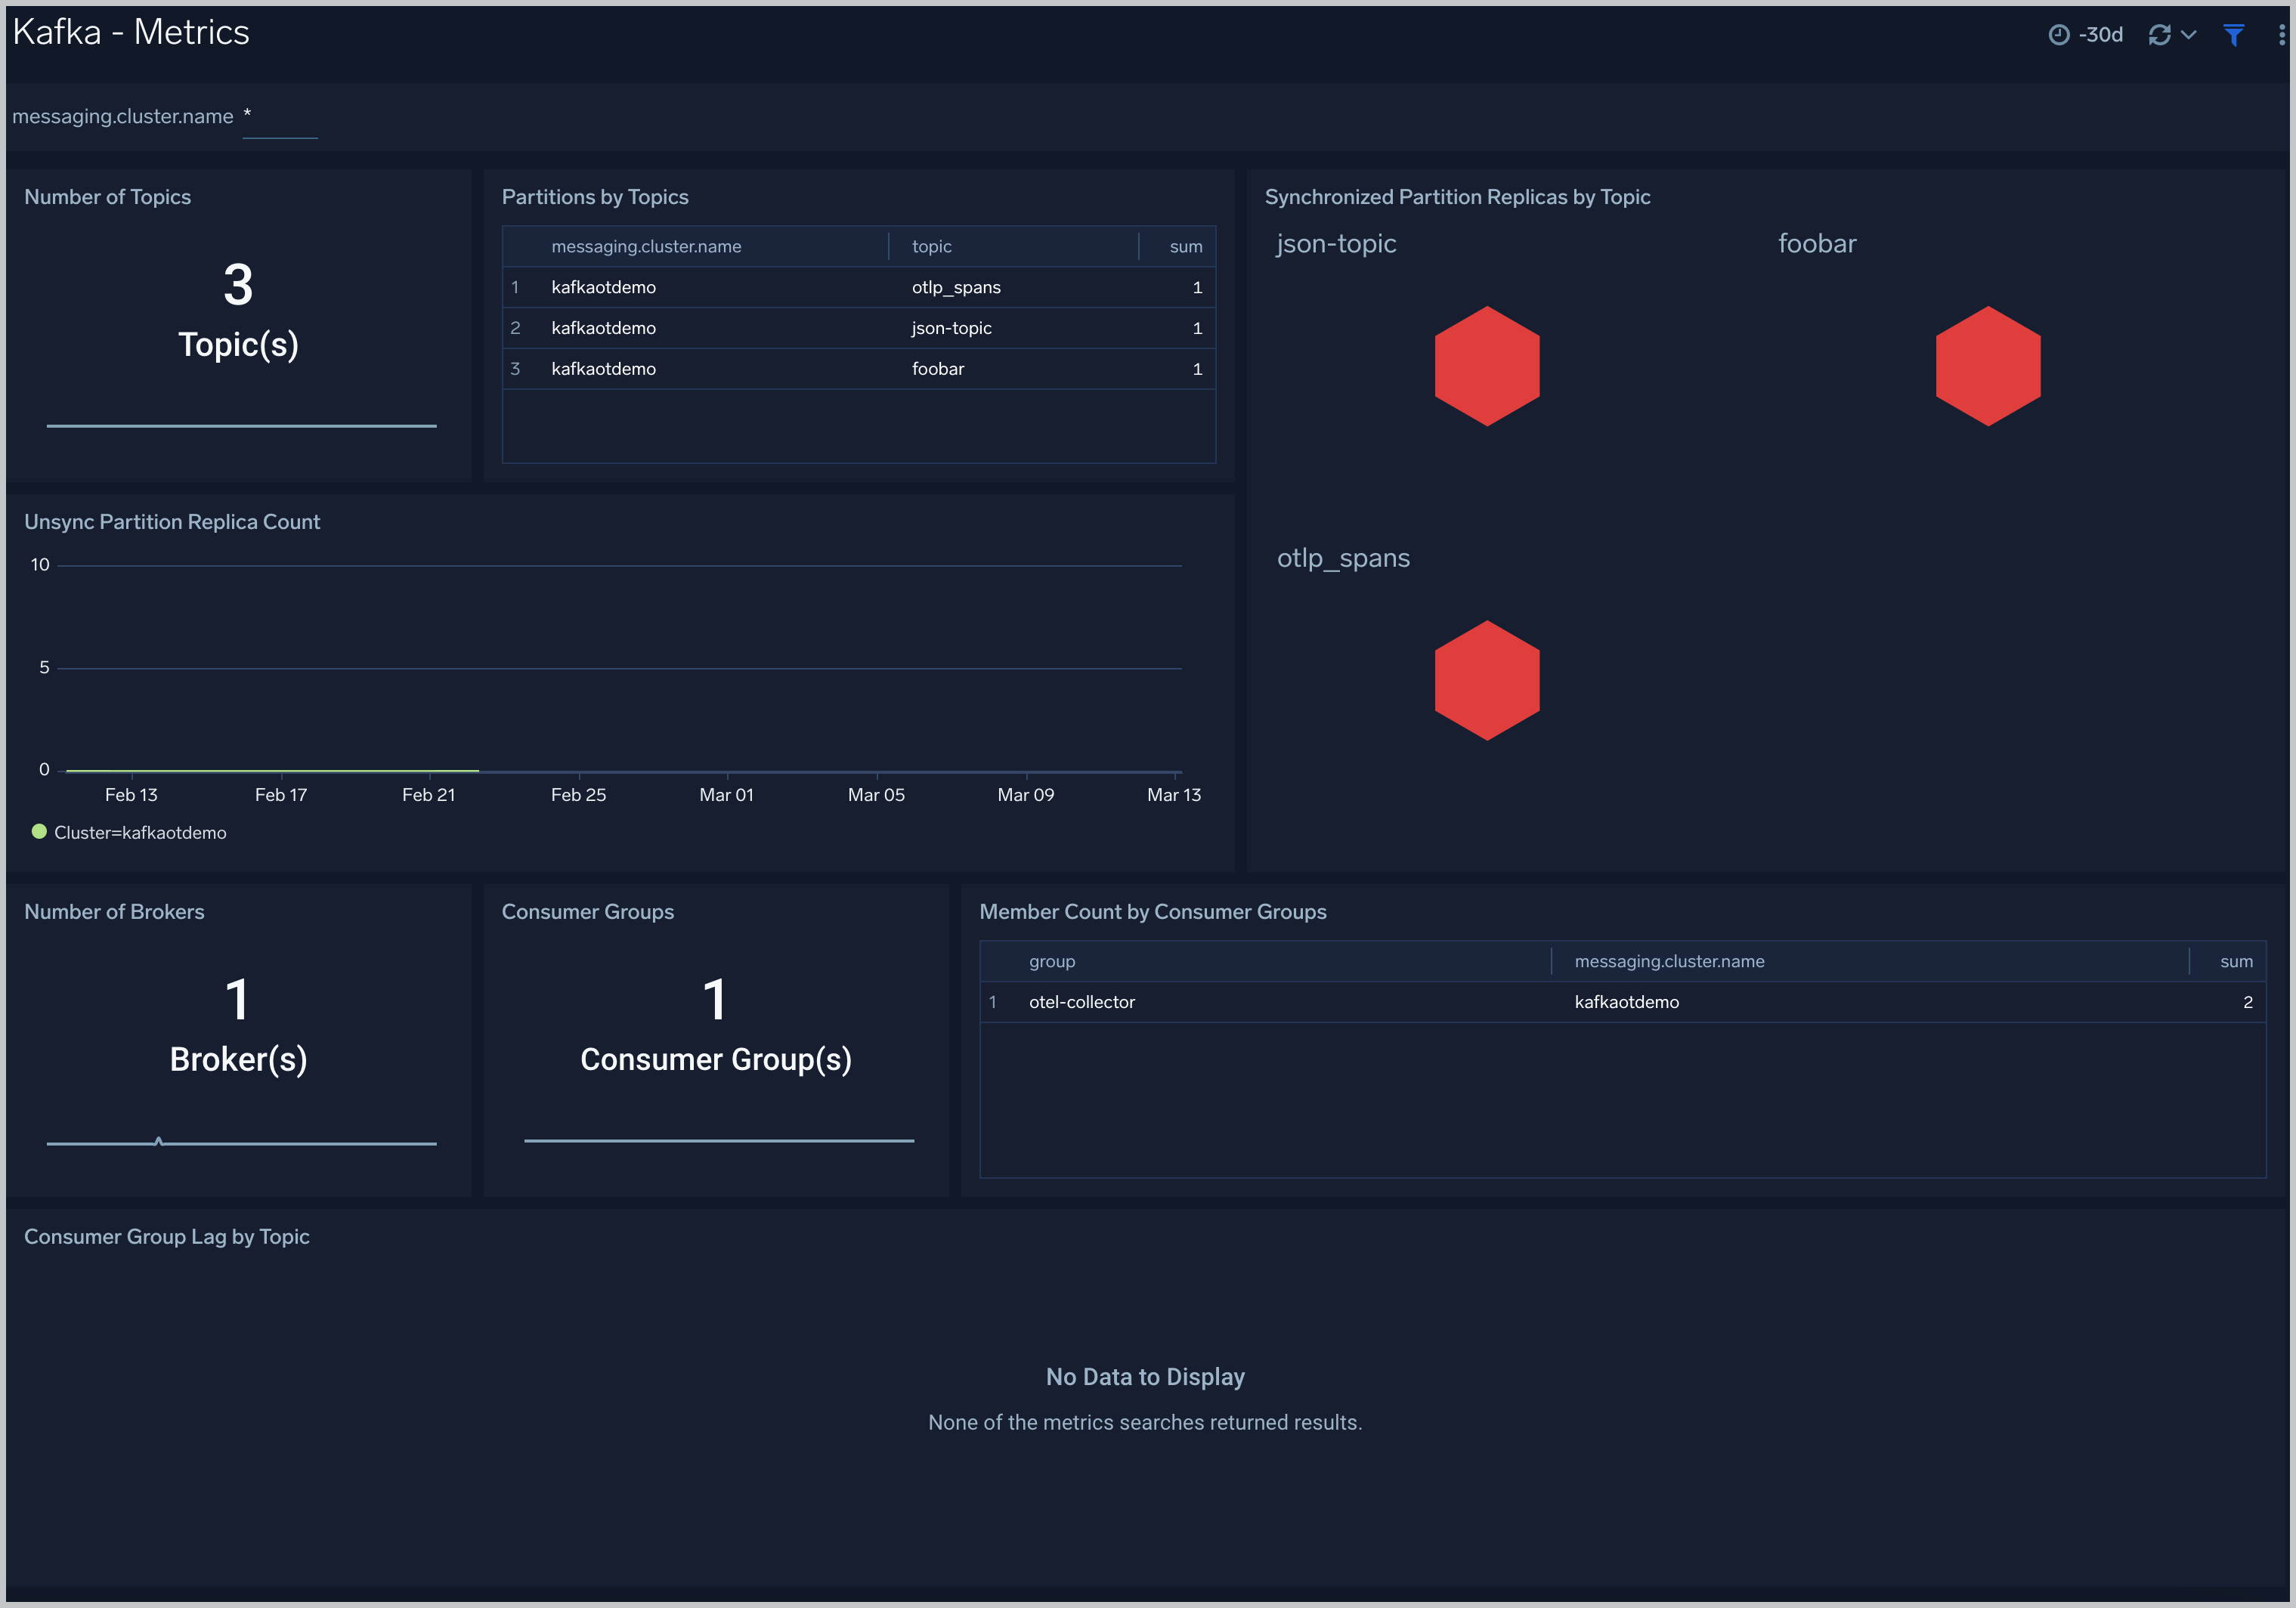
 ### Metrics
The **Kafka - Metrics** dashboard helps you to monitor unsynchronized partition replicas and consumer groups.
Use this dashboard to:
- Monitor consumer Group Lag by Topic.
- Identify unsynchronized partition replicas.
### Metrics
The **Kafka - Metrics** dashboard helps you to monitor unsynchronized partition replicas and consumer groups.
Use this dashboard to:
- Monitor consumer Group Lag by Topic.
- Identify unsynchronized partition replicas.
 ## Create monitors for Kafka app
import CreateMonitors from '../../../reuse/apps/create-monitors.md';
### Kafka alerts
| Alert Name | Alert Description and conditions | Alert Condition | Recover Condition |
|:--|:--|:--|:--|
| `Kafka - Fatal Event on Broker Alert` | This alert gets triggered when we detect a fatal operation on a Kafka broker node | Count >= 1 | Count < 1 |
| `Kafka - Large number of broker errors Alert` | This alert gets triggered when we detect that there are 5 or more errors on a Broker node within a time interval of 5 minutes. | Count >= 5 | Count < 5 |
## Create monitors for Kafka app
import CreateMonitors from '../../../reuse/apps/create-monitors.md';
### Kafka alerts
| Alert Name | Alert Description and conditions | Alert Condition | Recover Condition |
|:--|:--|:--|:--|
| `Kafka - Fatal Event on Broker Alert` | This alert gets triggered when we detect a fatal operation on a Kafka broker node | Count >= 1 | Count < 1 |
| `Kafka - Large number of broker errors Alert` | This alert gets triggered when we detect that there are 5 or more errors on a Broker node within a time interval of 5 minutes. | Count >= 5 | Count < 5 |