---
id: rabbitmq-opentelemetry
title: RabbitMQ - OpenTelemetry Collector
sidebar_label: RabbitMQ - OTel Collector
description: Learn about the Sumo Logic OpenTelemetry app for RabbitMQ.
slug: /help/docs/integrations/containers-orchestration/opentelemetry/rabbitmq-opentelemetry/
canonical: https://www.sumologic.com/help/docs/integrations/containers-orchestration/opentelemetry/rabbitmq-opentelemetry/
---
import useBaseUrl from '@docusaurus/useBaseUrl';
import Tabs from '@theme/Tabs';
import TabItem from '@theme/TabItem';
})
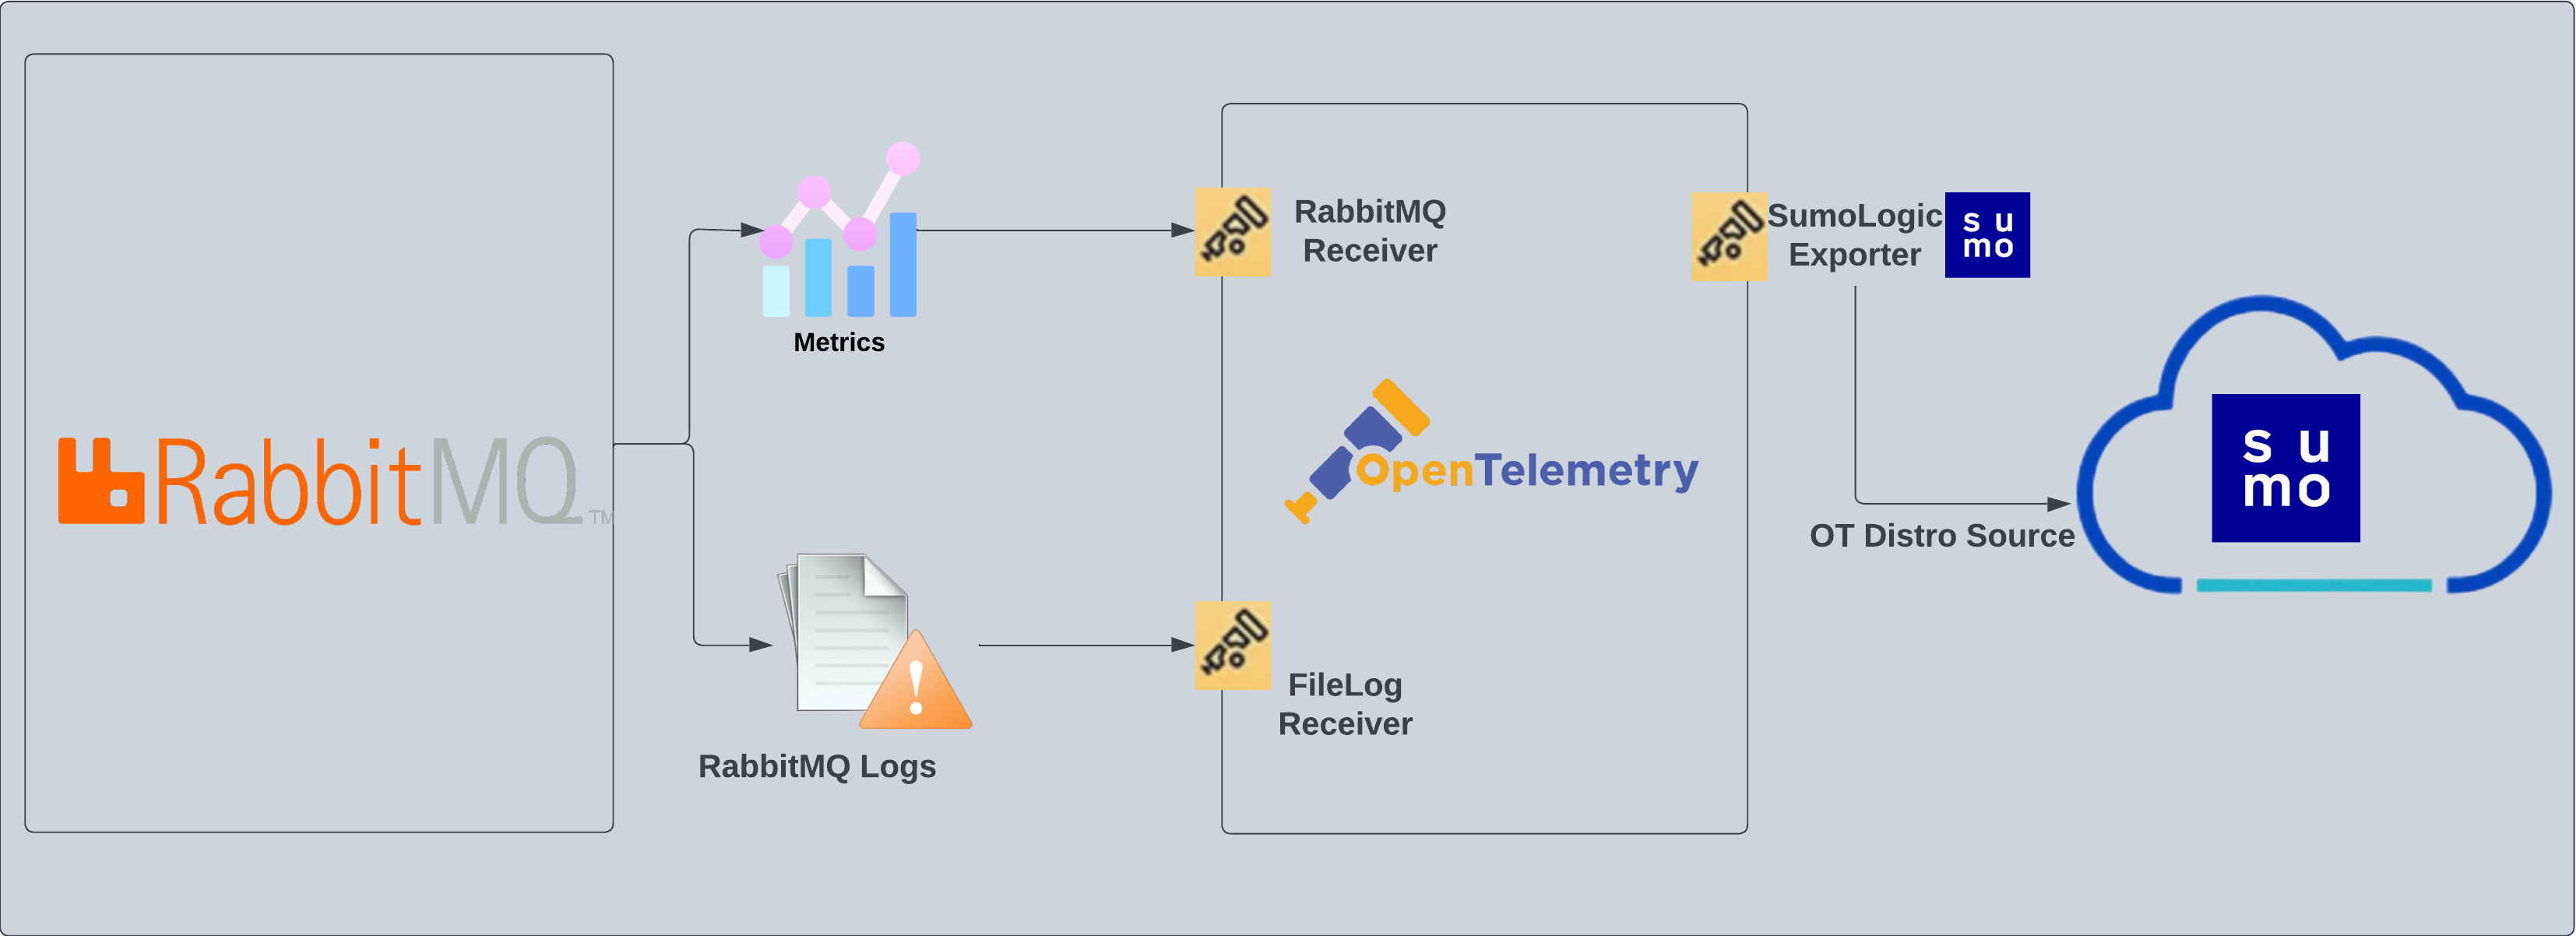
}) RabbitMQ logs are sent to Sumo Logic through the OpenTelemetry [filelog receiver](https://github.com/open-telemetry/opentelemetry-collector-contrib/tree/main/receiver/filelogreceiver). RabbitMQ metrics are sent through the [RabbitMQ](https://github.com/open-telemetry/opentelemetry-collector-contrib/tree/main/receiver/rabbitmqreceiver) metrics receiver.
RabbitMQ logs are sent to Sumo Logic through the OpenTelemetry [filelog receiver](https://github.com/open-telemetry/opentelemetry-collector-contrib/tree/main/receiver/filelogreceiver). RabbitMQ metrics are sent through the [RabbitMQ](https://github.com/open-telemetry/opentelemetry-collector-contrib/tree/main/receiver/rabbitmqreceiver) metrics receiver.
 :::info
This app includes [built-in monitors](#rabbitmq-alerts). For details on creating custom monitors, refer to the [Create monitors for RabbitMQ app](#create-monitors-for-rabbitmq-app).
:::
## Fields creation in Sumo Logic for RabbitMQ
Following are the [Fields](/docs/manage/fields/) which will be created as part of RabbitMQ App install if not already present.
* **`sumo.datasource`**. Fixed value of **rabbitmq**.
* **`messaging.system`**. Fixed value of **rabbitmq**.
* **`deployment.environment`**. This is a user-configured field set at the time of collector installation. It identifies the environment where the rabbitmq env resides, such as `dev`, `prod`, or `qa`.
* **`messaging.cluster.name`**. User configured. Enter a name to uniquely identify your RabbitMQ cluster. This cluster name will be shown in the Sumo Logic dashboards.
* **`messaging.node.name`**. Includes the value of the hostname of the machine which is being monitored.
## Prerequisites
### For metrics collection
:::note
The RabbitMQ receiver supports RabbitMQ versions `3.8` and `3.9`.
:::
Enable the RabbitMQ management plugin by following the instructions in the [RabbitMQ documentation](https://www.rabbitmq.com/management.html#getting-started). Also, make sure you at least have the [monitoring](https://www.rabbitmq.com/management.html#permissions) level permissions to monitor the metrics.
### For logs collection
This section provides instructions for configuring log collection for RabbitMQ running on a non-Kubernetes environment for the Sumo Logic App for RabbitMQ. By default, RabbitMQ logs are stored in a log file.
Follow the instructions to set up log collection:
1. RabbitMQ logs have six levels of verbosity: debug, info, warning, error, critical, and none. For more information, refer to the [RabbitMQ documentation](https://www.rabbitmq.com/logging.html#log-levels). To make sure the dashboard work properly, the log level needs to be set to **debug**. Default log level is **info**. All logging settings are located in [RabbitMQ.conf](https://www.rabbitmq.com/logging.html).
2. Configure RabbitMQ to write log lines to a local file. By default, RabbitMQ logs are stored in `/var/log/rabbitmq/rabbit@.log`. The default directory for log files is listed in the `RabbitMQ.conf` file. To configure the log output destination to a log file, use one of the following settings, either in the [configuration file](https://www.rabbitmq.com/logging.html). Edit or create `/etc/rabbitmq/rabbitmq.conf` file config:
```
log.dir = /var/log/rabbitmq
log.file = rabbitmq.log
log.file.level = debug
```
Once the logs are configured to be written to a local file, follow the below steps to configure collection in Sumo Logic.
import LogsCollectionPrereqisites from '../../../reuse/apps/logs-collection-prereqisites.md';
For Windows systems, log files which are collected should be accessible by the SYSTEM group. Use the following set of PowerShell commands if the SYSTEM group does not have access.
```
$NewAcl = Get-Acl -Path ""
# Set properties
$identity = "NT AUTHORITY\SYSTEM"
$fileSystemRights = "ReadAndExecute"
$type = "Allow"
# Create new rule
$fileSystemAccessRuleArgumentList = $identity, $fileSystemRights, $type
$fileSystemAccessRule = New-Object -TypeName System.Security.AccessControl.FileSystemAccessRule -ArgumentList $fileSystemAccessRuleArgumentList
# Apply new rule
$NewAcl.SetAccessRule($fileSystemAccessRule)
Set-Acl -Path "" -AclObject $NewAcl
```
## Collection configuration and app installation
Follow these steps to set up and deploy the source template to collect data in Sumo Logic from a remotely managed OpenTelemetry collector.
### Step 1: Set up remotely managed OpenTelemetry collector
import OtelCollectorInstallation from '../../../reuse/apps/opentelemetry/otel-collector-installation.md';
:::note
If you want to configure your source locally, you can do so by downloading the YAML file. For details, see [Configure OpenTelemetry collectors locally](/docs/integrations/sumo-apps/opentelemetry-collector-insights/#configure-opentelemetry-collectors-locally).
:::
### Step 2: Configure the source template
import RabbitmqConfigureSourceTemplate from '../../../reuse/send-data/rabbitmq-configure-source-template.md';
import TimestampParsing from '../../../reuse/apps/opentelemetry/timestamp-parsing.md';
import ProcessingRules from '../../../reuse/opentelemetry/processing-rules.md';
### Step 3: Push the source template to the desired remotely managed collectors
import DataConfiguration from '../../../reuse/apps/opentelemetry/data-configuration.md';
## Sample log messages
Here's a sample log message you'd find in Non-Kubernetes environments.
```
2023-01-16 05:53:44.858 [info] <0.44.0> Application cowboy exited with reason: stopped
```
## Sample queries
### Logs
This sample Query is from the **RabbitMQ - Logs dashboard** > **Events** by Severity panel.
```sumo title="Query String"
%"sumo.datasource"="rabbitmq" %"messaging.cluster.name"=* host.name=*
| json "log" as _rawlog nodrop
| if(isEmpty(_rawlog),_raw,_rawlog) as _raw
| parse "* * [*]" as date,time,severity | count by severity
```
### Metrics
This sample query is from the **Average Number of Consumers** panel in **RabbitMQ - Metrics** dashboard.
```sql
sumo.datasource=rabbitmq metric=rabbitmq.consumer.count deployment.environment=* messaging.cluster.name=* messaging.node.name=* rabbitmq.queue.name=* rabbitmq.vhost.name=*
| avg by messaging.cluster.name
| sum
```
## Viewing RabbitMQ Dashboards
### Logs
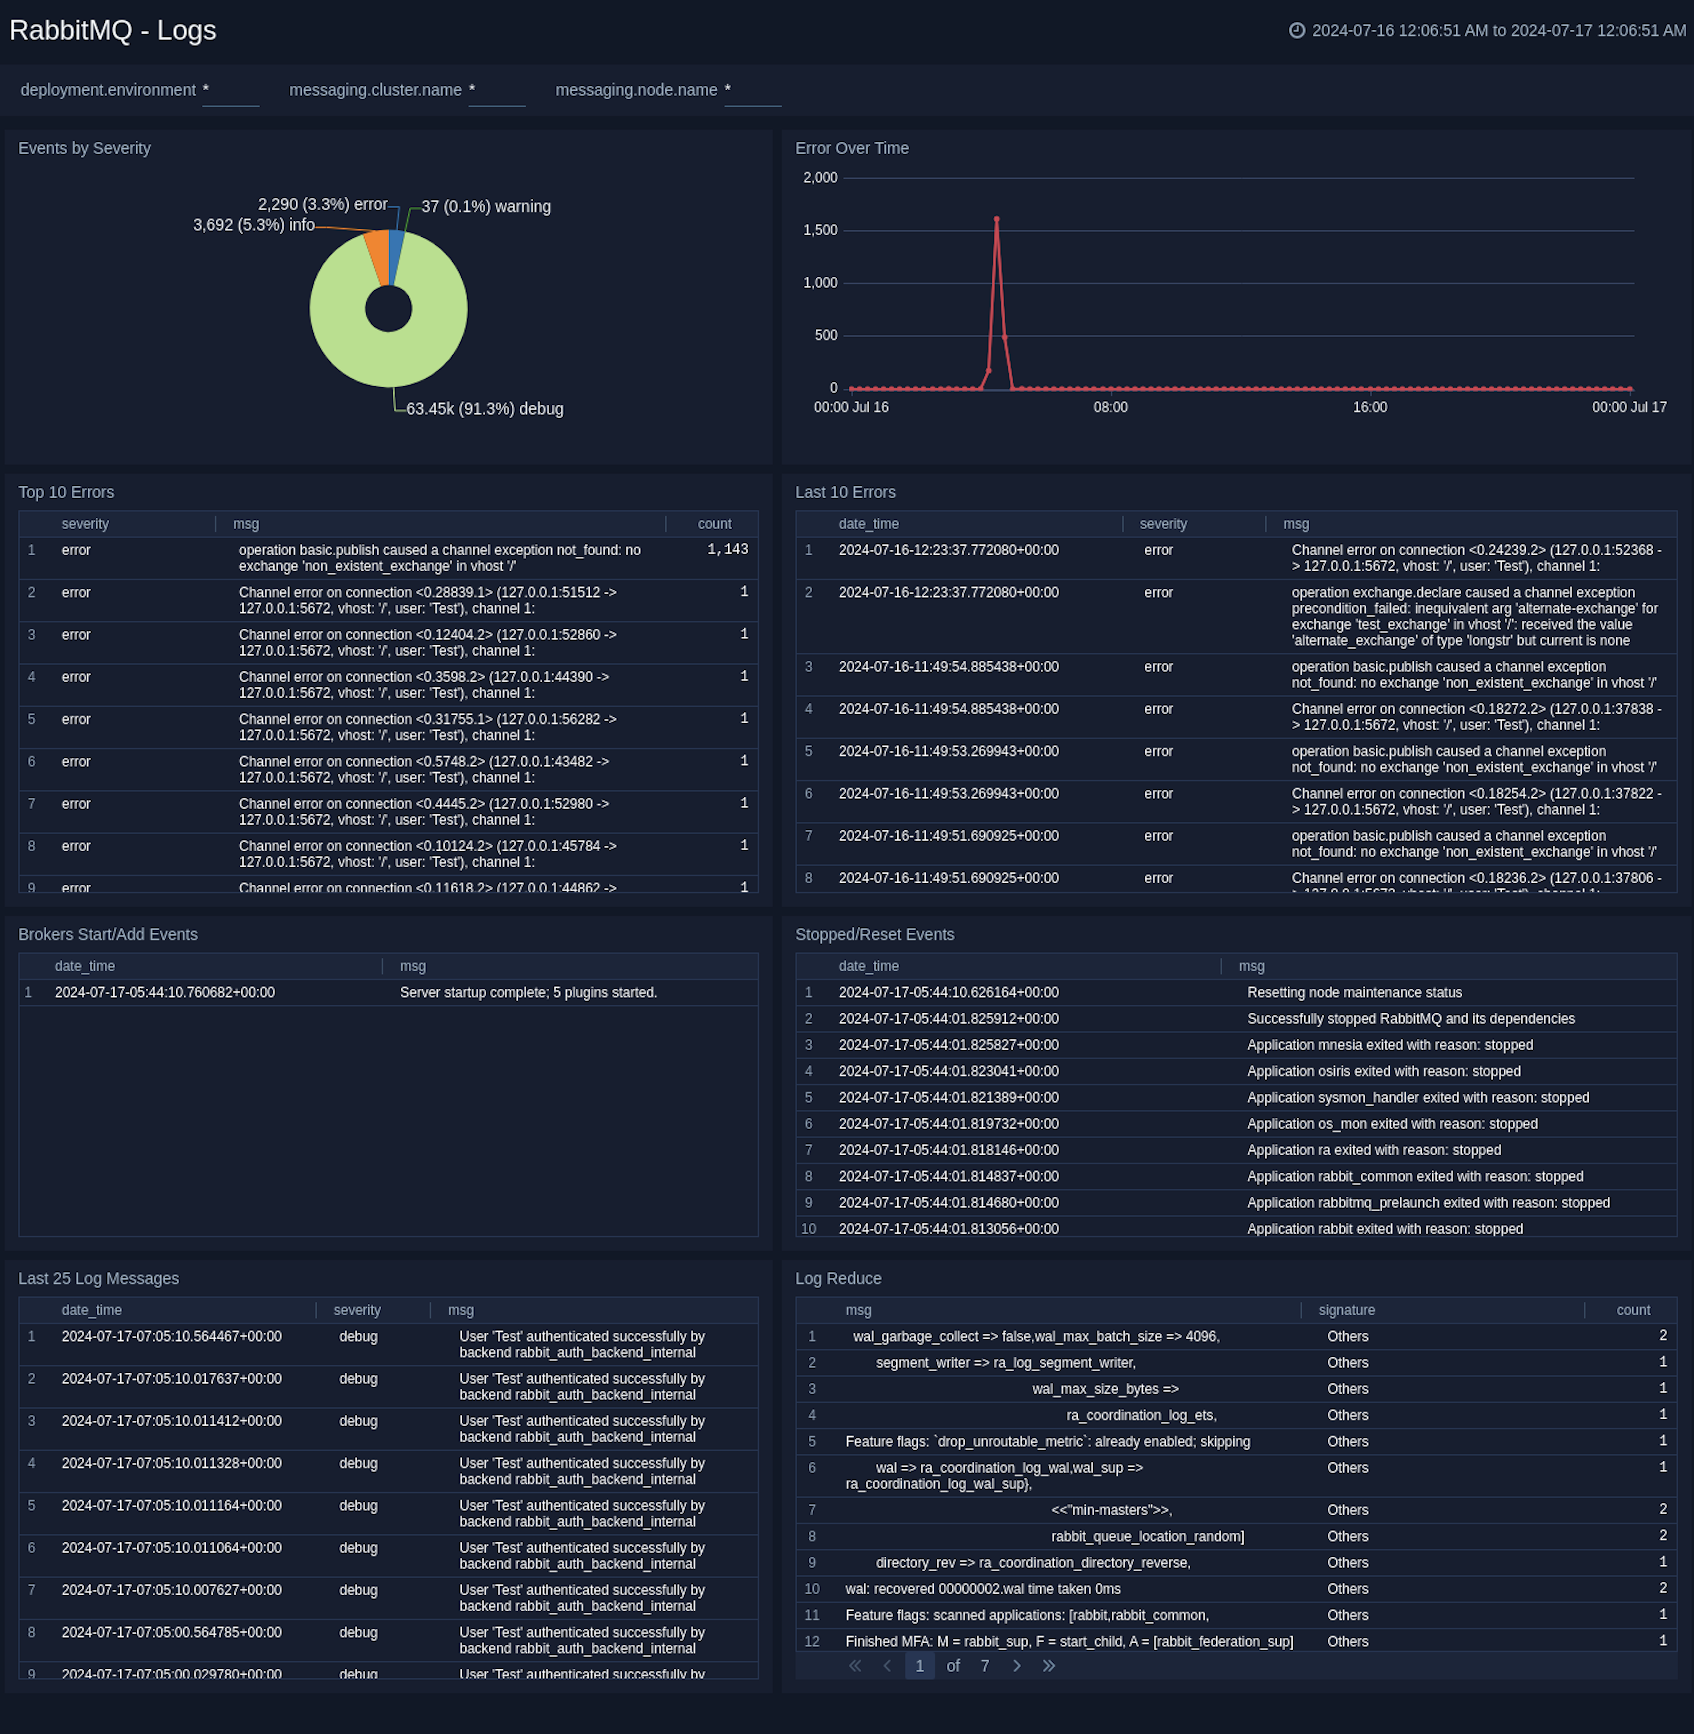
The **RabbitMQ - Logs** dashboard gives you an at-a-glance view of error messages, error by severity, top and last 10 errors, broker, and Event Start/Add log messages.
:::info
This app includes [built-in monitors](#rabbitmq-alerts). For details on creating custom monitors, refer to the [Create monitors for RabbitMQ app](#create-monitors-for-rabbitmq-app).
:::
## Fields creation in Sumo Logic for RabbitMQ
Following are the [Fields](/docs/manage/fields/) which will be created as part of RabbitMQ App install if not already present.
* **`sumo.datasource`**. Fixed value of **rabbitmq**.
* **`messaging.system`**. Fixed value of **rabbitmq**.
* **`deployment.environment`**. This is a user-configured field set at the time of collector installation. It identifies the environment where the rabbitmq env resides, such as `dev`, `prod`, or `qa`.
* **`messaging.cluster.name`**. User configured. Enter a name to uniquely identify your RabbitMQ cluster. This cluster name will be shown in the Sumo Logic dashboards.
* **`messaging.node.name`**. Includes the value of the hostname of the machine which is being monitored.
## Prerequisites
### For metrics collection
:::note
The RabbitMQ receiver supports RabbitMQ versions `3.8` and `3.9`.
:::
Enable the RabbitMQ management plugin by following the instructions in the [RabbitMQ documentation](https://www.rabbitmq.com/management.html#getting-started). Also, make sure you at least have the [monitoring](https://www.rabbitmq.com/management.html#permissions) level permissions to monitor the metrics.
### For logs collection
This section provides instructions for configuring log collection for RabbitMQ running on a non-Kubernetes environment for the Sumo Logic App for RabbitMQ. By default, RabbitMQ logs are stored in a log file.
Follow the instructions to set up log collection:
1. RabbitMQ logs have six levels of verbosity: debug, info, warning, error, critical, and none. For more information, refer to the [RabbitMQ documentation](https://www.rabbitmq.com/logging.html#log-levels). To make sure the dashboard work properly, the log level needs to be set to **debug**. Default log level is **info**. All logging settings are located in [RabbitMQ.conf](https://www.rabbitmq.com/logging.html).
2. Configure RabbitMQ to write log lines to a local file. By default, RabbitMQ logs are stored in `/var/log/rabbitmq/rabbit@.log`. The default directory for log files is listed in the `RabbitMQ.conf` file. To configure the log output destination to a log file, use one of the following settings, either in the [configuration file](https://www.rabbitmq.com/logging.html). Edit or create `/etc/rabbitmq/rabbitmq.conf` file config:
```
log.dir = /var/log/rabbitmq
log.file = rabbitmq.log
log.file.level = debug
```
Once the logs are configured to be written to a local file, follow the below steps to configure collection in Sumo Logic.
import LogsCollectionPrereqisites from '../../../reuse/apps/logs-collection-prereqisites.md';
For Windows systems, log files which are collected should be accessible by the SYSTEM group. Use the following set of PowerShell commands if the SYSTEM group does not have access.
```
$NewAcl = Get-Acl -Path ""
# Set properties
$identity = "NT AUTHORITY\SYSTEM"
$fileSystemRights = "ReadAndExecute"
$type = "Allow"
# Create new rule
$fileSystemAccessRuleArgumentList = $identity, $fileSystemRights, $type
$fileSystemAccessRule = New-Object -TypeName System.Security.AccessControl.FileSystemAccessRule -ArgumentList $fileSystemAccessRuleArgumentList
# Apply new rule
$NewAcl.SetAccessRule($fileSystemAccessRule)
Set-Acl -Path "" -AclObject $NewAcl
```
## Collection configuration and app installation
Follow these steps to set up and deploy the source template to collect data in Sumo Logic from a remotely managed OpenTelemetry collector.
### Step 1: Set up remotely managed OpenTelemetry collector
import OtelCollectorInstallation from '../../../reuse/apps/opentelemetry/otel-collector-installation.md';
:::note
If you want to configure your source locally, you can do so by downloading the YAML file. For details, see [Configure OpenTelemetry collectors locally](/docs/integrations/sumo-apps/opentelemetry-collector-insights/#configure-opentelemetry-collectors-locally).
:::
### Step 2: Configure the source template
import RabbitmqConfigureSourceTemplate from '../../../reuse/send-data/rabbitmq-configure-source-template.md';
import TimestampParsing from '../../../reuse/apps/opentelemetry/timestamp-parsing.md';
import ProcessingRules from '../../../reuse/opentelemetry/processing-rules.md';
### Step 3: Push the source template to the desired remotely managed collectors
import DataConfiguration from '../../../reuse/apps/opentelemetry/data-configuration.md';
## Sample log messages
Here's a sample log message you'd find in Non-Kubernetes environments.
```
2023-01-16 05:53:44.858 [info] <0.44.0> Application cowboy exited with reason: stopped
```
## Sample queries
### Logs
This sample Query is from the **RabbitMQ - Logs dashboard** > **Events** by Severity panel.
```sumo title="Query String"
%"sumo.datasource"="rabbitmq" %"messaging.cluster.name"=* host.name=*
| json "log" as _rawlog nodrop
| if(isEmpty(_rawlog),_raw,_rawlog) as _raw
| parse "* * [*]" as date,time,severity | count by severity
```
### Metrics
This sample query is from the **Average Number of Consumers** panel in **RabbitMQ - Metrics** dashboard.
```sql
sumo.datasource=rabbitmq metric=rabbitmq.consumer.count deployment.environment=* messaging.cluster.name=* messaging.node.name=* rabbitmq.queue.name=* rabbitmq.vhost.name=*
| avg by messaging.cluster.name
| sum
```
## Viewing RabbitMQ Dashboards
### Logs
The **RabbitMQ - Logs** dashboard gives you an at-a-glance view of error messages, error by severity, top and last 10 errors, broker, and Event Start/Add log messages.
 ### Metrics
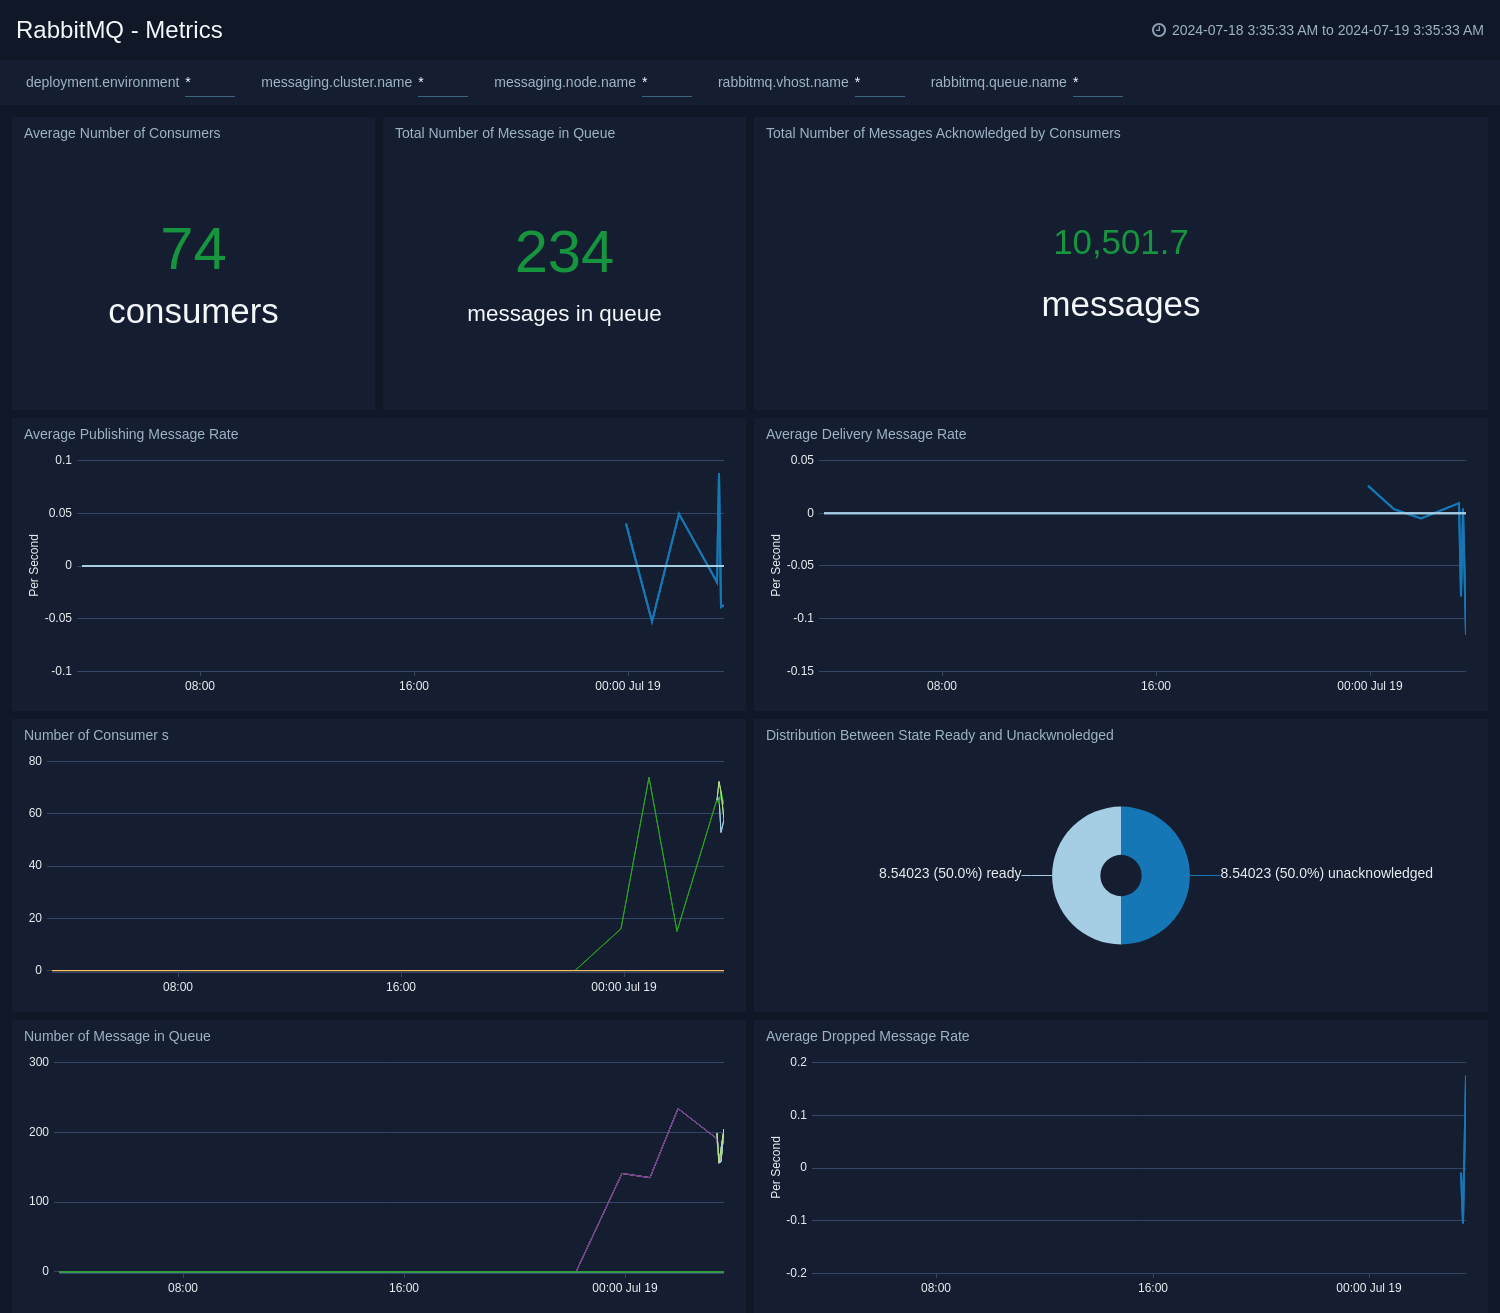
The **RabbitMQ - Metrics** dashboard gives you an at-a-glance view of your RabbitMQ deployment across brokers, queue, exchange, consumer, and messages.
### Metrics
The **RabbitMQ - Metrics** dashboard gives you an at-a-glance view of your RabbitMQ deployment across brokers, queue, exchange, consumer, and messages.
 ## Create monitors for RabbitMQ app
import CreateMonitors from '../../../reuse/apps/create-monitors.md';
### RabbitMQ alerts
| Name | Description | Alert Condition | Recover Condition |
|:--|:--|:--|:--|
| `RabbitMQ - High Consumer Count` | This alert is triggered when consumers are higher than given value (Default 10000) in a queue. | Count `>=` 10000 | Count `<` 10000 |
| `RabbitMQ - High Message Queue Size` | This alert is triggered when the number of messages in a queue exceeds a given threshold (Default 10000), indicating potential consumer issues or message processing bottlenecks. | Count `>=` 10000 | Count `<` 10000 |
| `RabbitMQ - High Messages Count` | This alert is triggered when messages are higher than given value (Default 10000) in a queue. | Count `>=` 10000 | Count `<` 10000 |
| `RabbitMQ - High Unacknowledged Messages` | This alert is triggered when there are too many unacknowledged messages (Default 5000), suggesting consumer processing issues. | Count `>=` 5000 | Count `<` 5000 |
| `RabbitMQ - Node Down` | This alert is triggered when a node in the RabbitMQ cluster is down. | Count `>=` 1 | Count `<` 1 |
| `RabbitMQ - Zero Consumers Alert` | This alert is triggered when a queue has no consumers, indicating potential service issues. | Count `<=` 0 | Count `>` 0 |
## Create monitors for RabbitMQ app
import CreateMonitors from '../../../reuse/apps/create-monitors.md';
### RabbitMQ alerts
| Name | Description | Alert Condition | Recover Condition |
|:--|:--|:--|:--|
| `RabbitMQ - High Consumer Count` | This alert is triggered when consumers are higher than given value (Default 10000) in a queue. | Count `>=` 10000 | Count `<` 10000 |
| `RabbitMQ - High Message Queue Size` | This alert is triggered when the number of messages in a queue exceeds a given threshold (Default 10000), indicating potential consumer issues or message processing bottlenecks. | Count `>=` 10000 | Count `<` 10000 |
| `RabbitMQ - High Messages Count` | This alert is triggered when messages are higher than given value (Default 10000) in a queue. | Count `>=` 10000 | Count `<` 10000 |
| `RabbitMQ - High Unacknowledged Messages` | This alert is triggered when there are too many unacknowledged messages (Default 5000), suggesting consumer processing issues. | Count `>=` 5000 | Count `<` 5000 |
| `RabbitMQ - Node Down` | This alert is triggered when a node in the RabbitMQ cluster is down. | Count `>=` 1 | Count `<` 1 |
| `RabbitMQ - Zero Consumers Alert` | This alert is triggered when a queue has no consumers, indicating potential service issues. | Count `<=` 0 | Count `>` 0 |