---
id: vmware-opentelemetry
title: VMWare - OpenTelemetry Collector
sidebar_label: VMWare - OTel Collector
description: Monitor VMware vCenter, ESXi hosts, clusters, and VMs using the Sumo Logic OpenTelemetry app with predefined dashboards for CPU, memory, and disk metrics.
slug: /help/docs/integrations/containers-orchestration/opentelemetry/vmware-opentelemetry/
canonical: https://www.sumologic.com/help/docs/integrations/containers-orchestration/opentelemetry/vmware-opentelemetry/
---
import useBaseUrl from '@docusaurus/useBaseUrl';
import Tabs from '@theme/Tabs';
import TabItem from '@theme/TabItem';
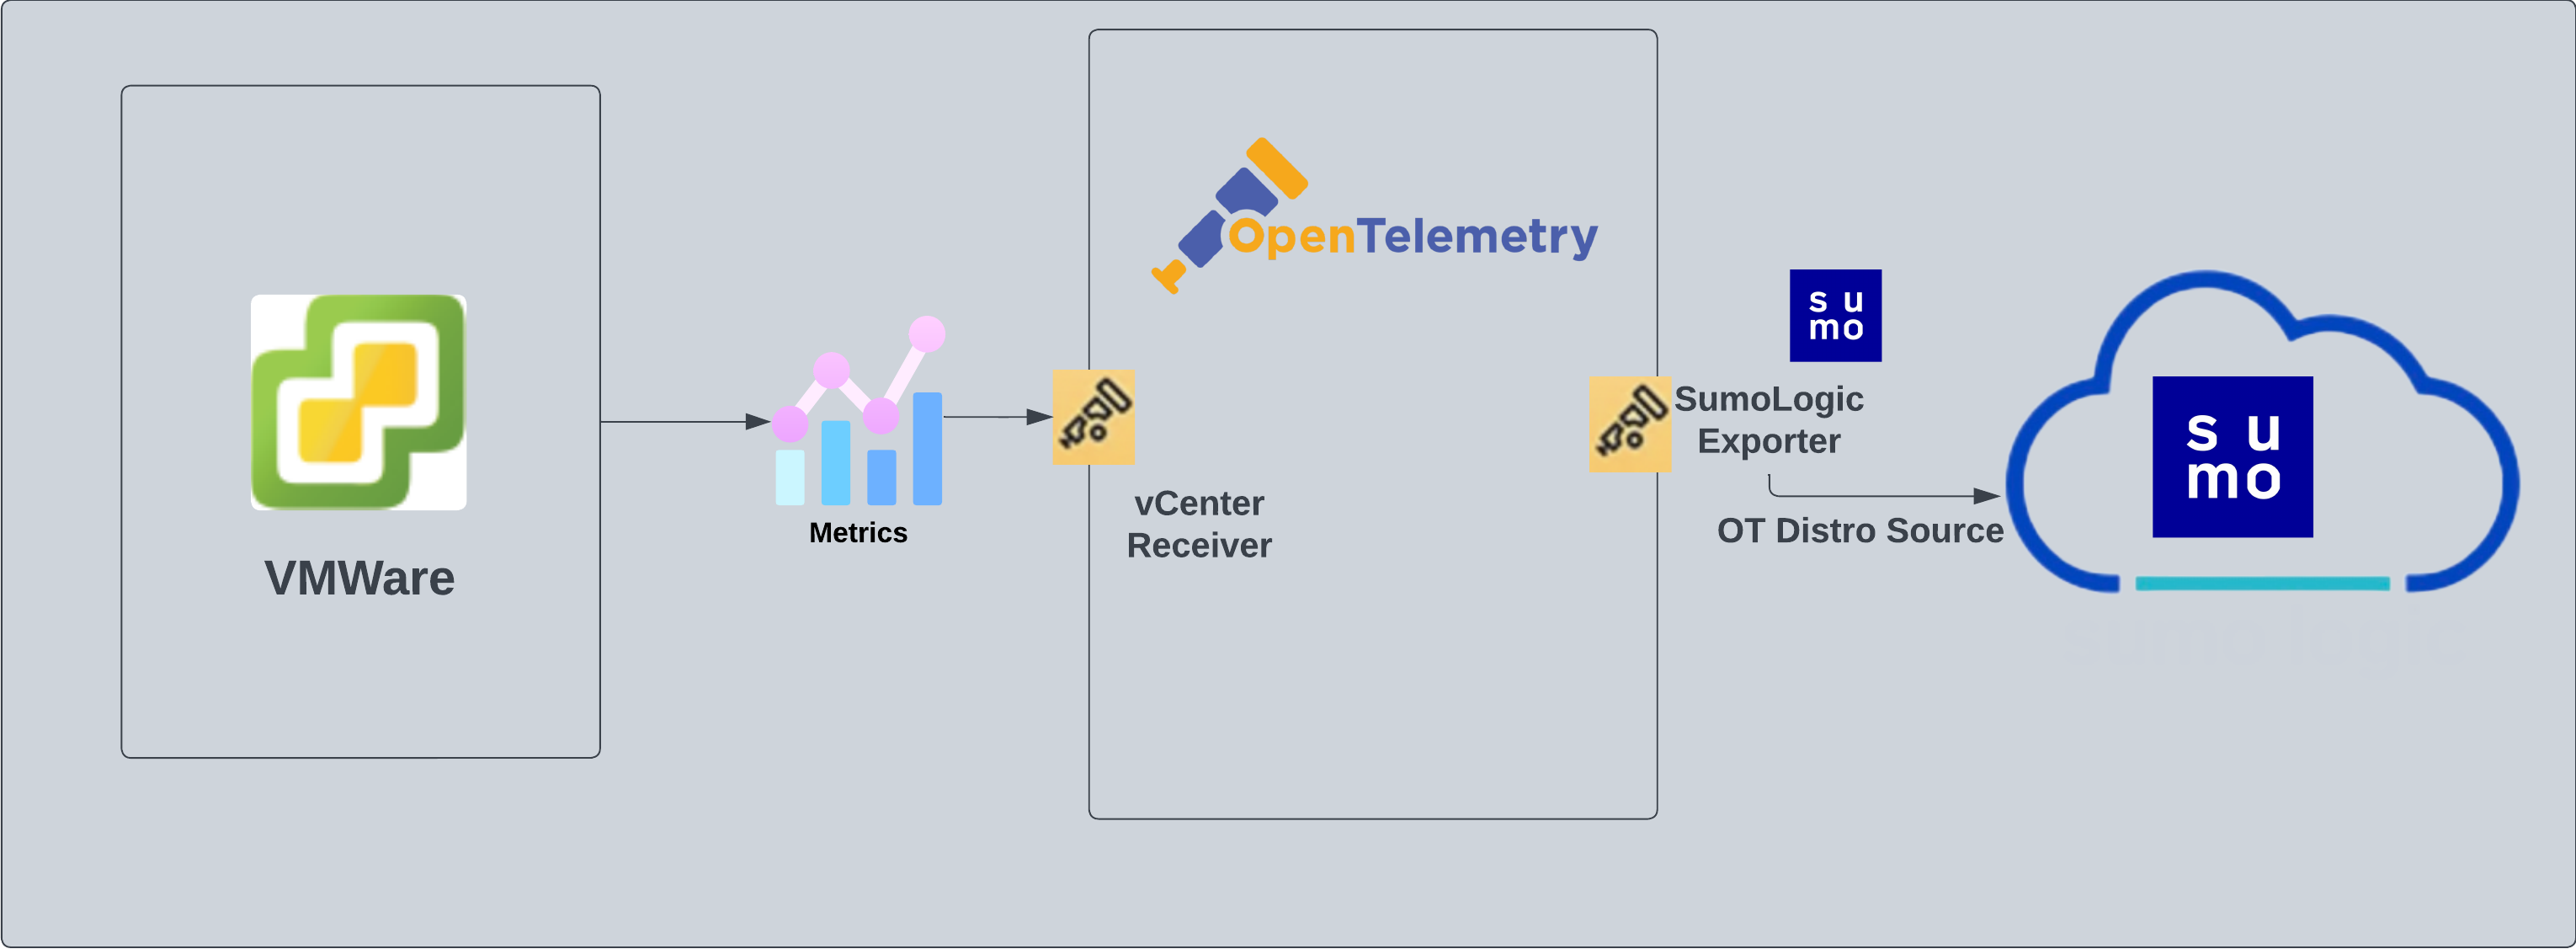
}) The VMware - OpenTelemetry app uses metrics from the VMware cloud computing virtualization platform to enable monitoring of vCenter, datacenter, resource pool, cluster, ESXi hosts, and individual virtual machine metrics with real-time data displayed in predefined dashboards.
The dashboards provide insight into key metrics such as CPU, memory, disk utilization at different infrastructure levels like VM, host, datacenter, resource pool, and clusters. This enables you to determine capacity constraints and troubleshoot operational issues related to over-provisioning, changes to configuration, and VM movement.
VMWare metrics are collected through the [vCenter Receiver](https://github.com/open-telemetry/opentelemetry-collector-contrib/tree/main/receiver/vcenterreceiver) of OpenTelemetry.
See the [vSphere product page](https://www.vmware.com/products/vsphere.html) for more information on VMware hybrid cloud.
The VMware - OpenTelemetry app uses metrics from the VMware cloud computing virtualization platform to enable monitoring of vCenter, datacenter, resource pool, cluster, ESXi hosts, and individual virtual machine metrics with real-time data displayed in predefined dashboards.
The dashboards provide insight into key metrics such as CPU, memory, disk utilization at different infrastructure levels like VM, host, datacenter, resource pool, and clusters. This enables you to determine capacity constraints and troubleshoot operational issues related to over-provisioning, changes to configuration, and VM movement.
VMWare metrics are collected through the [vCenter Receiver](https://github.com/open-telemetry/opentelemetry-collector-contrib/tree/main/receiver/vcenterreceiver) of OpenTelemetry.
See the [vSphere product page](https://www.vmware.com/products/vsphere.html) for more information on VMware hybrid cloud.
 :::info
This app includes [built-in monitors](#vmware-alerts). For details on creating custom monitors, refer to the [Create monitors for JFrog Artifactory app](#create-monitors-for-vmware-app).
:::
## Prerequisites
VMWare metrics are collected through the [vCenter Receiver](https://github.com/open-telemetry/opentelemetry-collector-contrib/tree/main/receiver/vcenterreceiver) of OpenTelemetry.
This receiver has been built to support ESXi and vCenter versions:
- 8.0
- 7.0
A “Read Only” user assigned to a vSphere with permissions to the vCenter server, cluster, and all subsequent resources being monitored must be specified in order for the receiver to retrieve information about them.
## Collection configuration and app installation
import ConfigAppInstall from '../../../reuse/apps/opentelemetry/config-app-install.md';
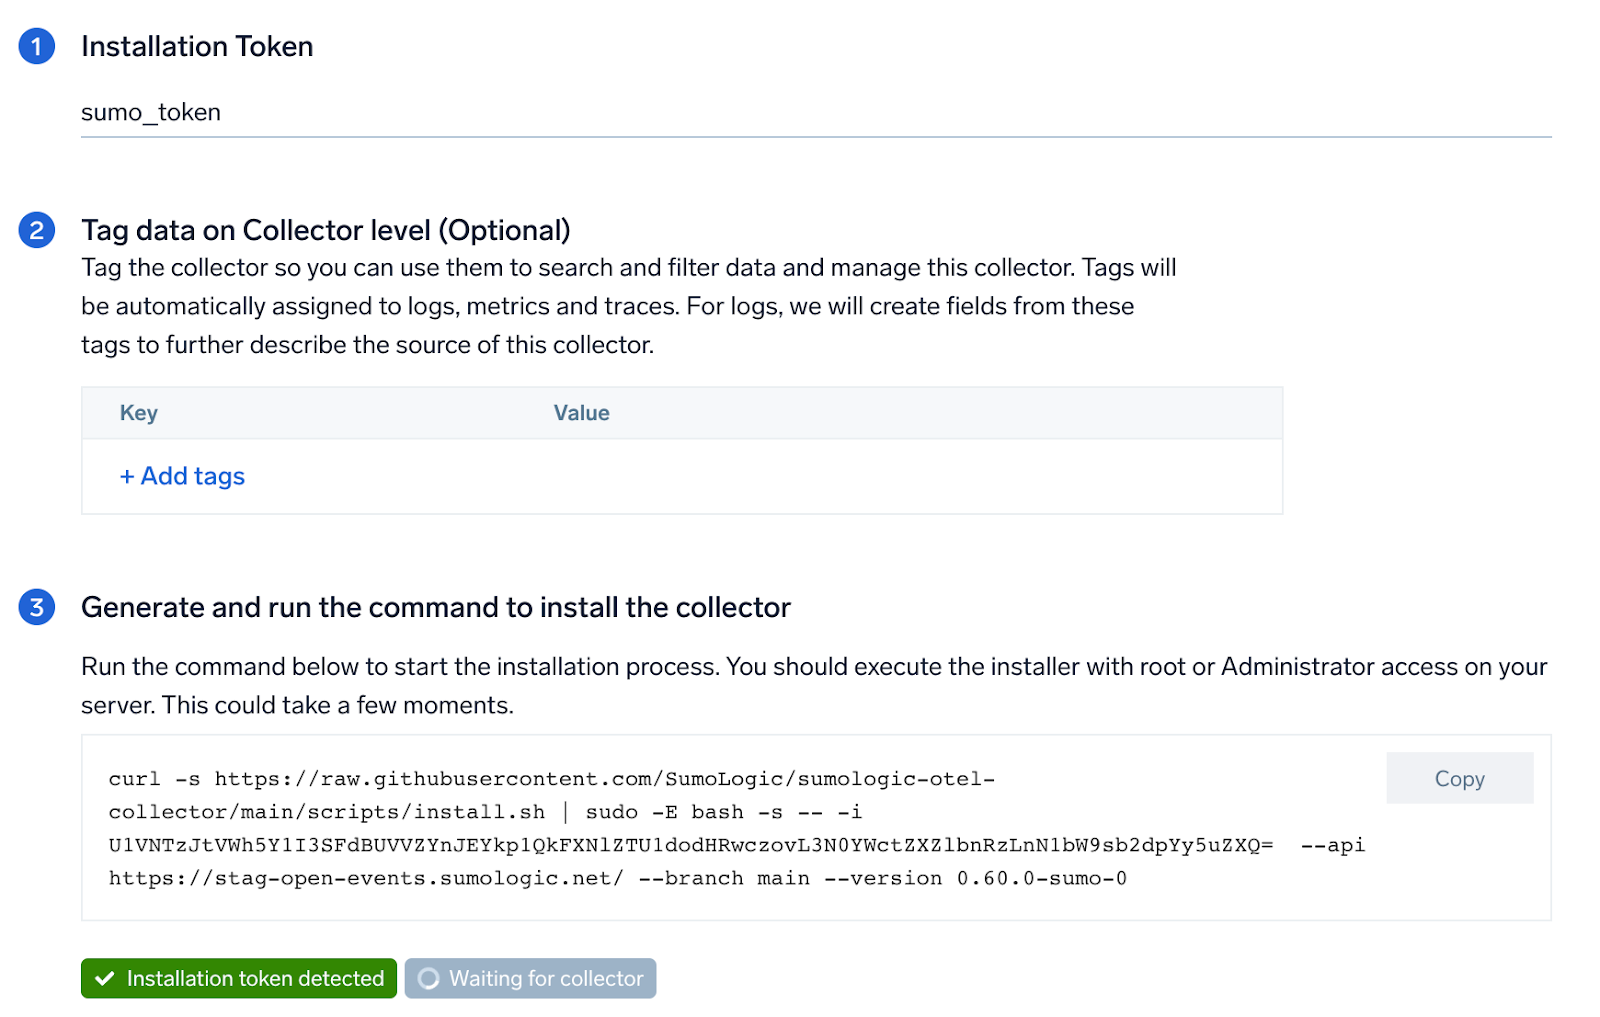
### Step 1: Set up Collector
import SetupColl from '../../../reuse/apps/opentelemetry/set-up-collector.md';
:::info
This app includes [built-in monitors](#vmware-alerts). For details on creating custom monitors, refer to the [Create monitors for JFrog Artifactory app](#create-monitors-for-vmware-app).
:::
## Prerequisites
VMWare metrics are collected through the [vCenter Receiver](https://github.com/open-telemetry/opentelemetry-collector-contrib/tree/main/receiver/vcenterreceiver) of OpenTelemetry.
This receiver has been built to support ESXi and vCenter versions:
- 8.0
- 7.0
A “Read Only” user assigned to a vSphere with permissions to the vCenter server, cluster, and all subsequent resources being monitored must be specified in order for the receiver to retrieve information about them.
## Collection configuration and app installation
import ConfigAppInstall from '../../../reuse/apps/opentelemetry/config-app-install.md';
### Step 1: Set up Collector
import SetupColl from '../../../reuse/apps/opentelemetry/set-up-collector.md';
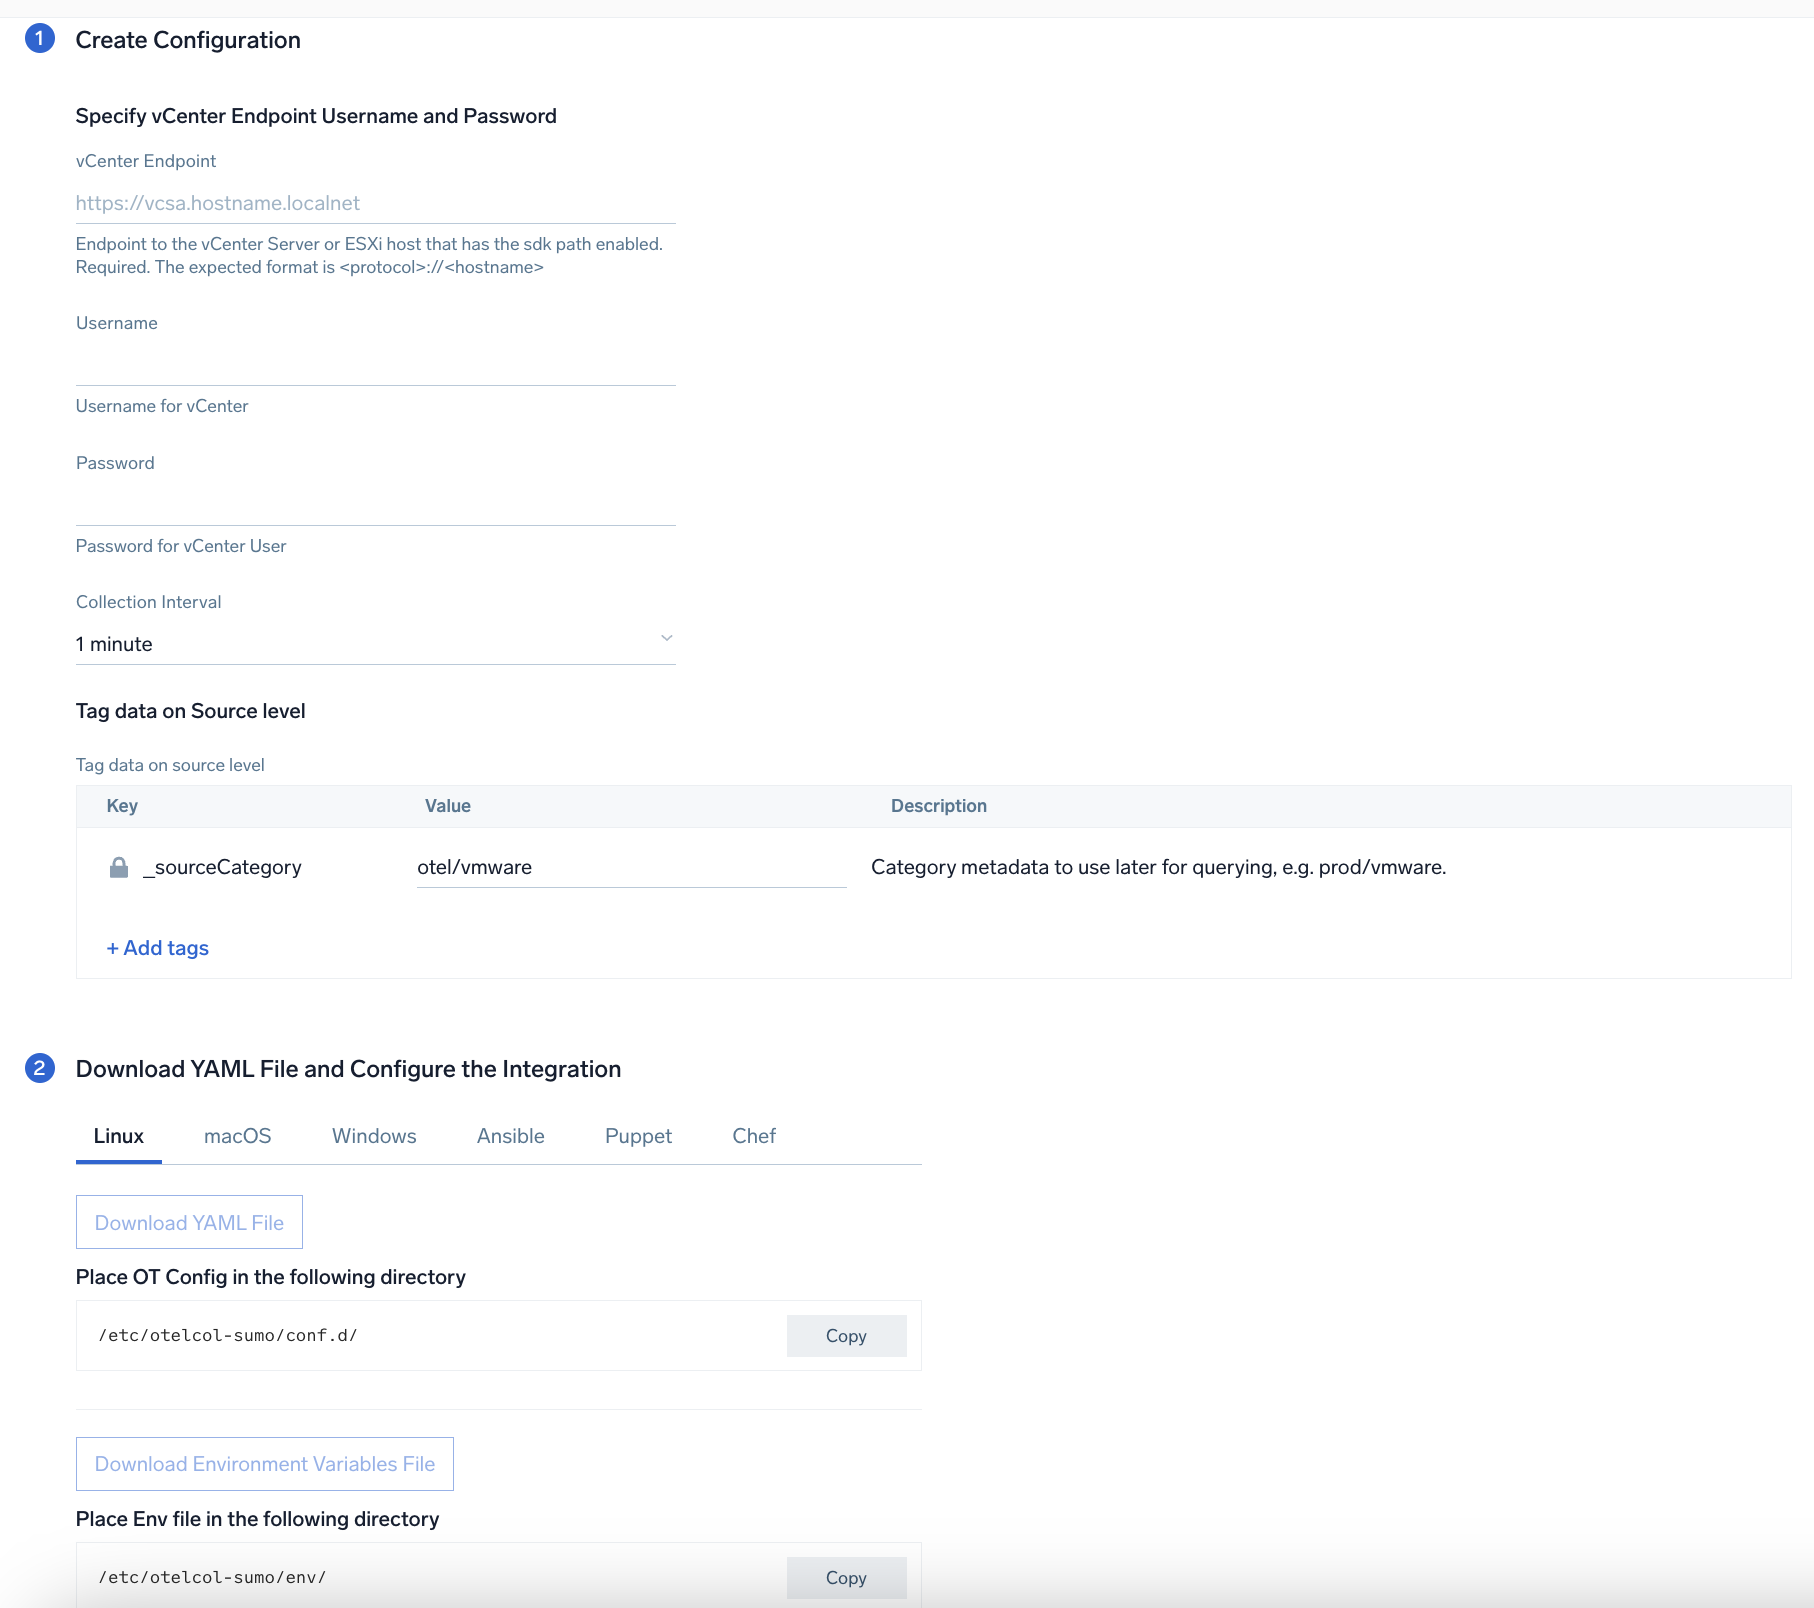
 ### Step 2: Configure integration
In this step, we will configure the YAML file required for VMWare Collection. Here is a list of required parameters:
- **Endpoint** to the vCenter Server or ESXi host that has the SDK path enabled. This is a required parameter. The expected format is `://`. For example, `https://vcsa.hostname.localnet`.
- **Username** of User which has access to vCenter server.
- **Password** of User which has access to vCenter server.
- **collection_interval** this receiver collects metrics on an interval. If the vCenter is fairly large, this value may need to be increased. Valid time units are `ns`, `us` (or `µs`), `ms`, `s`, `m`, `h`.
You can add any custom fields which you want to tag along with the data ingested in Sumo Logic. Click on the **Download YAML File** button to get the YAML file.
import CollectorVersionNote from '../../../reuse/apps/opentelemetry/collector-version-note.md';
import EnvVar from '../../../reuse/apps/opentelemetry/env-var-required.md';
### Step 2: Configure integration
In this step, we will configure the YAML file required for VMWare Collection. Here is a list of required parameters:
- **Endpoint** to the vCenter Server or ESXi host that has the SDK path enabled. This is a required parameter. The expected format is `://`. For example, `https://vcsa.hostname.localnet`.
- **Username** of User which has access to vCenter server.
- **Password** of User which has access to vCenter server.
- **collection_interval** this receiver collects metrics on an interval. If the vCenter is fairly large, this value may need to be increased. Valid time units are `ns`, `us` (or `µs`), `ms`, `s`, `m`, `h`.
You can add any custom fields which you want to tag along with the data ingested in Sumo Logic. Click on the **Download YAML File** button to get the YAML file.
import CollectorVersionNote from '../../../reuse/apps/opentelemetry/collector-version-note.md';
import EnvVar from '../../../reuse/apps/opentelemetry/env-var-required.md';
 ### Step 3: Send logs to Sumo Logic
import LogsIntro from '../../../reuse/apps/opentelemetry/send-logs-intro.md';
1. Copy the YAML file to the `/etc/otelcol-sumo/conf.d/` folder on the VMware instance that has access to vCenter or to vCenter itself.
2. Restart the collector using:
```sh
sudo systemctl restart otelcol-sumo
```
1. Copy the YAML file to `C:\ProgramData\Sumo Logic\OpenTelemetry Collector\config\conf.d` folder in the VMWare instance which has access to vCenter or the vCenter itself.
2. Restart the collector using:
```sh
Restart-Service -Name OtelcolSumo
```
1. Copy the YAML file to `/etc/otelcol-sumo/conf.d/` folder on the VMware instance that has access to vCenter or to vCenter itself.
2. Restart the otelcol-sumo process using the below command:
```sh
otelcol-sumo --config /etc/otelcol-sumo/sumologic.yaml --config "glob:/etc/otelcol-sumo/conf.d/*.yaml"
```
import ChefNoEnv from '../../../reuse/apps/opentelemetry/chef-without-env.md';
import AnsibleNoEnv from '../../../reuse/apps/opentelemetry/ansible-without-env.md';
import PuppetNoEnv from '../../../reuse/apps/opentelemetry/puppet-without-env.md';
import LogsOutro from '../../../reuse/apps/opentelemetry/send-logs-outro.md';
## Sample queries
### Metrics query
This sample query is from the **VMWare - Overview** > **Top 25 ESXi Hosts - CPU Utilization** panel.
```sql title="Metric query"
sumo.datasource=vmware metric=vcenter.host.cpu.utilization vcenter.datacenter.name=* vcenter.cluster.name=* vcenter.host.name=* | topk(25,avg)
```
## Sample metrics
### Metric message
```json title="Metric message"
{
"queryId": "A",
"_source": "WIN-U8TUICHO2JM",
"_metricId": "-nHlUFTEN-e35PT8M0bW4Q",
"_sourceName": "vmware",
"host.group": "sumovmware",
"os.type": "windows",
"sumo.datasource": "vmware",
"_sourceCategory": "otel/vmware",
"deployment.environment": "sumovmware",
"_contentType": "OpenTelemetry",
"host.name": "WIN-U8TUICHO2JM",
"metric": "vcenter.host.cpu.utilization",
"_collectorId": "00005AF310C86B33",
"vcenter.datacenter.name": "Production",
"_sourceId": "0000000000000000",
"unit": "%",
"vcenter.cluster.name": "Prod Cluster",
"_sourceHost": "WIN-U8TUICHO2JM",
"_collector": "WIN-U8TUICHO2JM",
"vcenter.host.name": "esx1.esxlab.com",
"max": 45.76,
"min": 0,
"avg": 5.65,
"sum": 1621.41,
"latest": 0,
"count": 287
}
```
## Viewing VMWare dashboards
You can filter data on VMWare dashboards with template variables. Template variables provide dynamic dashboards that rescope data on the fly. As you apply variables to troubleshoot through your dashboard, you can view dynamic changes to the data for a fast resolution to the root cause. For more information, see [Filtering Dashboards with Template Variables](/docs/dashboards/filter-template-variables/).
### VMWare - Overview
The **VMWare - Overview** dashboard provides an at-a-glance view of unique clusters, ESXi hosts, and unique VMs. It also provides data for datastore disk utilisation, VM disk usage, CPU Utilization, Memory Utilization, and Network Usage for VMs and Hosts.
### Step 3: Send logs to Sumo Logic
import LogsIntro from '../../../reuse/apps/opentelemetry/send-logs-intro.md';
1. Copy the YAML file to the `/etc/otelcol-sumo/conf.d/` folder on the VMware instance that has access to vCenter or to vCenter itself.
2. Restart the collector using:
```sh
sudo systemctl restart otelcol-sumo
```
1. Copy the YAML file to `C:\ProgramData\Sumo Logic\OpenTelemetry Collector\config\conf.d` folder in the VMWare instance which has access to vCenter or the vCenter itself.
2. Restart the collector using:
```sh
Restart-Service -Name OtelcolSumo
```
1. Copy the YAML file to `/etc/otelcol-sumo/conf.d/` folder on the VMware instance that has access to vCenter or to vCenter itself.
2. Restart the otelcol-sumo process using the below command:
```sh
otelcol-sumo --config /etc/otelcol-sumo/sumologic.yaml --config "glob:/etc/otelcol-sumo/conf.d/*.yaml"
```
import ChefNoEnv from '../../../reuse/apps/opentelemetry/chef-without-env.md';
import AnsibleNoEnv from '../../../reuse/apps/opentelemetry/ansible-without-env.md';
import PuppetNoEnv from '../../../reuse/apps/opentelemetry/puppet-without-env.md';
import LogsOutro from '../../../reuse/apps/opentelemetry/send-logs-outro.md';
## Sample queries
### Metrics query
This sample query is from the **VMWare - Overview** > **Top 25 ESXi Hosts - CPU Utilization** panel.
```sql title="Metric query"
sumo.datasource=vmware metric=vcenter.host.cpu.utilization vcenter.datacenter.name=* vcenter.cluster.name=* vcenter.host.name=* | topk(25,avg)
```
## Sample metrics
### Metric message
```json title="Metric message"
{
"queryId": "A",
"_source": "WIN-U8TUICHO2JM",
"_metricId": "-nHlUFTEN-e35PT8M0bW4Q",
"_sourceName": "vmware",
"host.group": "sumovmware",
"os.type": "windows",
"sumo.datasource": "vmware",
"_sourceCategory": "otel/vmware",
"deployment.environment": "sumovmware",
"_contentType": "OpenTelemetry",
"host.name": "WIN-U8TUICHO2JM",
"metric": "vcenter.host.cpu.utilization",
"_collectorId": "00005AF310C86B33",
"vcenter.datacenter.name": "Production",
"_sourceId": "0000000000000000",
"unit": "%",
"vcenter.cluster.name": "Prod Cluster",
"_sourceHost": "WIN-U8TUICHO2JM",
"_collector": "WIN-U8TUICHO2JM",
"vcenter.host.name": "esx1.esxlab.com",
"max": 45.76,
"min": 0,
"avg": 5.65,
"sum": 1621.41,
"latest": 0,
"count": 287
}
```
## Viewing VMWare dashboards
You can filter data on VMWare dashboards with template variables. Template variables provide dynamic dashboards that rescope data on the fly. As you apply variables to troubleshoot through your dashboard, you can view dynamic changes to the data for a fast resolution to the root cause. For more information, see [Filtering Dashboards with Template Variables](/docs/dashboards/filter-template-variables/).
### VMWare - Overview
The **VMWare - Overview** dashboard provides an at-a-glance view of unique clusters, ESXi hosts, and unique VMs. It also provides data for datastore disk utilisation, VM disk usage, CPU Utilization, Memory Utilization, and Network Usage for VMs and Hosts.
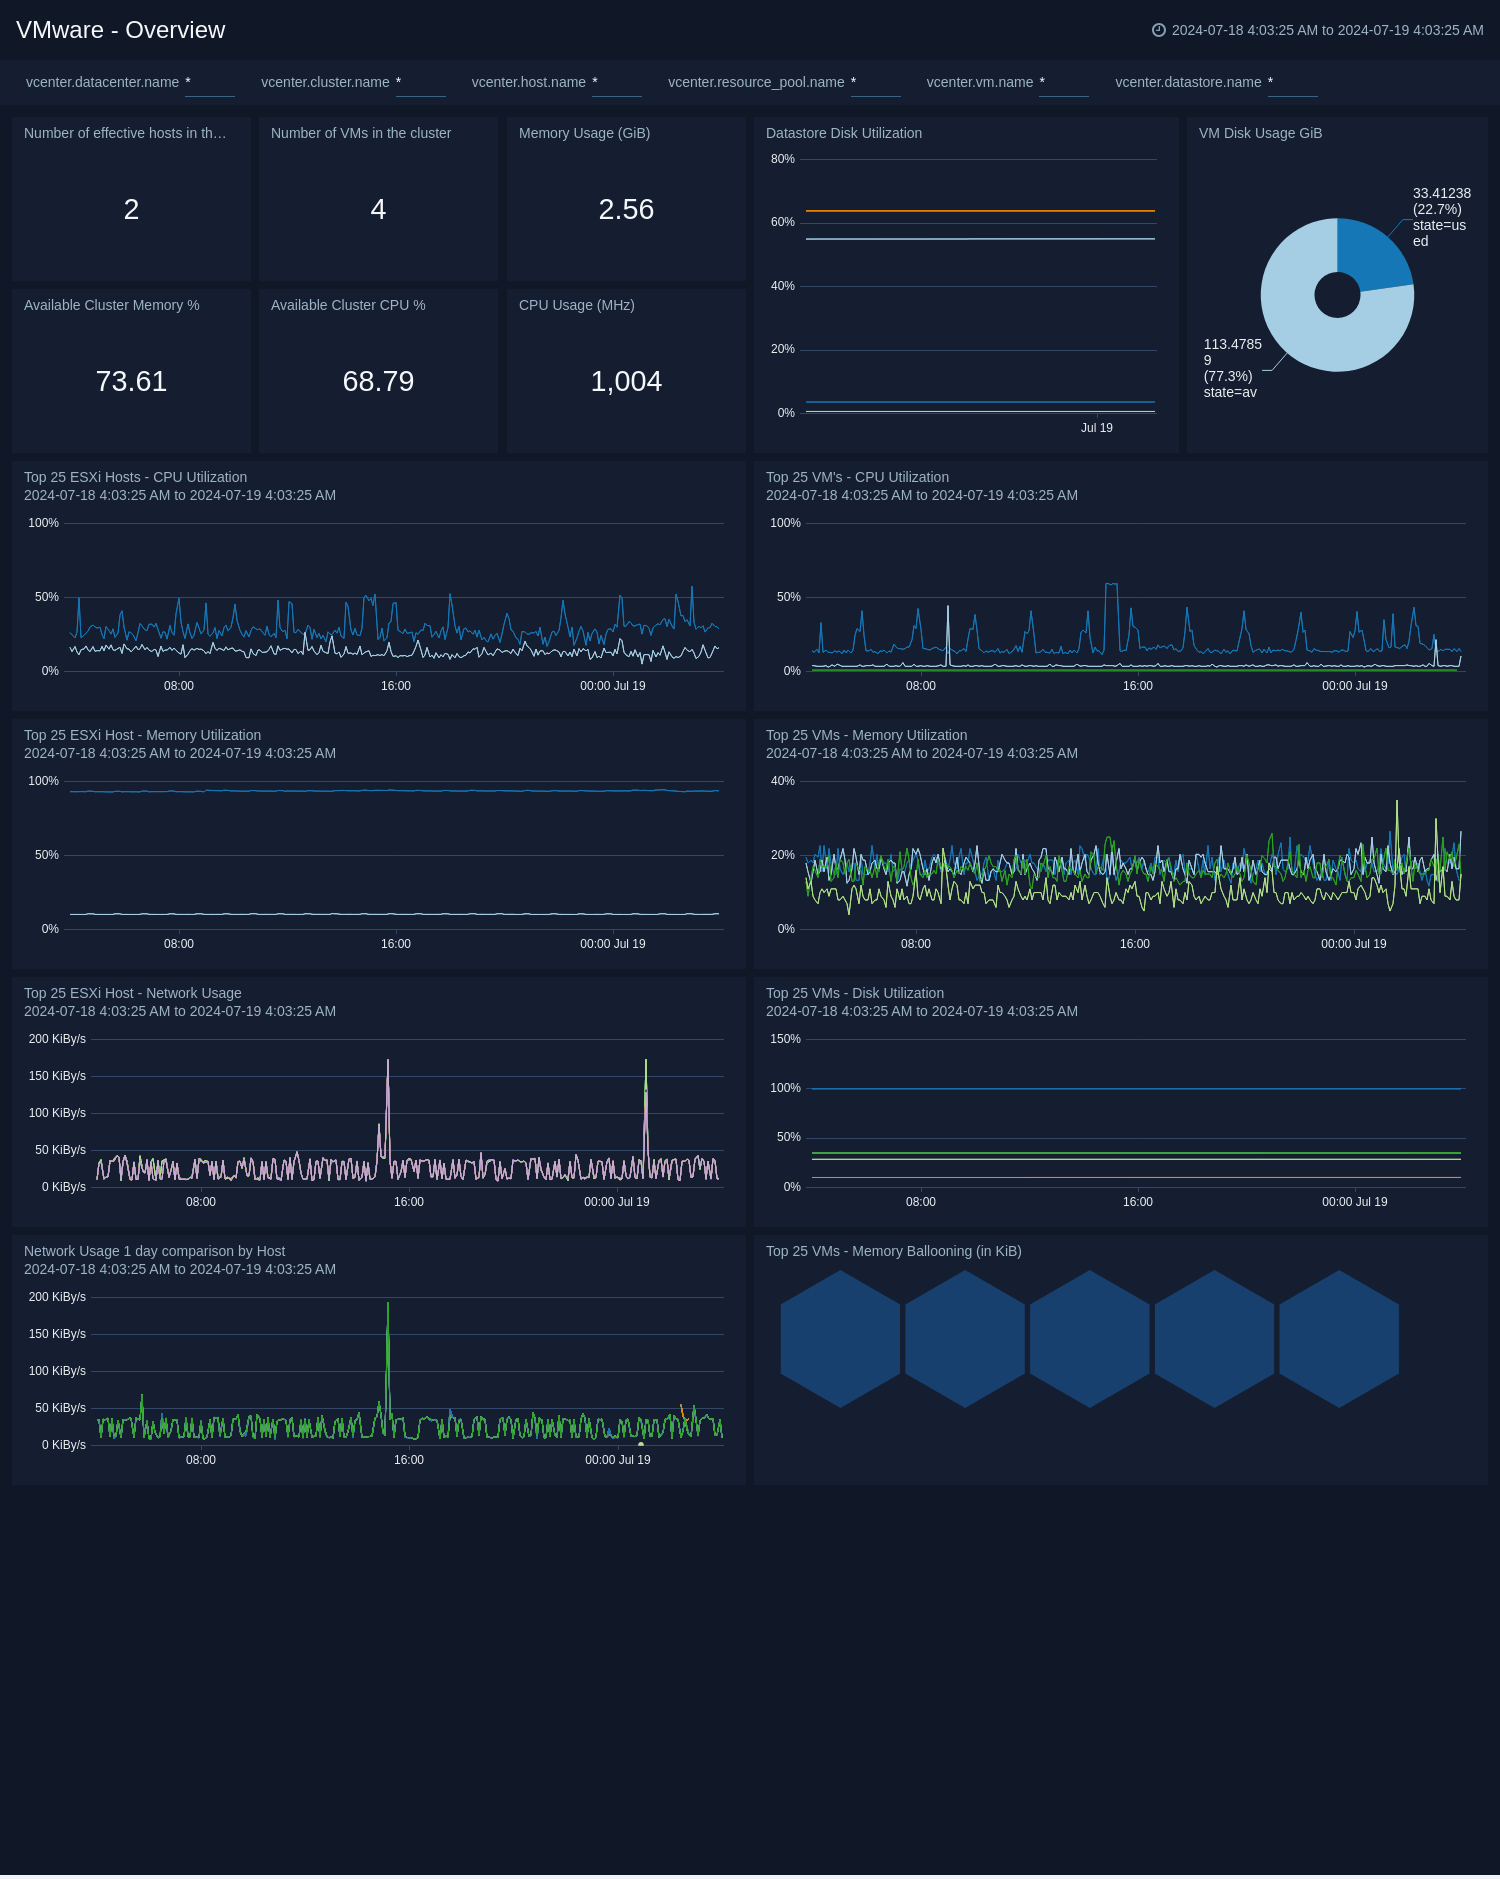 - **Number of ESXi Hosts in Cluster**. The total number of ESXi hosts in the cluster.
- **Number of VMs in Cluster**. The total number of VMs in the cluster.
- **Available Cluster Memory**. Percentage of memory available in the cluster.
- **Available Cluster CPU**. Percentage of CPU available in the cluster.
- **Datastore Disk Utilization**. The disk utilization of the datastore.
- **VM Disk Usage**. The disk usage of VM.
- **Top 25 ESXi Hosts CPU Utilization**. Top 25 ESXi Hosts CPU utilization.
- **Top 25 ESXi Hosts Memory Utilization**. Top 25 ESXi Hosts memory utilization.
- **Top 25 ESXi Hosts Network Usage**. Top 25 ESXi Hosts usage.
- **Top 25 VMs CPU Utilization**. Top 25 VMs CPU utilization.
- **Top 25 VMs Memory Utilization**. Top 25 VMs memory utilization.
- **Top 25 VMs Network Usage**. Top 25 VMs network usage.
- **Top 25 VMs Memory Ballooning**. Top 25 VMs memory ballooning.
### VMWare - Clusters
The **VMWare - Clusters** dashboard provides at-a-glance analysis of VMWare cluster metrics like Hosts count, VM count, available CPU, and Memory percentage.
- **Number of ESXi Hosts in Cluster**. The total number of ESXi hosts in the cluster.
- **Number of VMs in Cluster**. The total number of VMs in the cluster.
- **Available Cluster Memory**. Percentage of memory available in the cluster.
- **Available Cluster CPU**. Percentage of CPU available in the cluster.
- **Datastore Disk Utilization**. The disk utilization of the datastore.
- **VM Disk Usage**. The disk usage of VM.
- **Top 25 ESXi Hosts CPU Utilization**. Top 25 ESXi Hosts CPU utilization.
- **Top 25 ESXi Hosts Memory Utilization**. Top 25 ESXi Hosts memory utilization.
- **Top 25 ESXi Hosts Network Usage**. Top 25 ESXi Hosts usage.
- **Top 25 VMs CPU Utilization**. Top 25 VMs CPU utilization.
- **Top 25 VMs Memory Utilization**. Top 25 VMs memory utilization.
- **Top 25 VMs Network Usage**. Top 25 VMs network usage.
- **Top 25 VMs Memory Ballooning**. Top 25 VMs memory ballooning.
### VMWare - Clusters
The **VMWare - Clusters** dashboard provides at-a-glance analysis of VMWare cluster metrics like Hosts count, VM count, available CPU, and Memory percentage.
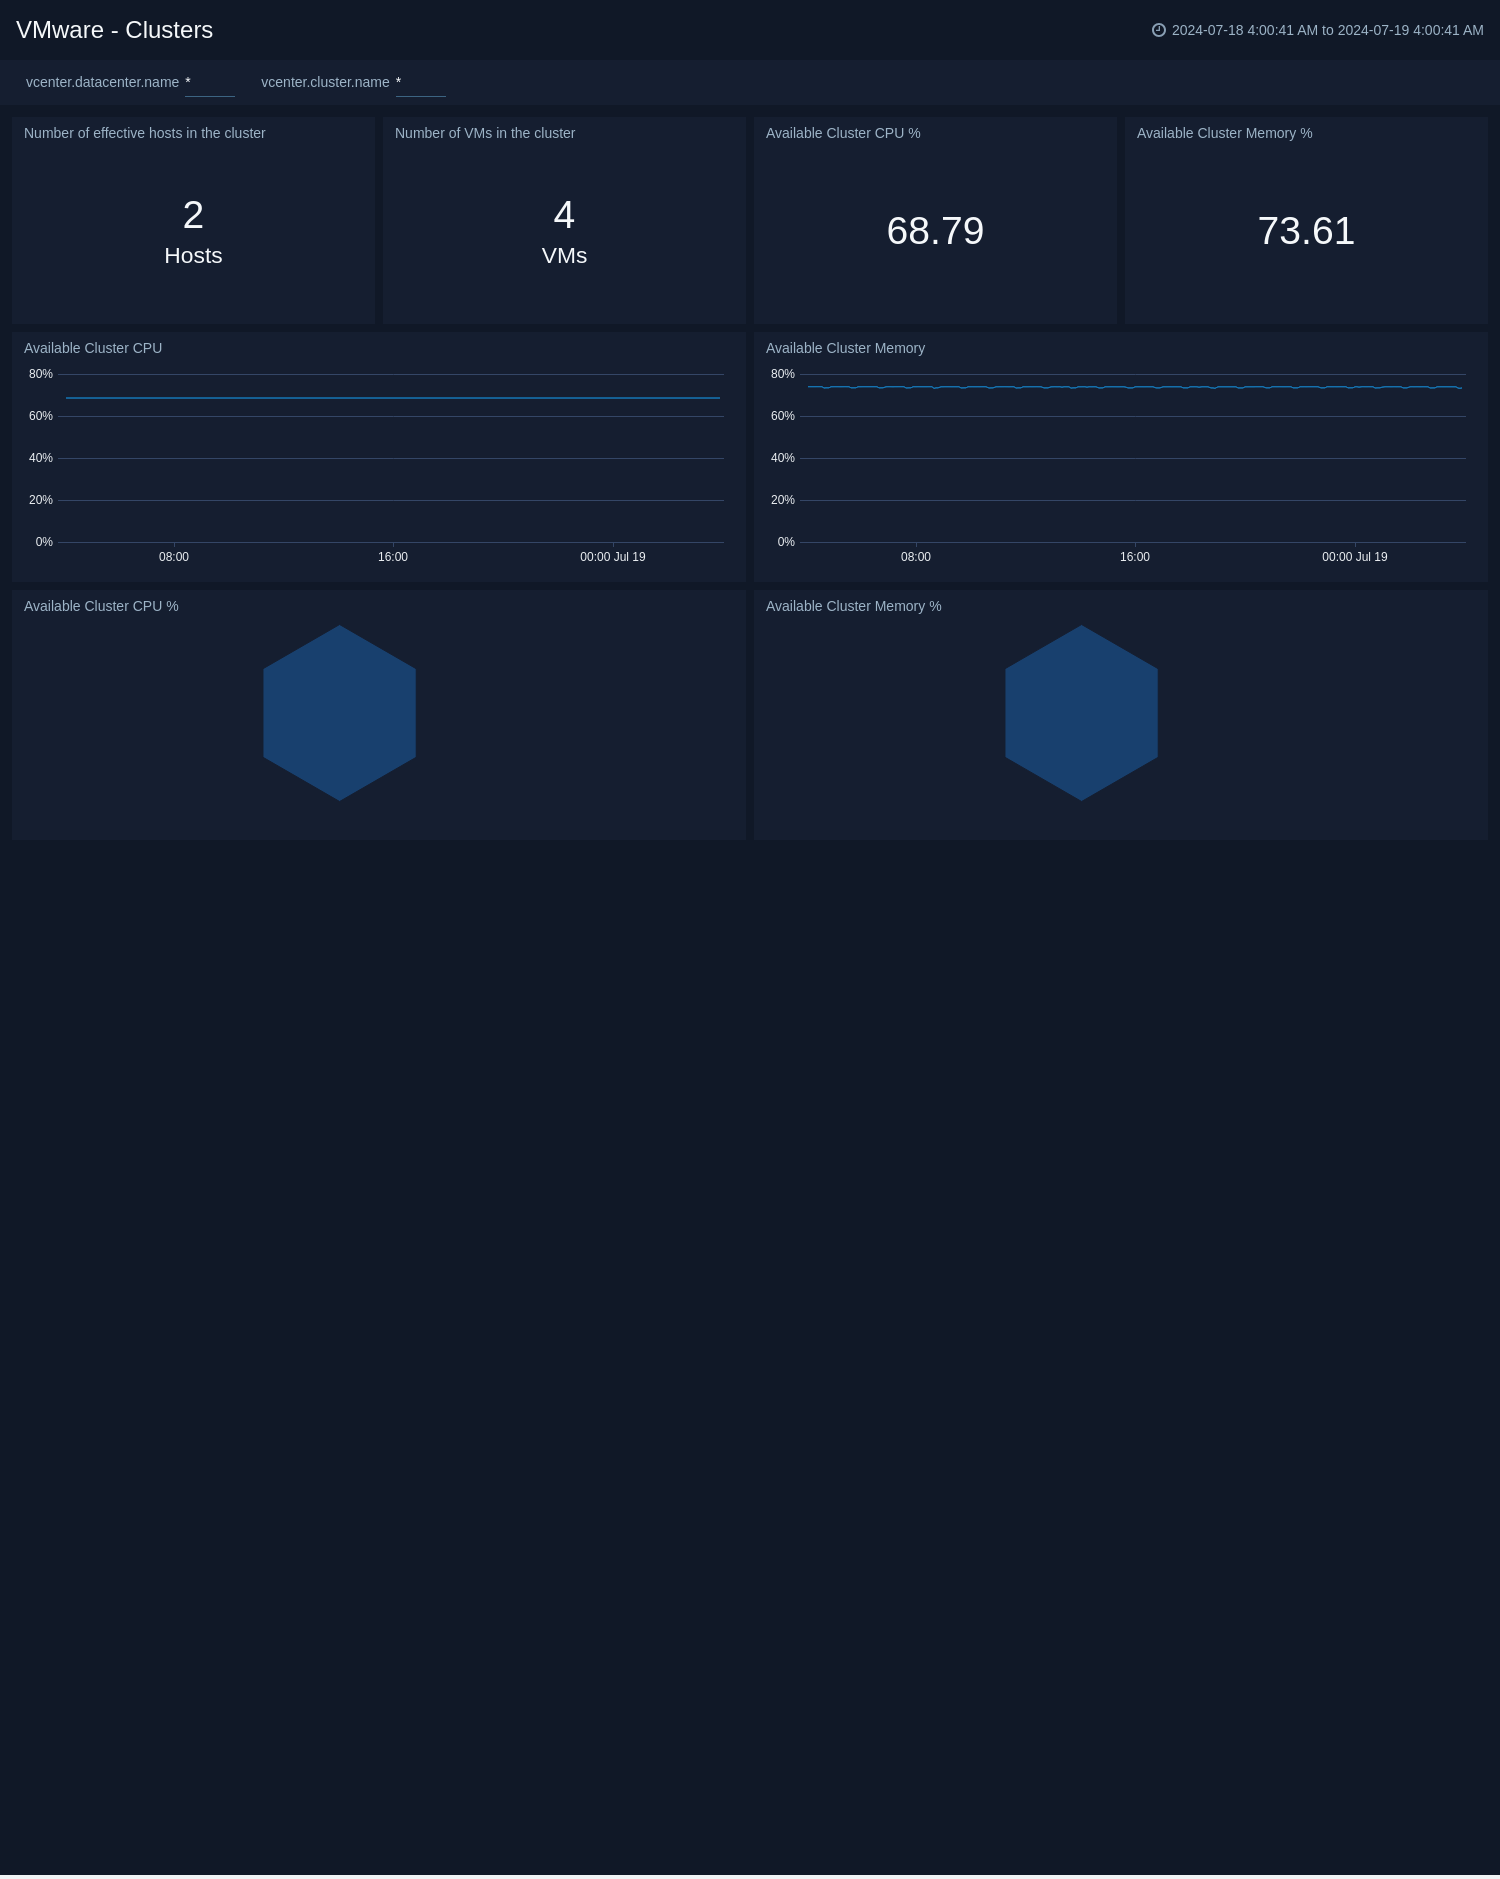 - **Number of ESXi Hosts in Cluster**. The total number of ESXi hosts in the cluster.
- **Number of VMs in Cluster**. The total number of VMs in the cluster.
- **Available Cluster CPU**. Percentage of CPU available in the cluster.
- **Available Cluster Memory**. Percentage of Memory available in the cluster.
### VMWare - Resource Pools
The **VMWare - Resource Pools** dashboard provides an at-a-glance analysis of Resource Pool metrics like Memory Usage, CPU Usage, Shares of CPU, and Memory.
- **Number of ESXi Hosts in Cluster**. The total number of ESXi hosts in the cluster.
- **Number of VMs in Cluster**. The total number of VMs in the cluster.
- **Available Cluster CPU**. Percentage of CPU available in the cluster.
- **Available Cluster Memory**. Percentage of Memory available in the cluster.
### VMWare - Resource Pools
The **VMWare - Resource Pools** dashboard provides an at-a-glance analysis of Resource Pool metrics like Memory Usage, CPU Usage, Shares of CPU, and Memory.
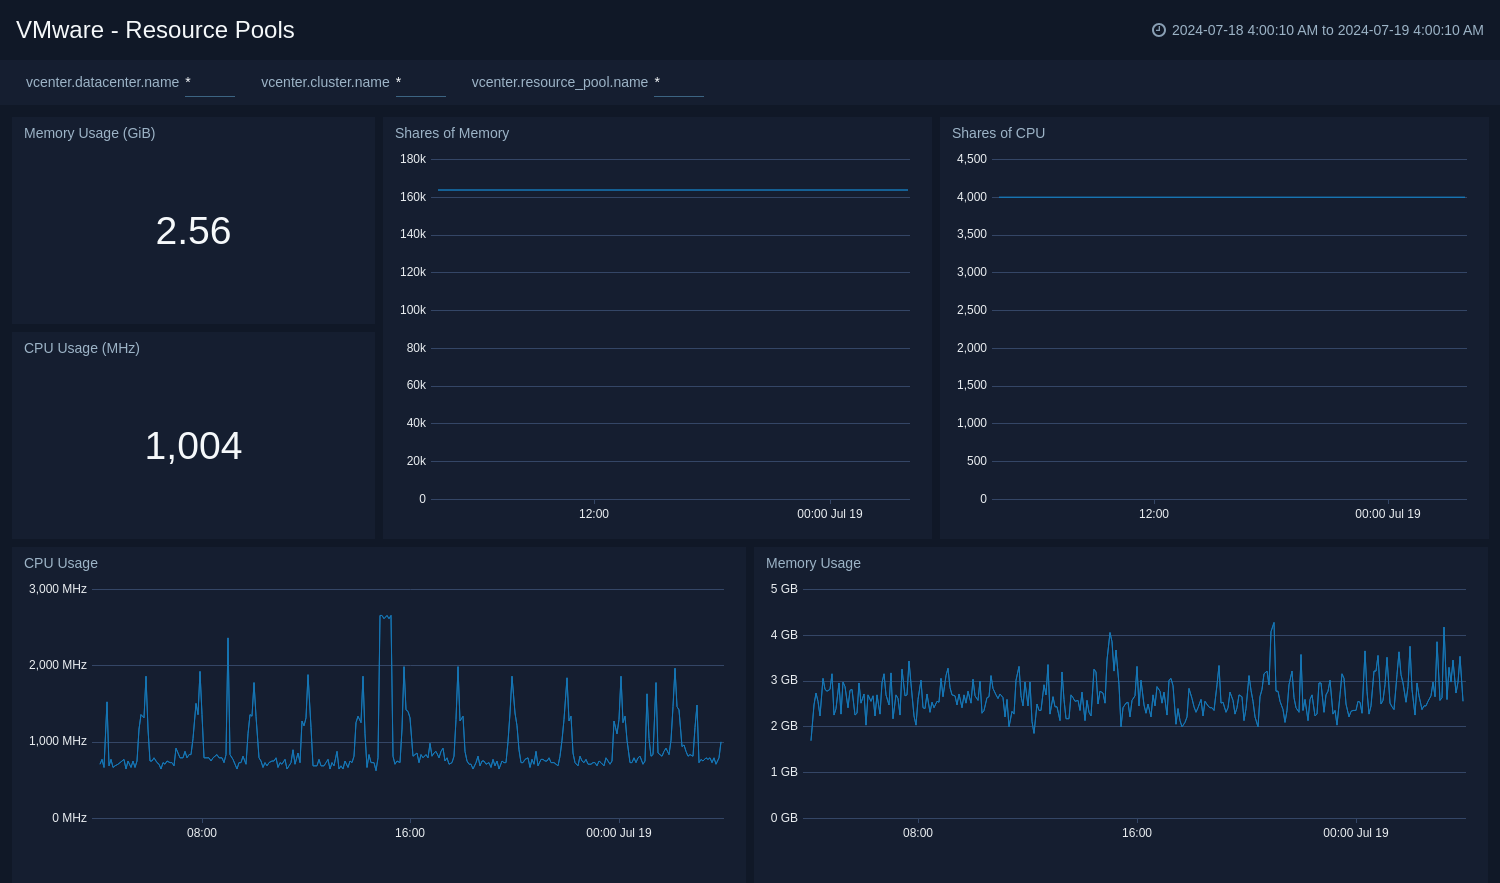 - **Cluster CPU Usage**. CPU usage of the resource pool.
- **Cluster Memory Usage**. Memory usage of the resource pool.
- **Shares of CPU**. Shares of CPU in the resource pool.
- **Shares of Memory**. Shares of Memory in the resource pool.
### VMWare - Host Overview
The **VMWare - Host Overview** dashboard provides at-a-glance analysis of ESXi Hosts metrics like CPU Utilization, Memory Utilization, Read/ Write Latency, and Network Usage.
- **Cluster CPU Usage**. CPU usage of the resource pool.
- **Cluster Memory Usage**. Memory usage of the resource pool.
- **Shares of CPU**. Shares of CPU in the resource pool.
- **Shares of Memory**. Shares of Memory in the resource pool.
### VMWare - Host Overview
The **VMWare - Host Overview** dashboard provides at-a-glance analysis of ESXi Hosts metrics like CPU Utilization, Memory Utilization, Read/ Write Latency, and Network Usage.
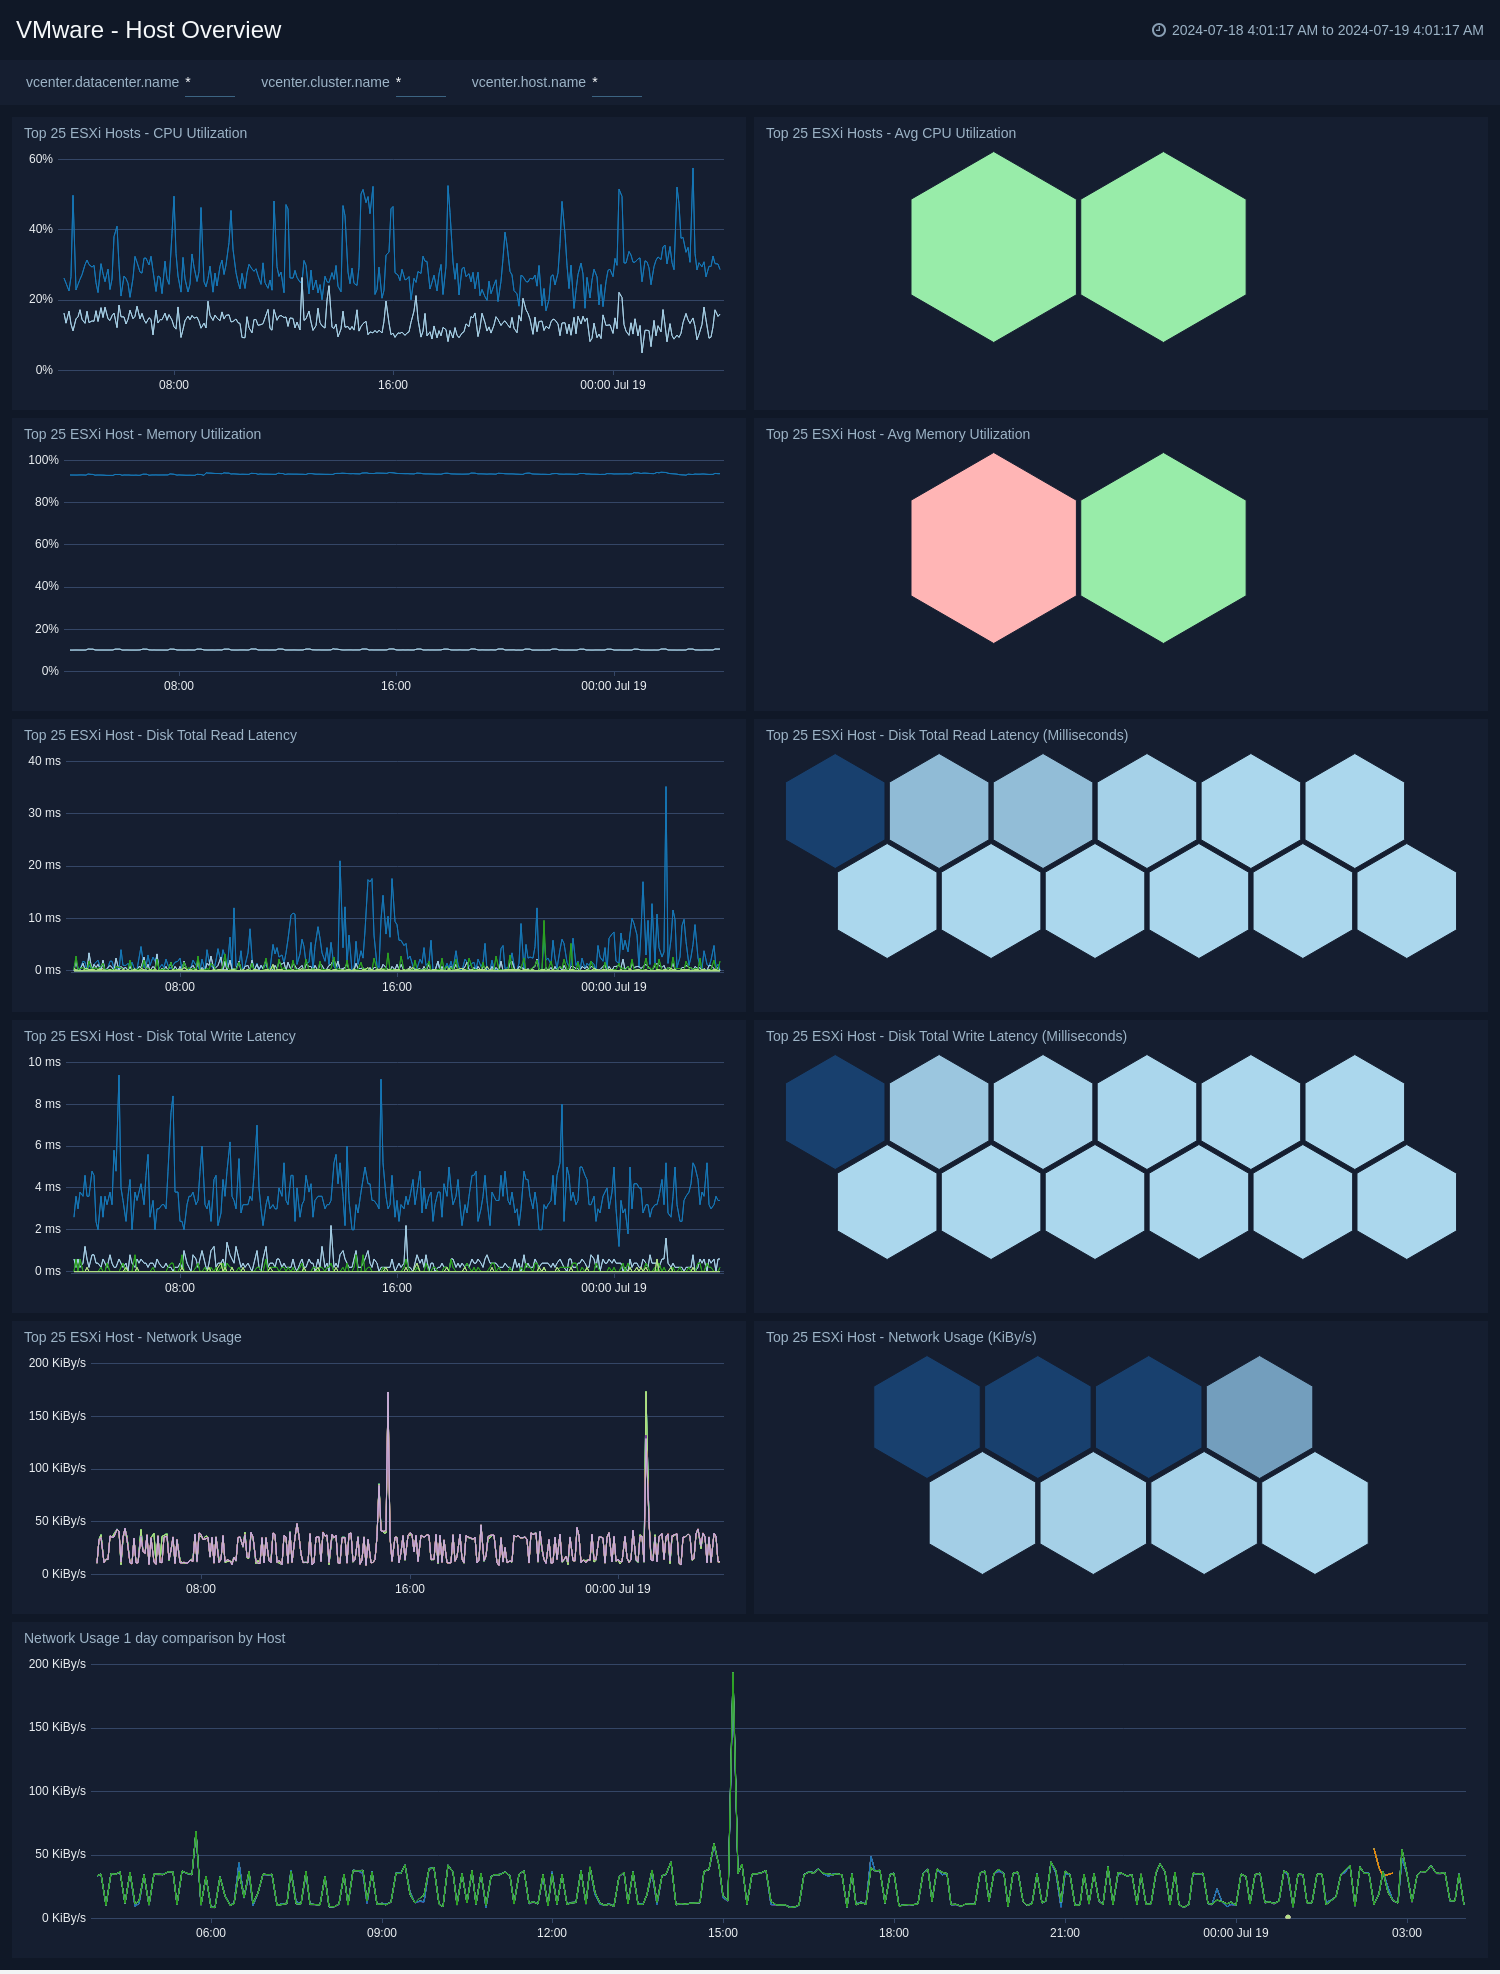 - **Top 25 ESXi Hosts CPU Utilization**. Top 25 ESXi Hosts CPU Utilization.
- **Top 25 ESXi Hosts Memory Utilization**. Top 25 ESXi Hosts Memory Utilization.
- **Top 25 ESXi Hosts Network Usage**. Top 25 ESXi Hosts Network Usage.
- **Top 25 ESXi Hosts Disk Read/ Write Latency**. Top 25 ESXi Hosts Disk read/ write latency.
- **Host Memory Capacity**. Total memory capacity of the host systems being monitored.
### VMWare - Host Details
The **VMWare - Host Details** dashboard provides detailed analysis of ESXi Hosts metrics like CPU Usage, Memory Usage, Disk Read/ Write Rate, Network Usage, Network Packet Rate, and Network Packet Error Rate.
- **Top 25 ESXi Hosts CPU Utilization**. Top 25 ESXi Hosts CPU Utilization.
- **Top 25 ESXi Hosts Memory Utilization**. Top 25 ESXi Hosts Memory Utilization.
- **Top 25 ESXi Hosts Network Usage**. Top 25 ESXi Hosts Network Usage.
- **Top 25 ESXi Hosts Disk Read/ Write Latency**. Top 25 ESXi Hosts Disk read/ write latency.
- **Host Memory Capacity**. Total memory capacity of the host systems being monitored.
### VMWare - Host Details
The **VMWare - Host Details** dashboard provides detailed analysis of ESXi Hosts metrics like CPU Usage, Memory Usage, Disk Read/ Write Rate, Network Usage, Network Packet Rate, and Network Packet Error Rate.
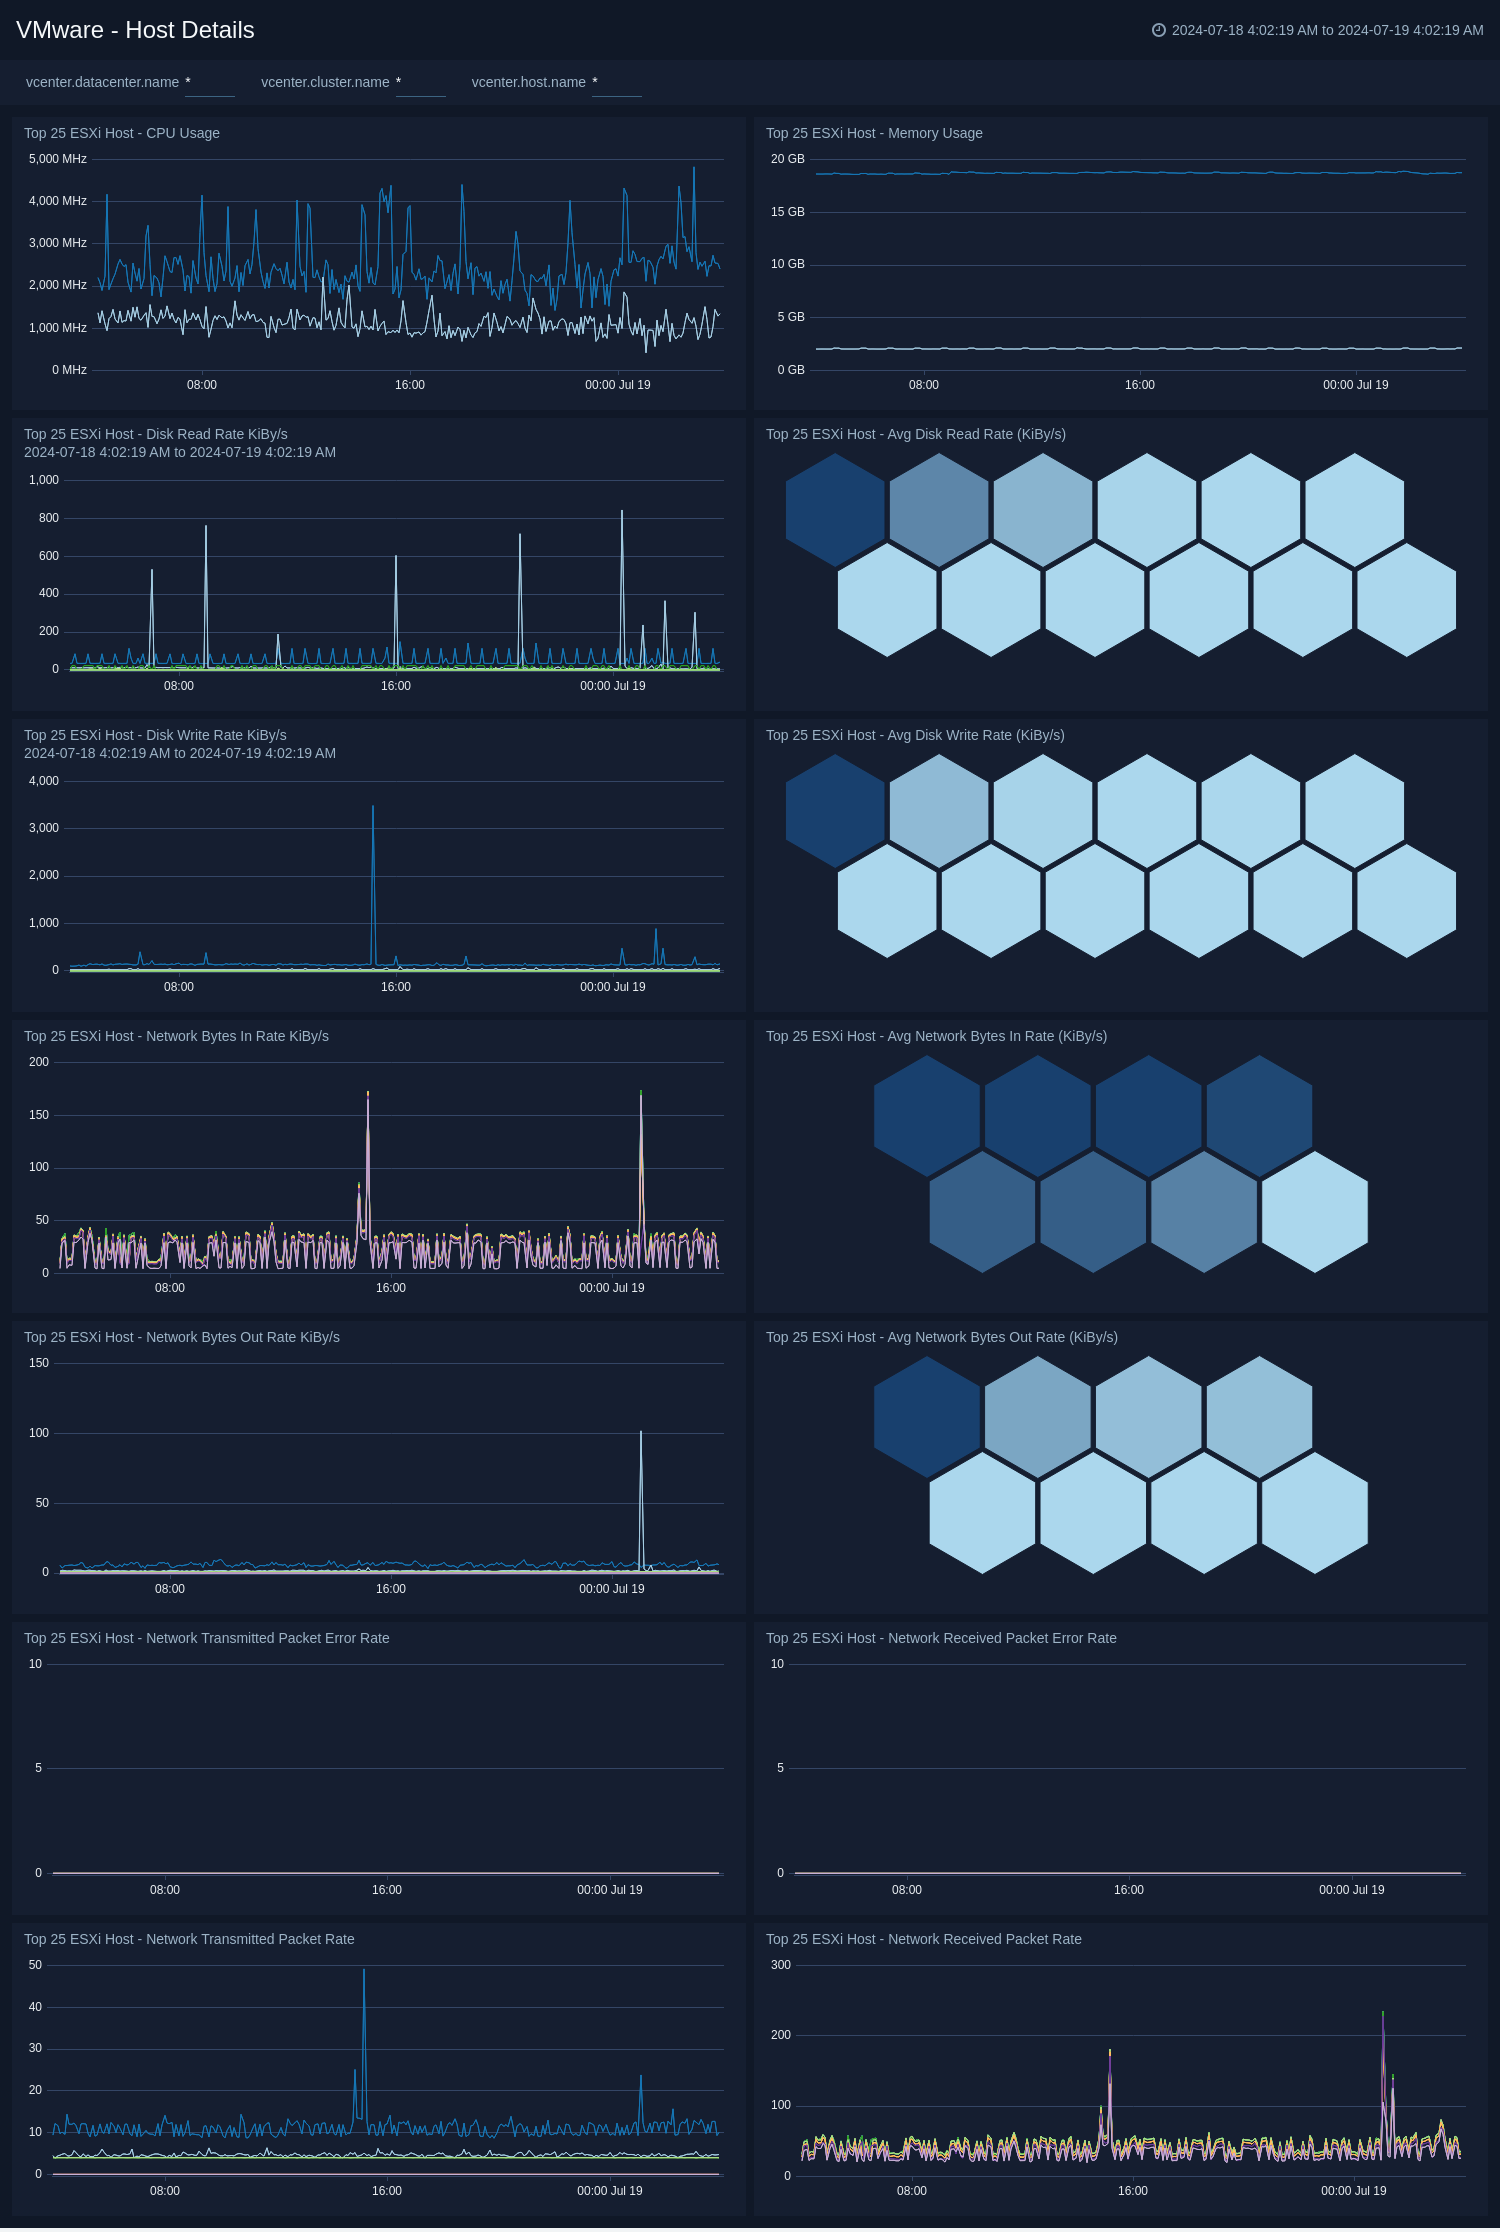 - **Top 25 ESXi Hosts CPU Usage**. Top 25 ESXi Hosts CPU usage.
- **Top 25 ESXi Hosts Disk Read/ Write Rate**. Top 25 ESXi Hosts Disk read/ write rate.
- **Top 25 ESXi Hosts Network Throughput**. Top 25 ESXi Hosts Network throughput.
- **Top 25 ESXi Hosts Network Packet Rate**. Top 25 ESXi Hosts Network transmitted/ received packet rate.
- **Top 25 ESXi Hosts Network Packet Error Rate**. Top 25 ESXi Hosts Network transmitted/ received packet error rate.
### VMWare - VM Overview
The **VMWare - VM Overview** dashboard provides an at-a-glance analysis of VM metrics like CPU Utilization, Memory Utilization, Disk Utilization, Network Usage, and Disk Usage.
- **Top 25 ESXi Hosts CPU Usage**. Top 25 ESXi Hosts CPU usage.
- **Top 25 ESXi Hosts Disk Read/ Write Rate**. Top 25 ESXi Hosts Disk read/ write rate.
- **Top 25 ESXi Hosts Network Throughput**. Top 25 ESXi Hosts Network throughput.
- **Top 25 ESXi Hosts Network Packet Rate**. Top 25 ESXi Hosts Network transmitted/ received packet rate.
- **Top 25 ESXi Hosts Network Packet Error Rate**. Top 25 ESXi Hosts Network transmitted/ received packet error rate.
### VMWare - VM Overview
The **VMWare - VM Overview** dashboard provides an at-a-glance analysis of VM metrics like CPU Utilization, Memory Utilization, Disk Utilization, Network Usage, and Disk Usage.
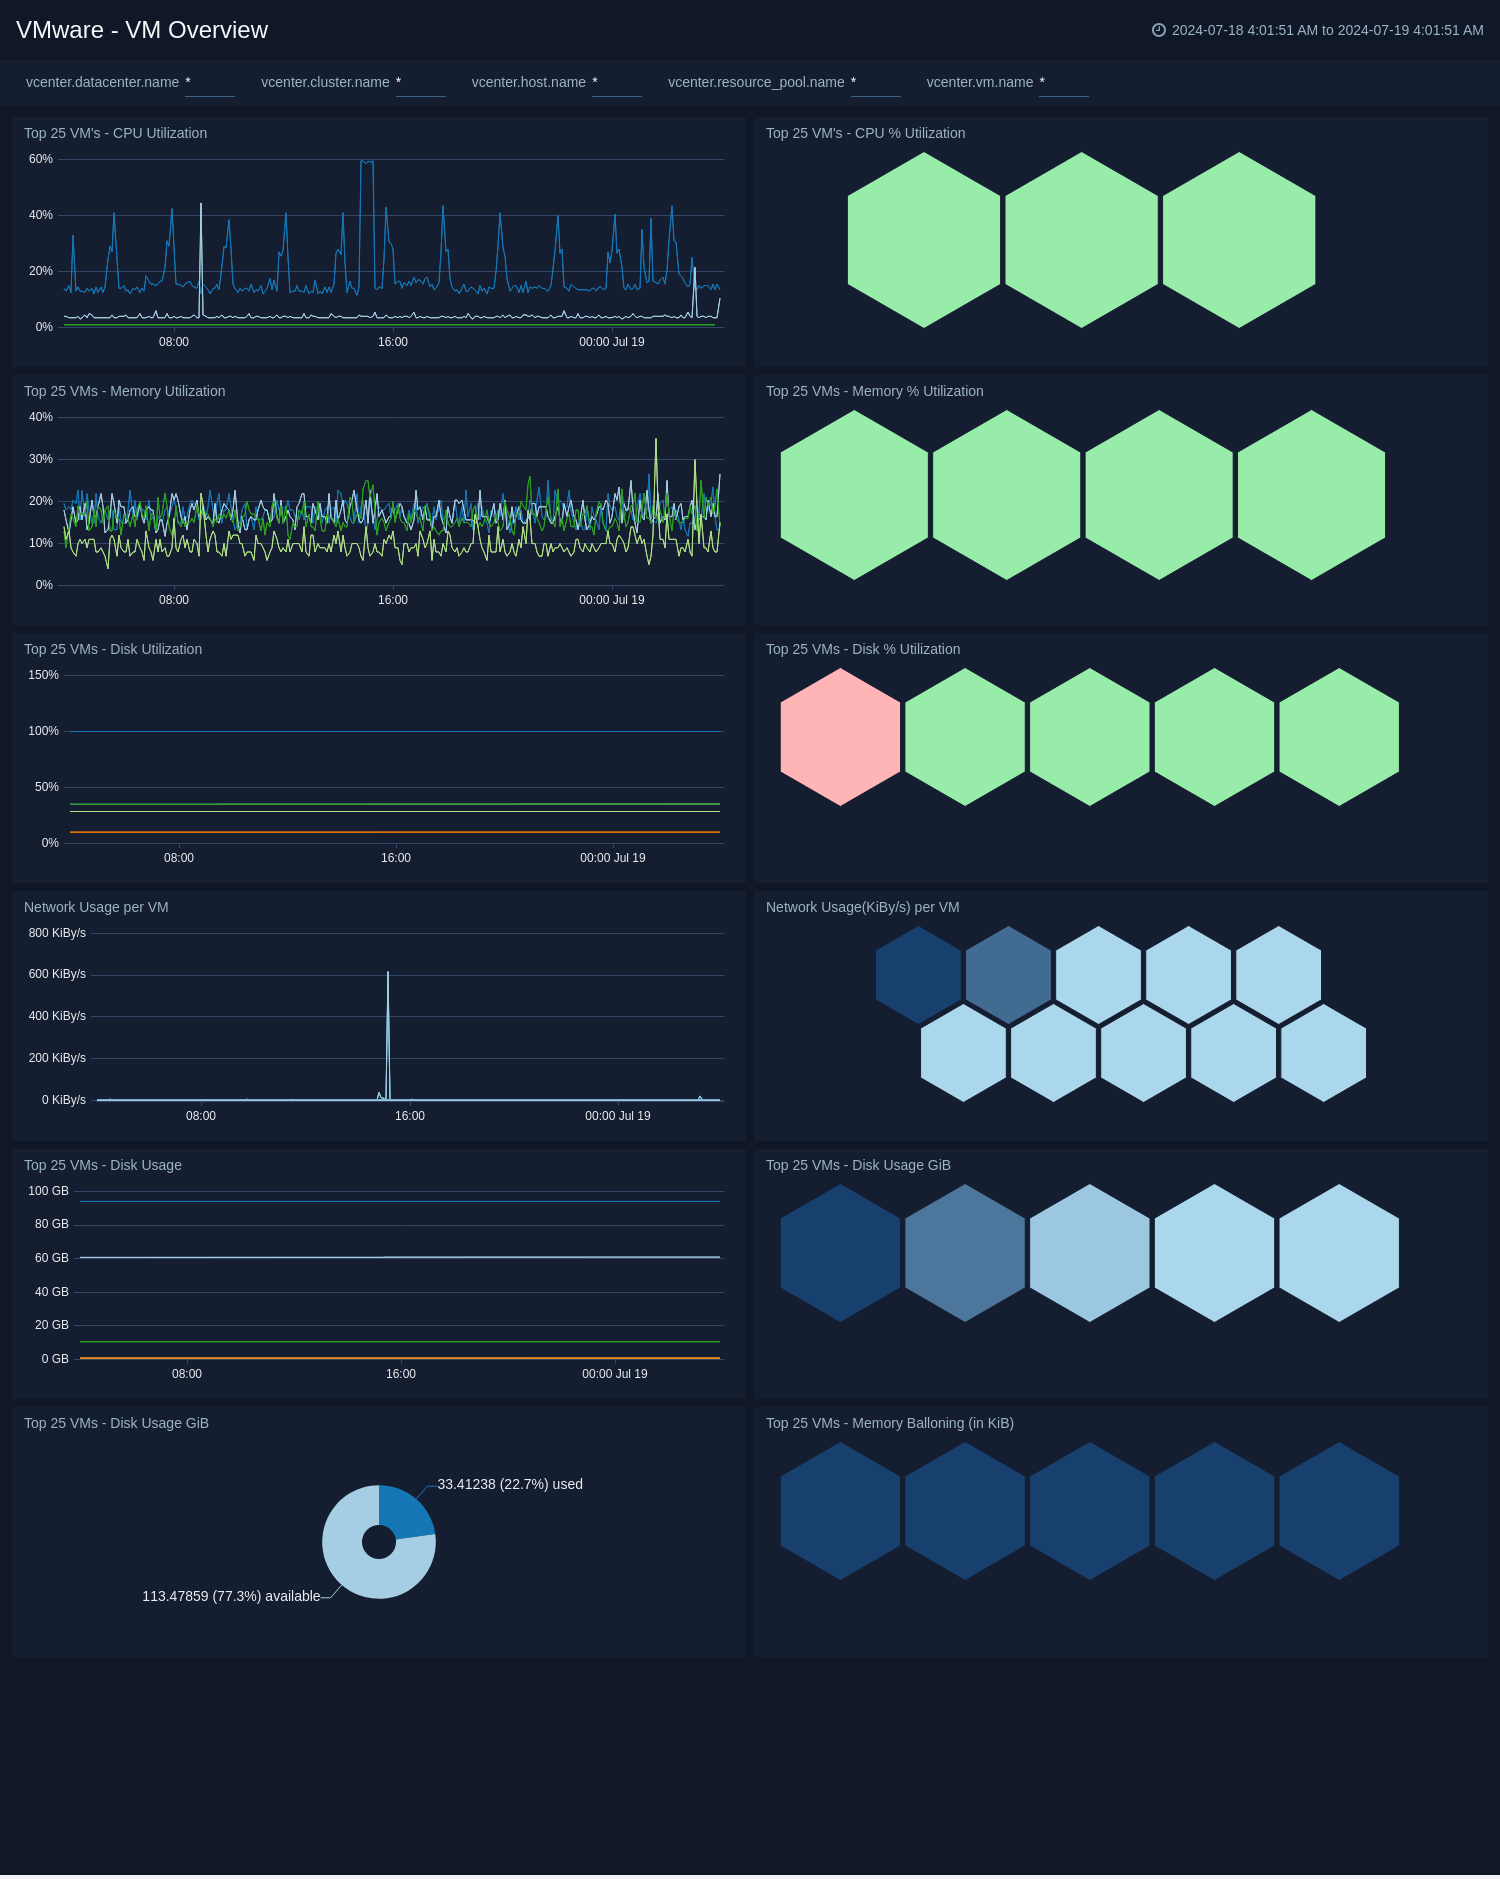 - **Top 25 VMs CPU Utilization**. Top 25 VMs CPU utilization.
- **Top 25 VMs Memory Utilization**. Top 25 VMs Memory utilization.
- **Top 25 VMs Disk Utilization**. Top 25 VMs Disk utilization.
- **Top 25 VMs Network Usage**. Top 25 VMs Network usage.
- **Top 25 VMs Disk Usage**. Top 25 VMs Disk usage.
- **Top 25 VMs Memory Ballooning**. Top 25 VMs Memory Ballooning.
- **VM CPU Time**. CPU time spent in idle, ready or wait state in %.
### VMWare - VM Details
The **VMWare - VM Details** dashboard provides a detailed analysis of VM metrics like CPU Usage, Memory Usage, Read/Write Latency, Network Packet Rate, and Memory Swapped.
- **Top 25 VMs CPU Utilization**. Top 25 VMs CPU utilization.
- **Top 25 VMs Memory Utilization**. Top 25 VMs Memory utilization.
- **Top 25 VMs Disk Utilization**. Top 25 VMs Disk utilization.
- **Top 25 VMs Network Usage**. Top 25 VMs Network usage.
- **Top 25 VMs Disk Usage**. Top 25 VMs Disk usage.
- **Top 25 VMs Memory Ballooning**. Top 25 VMs Memory Ballooning.
- **VM CPU Time**. CPU time spent in idle, ready or wait state in %.
### VMWare - VM Details
The **VMWare - VM Details** dashboard provides a detailed analysis of VM metrics like CPU Usage, Memory Usage, Read/Write Latency, Network Packet Rate, and Memory Swapped.
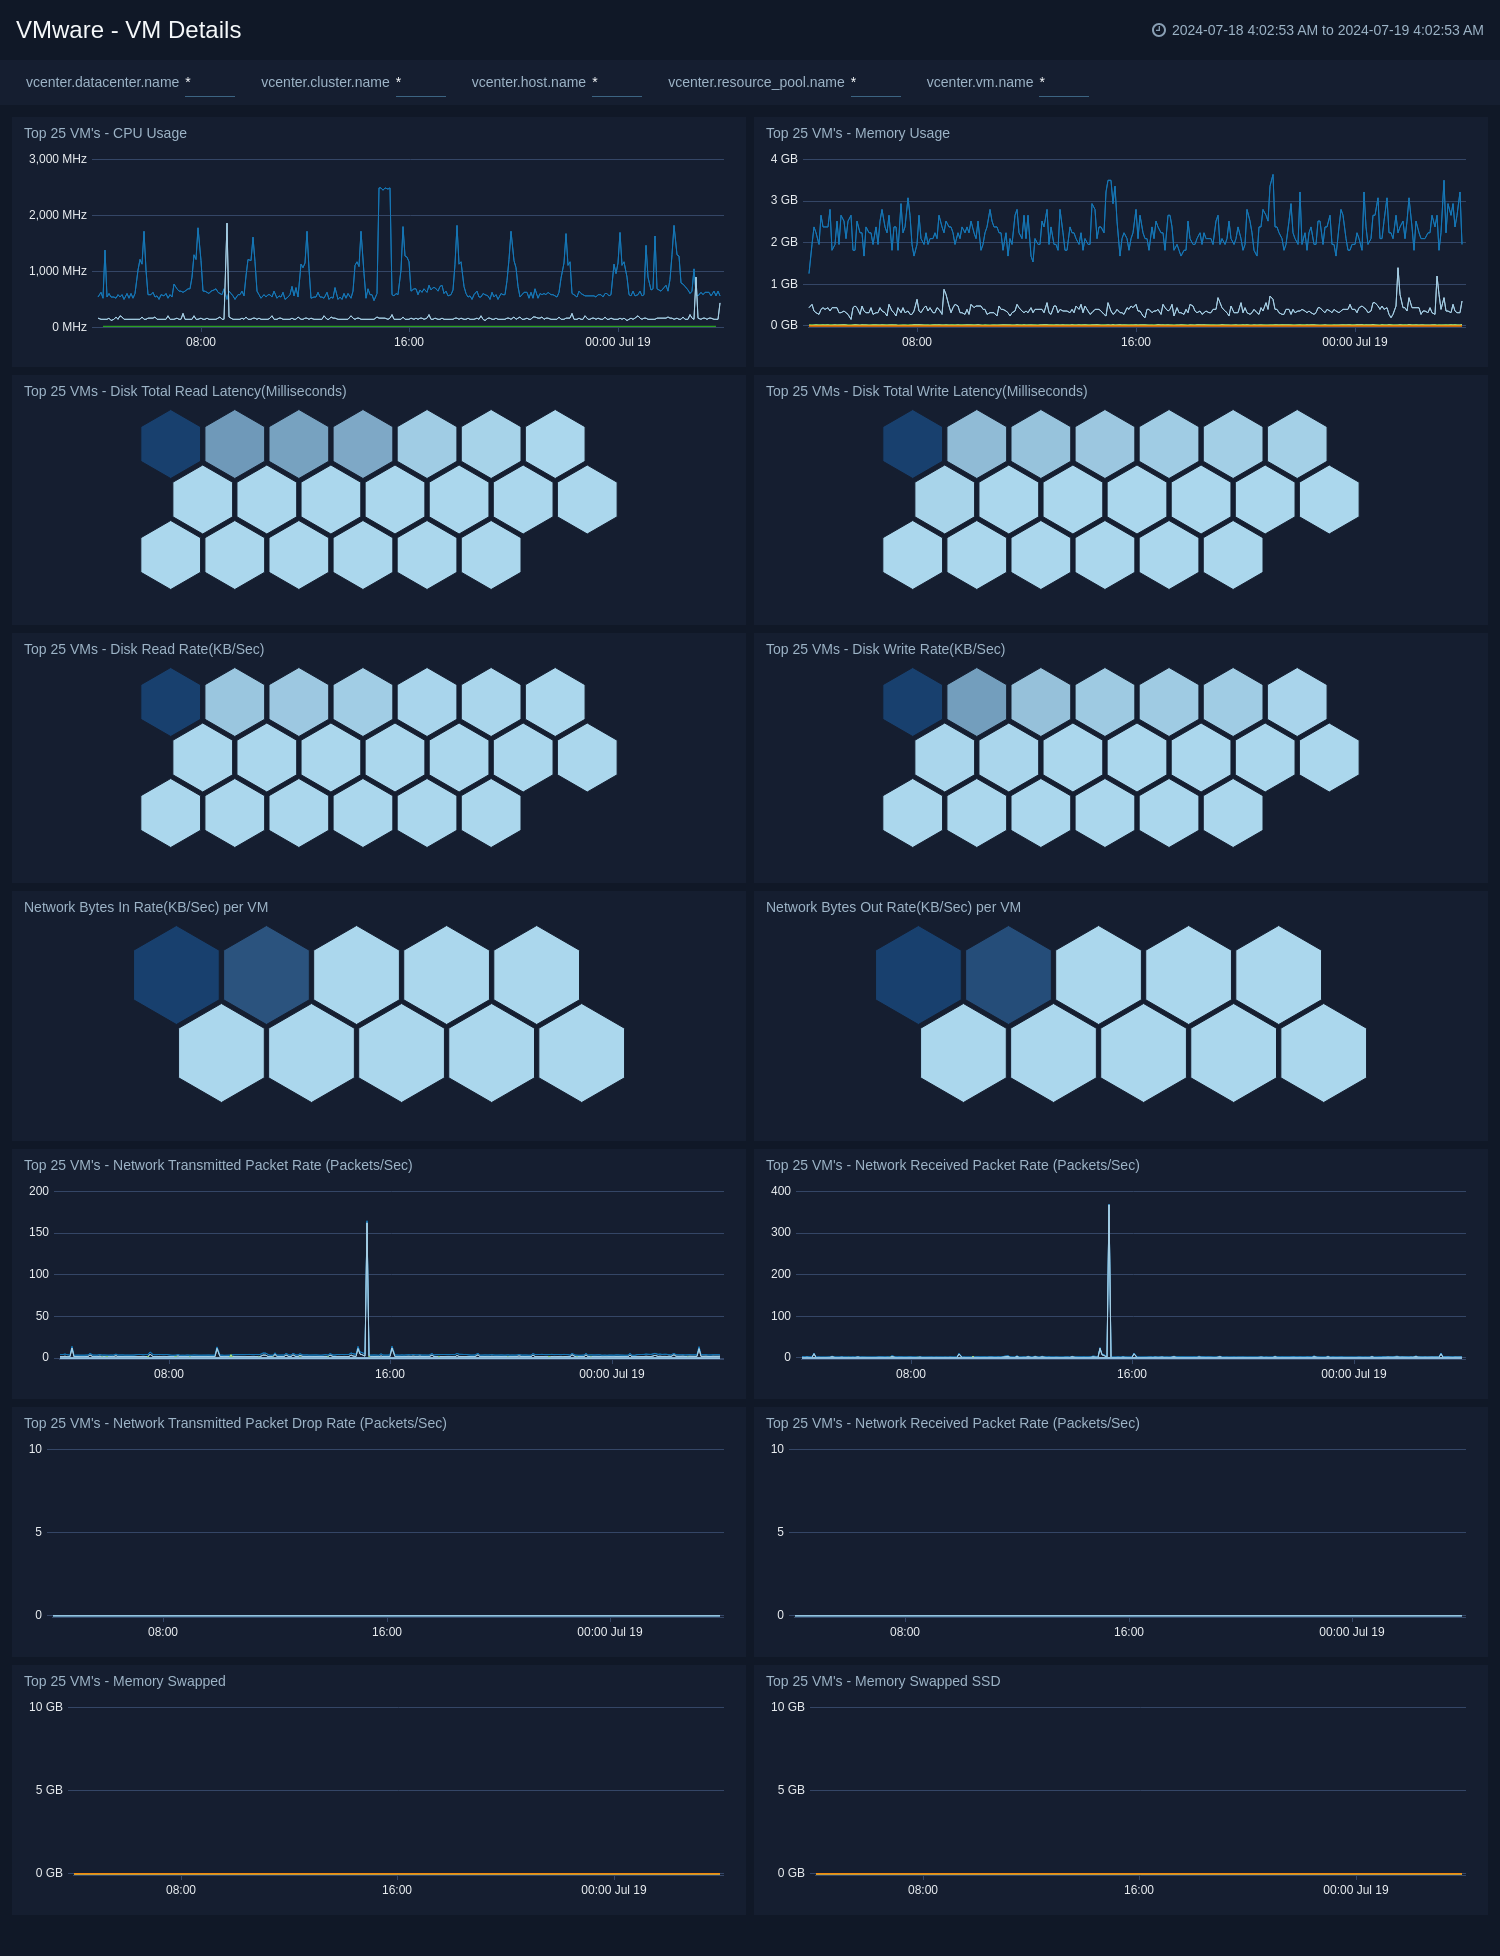 - **Top 25 VMs CPU Usage**. Top 25 VMs CPU usage.
- **Top 25 VMs Memory Usage**. Top 25 VMs Memory usage.
- **Top 25 VMs Disk Read/ Write Latency**. Top 25 VMs Disk read/write latency.
- **Top 25 VMs Disk Read/ Write Rate**. Top 25 VMs Disk read/write rate.
- **Top 25 VMs Network Throughput**. Top 25 VMs Network throughput.
- **Top 25 VMs Network Packet Rate**. Top 25 VMs Network transmitted/received packet rate.
- **Top 25 VMs Network Packet Drop Rate**. Top 25 VMs Network transmitted/received packet drop rate.
- **Top 25 VMs Memory Swapped**. Top 25 VMs Memory swapped.
- **VM Memory Granted**. The amount of memory that is granted to a VM.
## Create monitors for VMWare app
import CreateMonitors from '../../../reuse/apps/create-monitors.md';
### VMWare alerts
| Name | Description | Alert Condition | Recover Condition |
|:--|:--|:--|:--|
| `VMware - Datastore High Utilization` | This alert is triggered when datastore usage is approaching capacity. | Count `>=` 90 | Count `<` 90 |
| `VMware - High Virtual Disk Read Latency` | This alert gets triggered on high virtual datastore read latency indicating storage performance issues. | Count `>=` 20 | Count `<` 20 |
| `VMware - High Virtual Disk Write Latency` | This alert gets triggered on high virtual datastore write latency indicating storage performance issues. | Count `>=` 20 | Count `<` 20 |
| `VMware - Host CPU High Utilization` | This alert is triggered when host CPU utilization is consistently high, which may impact VM performance. | Count `>=` 90 | Count `<` 90 |
| `VMware - Host Memory Utilization` | This alert is triggered when host memory utilization is consistently high. | Count `>=` 95 | Count `<` 95 |
| `VMware - VM CPU Ready Time High` | This alert gets triggered when VMs are waiting too long for CPU resources, indicating CPU contention. | Count `>=` 10 | Count `<` 10 |
| `VMware - VM Memory Balloon Pressure` | This alert gets triggered when VMs are experiencing significant memory ballooning. | Count `>=` 1024 | Count `<` 1024 |
- **Top 25 VMs CPU Usage**. Top 25 VMs CPU usage.
- **Top 25 VMs Memory Usage**. Top 25 VMs Memory usage.
- **Top 25 VMs Disk Read/ Write Latency**. Top 25 VMs Disk read/write latency.
- **Top 25 VMs Disk Read/ Write Rate**. Top 25 VMs Disk read/write rate.
- **Top 25 VMs Network Throughput**. Top 25 VMs Network throughput.
- **Top 25 VMs Network Packet Rate**. Top 25 VMs Network transmitted/received packet rate.
- **Top 25 VMs Network Packet Drop Rate**. Top 25 VMs Network transmitted/received packet drop rate.
- **Top 25 VMs Memory Swapped**. Top 25 VMs Memory swapped.
- **VM Memory Granted**. The amount of memory that is granted to a VM.
## Create monitors for VMWare app
import CreateMonitors from '../../../reuse/apps/create-monitors.md';
### VMWare alerts
| Name | Description | Alert Condition | Recover Condition |
|:--|:--|:--|:--|
| `VMware - Datastore High Utilization` | This alert is triggered when datastore usage is approaching capacity. | Count `>=` 90 | Count `<` 90 |
| `VMware - High Virtual Disk Read Latency` | This alert gets triggered on high virtual datastore read latency indicating storage performance issues. | Count `>=` 20 | Count `<` 20 |
| `VMware - High Virtual Disk Write Latency` | This alert gets triggered on high virtual datastore write latency indicating storage performance issues. | Count `>=` 20 | Count `<` 20 |
| `VMware - Host CPU High Utilization` | This alert is triggered when host CPU utilization is consistently high, which may impact VM performance. | Count `>=` 90 | Count `<` 90 |
| `VMware - Host Memory Utilization` | This alert is triggered when host memory utilization is consistently high. | Count `>=` 95 | Count `<` 95 |
| `VMware - VM CPU Ready Time High` | This alert gets triggered when VMs are waiting too long for CPU resources, indicating CPU contention. | Count `>=` 10 | Count `<` 10 |
| `VMware - VM Memory Balloon Pressure` | This alert gets triggered when VMs are experiencing significant memory ballooning. | Count `>=` 1024 | Count `<` 1024 |