---
id: cassandra-opentelemetry
title: Cassandra - OpenTelemetry Collector
sidebar_label: Cassandra - OTel Collector
description: Learn about the Sumo Logic OpenTelemetry app for Cassandra.
slug: /help/docs/integrations/databases/opentelemetry/cassandra-opentelemetry/
canonical: https://www.sumologic.com/help/docs/integrations/databases/opentelemetry/cassandra-opentelemetry/
---
import useBaseUrl from '@docusaurus/useBaseUrl';
import Tabs from '@theme/Tabs';
import TabItem from '@theme/TabItem';
})
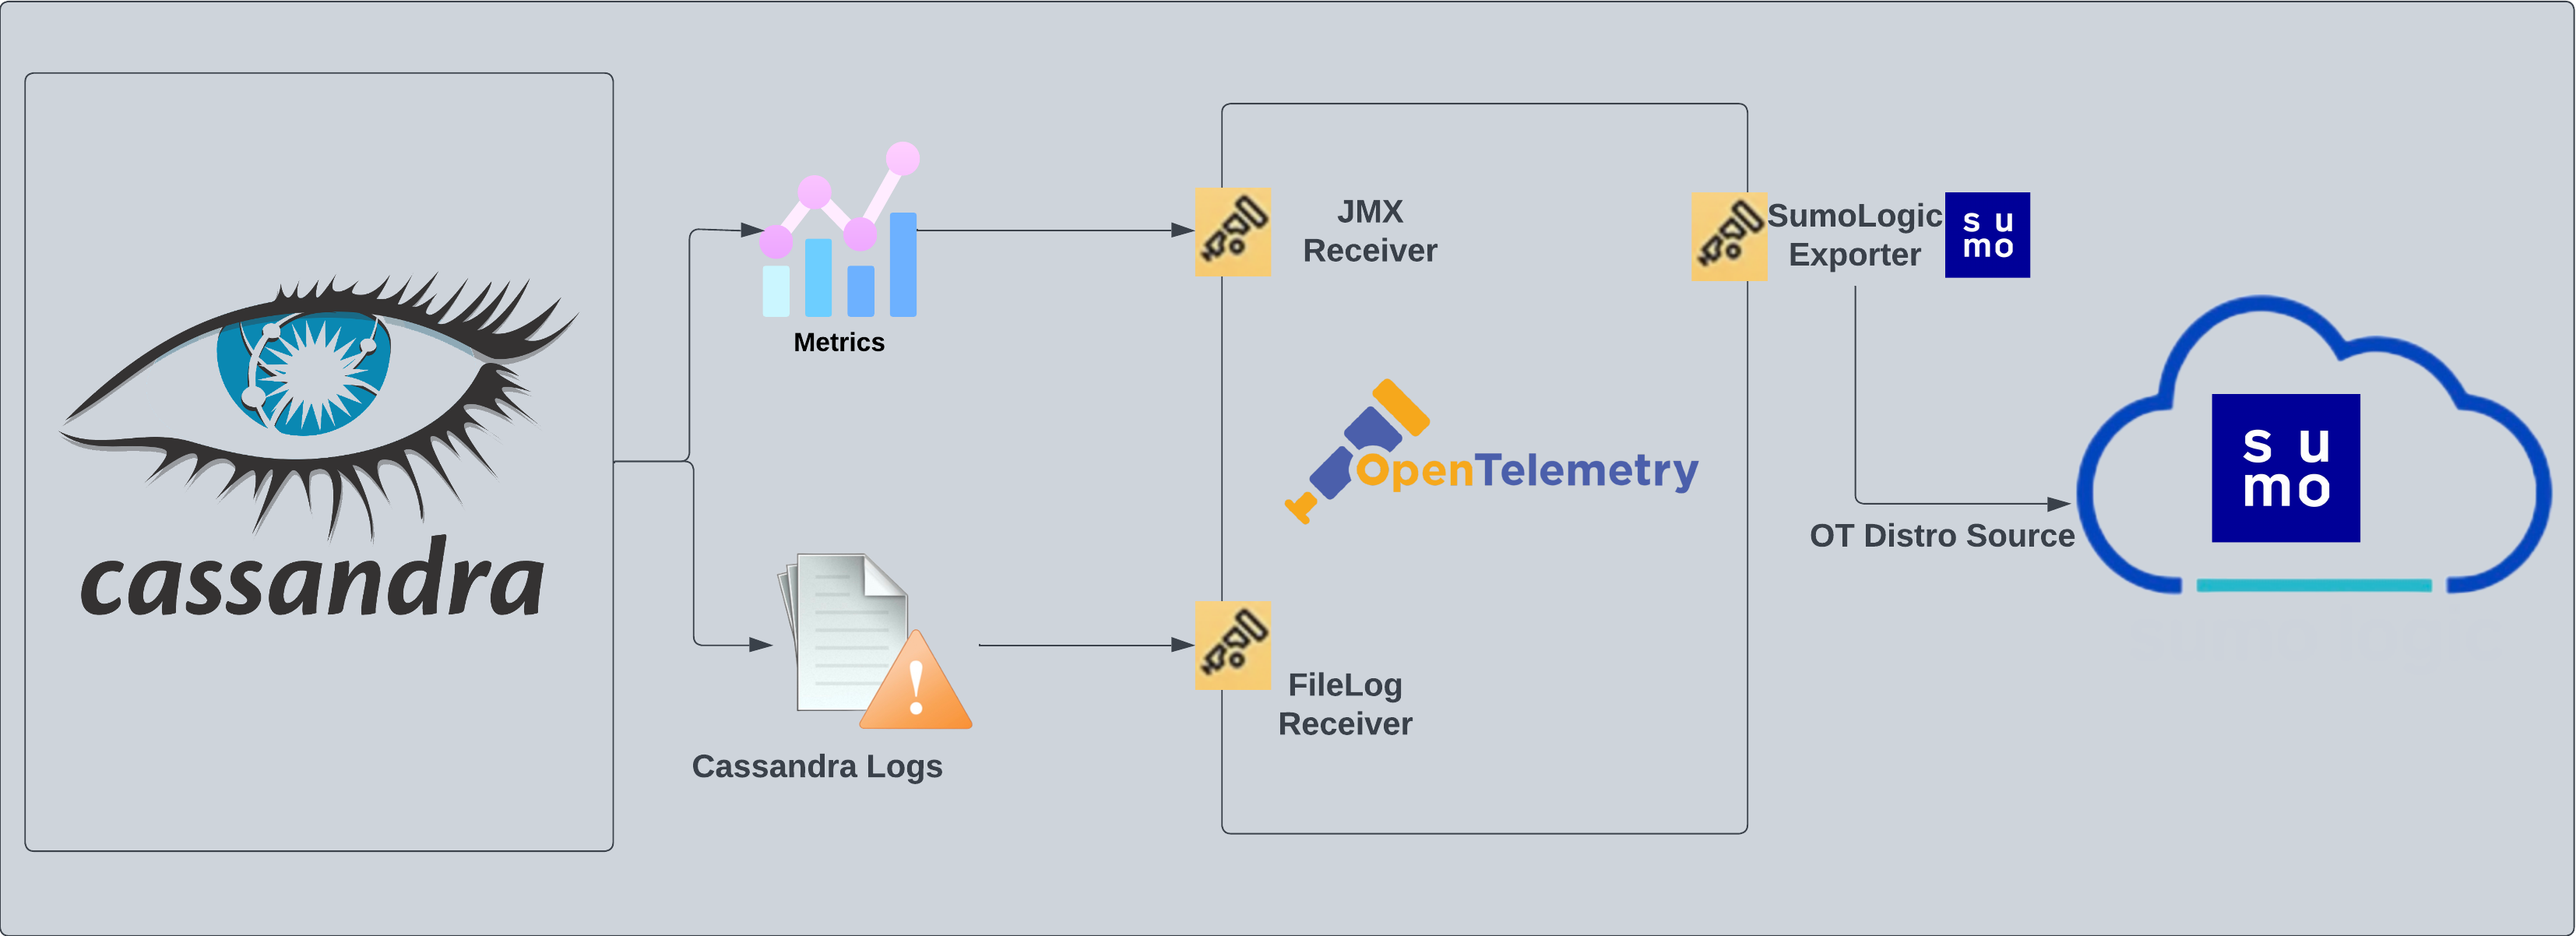
}) The [Cassandra](https://cassandra.apache.org/_/cassandra-basics.html) app is a log and metrics-based app that helps you monitor the availability, performance, health, and resource utilization of your Cassandra clusters. The pre-configured dashboards provide insight into resource utilization, cache/Gossip/Memtable statistics, error and warnings, request served and latency, storage, and compaction.
Cassandra logs are sent to Sumo Logic through OpenTelemetry [filelog receiver](https://github.com/open-telemetry/opentelemetry-collector-contrib/tree/main/receiver/filelogreceiver) and cassandra metrics are sent to Sumo Logic using [JMX opentelemetry receiver](https://github.com/open-telemetry/opentelemetry-collector-contrib/tree/main/receiver/jmxreceiver) with the `target_system` set as [`cassandra`](https://github.com/open-telemetry/opentelemetry-java-contrib/blob/main/jmx-metrics/docs/target-systems/cassandra.md).
The app supports logs from the open-source version of Cassandra. The app is tested on the 4.0.0 version of Cassandra.
The [Cassandra](https://cassandra.apache.org/_/cassandra-basics.html) app is a log and metrics-based app that helps you monitor the availability, performance, health, and resource utilization of your Cassandra clusters. The pre-configured dashboards provide insight into resource utilization, cache/Gossip/Memtable statistics, error and warnings, request served and latency, storage, and compaction.
Cassandra logs are sent to Sumo Logic through OpenTelemetry [filelog receiver](https://github.com/open-telemetry/opentelemetry-collector-contrib/tree/main/receiver/filelogreceiver) and cassandra metrics are sent to Sumo Logic using [JMX opentelemetry receiver](https://github.com/open-telemetry/opentelemetry-collector-contrib/tree/main/receiver/jmxreceiver) with the `target_system` set as [`cassandra`](https://github.com/open-telemetry/opentelemetry-java-contrib/blob/main/jmx-metrics/docs/target-systems/cassandra.md).
The app supports logs from the open-source version of Cassandra. The app is tested on the 4.0.0 version of Cassandra.
 :::info
This app includes [built-in monitors](#cassandra-alerts). For details on creating custom monitors, refer to the [Create monitors for Cassandra app](#create-monitors-for-cassandra-app).
:::
## Fields creation in Sumo Logic for Cassandra
Following are the [Fields](/docs/manage/fields/) which will be created as part of Cassandra App install if not already present:
- `deployment.environment`. User configured. Through this Cassandra cluster is identified by the environment where it resides. For example: dev, prod, or qa.
- `db.cluster.name`. User configured. Enter a name to identify this Cassandra cluster. This cluster name will be shown in the Sumo Logic dashboards.
- `db.system`. Has fixed value of **cassandra**.
- `db.node.name`. Holds the value of the Fully Qualified Domain Name (FQDN) of the machine from which the OpenTelemetry collector is collecting logs and metrics.
- `sumo.datasource`. Has fixed value of **cassandra**.
## Prerequisites
#### For metric collection
JMX receiver collects Cassandra metrics from Cassandra server as part of the OpenTelemetry Collector (OTC).
1. Follow the instructions in [JMX - OpenTelemetry's prerequisites section](/docs/integrations/app-development/opentelemetry/jmx-opentelemetry/#prerequisites) to download the [JMX Metric Gatherer](https://github.com/open-telemetry/opentelemetry-java-contrib/blob/main/jmx-metrics/README.md). This gatherer is used by the [JMX Receiver](https://github.com/open-telemetry/opentelemetry-collector-contrib/tree/main/receiver/jmxreceiver#details).
2. Set the JMX port as part of `JAVA_OPTS` for Tomcat startup. Usually, it is set in the `/etc/systemd/system/cassandra.service` or `C:\Program Files\apache-tomcat\bin\tomcat.bat` file.
```json
JAVA_OPTS="$JAVA_OPTS -Dcom.sun.management.jmxremote -Dcom.sun.management.jmxremote.port=11099 -Dcom.sun.management.jmxremote.authenticate=true -Dcom.sun.management.jmxremote.ssl=false -Dcom.sun.management.jmxremote.password.file=${CASSANDRA_CONF_DIR}/jmx.password -Dcom.sun.management.jmxremote.access.file=${CASSANDRA_CONF_DIR}/jmx.access"
```
#### For log collection
Cassandra has three main logs: `system.log`, `debug.log`, and `gc.log`, which hold general logging messages, debugging logging messages, and java garbage collection logs respectively.
These logs by default live in `${CASSANDRA_HOME}/logs`, but most Linux distributions relocate logs to `/var/log/cassandra`. Operators can tune this location as well as what levels are logged using the provided logback.xml file. For more details on Cassandra logs, see [this](https://cassandra.apache.org/doc/latest/troubleshooting/reading_logs.html).
import LogsCollectionPrereqisites from '../../../reuse/apps/logs-collection-prereqisites.md';
## Collection configuration and app installation
import ConfigAppInstall from '../../../reuse/apps/opentelemetry/config-app-install.md';
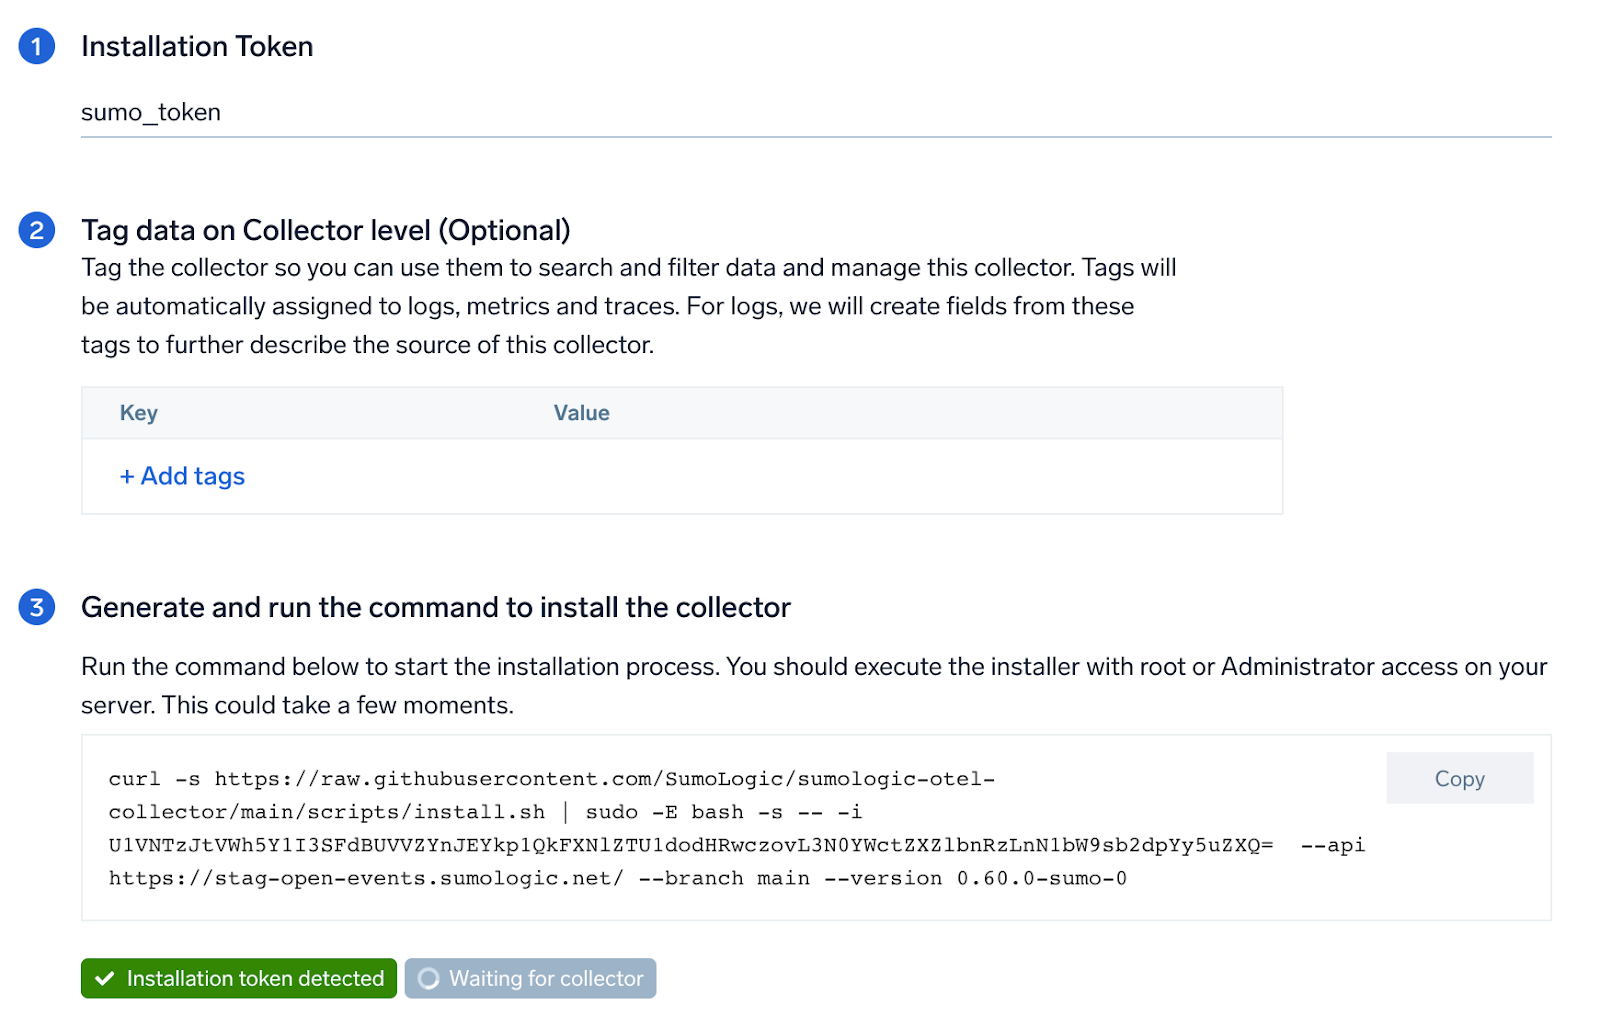
### Step 1: Set up Collector
import SetupColl from '../../../reuse/apps/opentelemetry/set-up-collector.md';
:::info
This app includes [built-in monitors](#cassandra-alerts). For details on creating custom monitors, refer to the [Create monitors for Cassandra app](#create-monitors-for-cassandra-app).
:::
## Fields creation in Sumo Logic for Cassandra
Following are the [Fields](/docs/manage/fields/) which will be created as part of Cassandra App install if not already present:
- `deployment.environment`. User configured. Through this Cassandra cluster is identified by the environment where it resides. For example: dev, prod, or qa.
- `db.cluster.name`. User configured. Enter a name to identify this Cassandra cluster. This cluster name will be shown in the Sumo Logic dashboards.
- `db.system`. Has fixed value of **cassandra**.
- `db.node.name`. Holds the value of the Fully Qualified Domain Name (FQDN) of the machine from which the OpenTelemetry collector is collecting logs and metrics.
- `sumo.datasource`. Has fixed value of **cassandra**.
## Prerequisites
#### For metric collection
JMX receiver collects Cassandra metrics from Cassandra server as part of the OpenTelemetry Collector (OTC).
1. Follow the instructions in [JMX - OpenTelemetry's prerequisites section](/docs/integrations/app-development/opentelemetry/jmx-opentelemetry/#prerequisites) to download the [JMX Metric Gatherer](https://github.com/open-telemetry/opentelemetry-java-contrib/blob/main/jmx-metrics/README.md). This gatherer is used by the [JMX Receiver](https://github.com/open-telemetry/opentelemetry-collector-contrib/tree/main/receiver/jmxreceiver#details).
2. Set the JMX port as part of `JAVA_OPTS` for Tomcat startup. Usually, it is set in the `/etc/systemd/system/cassandra.service` or `C:\Program Files\apache-tomcat\bin\tomcat.bat` file.
```json
JAVA_OPTS="$JAVA_OPTS -Dcom.sun.management.jmxremote -Dcom.sun.management.jmxremote.port=11099 -Dcom.sun.management.jmxremote.authenticate=true -Dcom.sun.management.jmxremote.ssl=false -Dcom.sun.management.jmxremote.password.file=${CASSANDRA_CONF_DIR}/jmx.password -Dcom.sun.management.jmxremote.access.file=${CASSANDRA_CONF_DIR}/jmx.access"
```
#### For log collection
Cassandra has three main logs: `system.log`, `debug.log`, and `gc.log`, which hold general logging messages, debugging logging messages, and java garbage collection logs respectively.
These logs by default live in `${CASSANDRA_HOME}/logs`, but most Linux distributions relocate logs to `/var/log/cassandra`. Operators can tune this location as well as what levels are logged using the provided logback.xml file. For more details on Cassandra logs, see [this](https://cassandra.apache.org/doc/latest/troubleshooting/reading_logs.html).
import LogsCollectionPrereqisites from '../../../reuse/apps/logs-collection-prereqisites.md';
## Collection configuration and app installation
import ConfigAppInstall from '../../../reuse/apps/opentelemetry/config-app-install.md';
### Step 1: Set up Collector
import SetupColl from '../../../reuse/apps/opentelemetry/set-up-collector.md';
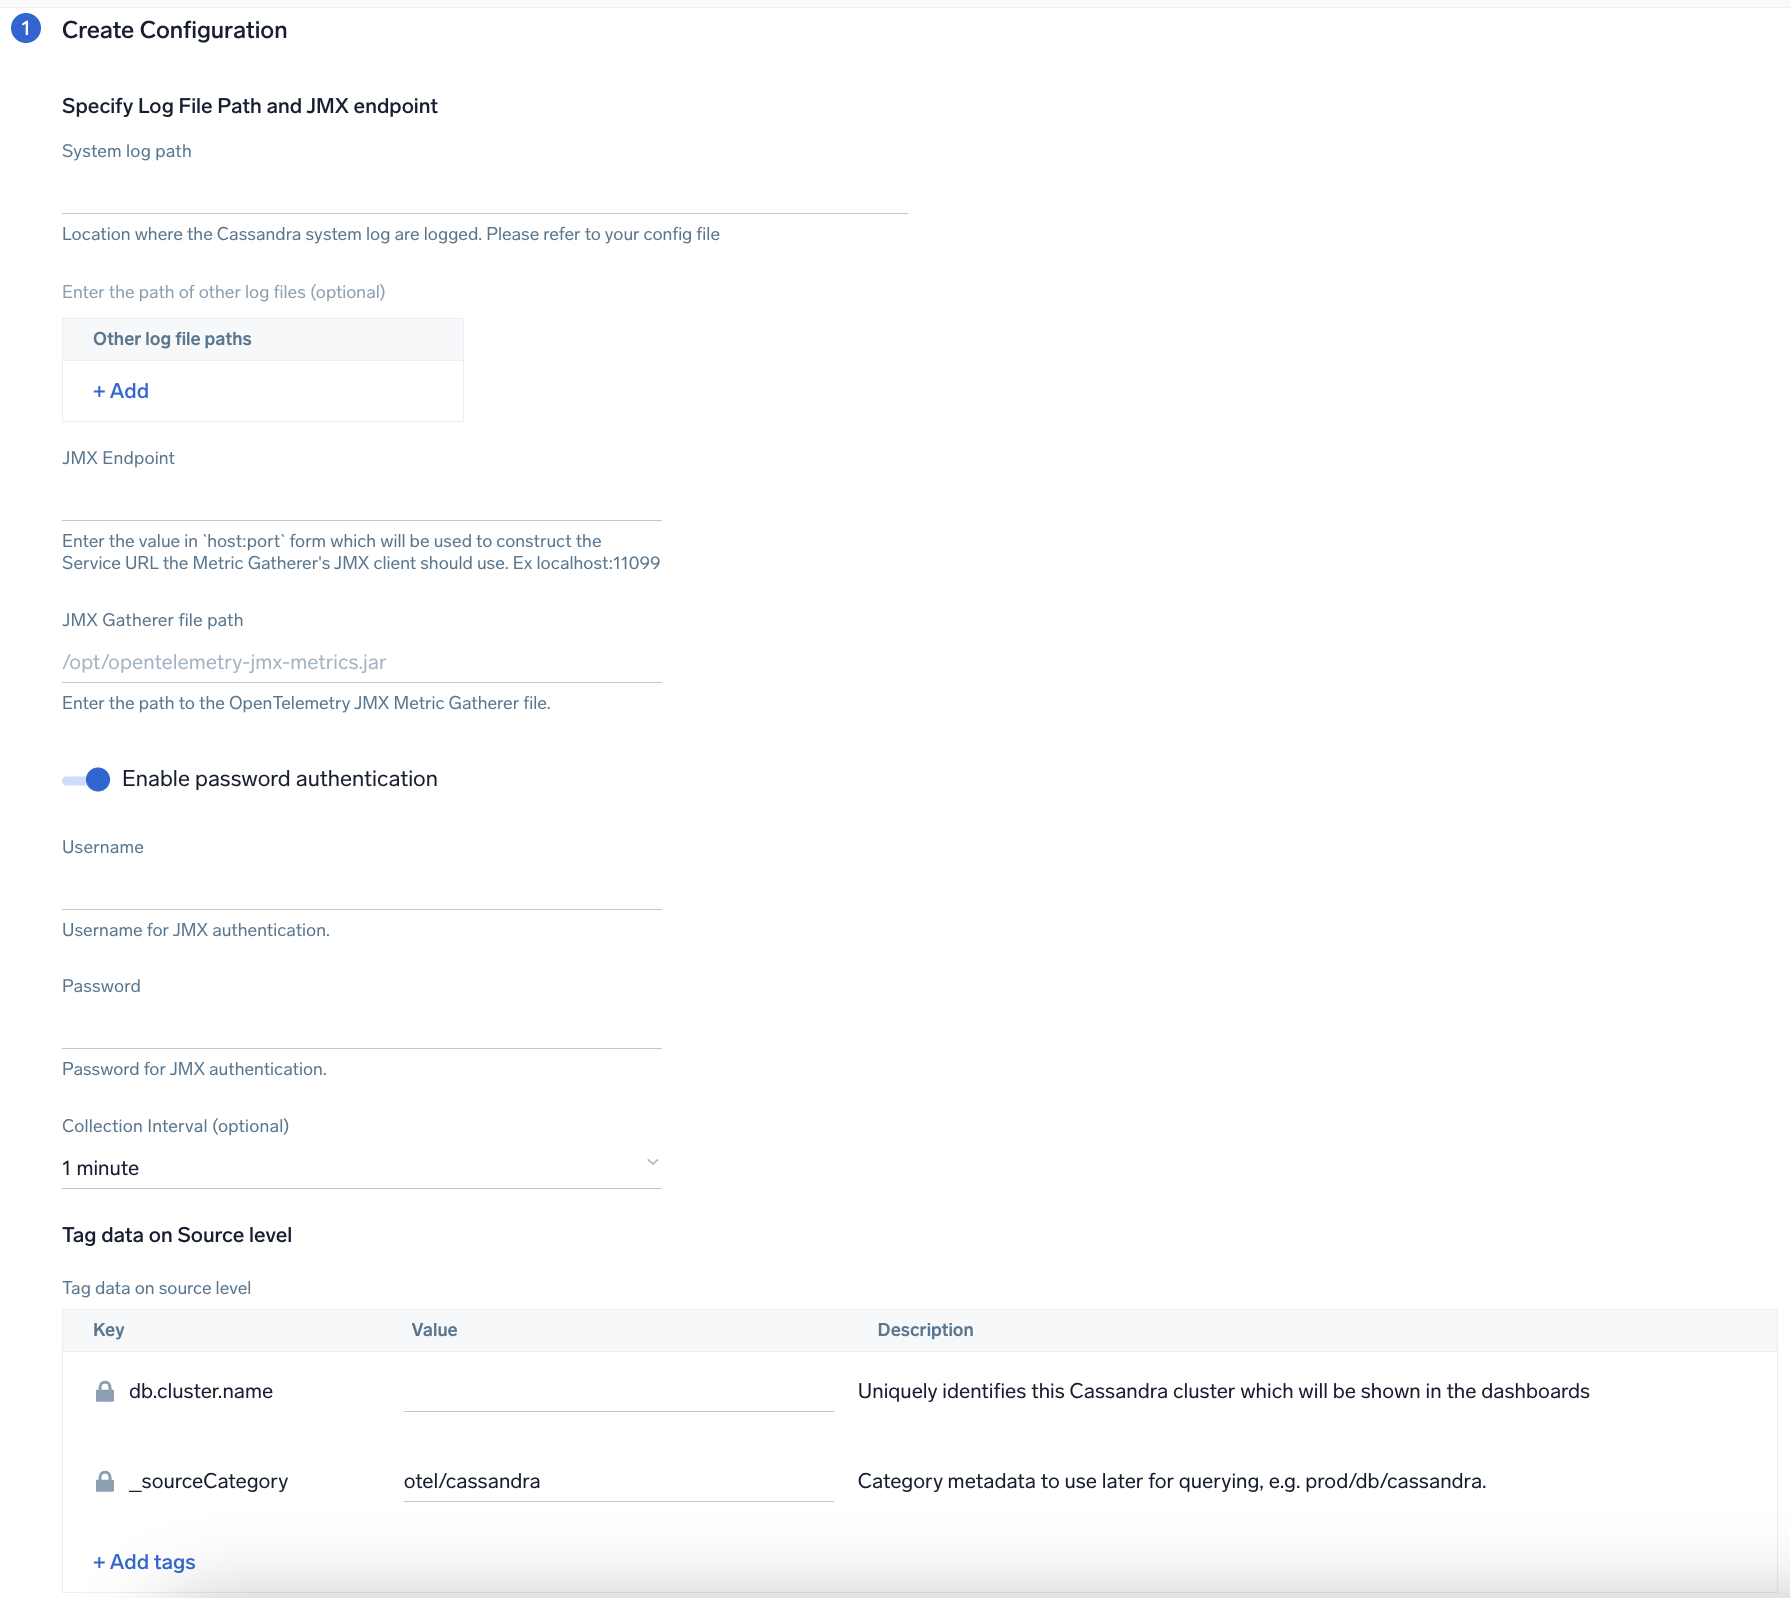
 ### Step 2: Configure integration
In this step, you will configure the yaml required for Cassandra Collection. Path of the log file configured to capture Cassandra logs needs to be given here.
Below are the inputs required:
- The path to system.log is required here. This file is typically located in `/var/log/cassandra`. If you're using a customized path, check the respective conf file for this information.
- For metrics, you're required to provide the JMX endpoint (default is `localhost:7199`) along with the `collection_interval` (default is 1 minute).
You can add any custom fields which you want to be tagged with the data ingested in Sumo. Click on the **Download YAML File** button to get the yaml file.
import CollectorVersionNote from '../../../reuse/apps/opentelemetry/collector-version-note.md';
import EnvVarOpt from '../../../reuse/apps/opentelemetry/env-var-optional.md';
### Step 2: Configure integration
In this step, you will configure the yaml required for Cassandra Collection. Path of the log file configured to capture Cassandra logs needs to be given here.
Below are the inputs required:
- The path to system.log is required here. This file is typically located in `/var/log/cassandra`. If you're using a customized path, check the respective conf file for this information.
- For metrics, you're required to provide the JMX endpoint (default is `localhost:7199`) along with the `collection_interval` (default is 1 minute).
You can add any custom fields which you want to be tagged with the data ingested in Sumo. Click on the **Download YAML File** button to get the yaml file.
import CollectorVersionNote from '../../../reuse/apps/opentelemetry/collector-version-note.md';
import EnvVarOpt from '../../../reuse/apps/opentelemetry/env-var-optional.md';
 ### Step 3: Send logs to Sumo Logic
import LogsIntro from '../../../reuse/apps/opentelemetry/send-logs-intro.md';
1. Copy the yaml to `/etc/otelcol-sumo/conf.d/` folder for the Cassandra instance which needs to be monitored.
2. Restart the collector using:
```sh
sudo systemctl restart otelcol-sumo
```
import ChefNoEnv from '../../../reuse/apps/opentelemetry/chef-without-env.md';
import AnsibleNoEnv from '../../../reuse/apps/opentelemetry/ansible-without-env.md';
import PuppetNoEnv from '../../../reuse/apps/opentelemetry/puppet-without-env.md';
import LogsOutro from '../../../reuse/apps/opentelemetry/send-logs-outro.md';
## Sample log message
```sql
INFO [ScheduledTasks:1] 2023-01-08 09:18:47,347 StatusLogger.java:101 - system.schema_aggregates
```
## Sample metrics message
```json
{
"queryId": "A",
"_source": "cassandra-otel",
"_metricId": "dasIFS6RvCVxEcsljWGpnQ",
"_sourceName": "Http Input",
"host.id": "i-071ade75d03650657",
"host.group": "cassandraHostGrp",
"telemetry.sdk.version": "1.38.0",
"os.type": "linux",
"sumo.datasource": "cassandra",
"db.system": "cassandra",
"db.node.name": "ip-54-163-607-30.ec2.internal",
"_sourceCategory": "Labs/cassandra-otel",
"deployment.environment": "dev",
"_contentType": "Carbon2",
"host.name": "ip-54-163-607-30.ec2.internal",
"metric": "cassandra.client.request.write.latency.50p",
"_collectorId": "000000000FB3B451",
"_sourceId": "000000005A60F624",
"unit": "us",
"db.cluster.name": "cassandra_cluster",
"telemetry.sdk.language": "java",
"telemetry.sdk.name": "opentelemetry",
"service.name": "unknown_service:java",
"_collector": "Labs - cassandra-otel",
"max": 229,
"min": 0,
"avg": 131.25,
"sum": 525,
"latest": 67,
"count": 4
}
```
## Sample log query
Following is a query from the Cassandra app's **Cassandra - Overview** dashboard Nodes Up panel:
```sumo
%"sumo.datasource"=cassandra %"deployment.environment"=* %"db.cluster.name"=* "INFO" | json "log" as _rawlog nodrop
| if (isEmpty(_rawlog), _raw, _rawlog) as _raw
| parse regex field=_raw "(?[A-Z]*) *\[(?[^\]]*?)[:_-]?(?[0-9]*)\] (?.{10} .{12}) *(?[^:]*):(?[0-9]*) - (?.*)"
| if (message matches "InetAddress * is now UP",1,0) as UP
| timeslice 1d
| sum(UP) as UP by _timeslice
| sort by _timeslice asc
```
## Sample metrics query
Following is the query from Cassandra App's overview Dashboard's Number of Requests Panel:
```sql
sumo.datasource=cassandra deployment.environment=* db.cluster.name=* db.node.name=* metric=cassandra.client.request.count | sum
```
## Viewing Cassandra dashboards
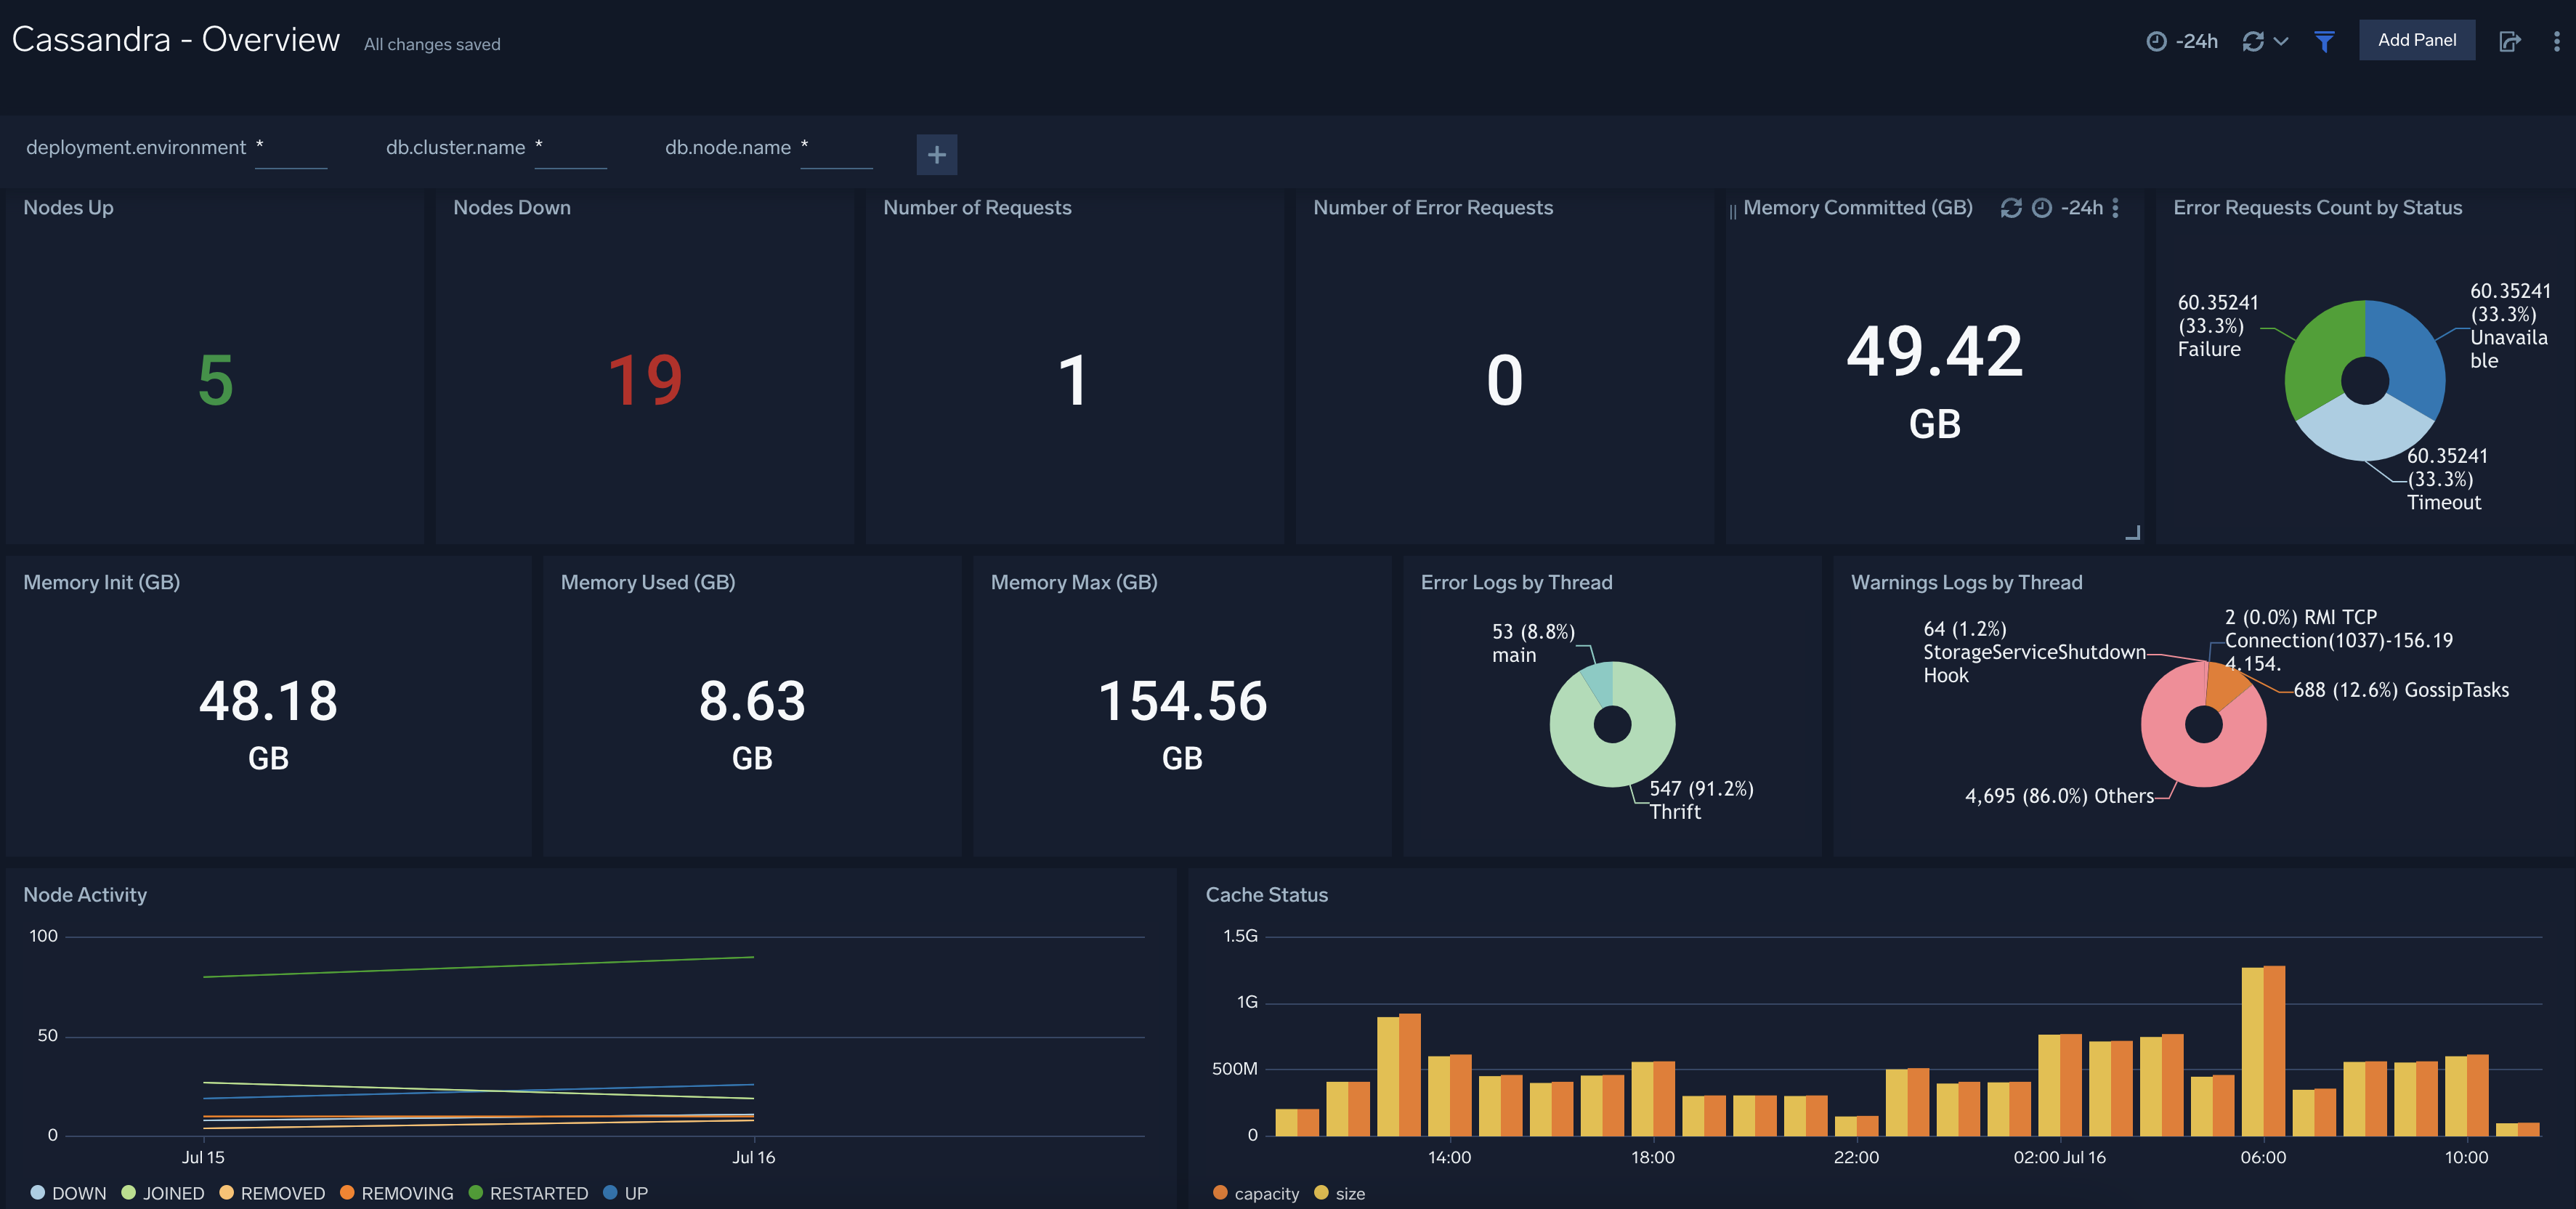
### Overview
The **Cassandra - Overview** dashboard provides an at-a-glance view of Cassandra backend and frontend HTTP error codes percentage, visitor location, URLs, and clients causing errors.
Use this dashboard to:
- Identify number of nodes which are up and down.
- Gain insights into Memory - Init, used, Max, and committed.
- Gain insights into the error and warning logs by thread and Node activity.
### Step 3: Send logs to Sumo Logic
import LogsIntro from '../../../reuse/apps/opentelemetry/send-logs-intro.md';
1. Copy the yaml to `/etc/otelcol-sumo/conf.d/` folder for the Cassandra instance which needs to be monitored.
2. Restart the collector using:
```sh
sudo systemctl restart otelcol-sumo
```
import ChefNoEnv from '../../../reuse/apps/opentelemetry/chef-without-env.md';
import AnsibleNoEnv from '../../../reuse/apps/opentelemetry/ansible-without-env.md';
import PuppetNoEnv from '../../../reuse/apps/opentelemetry/puppet-without-env.md';
import LogsOutro from '../../../reuse/apps/opentelemetry/send-logs-outro.md';
## Sample log message
```sql
INFO [ScheduledTasks:1] 2023-01-08 09:18:47,347 StatusLogger.java:101 - system.schema_aggregates
```
## Sample metrics message
```json
{
"queryId": "A",
"_source": "cassandra-otel",
"_metricId": "dasIFS6RvCVxEcsljWGpnQ",
"_sourceName": "Http Input",
"host.id": "i-071ade75d03650657",
"host.group": "cassandraHostGrp",
"telemetry.sdk.version": "1.38.0",
"os.type": "linux",
"sumo.datasource": "cassandra",
"db.system": "cassandra",
"db.node.name": "ip-54-163-607-30.ec2.internal",
"_sourceCategory": "Labs/cassandra-otel",
"deployment.environment": "dev",
"_contentType": "Carbon2",
"host.name": "ip-54-163-607-30.ec2.internal",
"metric": "cassandra.client.request.write.latency.50p",
"_collectorId": "000000000FB3B451",
"_sourceId": "000000005A60F624",
"unit": "us",
"db.cluster.name": "cassandra_cluster",
"telemetry.sdk.language": "java",
"telemetry.sdk.name": "opentelemetry",
"service.name": "unknown_service:java",
"_collector": "Labs - cassandra-otel",
"max": 229,
"min": 0,
"avg": 131.25,
"sum": 525,
"latest": 67,
"count": 4
}
```
## Sample log query
Following is a query from the Cassandra app's **Cassandra - Overview** dashboard Nodes Up panel:
```sumo
%"sumo.datasource"=cassandra %"deployment.environment"=* %"db.cluster.name"=* "INFO" | json "log" as _rawlog nodrop
| if (isEmpty(_rawlog), _raw, _rawlog) as _raw
| parse regex field=_raw "(?[A-Z]*) *\[(?[^\]]*?)[:_-]?(?[0-9]*)\] (?.{10} .{12}) *(?[^:]*):(?[0-9]*) - (?.*)"
| if (message matches "InetAddress * is now UP",1,0) as UP
| timeslice 1d
| sum(UP) as UP by _timeslice
| sort by _timeslice asc
```
## Sample metrics query
Following is the query from Cassandra App's overview Dashboard's Number of Requests Panel:
```sql
sumo.datasource=cassandra deployment.environment=* db.cluster.name=* db.node.name=* metric=cassandra.client.request.count | sum
```
## Viewing Cassandra dashboards
### Overview
The **Cassandra - Overview** dashboard provides an at-a-glance view of Cassandra backend and frontend HTTP error codes percentage, visitor location, URLs, and clients causing errors.
Use this dashboard to:
- Identify number of nodes which are up and down.
- Gain insights into Memory - Init, used, Max, and committed.
- Gain insights into the error and warning logs by thread and Node activity.
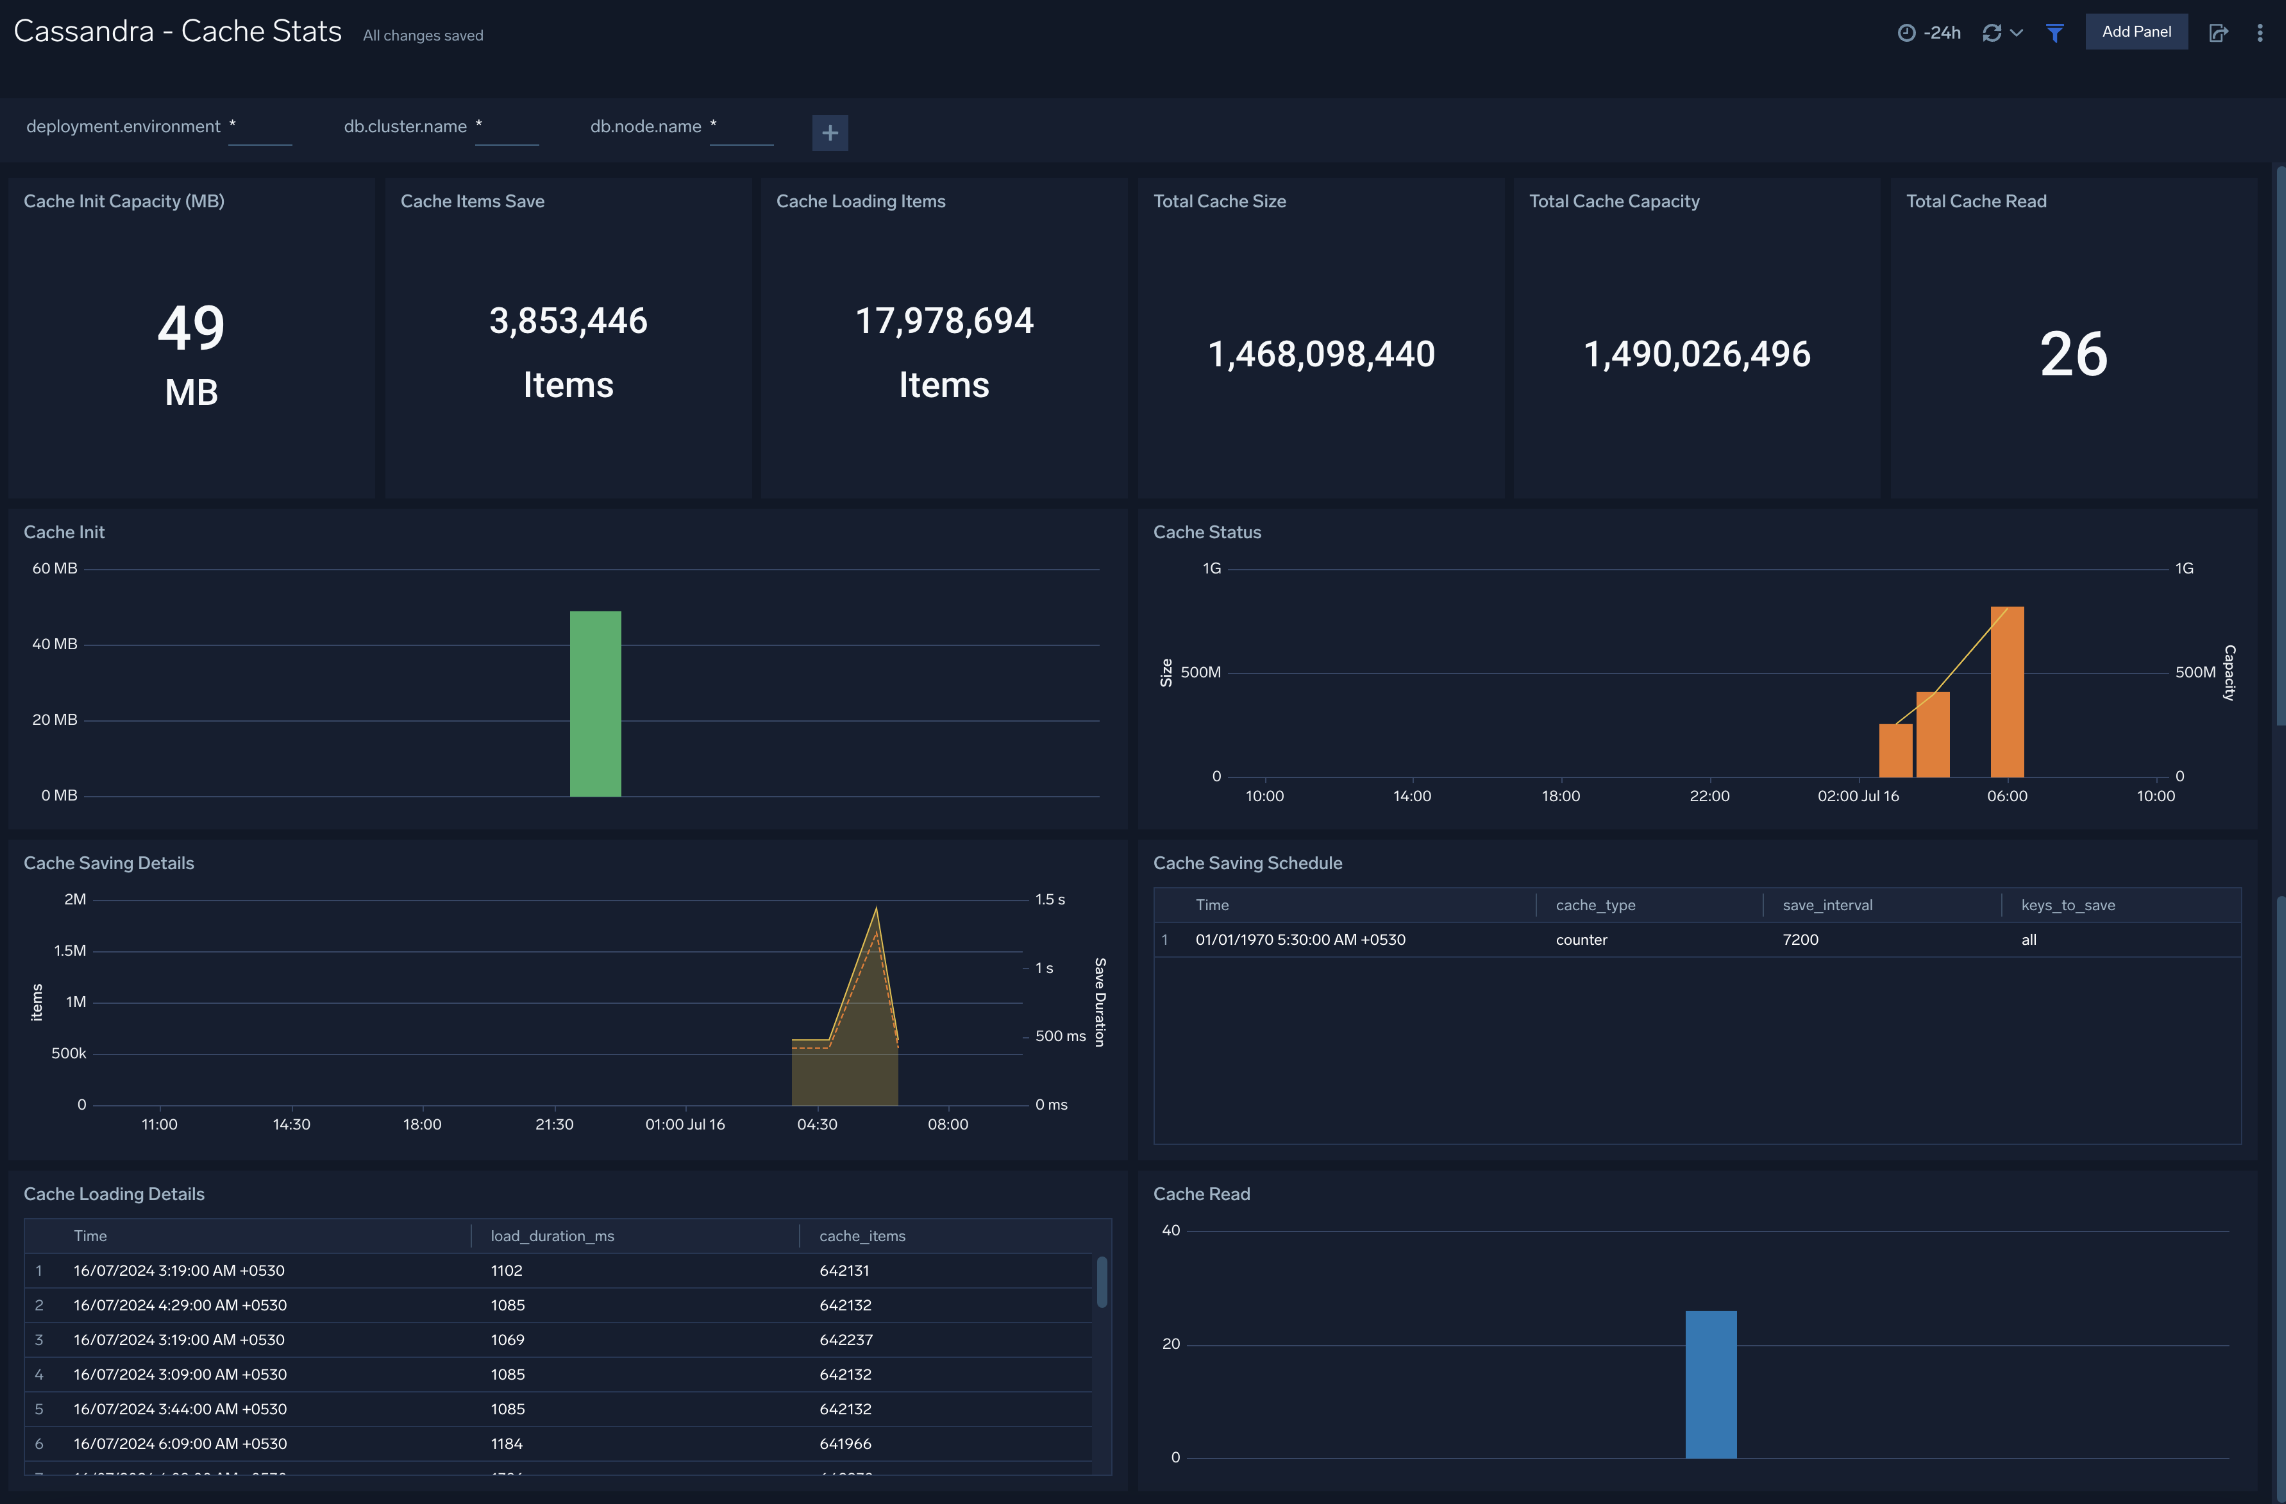
 ### Cache Stats
The **Cassandra - Cache Stats** dashboard provides insight into the database cache status, schedule, and items. Use this dashboard to monitor cache performance and identify cache usage statistics.
### Cache Stats
The **Cassandra - Cache Stats** dashboard provides insight into the database cache status, schedule, and items. Use this dashboard to monitor cache performance and identify cache usage statistics.
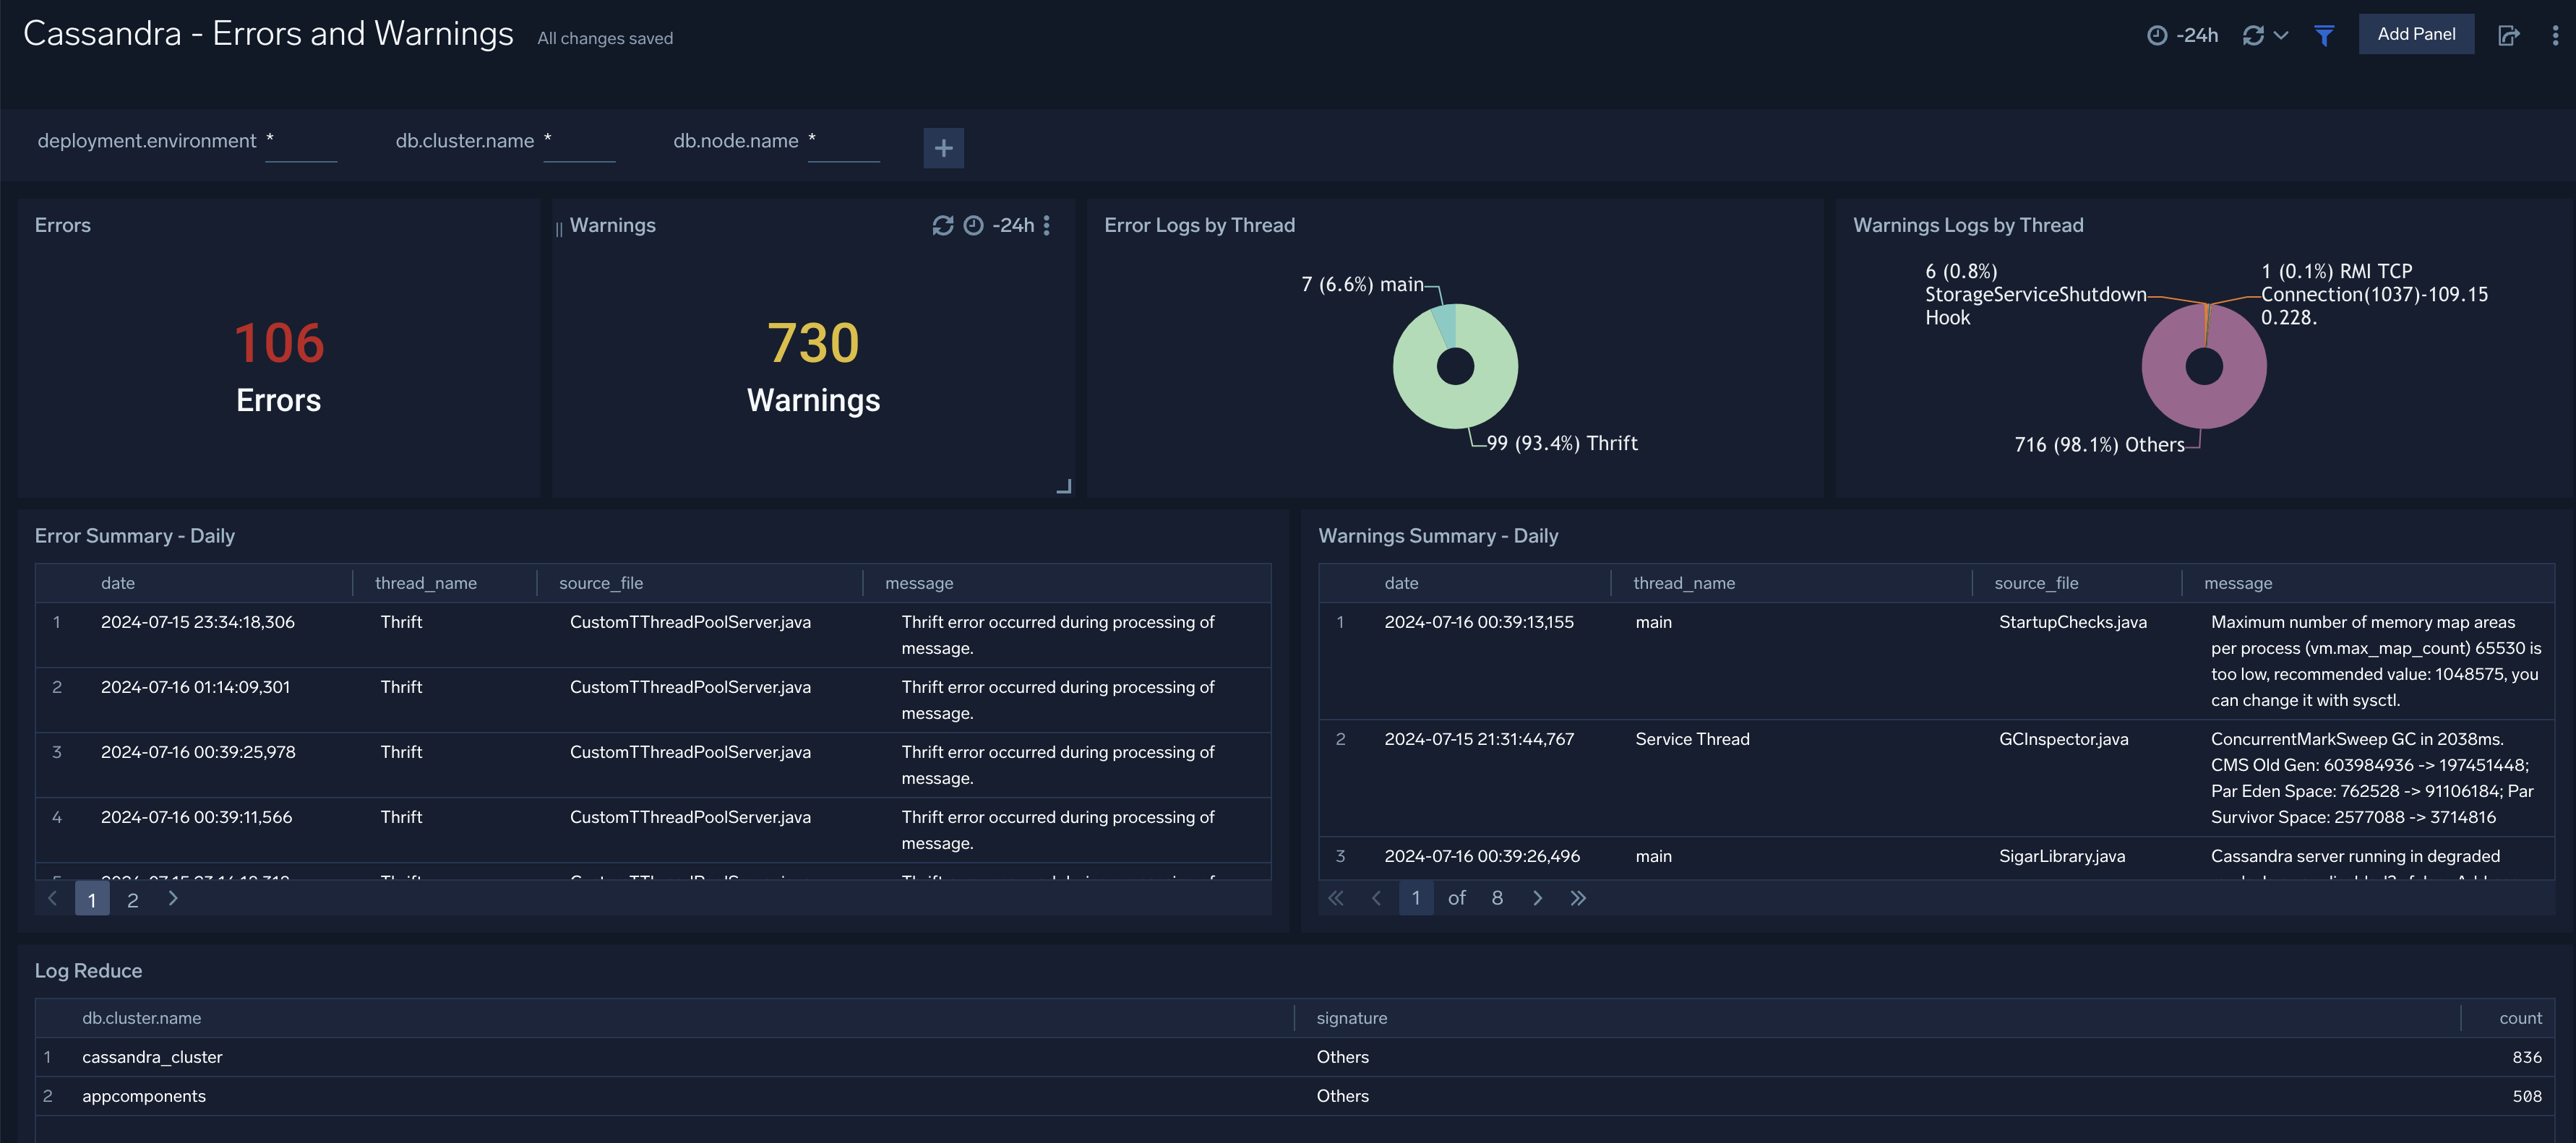
 ### Errors and Warnings
The **Cassandra - Errors and Warnings** dashboard provides details of the database errors and warnings.
Use this dashboard to:
- Review errors and warnings generated by the server.
- Review the Threads errors and warning events.
### Errors and Warnings
The **Cassandra - Errors and Warnings** dashboard provides details of the database errors and warnings.
Use this dashboard to:
- Review errors and warnings generated by the server.
- Review the Threads errors and warning events.
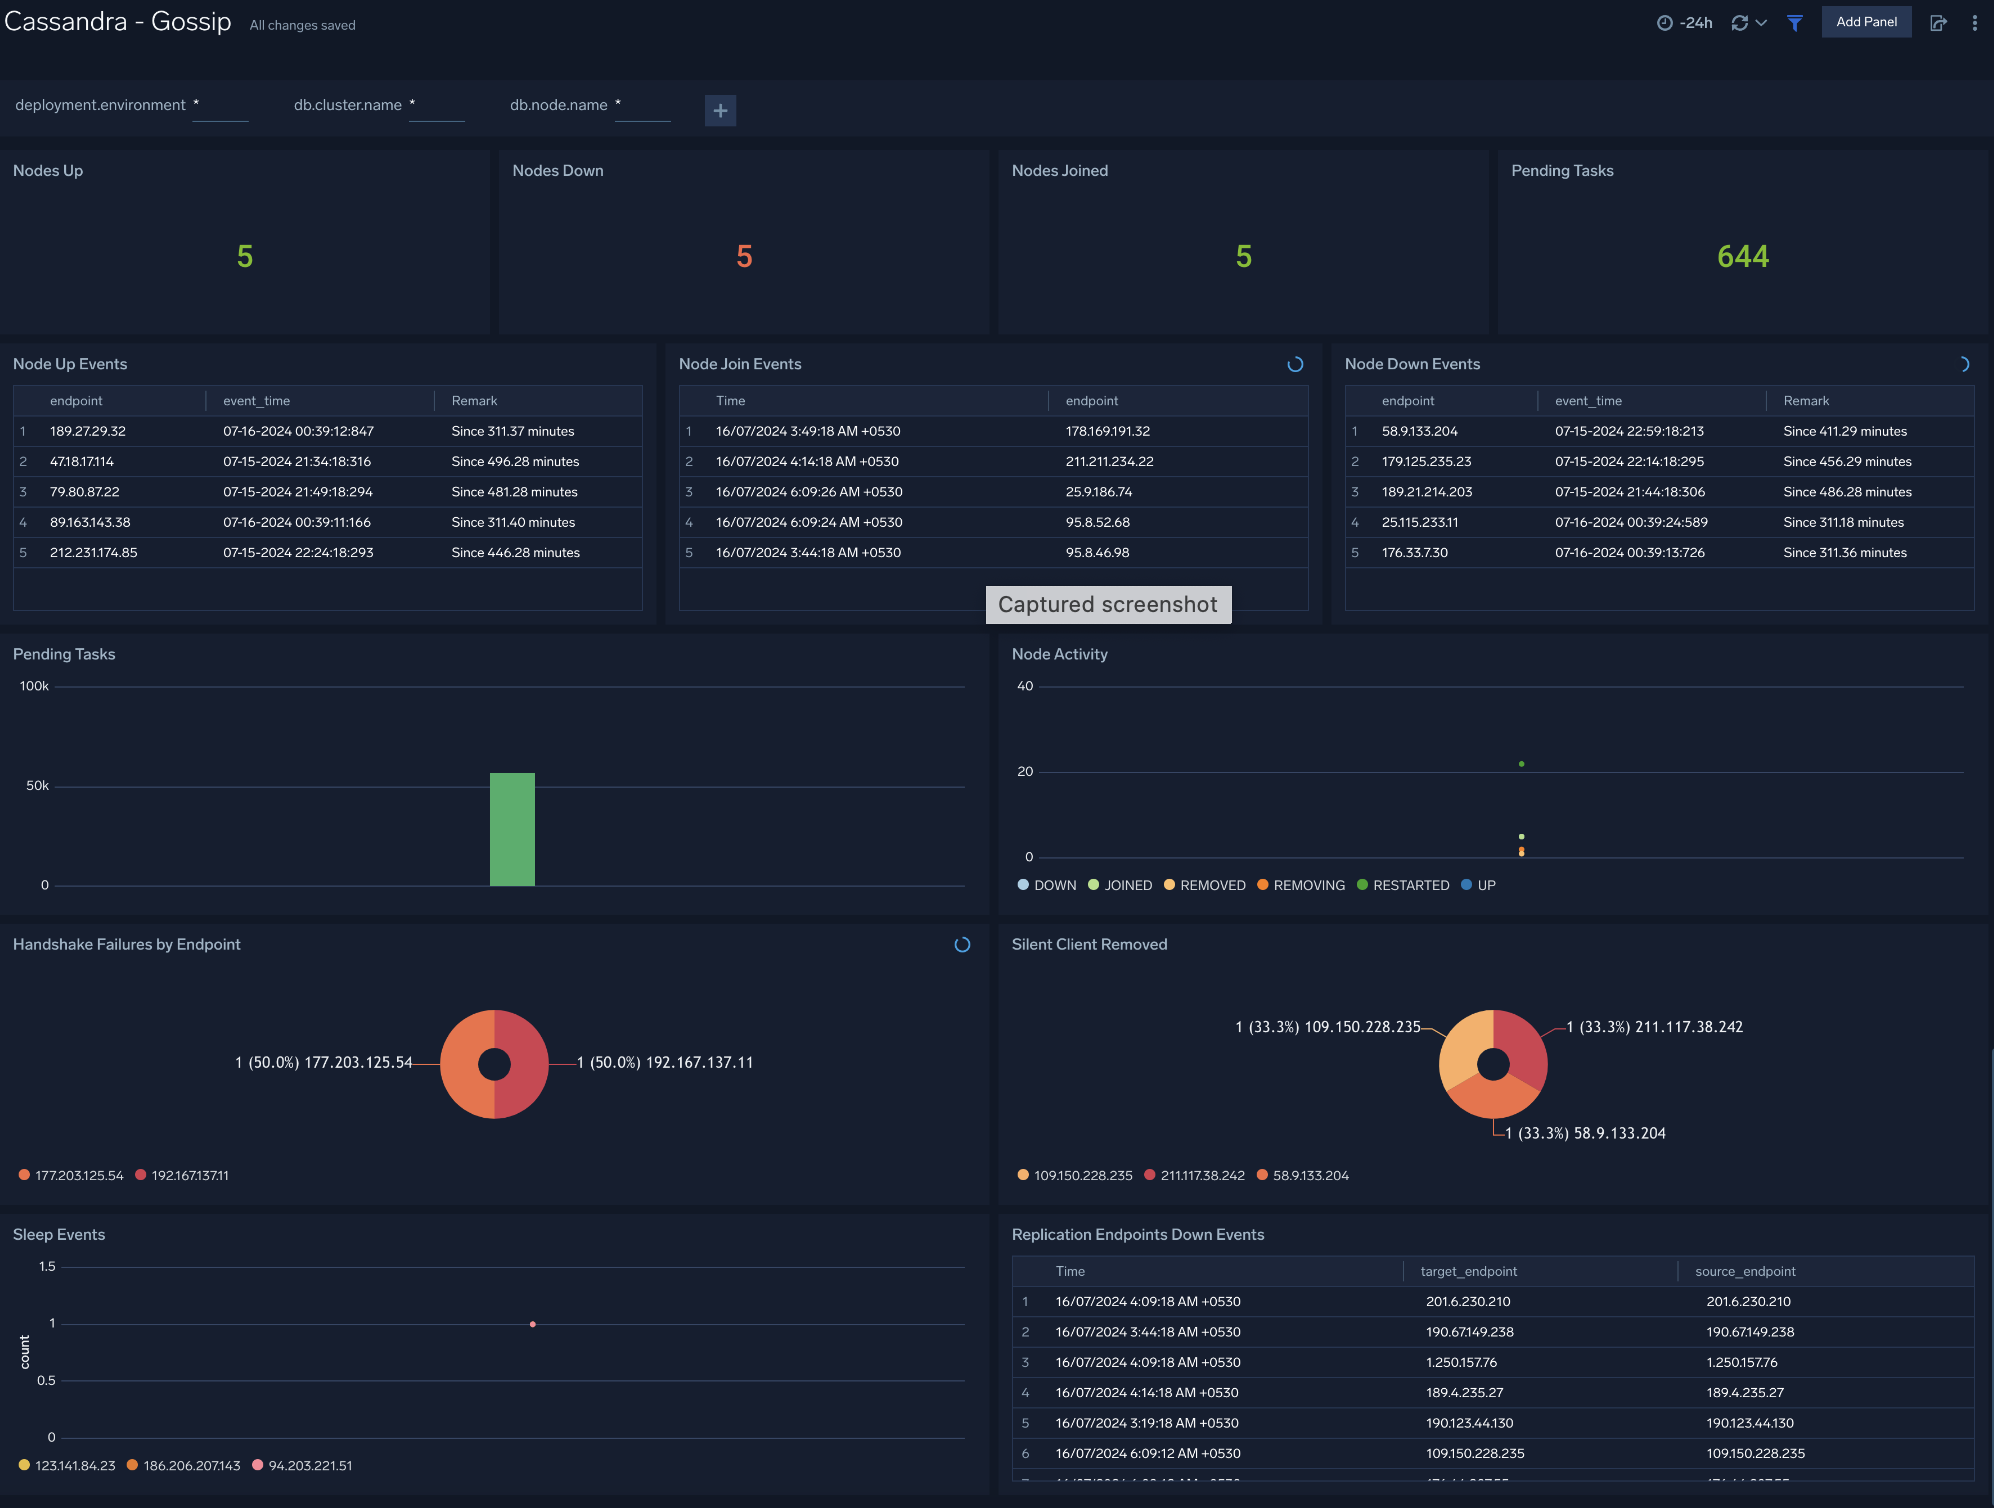
 ### Gossip
The **Cassandra - Gossip** dashboard provides details about communication between various cassandra nodes.
Use this dashboard to:
- Determine nodes with errors resulting in failures.
- Review the node activity and pending tasks.
### Gossip
The **Cassandra - Gossip** dashboard provides details about communication between various cassandra nodes.
Use this dashboard to:
- Determine nodes with errors resulting in failures.
- Review the node activity and pending tasks.
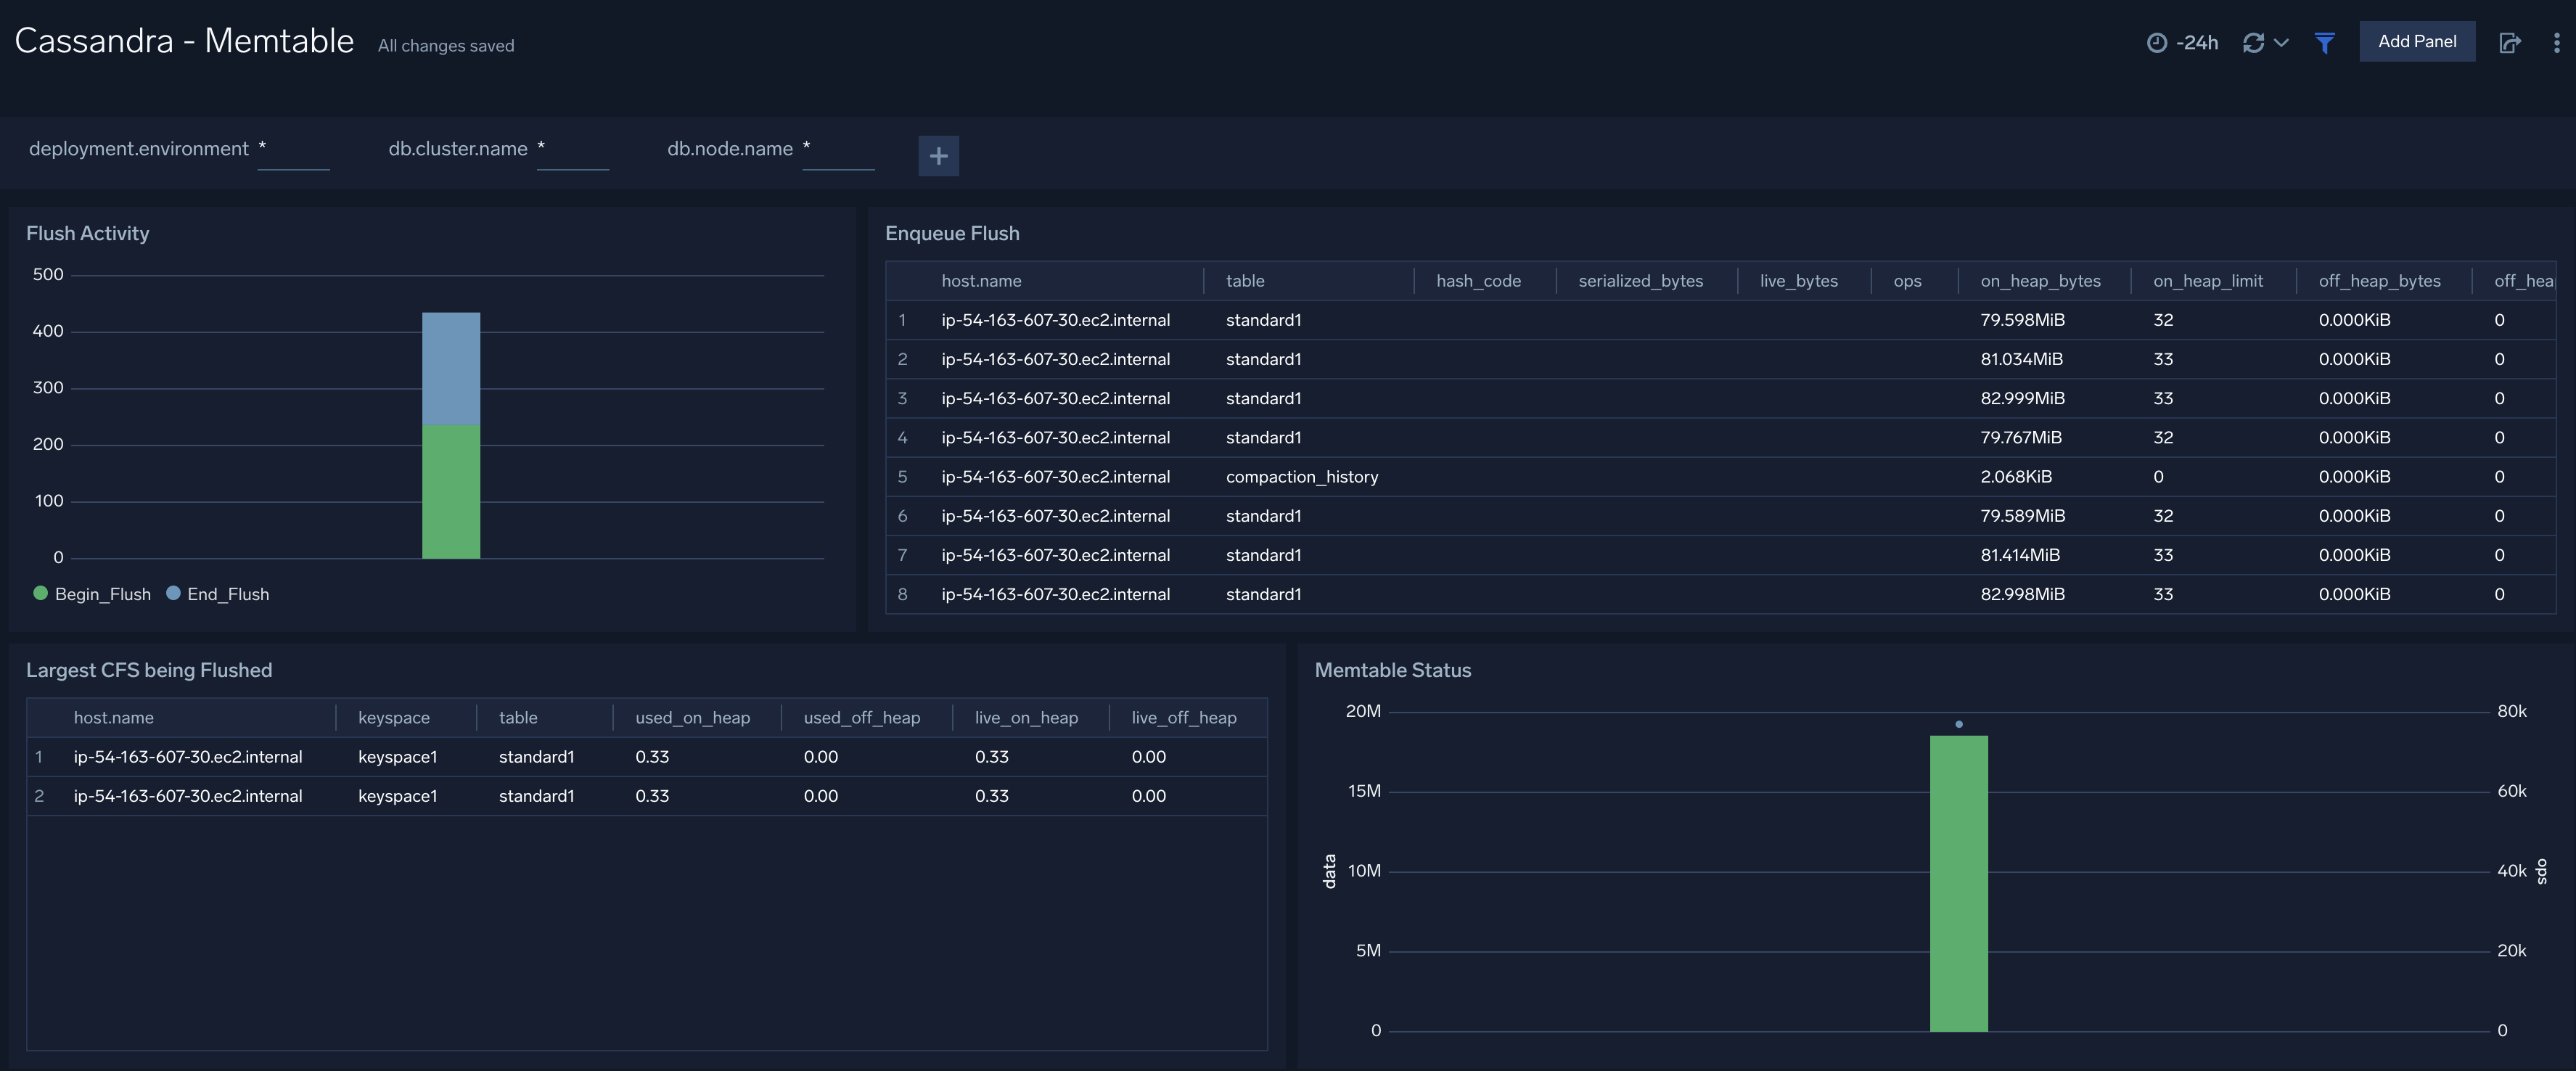
 ### Memtable
The **Cassandra - Memtable** dashboard provides insights into memtable statistics. Use this dashboard to review flush activity and memtable status.
### Memtable
The **Cassandra - Memtable** dashboard provides insights into memtable statistics. Use this dashboard to review flush activity and memtable status.
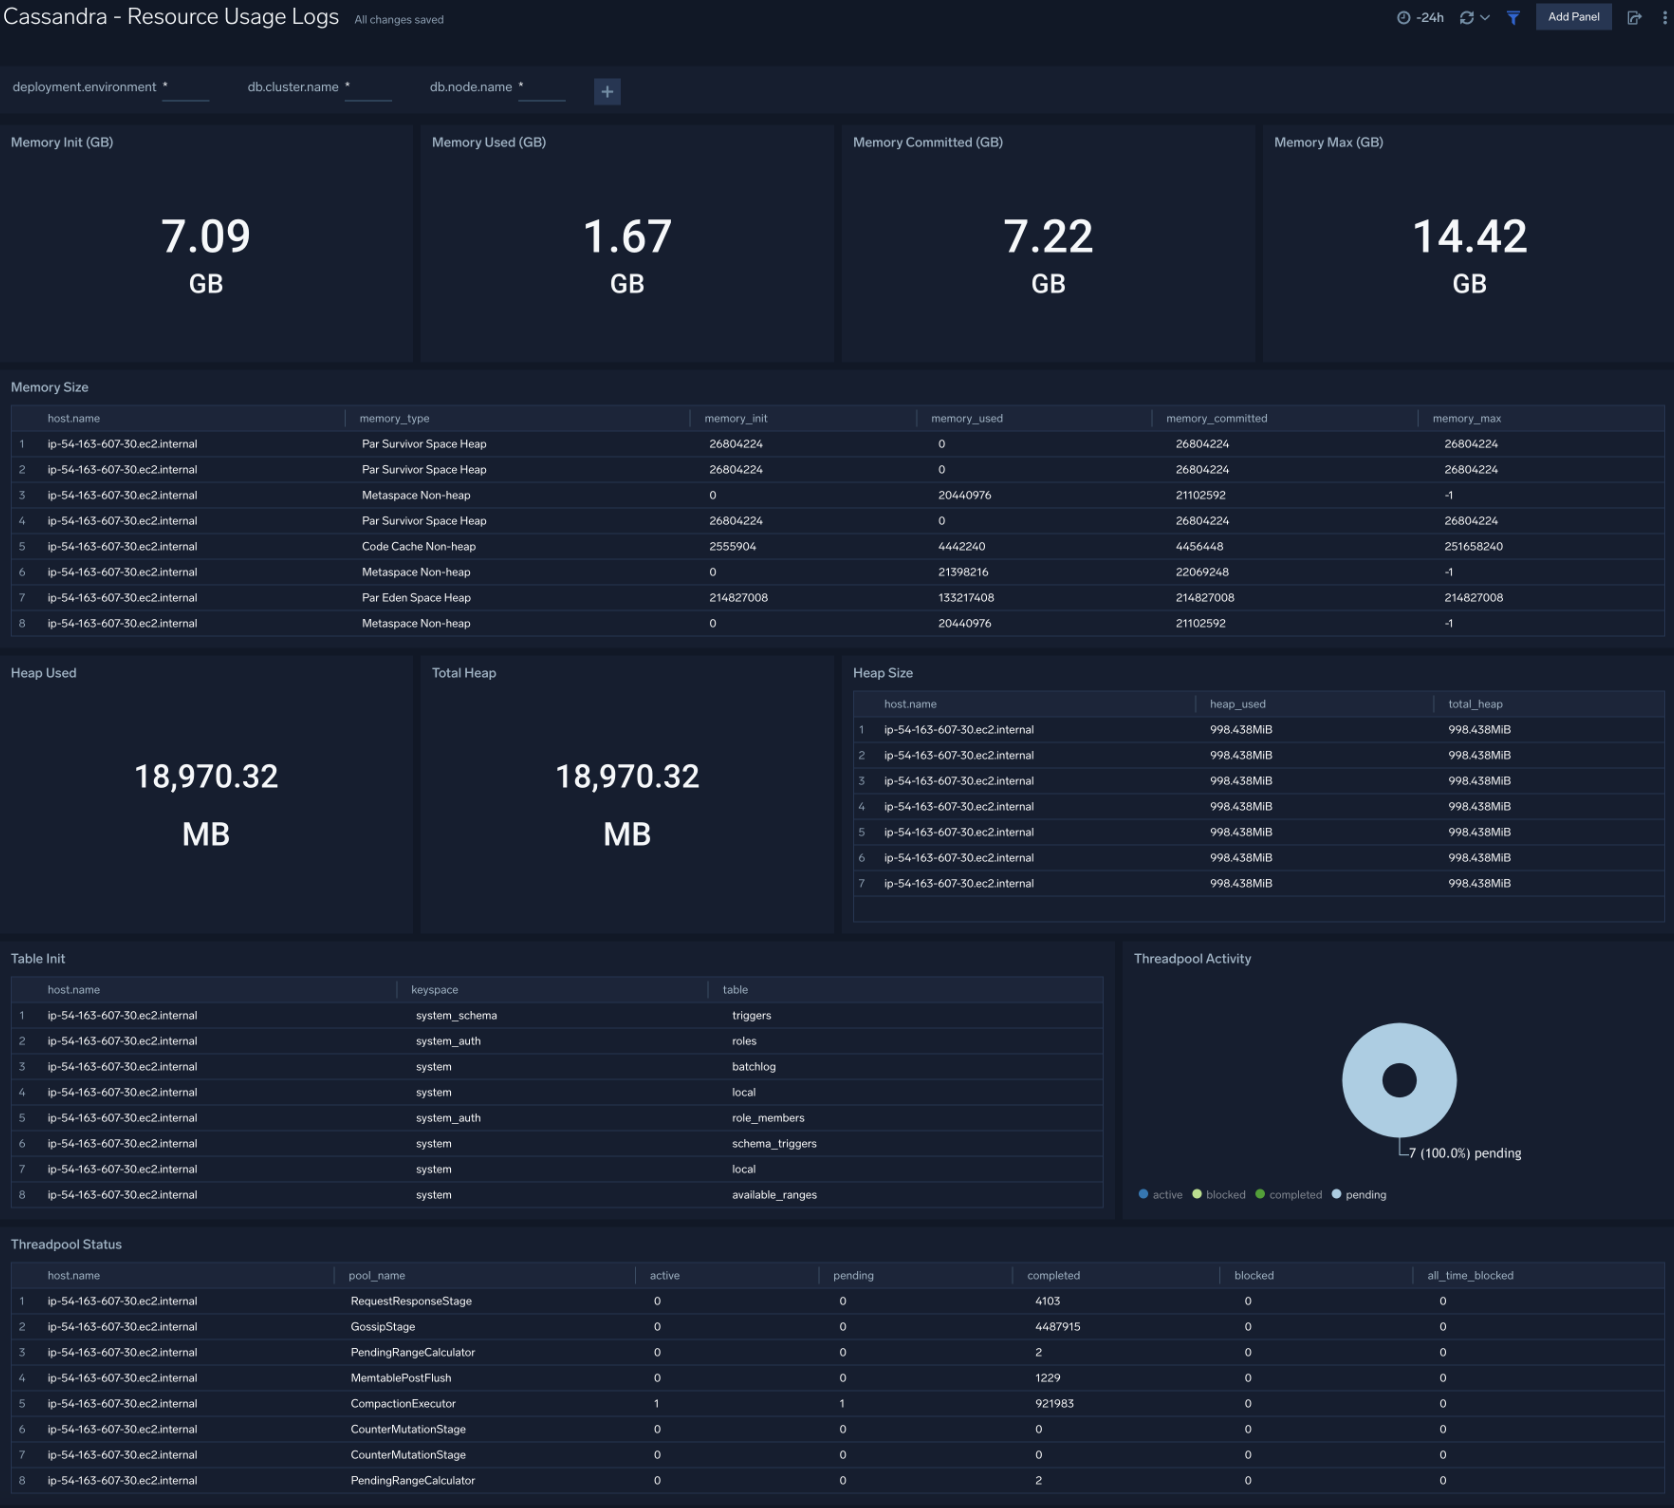
 ### Resource Usage
The **Cassandra - Resource Usage** dashboard provides details of resource utilization across Cassandra clusters. Use this dashboard to identify resource utilization. This can help you to determine whether resources are over-allocated or under-allocated.
### Resource Usage
The **Cassandra - Resource Usage** dashboard provides details of resource utilization across Cassandra clusters. Use this dashboard to identify resource utilization. This can help you to determine whether resources are over-allocated or under-allocated.
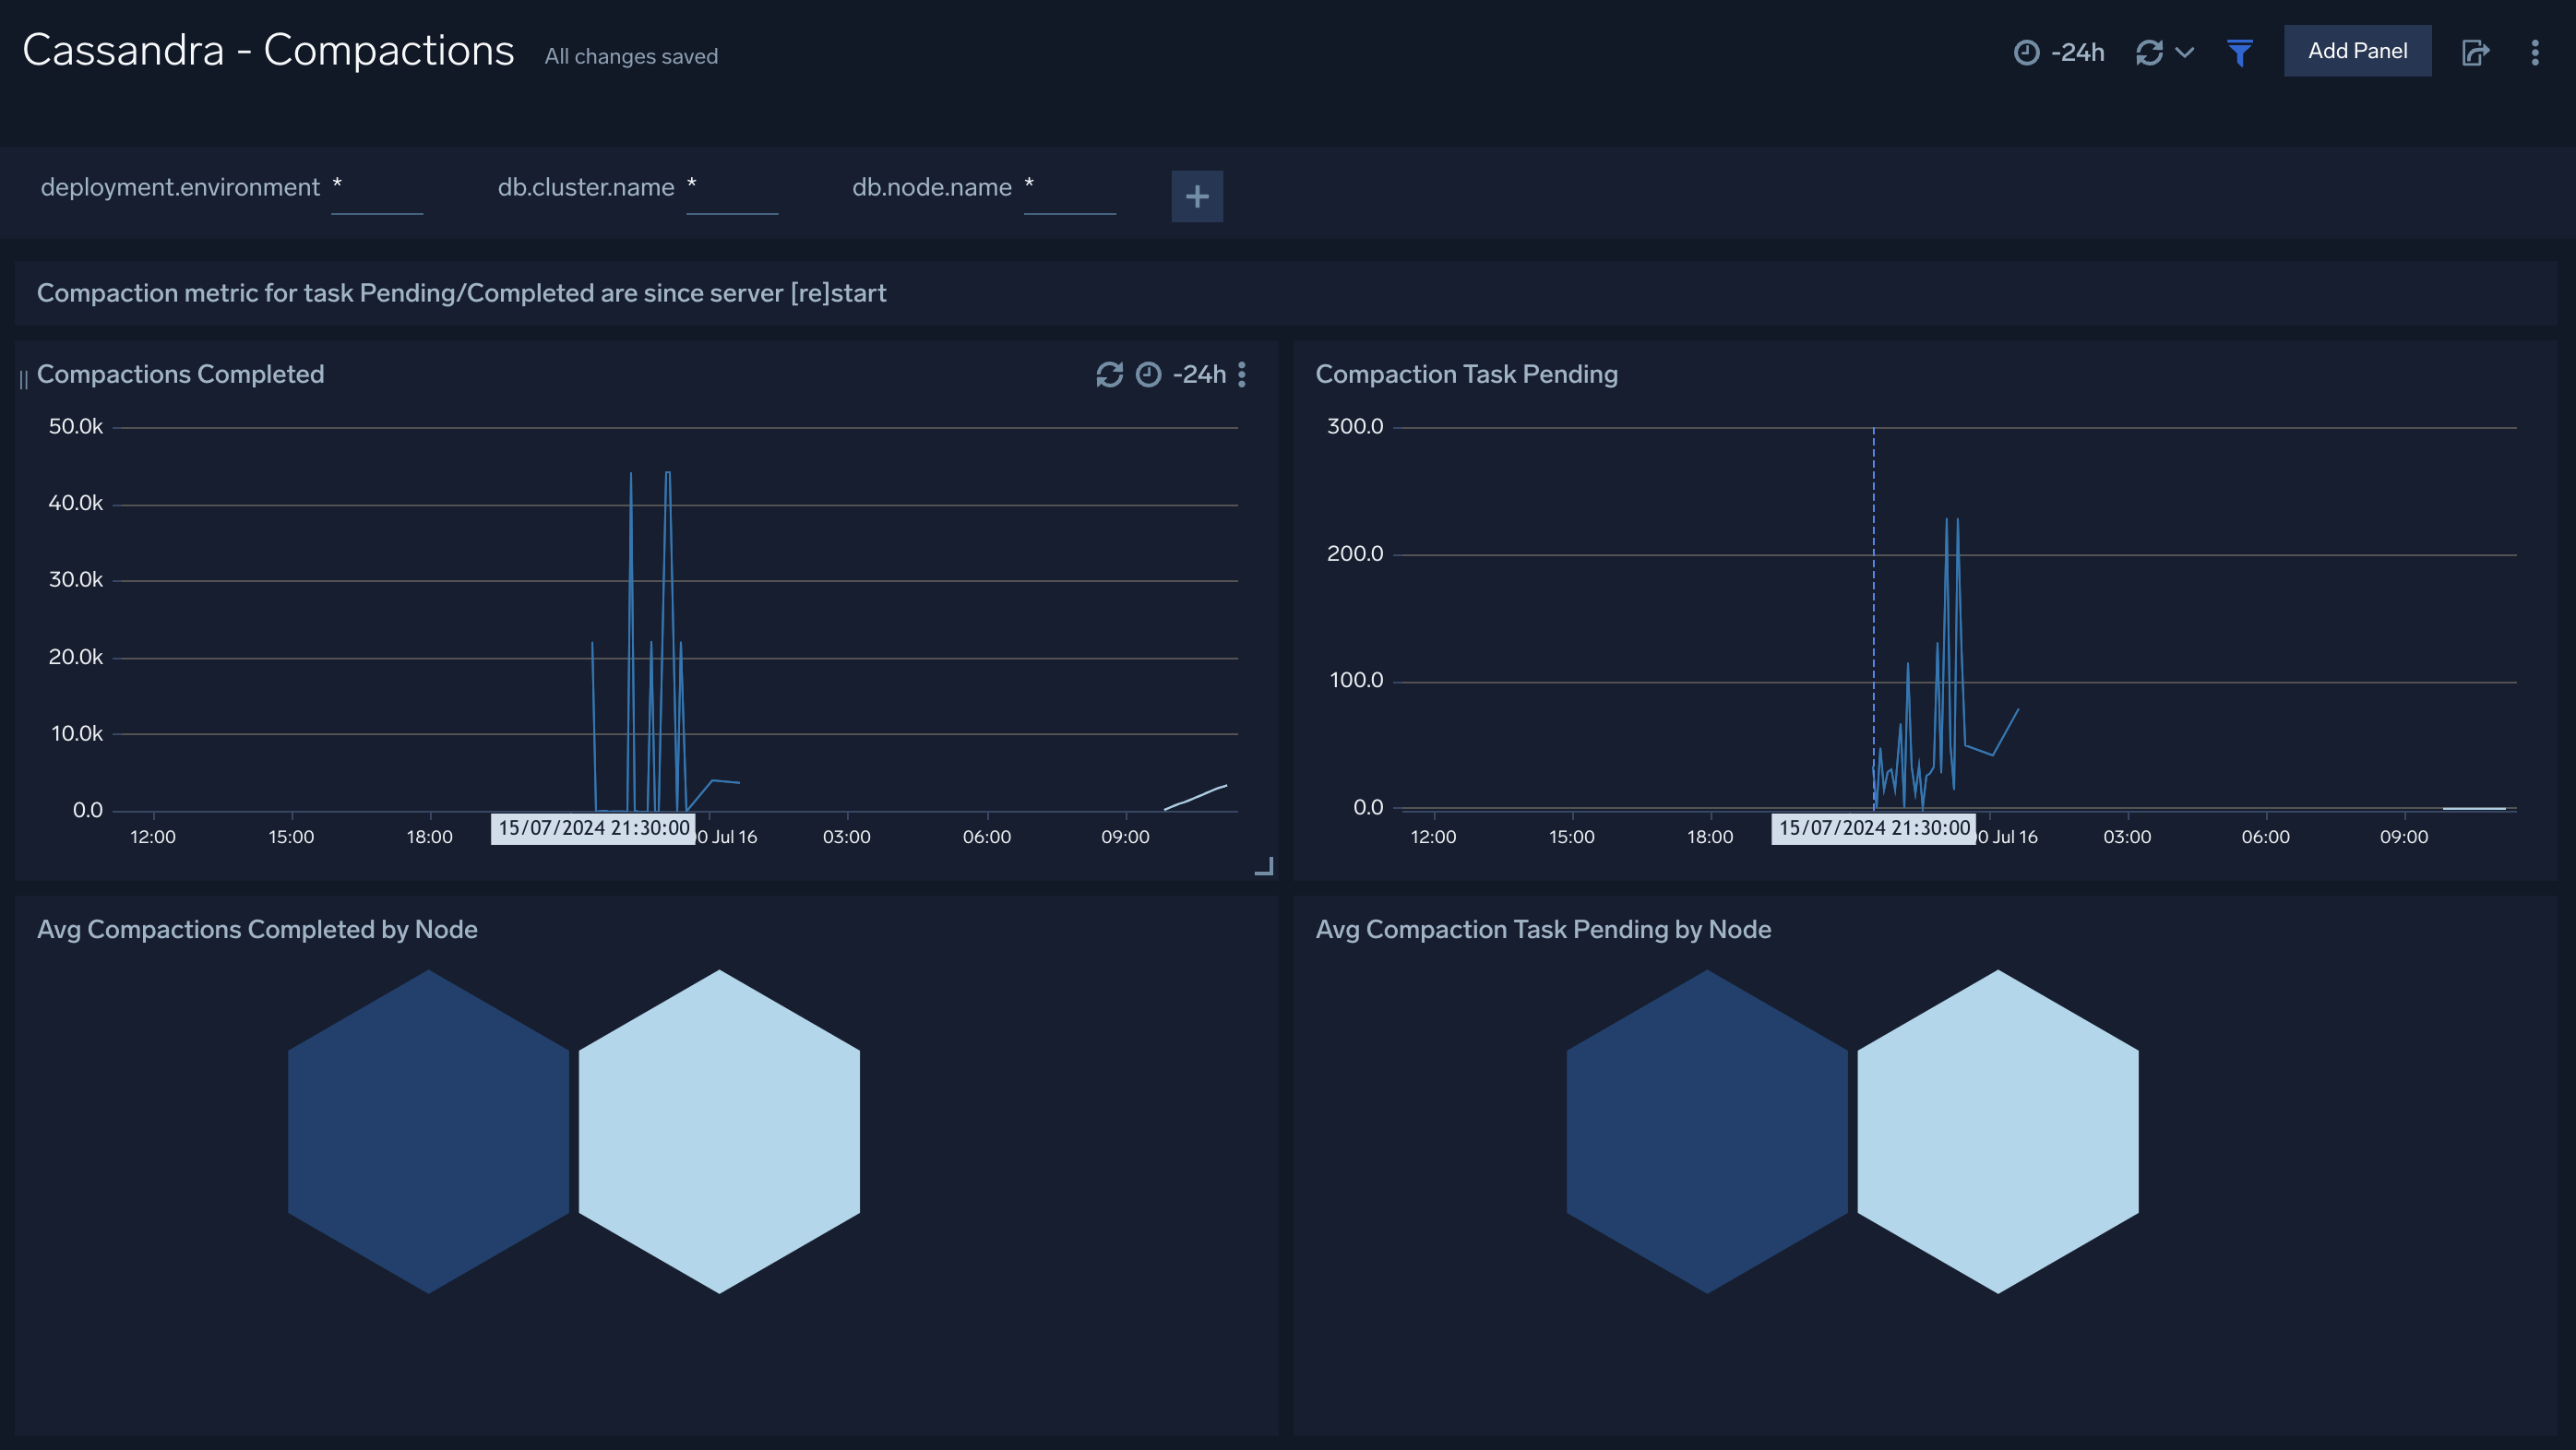
 ### Compaction
The **Cassandra - Compactions** dashboard provides insight into the completed and pending compaction tasks.
### Compaction
The **Cassandra - Compactions** dashboard provides insight into the completed and pending compaction tasks.
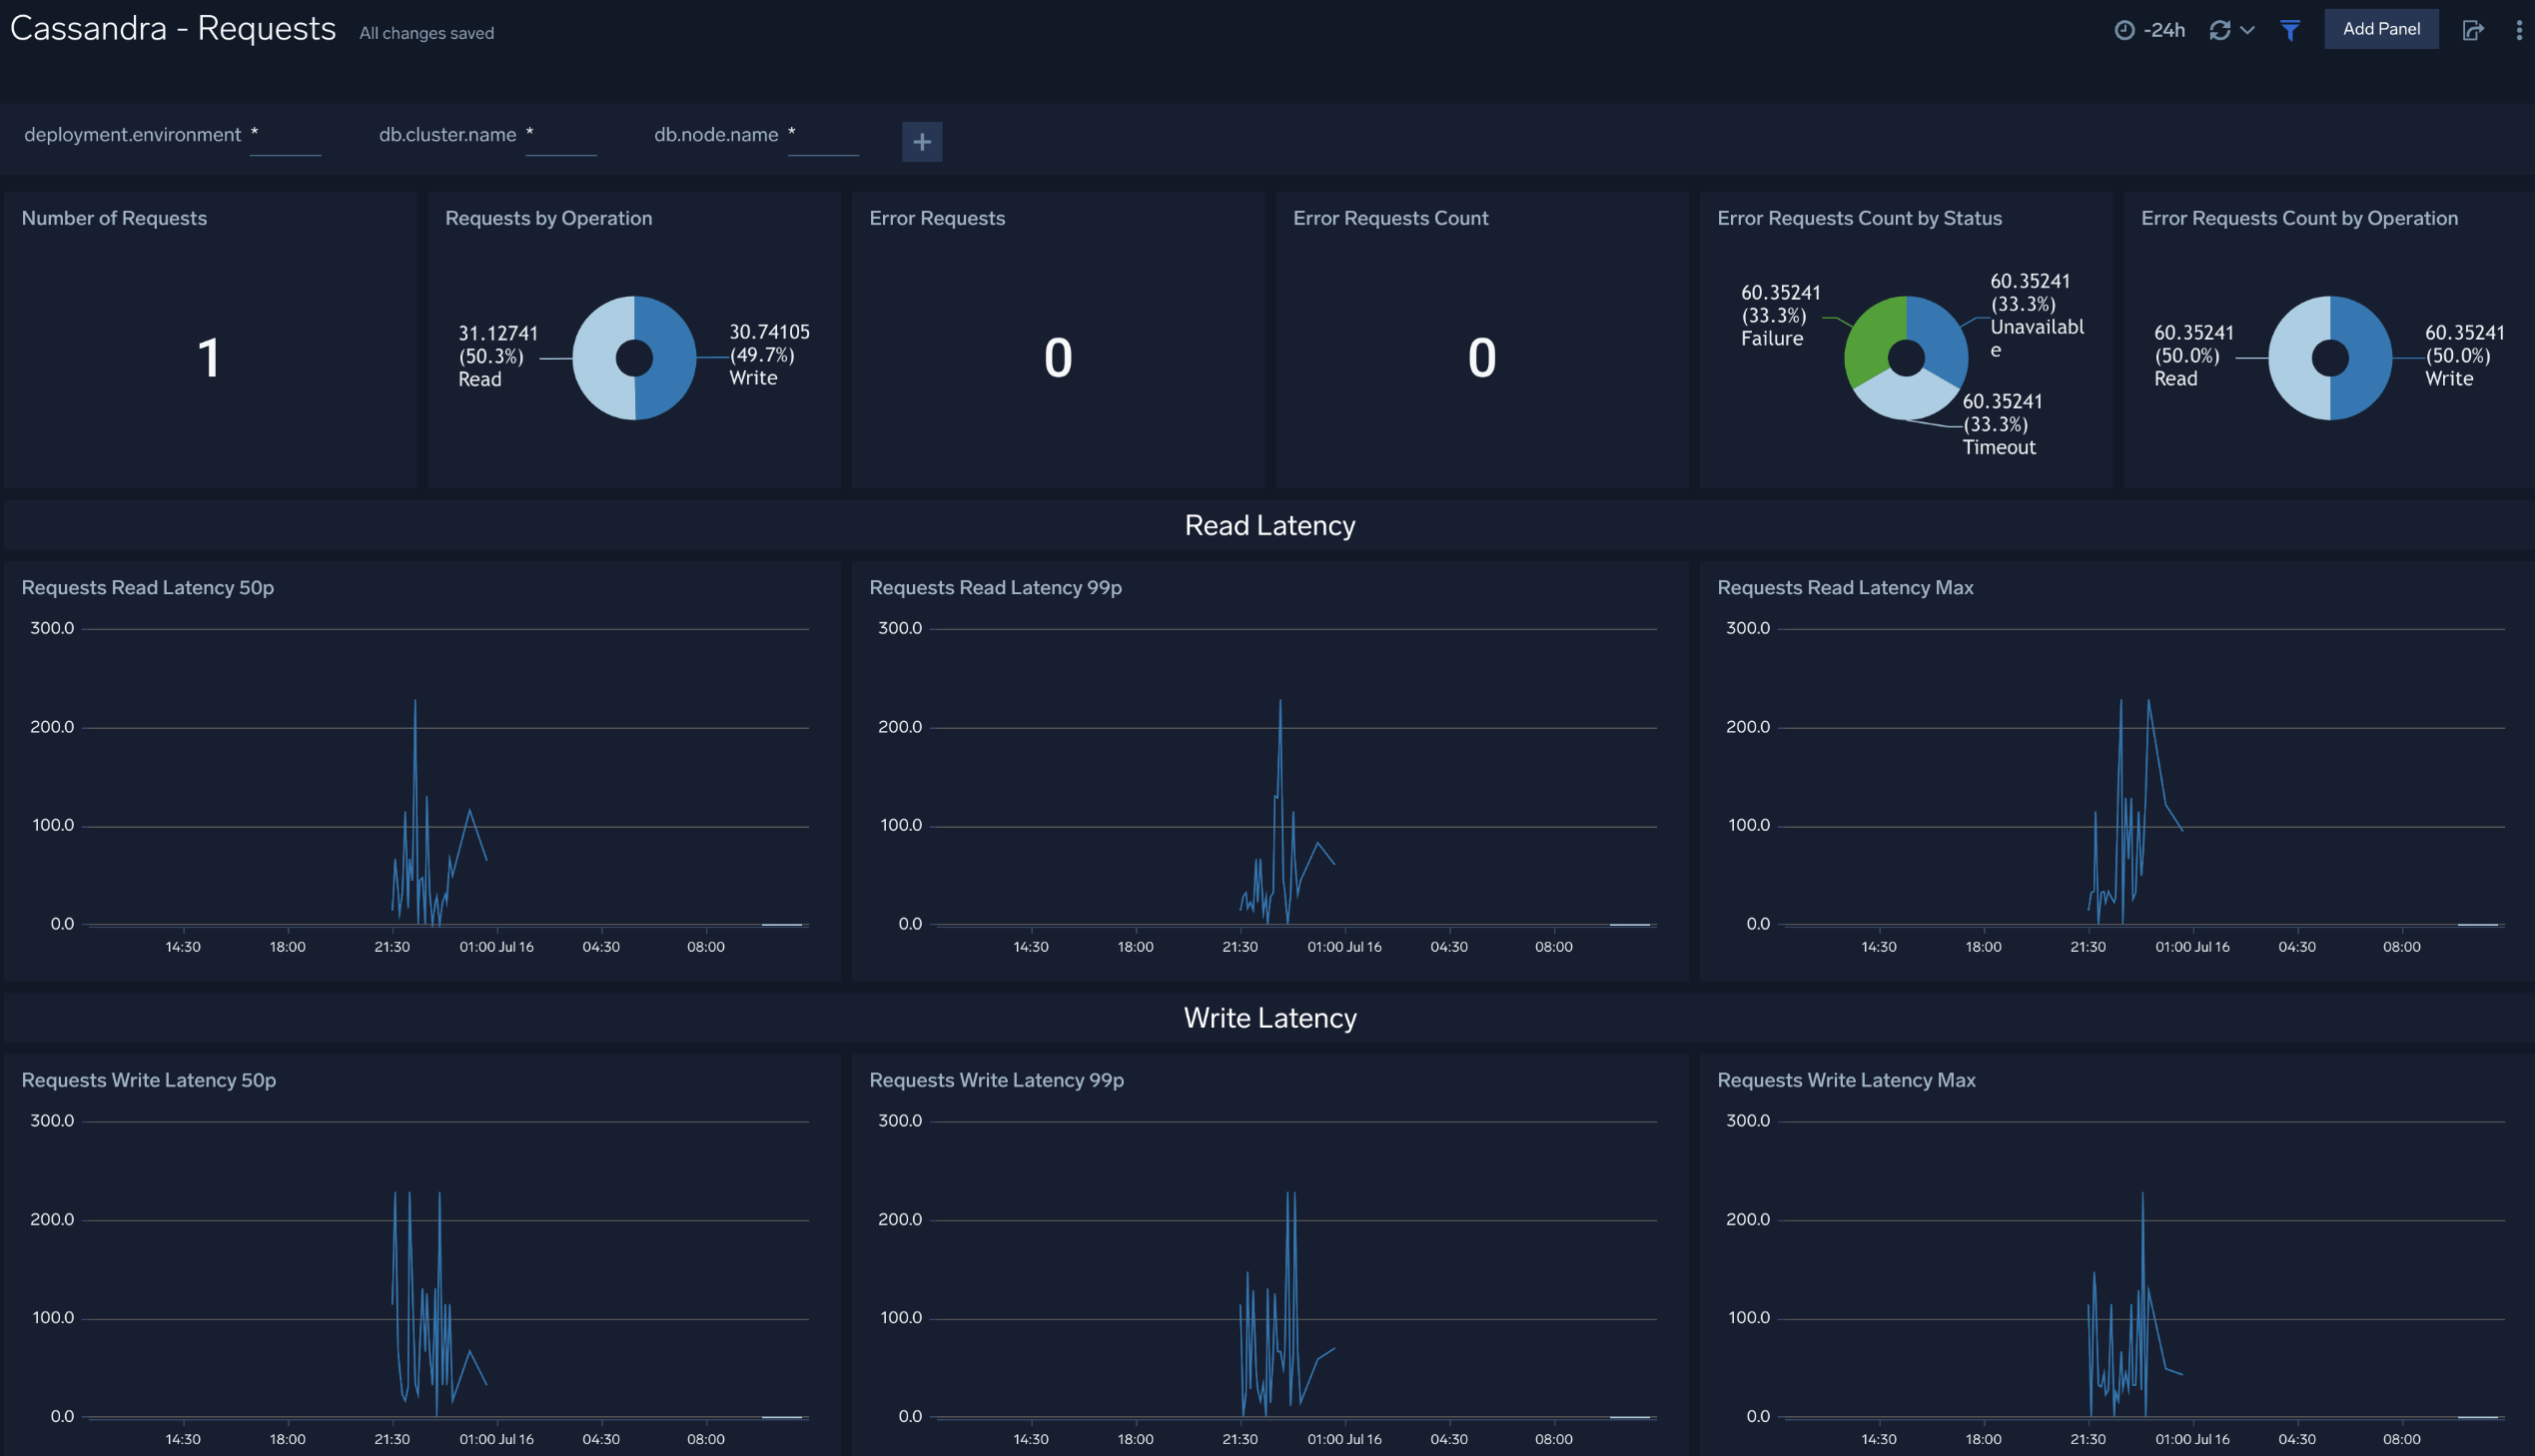
 ### Requests
The **Cassandra - Requests** dashboard provides insight into the number of request served, number of error request, and their distribution by status and operation. Also you can monitor the read and write latency of the cluster instance using this dashboard.
### Requests
The **Cassandra - Requests** dashboard provides insight into the number of request served, number of error request, and their distribution by status and operation. Also you can monitor the read and write latency of the cluster instance using this dashboard.
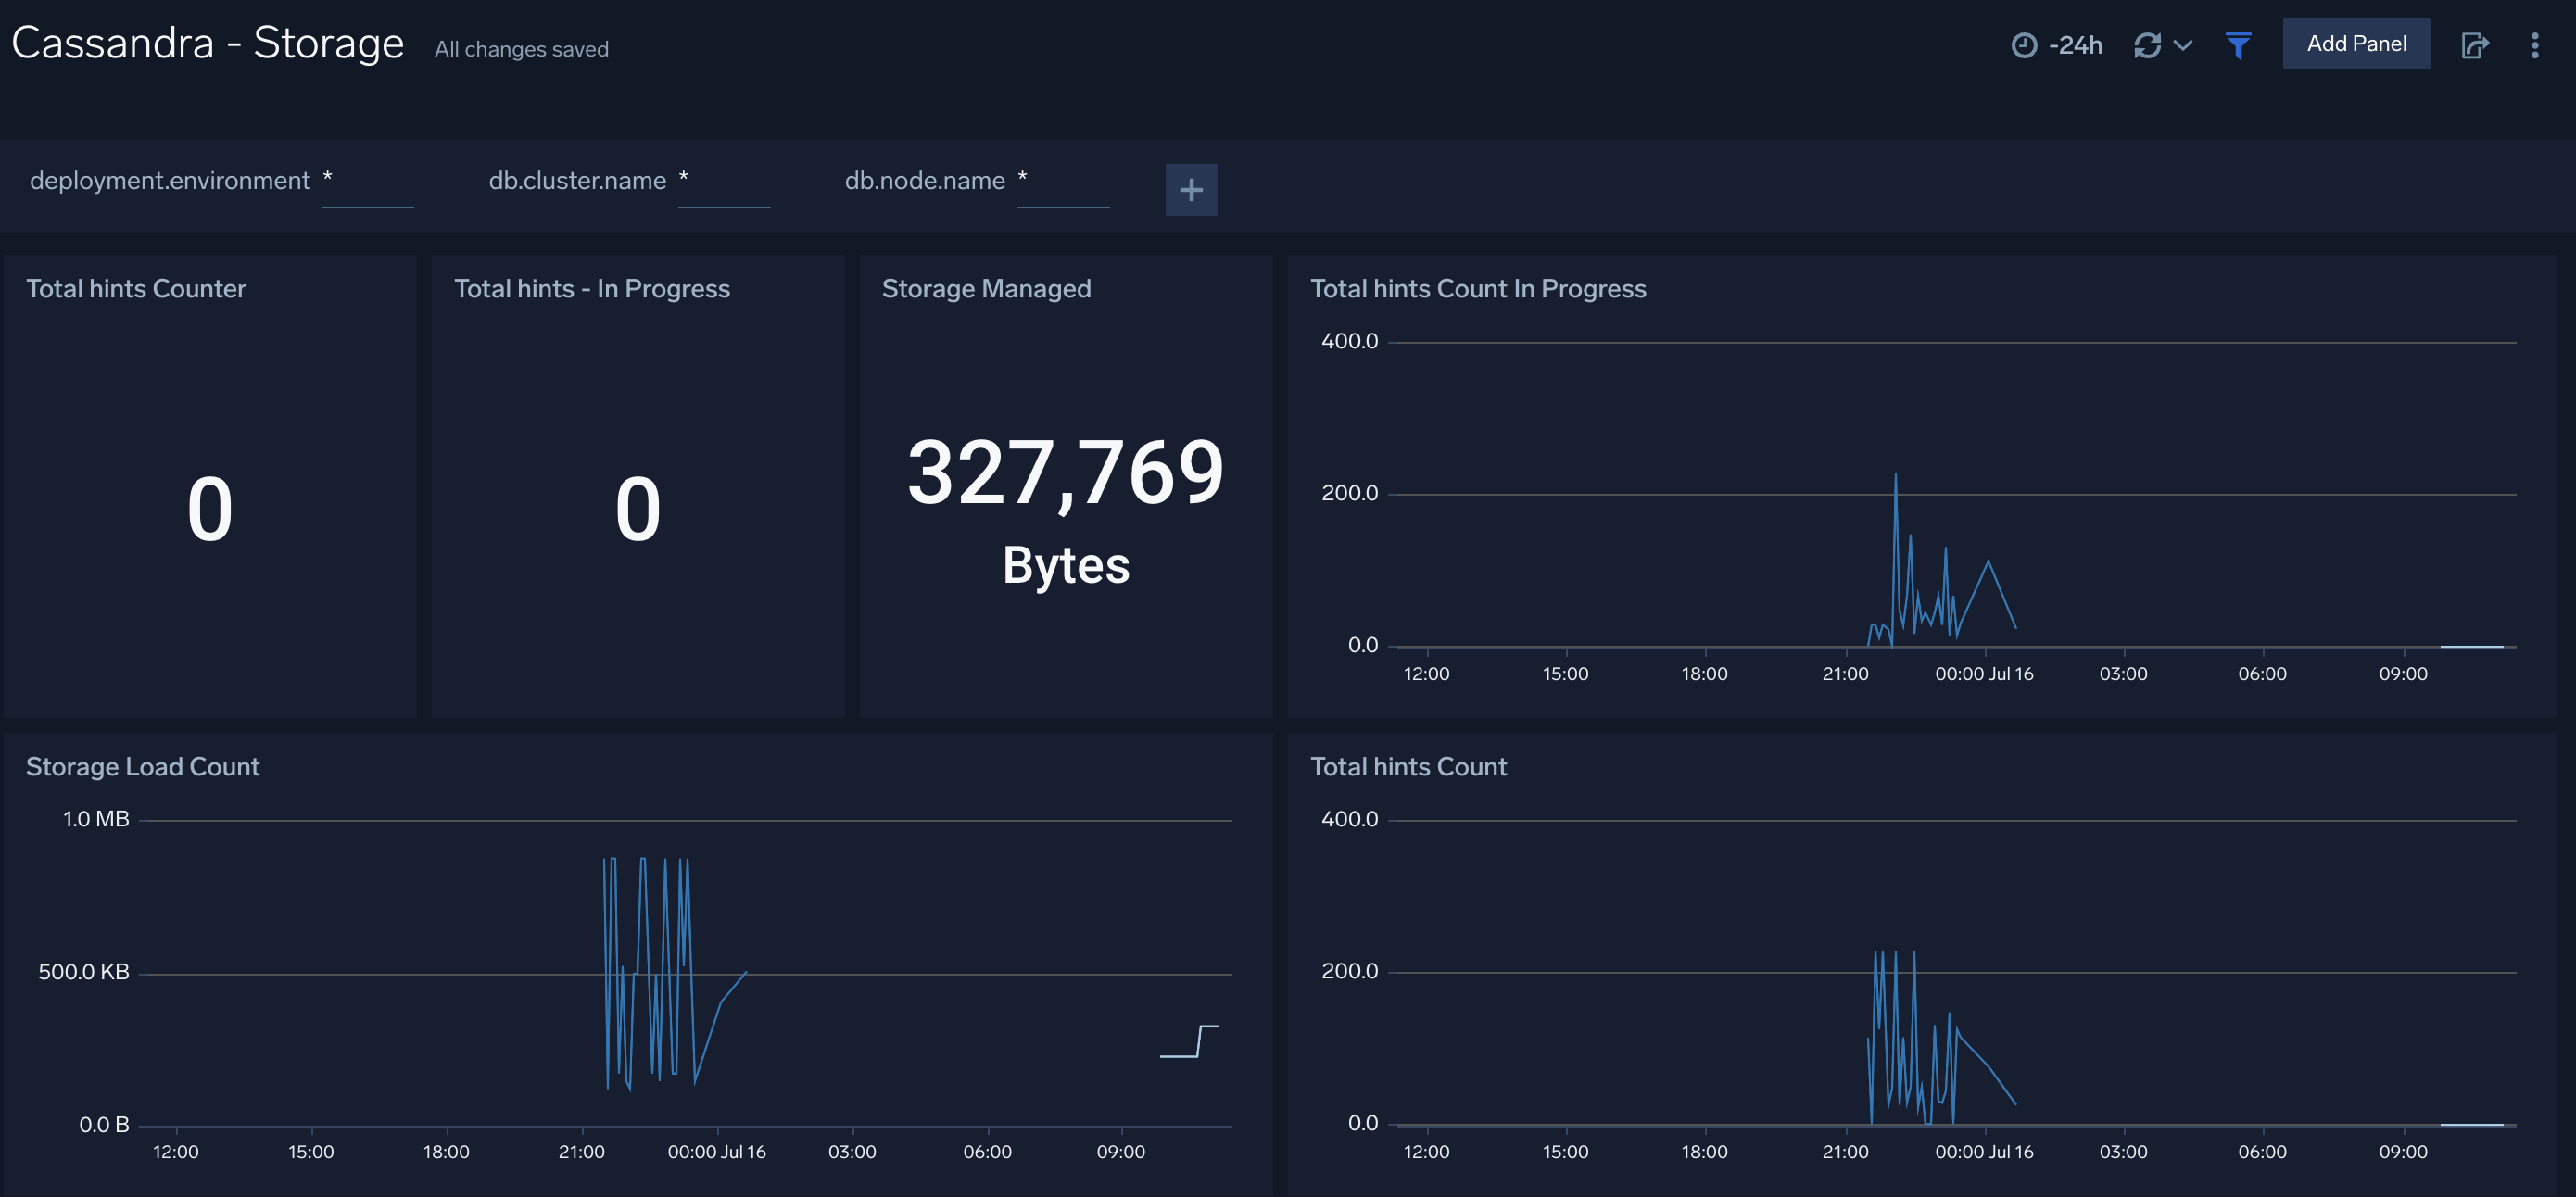
 ### Storage
The **Cassandra - Storage** dashboard provides insight into the current value of total hints of your Cassandra cluster along with storage managed by the cluster.
### Storage
The **Cassandra - Storage** dashboard provides insight into the current value of total hints of your Cassandra cluster along with storage managed by the cluster.
 ## Create monitors for Cassandra app
import CreateMonitors from '../../../reuse/apps/create-monitors.md';
### Cassandra alerts
| Name | Description | Alert Condition | Recover Condition |
|:--|:--|:--|:--|
| `Cassandra - Compaction Task Pending` | This alert is triggered when there are more than 15 pending Compaction tasks. | Count > = 15 | Count < 15 |
| `Cassandra - High Hints Backlog` | This alert is triggered when the number of in-progress hints exceeds the given value for 5 minutes. | Count > = 5000 | Count < 5000 |
| `Cassandra - High Memory Usage` | This alert is triggered when memory used exceeds 85% of committed memory for more than 10 minutes. | Count > = 1 | Count < 1 |
| `Cassandra - Node Down Alert` | This alert is triggered when a Cassandra node status changes to DOWN for more than 5 minutes. | Count > = 1 | Count < 1 |
| `Cassandra - Operation Error Rate High` | This alert is triggered when the error rate of operations exceeds given value (Default 5%) for 5 minutes. | Count > 5 | Count < = 5 |
| `Cassandra - Range Query Latency High (99th Percentile)` | This alert is triggered when the 99th percentile of range query latency exceeds the given value (Default 2 seconds) for 5 minutes. | Count > = 2000000 | Count < 2000000 |
| `Cassandra - Read Latency High (99th Percentile)` | This alert is triggered when the 99th percentile of read latency exceeds given value (Default 500ms) for 5 minutes. | Count > = 500000 | Count < 500000 |
| `Cassandra - Storage Growth Rate Abnormal` | This alert is triggered when the storage growth rate exceeds given value (Default 25MB/minute) for 5 minutes. | Count > = 26214400 | Count < 26214400 |
| `Cassandra - Write Latency High (99th Percentile)` | This alert is triggered when the 99th percentile of write latency exceeds given value (Default 200ms) for 5 minutes. | Count > = 200000 | Count < 200000 |
## Create monitors for Cassandra app
import CreateMonitors from '../../../reuse/apps/create-monitors.md';
### Cassandra alerts
| Name | Description | Alert Condition | Recover Condition |
|:--|:--|:--|:--|
| `Cassandra - Compaction Task Pending` | This alert is triggered when there are more than 15 pending Compaction tasks. | Count > = 15 | Count < 15 |
| `Cassandra - High Hints Backlog` | This alert is triggered when the number of in-progress hints exceeds the given value for 5 minutes. | Count > = 5000 | Count < 5000 |
| `Cassandra - High Memory Usage` | This alert is triggered when memory used exceeds 85% of committed memory for more than 10 minutes. | Count > = 1 | Count < 1 |
| `Cassandra - Node Down Alert` | This alert is triggered when a Cassandra node status changes to DOWN for more than 5 minutes. | Count > = 1 | Count < 1 |
| `Cassandra - Operation Error Rate High` | This alert is triggered when the error rate of operations exceeds given value (Default 5%) for 5 minutes. | Count > 5 | Count < = 5 |
| `Cassandra - Range Query Latency High (99th Percentile)` | This alert is triggered when the 99th percentile of range query latency exceeds the given value (Default 2 seconds) for 5 minutes. | Count > = 2000000 | Count < 2000000 |
| `Cassandra - Read Latency High (99th Percentile)` | This alert is triggered when the 99th percentile of read latency exceeds given value (Default 500ms) for 5 minutes. | Count > = 500000 | Count < 500000 |
| `Cassandra - Storage Growth Rate Abnormal` | This alert is triggered when the storage growth rate exceeds given value (Default 25MB/minute) for 5 minutes. | Count > = 26214400 | Count < 26214400 |
| `Cassandra - Write Latency High (99th Percentile)` | This alert is triggered when the 99th percentile of write latency exceeds given value (Default 200ms) for 5 minutes. | Count > = 200000 | Count < 200000 |